

CryptoZeno
6.5k Posts

CryptoZeno
Report
Block User
On Chain Research and Market Insights with Smart Trading Signals

Q Holder
Frequent Trader
5.5 Years
31 Following
9.7K+ Followers
36.8K+ Liked
Posts
All
Quotes
Videos
PINNED
·
--
See translation
CRYPTOZENO IS NOMINATED FOR THE BLOCKCHAIN 100 AWARDS 2026 🏆
Vote for CryptoZeno for the Blockchain 100 Awards! [Vote now](https://app.binance.com/uni-qr/cact26user/516)
I'm excited to share that I've been nominated for the Rising Star category at The Blockchain 100 Awards 2026 on Binance Square!
Over the years, I've dedicated my time to sharing on chain research, market analysis, and trading insights with the crypto community. This nomination is a meaningful milestone in my journey as a content creator.
Your support would mean a lot to me. If you've ever found value in my research, analysis, or market updates, I'd truly appreciate your vote.
Voting is simple! Just visit my Binance Square profile, where you'll find the Blockchain 100 Awards voting section right below my profile information. You can cast your vote for me directly there.
Every vote counts, and I'm grateful to everyone who has supported CryptoZeno along the way. Let's make this milestone happen together! ❤️ [Vote now](https://app.binance.com/uni-qr/cact26user/516)
#Blockchain100 #BinanceSquare #CryptoZeno
CRYPTOZENO IS NOMINATED FOR THE BLOCKCHAIN 100 AWARDS 2026 🏆
Vote for CryptoZeno for the Blockchain 100 Awards! Vote now
I'm excited to share that I've been nominated for the Rising Star category at The Blockchain 100 Awards 2026 on Binance Square!
Over the years, I've dedicated my time to sharing on chain research, market analysis, and trading insights with the crypto community. This nomination is a meaningful milestone in my journey as a content creator.
Your support would mean a lot to me. If you've ever found value in my research, analysis, or market updates, I'd truly appreciate your vote.
Voting is simple! Just visit my Binance Square profile, where you'll find the Blockchain 100 Awards voting section right below my profile information. You can cast your vote for me directly there.
Every vote counts, and I'm grateful to everyone who has supported CryptoZeno along the way. Let's make this milestone happen together! ❤️ Vote now
#Blockchain100 #BinanceSquare #CryptoZeno

29
32
7.9k
PINNED
·
--
Article
See translation
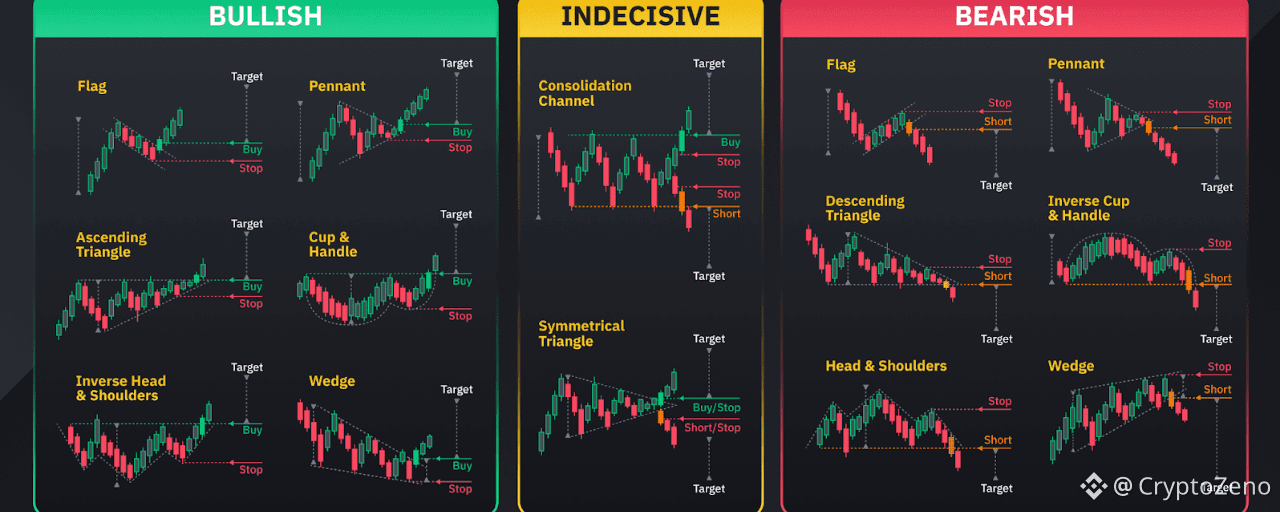
The Breakout Trading Strategy I Use to Catch Big MovesI’ve longed resistance and shorted support for 9 years… This is the exact opposite of what every trader tries to do.
In this article, I will share my entire strategy so you can skip years of testing and losses.
This is something you will want to bookmark, take notes on, and set time aside to think about.
Lesson 1: The Only 2 Trading Strategies
Before you can identify good momentum setups, you need to understand what momentum trading actually is.
Momentum and mean reversion are opposite strategies based on opposite assumptions.
The Two Trading Styles
Momentum (where you take a trade betting on a continuation of the current trend)Mean Reversion (where you take a trade betting on a reversal of the current trend)
One assumes strength continues; the other assumes strength exhausts.
Let’s consider this through a visual example.
Suppose price is approaching a resistance level (in other words, a level where there was previously selling pressure, preventing the price from moving higher).
Momentum assumes the level will break.
You’re betting on continuation.Price approaches resistance, you buy, expecting it to push through and keep running.The level becomes support once broken.
Mean reversion assumes the level will hold.
You’re betting on rejection.Price approaches resistance, you short, expecting it to bounce back down.The level acts as a ceiling.
Same chart. Same resistance level. Opposite strategies.
There is no right or wrong. The key is to understand when you are in a momentum trade environment, such that momentum strategies are highly aligned.
The next section shows you exactly how to identify when the environment favours momentum (my best strategy).
Lesson 1 Summary
There are 2 trading styles: momentum and mean reversionMean reversion bets levels will hold; momentum bets levels will breakOne is not better than the other; it depends entirely on the trade environment
Lesson 2: Optimal Trade Environment
Just opening a long every time price hits resistance won't make us any money.
Without the right conditions, momentum dies immediately after the breakout.
You enter. It reverses. You're stopped out.
That's not bad luck, that's a bad trading environment.
The Rowing Analogy
Imagine you’re rowing a boat.
You either row against or with the current.
One makes it easier to row while the other takes a lot more effort.
Your boat, or rowing technique, didn’t change… Only your environment did.
Trading is the same.
Your strategy is your boat.
Your optimal trade environment is the current.
Now use this 3-filter checklist to ensure you only take trades where a breakout is likely (with the current).
Filter 1: How Did Price Approach the Level?
What you WANT:
A slow, grinding staircase pattern approaching resistance.Each candle makes incremental progress.Higher lows are stacking up.Controlled, deliberate movement.
What you DON’T want:
A fast vertical spike into resistance.Price shoots up in one or two large candles.After a spike, buyers' strength is depleted and price typically consolidates or reverses.This is exhaustion, not momentum.
The staircase pattern shows sustained buying pressure building gradually. When this breaks through resistance, buyers are still engaged and ready to push further.
Common mistake: Traders see a strong candle break resistance and assume momentum is strong. But these fast moves often reverse quickly.
→ Do this instead: Take momentum trades when price approaches resistance in a slow, grinding staircase over multiple candles.
Real Trade Example:
Slow clear grind into resistance showing an optimal ‘price approach to level’ for momentum.
Filter 1: slow grindy staircase ✅
Filter 2: What Did Volume Look Like?
Volume confirms whether the price movement has conviction behind it.
What you WANT:
Gradual increase in volume as price approaches resistanceThis pattern shows controlled, sustainable momentum.
What you DON’T want:
Flat volume (no conviction) or sudden volume spikes (exhaustion).Flat volume means the move lacks participation.Volume spikes often mark climax points where momentum exhausts.Decreasing volume (why would price break out of resistance now, if volume was lower than before?)
Volume should mirror the price pattern, steady and building, not erratic.
This strategy works because momentum continuation is most likely when participation is sustained, supply is absorbed gradually, and structure remains intact.
Real Trade Example:
Around the time the grindy staircase begins to emerge, we see a slow, consistent increase in volume.
Filter 1: slow grindy staircase ✅Filter 2: clearly increasing volume ✅
Lastly,
Filter 3: Moving Average Crossovers
This filter distinguishes trending markets (good for momentum) from choppy, indecisive markets (bad for momentum).
What you WANT to see: Moving averages with minimal crossovers. This indicates a directional trend.
What you DON’T want to see: Frequent crossovers. This signals chop and indecision.
Fewer crossovers = cleaner trend or range = better momentum continuation.
Use the 30SMMA (Smoothed Moving Average).
✍️Quick Actionable Step:
To add the 30SMMA on your charts:
Search for the Smoothed Moving Average Indicator in TradingViewAdd it to your chartGo into settings and change the "Length" to "30"
Real Trade Example:
Filter 1 (Price Action): slow grindy staircase ✅
Filter 2 (Volume): clearly increasing volume ✅
Filter 3 (Crossovers): minimal MA crossovers ✅
🎓Lesson 2 Summary
Slow grinding staircase approaches have better follow-through than fast spikesVolume should be gradual (increasing or decreasing), not flat or spikingFewer MA crossovers indicate cleaner directional conditions for momentum
Lesson 3: Identifying Setups
Now you know what momentum is.
You also know the optimal conditions for it.
Next, you need to know where to execute these trades.
Step 1: Draw Support and Resistance Levels
Momentum trades happen at these key levels. You need to identify them consistently.
I've already written an in-depth masterclass on how to set these levels. I'll link it at the end of this article.
Common mistake: Traders draw levels randomly or inconsistently, leading to missed setups or false signals.
Do this instead: Use my step-by-step approach at the end of this article.
Step 2: Await Your Entry Trigger on the 1-Minute Chart
Once you’ve identified a resistance level on your primary timeframe, switch to the 1-minute chart for precise entry timing.
Why 1-minute chart?
You learn faster.
More trades, more chart exposure and more oppurtunities to practice psychology.
I’ve added a bonus guide on why you should be trading the 1-minute chart at the end of this article.
Real Trade Example:
Step 3: Three Filters
Before entering, check the three filters from Section 2:
Is price approaching resistance in a slow staircase pattern?Is volume gradually increasing or decreasing (not flat or spiking)?Are there minimal MA crossovers (not choppy)?
If any filter fails, reduce your risk on the trade. Only take full risk on A-grade setups, not forcing trades in poor conditions.
🎓Lesson 3 Summary
Draw levels using the ZCT masterclass approach at the end of this articleUse your entry trigger on the 1-minute timeframe: 2 candle closes above for confirmationCheck all three filters before entering, allocate risk and size accordingly
Lesson 4: Strategy Logic: Stop Loss, and Take Profit
You've drawn your levels. You've confirmed the setup aligns with optimal momentum conditions.
Now you need precise execution.
Entry timing, stop placement, and profit targets determine whether you capture the momentum move or get stopped out on a good setup.
This is where most traders lose, not in analysis, but in execution.
Step 4: Entry Trigger
We have established to wait for two consecutive 1-minute candles to close fully above the resistance level. This confirms the level broke and momentum is continuing.
Critical execution detail: After the second candle closes above resistance, place a limit order AT the resistance level (now acting as support), not above it. Price often pulls back slightly after breaking out. Your limit order gets filled on the pullback without chasing.
Common mistake: Traders wait for confirmation, then market-buy above resistance as price runs away. They enter late with a wider stop and worse risk/reward.
→ Do this instead: Preset your limit order AT resistance after the second candle closes. Let price come back to you.
Real Trade Example:
Step 5: Stop Loss
A swing low is:
the lowest wick in a pullback.
Your stop loss goes at the most recent swing low before the breakout.
Common mistake: Traders place stops at the nearest swing low, even if it’s only 0.3% away, leading to frequent stop-outs from normal volatility
Do this instead: Always measure the distance of your stop loss using the ruler tool on TradingView. If it’s less than 1%, use the next swing low down.
Step 6: Take Profit 1R (Equal Distance to Stop)
Your take profit target is 1R, the same distance as your stop loss, but in the profit direction
If your stop loss is 1.982% away from entry, your target is also 1.982% away, but on the upside. This gives you a 1:1 risk/reward ratio.
Why 1R? It’s conservative and achievable. Momentum trades often hit 1R quickly because the breakout has follow-through. You’re not trying to catch the entire move, you’re taking a high-probability piece of it.
Over time, as you get data in your journal, you can start extending your profit targets when you see how far your average winning trades go beyond 1R. This way, you’re not guessing where to take profits, but following a systematic approach.
Real Trade Example:
🎓Lesson 4 summary
Enter after two 1-minute candle closes above resistance, using a limit order at prior resistance (now support) to avoid chasing price.Place stop losses at the most recent valid swing low, ensuring enough distance to avoid normal volatility and minor stop hunts.Set initial profit targets at 1R to capture high-probability momentum continuation in a repeatable, systematic way.
Immediate Next Steps✍️:
Read the Support and Resistance Masterclass to learn how to draw levels (shared at end of article)Look at 3 charts using the 3 filter checklist to identify a momentum trade environmentUse the strategy steps to enter your tradeGather 30 trades using this method, journalled and reviewed against the criteria
🎓 Final Summary
Lesson 1: Momentum vs Mean Reversion
Momentum trades bet that price will continue through a level, while mean reversion trades bet that a level will hold and reject price.Both strategies are valid, but performance depends entirely on matching the strategy to the correct trade environment.
Understanding this distinction prevents applying breakout logic in conditions where it has no edge.
Lesson 2: Optimal Trade Environment
High-quality breakouts form when price approaches resistance in a slow, grinding staircase rather than fast vertical spikes.Volume should build gradually to confirm sustained participation, not remain flat or spike from exhaustion.Minimal moving average crossovers indicate cleaner directional conditions where momentum continuation is more likely.
Lesson 3: Identifying Setups
Momentum trades should be executed at consistently drawn support and resistance levels.Entries are triggered on the 1-minute chart using two consecutive candle closes above resistance for confirmation.All three environment filters must align before taking full risk; weaker conditions require reduced sizing or passing the trade.
Lesson 4: Stop Loss and Take Profit
Enter using a limit order at prior resistance (now support) after two confirmed 1-minute candle closes to avoid chasing price.Stop losses should be placed at the most recent valid swing low with enough distance to avoid normal volatility and minor stop hunts.Initial profit targets are set at 1R to capture high-probability momentum continuation in a repeatable way.
🎓What Changes From Here
The next time price approaches resistance, you won’t have to guess if it will break out.
You’ll know when a breakout has real momentum, when volume confirms it, and when conditions support follow-through.
You’ll also execute with defined entries, stops, and targets.
#CryptoZeno #tradingStrategy
The Breakout Trading Strategy I Use to Catch Big Moves
I’ve longed resistance and shorted support for 9 years… This is the exact opposite of what every trader tries to do.
In this article, I will share my entire strategy so you can skip years of testing and losses.
This is something you will want to bookmark, take notes on, and set time aside to think about.
Lesson 1: The Only 2 Trading Strategies
Before you can identify good momentum setups, you need to understand what momentum trading actually is.
Momentum and mean reversion are opposite strategies based on opposite assumptions.
The Two Trading Styles
Momentum (where you take a trade betting on a continuation of the current trend)Mean Reversion (where you take a trade betting on a reversal of the current trend)
One assumes strength continues; the other assumes strength exhausts.
Let’s consider this through a visual example.
Suppose price is approaching a resistance level (in other words, a level where there was previously selling pressure, preventing the price from moving higher).
Momentum assumes the level will break.
You’re betting on continuation.Price approaches resistance, you buy, expecting it to push through and keep running.The level becomes support once broken.
Mean reversion assumes the level will hold.
You’re betting on rejection.Price approaches resistance, you short, expecting it to bounce back down.The level acts as a ceiling.
Same chart. Same resistance level. Opposite strategies.
There is no right or wrong. The key is to understand when you are in a momentum trade environment, such that momentum strategies are highly aligned.
The next section shows you exactly how to identify when the environment favours momentum (my best strategy).
Lesson 1 Summary
There are 2 trading styles: momentum and mean reversionMean reversion bets levels will hold; momentum bets levels will breakOne is not better than the other; it depends entirely on the trade environment
Lesson 2: Optimal Trade Environment
Just opening a long every time price hits resistance won't make us any money.
Without the right conditions, momentum dies immediately after the breakout.
You enter. It reverses. You're stopped out.
That's not bad luck, that's a bad trading environment.
The Rowing Analogy
Imagine you’re rowing a boat.
You either row against or with the current.
One makes it easier to row while the other takes a lot more effort.
Your boat, or rowing technique, didn’t change… Only your environment did.
Trading is the same.
Your strategy is your boat.
Your optimal trade environment is the current.
Now use this 3-filter checklist to ensure you only take trades where a breakout is likely (with the current).
Filter 1: How Did Price Approach the Level?
What you WANT:
A slow, grinding staircase pattern approaching resistance.Each candle makes incremental progress.Higher lows are stacking up.Controlled, deliberate movement.
What you DON’T want:
A fast vertical spike into resistance.Price shoots up in one or two large candles.After a spike, buyers' strength is depleted and price typically consolidates or reverses.This is exhaustion, not momentum.
The staircase pattern shows sustained buying pressure building gradually. When this breaks through resistance, buyers are still engaged and ready to push further.
Common mistake: Traders see a strong candle break resistance and assume momentum is strong. But these fast moves often reverse quickly.
→ Do this instead: Take momentum trades when price approaches resistance in a slow, grinding staircase over multiple candles.
Real Trade Example:
Slow clear grind into resistance showing an optimal ‘price approach to level’ for momentum.
Filter 1: slow grindy staircase ✅
Filter 2: What Did Volume Look Like?
Volume confirms whether the price movement has conviction behind it.
What you WANT:
Gradual increase in volume as price approaches resistanceThis pattern shows controlled, sustainable momentum.
What you DON’T want:
Flat volume (no conviction) or sudden volume spikes (exhaustion).Flat volume means the move lacks participation.Volume spikes often mark climax points where momentum exhausts.Decreasing volume (why would price break out of resistance now, if volume was lower than before?)
Volume should mirror the price pattern, steady and building, not erratic.
This strategy works because momentum continuation is most likely when participation is sustained, supply is absorbed gradually, and structure remains intact.
Real Trade Example:
Around the time the grindy staircase begins to emerge, we see a slow, consistent increase in volume.
Filter 1: slow grindy staircase ✅Filter 2: clearly increasing volume ✅
Lastly,
Filter 3: Moving Average Crossovers
This filter distinguishes trending markets (good for momentum) from choppy, indecisive markets (bad for momentum).
What you WANT to see: Moving averages with minimal crossovers. This indicates a directional trend.
What you DON’T want to see: Frequent crossovers. This signals chop and indecision.
Fewer crossovers = cleaner trend or range = better momentum continuation.
Use the 30SMMA (Smoothed Moving Average).
✍️Quick Actionable Step:
To add the 30SMMA on your charts:
Search for the Smoothed Moving Average Indicator in TradingViewAdd it to your chartGo into settings and change the "Length" to "30"
Real Trade Example:
Filter 1 (Price Action): slow grindy staircase ✅
Filter 2 (Volume): clearly increasing volume ✅
Filter 3 (Crossovers): minimal MA crossovers ✅
🎓Lesson 2 Summary
Slow grinding staircase approaches have better follow-through than fast spikesVolume should be gradual (increasing or decreasing), not flat or spikingFewer MA crossovers indicate cleaner directional conditions for momentum
Lesson 3: Identifying Setups
Now you know what momentum is.
You also know the optimal conditions for it.
Next, you need to know where to execute these trades.
Step 1: Draw Support and Resistance Levels
Momentum trades happen at these key levels. You need to identify them consistently.
I've already written an in-depth masterclass on how to set these levels. I'll link it at the end of this article.
Common mistake: Traders draw levels randomly or inconsistently, leading to missed setups or false signals.
Do this instead: Use my step-by-step approach at the end of this article.
Step 2: Await Your Entry Trigger on the 1-Minute Chart
Once you’ve identified a resistance level on your primary timeframe, switch to the 1-minute chart for precise entry timing.
Why 1-minute chart?
You learn faster.
More trades, more chart exposure and more oppurtunities to practice psychology.
I’ve added a bonus guide on why you should be trading the 1-minute chart at the end of this article.
Real Trade Example:
Step 3: Three Filters
Before entering, check the three filters from Section 2:
Is price approaching resistance in a slow staircase pattern?Is volume gradually increasing or decreasing (not flat or spiking)?Are there minimal MA crossovers (not choppy)?
If any filter fails, reduce your risk on the trade. Only take full risk on A-grade setups, not forcing trades in poor conditions.
🎓Lesson 3 Summary
Draw levels using the ZCT masterclass approach at the end of this articleUse your entry trigger on the 1-minute timeframe: 2 candle closes above for confirmationCheck all three filters before entering, allocate risk and size accordingly
Lesson 4: Strategy Logic: Stop Loss, and Take Profit
You've drawn your levels. You've confirmed the setup aligns with optimal momentum conditions.
Now you need precise execution.
Entry timing, stop placement, and profit targets determine whether you capture the momentum move or get stopped out on a good setup.
This is where most traders lose, not in analysis, but in execution.
Step 4: Entry Trigger
We have established to wait for two consecutive 1-minute candles to close fully above the resistance level. This confirms the level broke and momentum is continuing.
Critical execution detail: After the second candle closes above resistance, place a limit order AT the resistance level (now acting as support), not above it. Price often pulls back slightly after breaking out. Your limit order gets filled on the pullback without chasing.
Common mistake: Traders wait for confirmation, then market-buy above resistance as price runs away. They enter late with a wider stop and worse risk/reward.
→ Do this instead: Preset your limit order AT resistance after the second candle closes. Let price come back to you.
Real Trade Example:
Step 5: Stop Loss
A swing low is:
the lowest wick in a pullback.
Your stop loss goes at the most recent swing low before the breakout.
Common mistake: Traders place stops at the nearest swing low, even if it’s only 0.3% away, leading to frequent stop-outs from normal volatility
Do this instead: Always measure the distance of your stop loss using the ruler tool on TradingView. If it’s less than 1%, use the next swing low down.
Step 6: Take Profit 1R (Equal Distance to Stop)
Your take profit target is 1R, the same distance as your stop loss, but in the profit direction
If your stop loss is 1.982% away from entry, your target is also 1.982% away, but on the upside. This gives you a 1:1 risk/reward ratio.
Why 1R? It’s conservative and achievable. Momentum trades often hit 1R quickly because the breakout has follow-through. You’re not trying to catch the entire move, you’re taking a high-probability piece of it.
Over time, as you get data in your journal, you can start extending your profit targets when you see how far your average winning trades go beyond 1R. This way, you’re not guessing where to take profits, but following a systematic approach.
Real Trade Example:
🎓Lesson 4 summary
Enter after two 1-minute candle closes above resistance, using a limit order at prior resistance (now support) to avoid chasing price.Place stop losses at the most recent valid swing low, ensuring enough distance to avoid normal volatility and minor stop hunts.Set initial profit targets at 1R to capture high-probability momentum continuation in a repeatable, systematic way.
Immediate Next Steps✍️:
Read the Support and Resistance Masterclass to learn how to draw levels (shared at end of article)Look at 3 charts using the 3 filter checklist to identify a momentum trade environmentUse the strategy steps to enter your tradeGather 30 trades using this method, journalled and reviewed against the criteria
🎓 Final Summary
Lesson 1: Momentum vs Mean Reversion
Momentum trades bet that price will continue through a level, while mean reversion trades bet that a level will hold and reject price.Both strategies are valid, but performance depends entirely on matching the strategy to the correct trade environment.
Understanding this distinction prevents applying breakout logic in conditions where it has no edge.
Lesson 2: Optimal Trade Environment
High-quality breakouts form when price approaches resistance in a slow, grinding staircase rather than fast vertical spikes.Volume should build gradually to confirm sustained participation, not remain flat or spike from exhaustion.Minimal moving average crossovers indicate cleaner directional conditions where momentum continuation is more likely.
Lesson 3: Identifying Setups
Momentum trades should be executed at consistently drawn support and resistance levels.Entries are triggered on the 1-minute chart using two consecutive candle closes above resistance for confirmation.All three environment filters must align before taking full risk; weaker conditions require reduced sizing or passing the trade.
Lesson 4: Stop Loss and Take Profit
Enter using a limit order at prior resistance (now support) after two confirmed 1-minute candle closes to avoid chasing price.Stop losses should be placed at the most recent valid swing low with enough distance to avoid normal volatility and minor stop hunts.Initial profit targets are set at 1R to capture high-probability momentum continuation in a repeatable way.
🎓What Changes From Here
The next time price approaches resistance, you won’t have to guess if it will break out.
You’ll know when a breakout has real momentum, when volume confirms it, and when conditions support follow-through.
You’ll also execute with defined entries, stops, and targets.
#CryptoZeno #tradingStrategy
40
17
129
75.4k
·
--
See translation
A MASSIVE TOKENIZATION WAVE IS COMING TO CRYPTO.
9 days ago, we named real world asset tokenization as one of the biggest narratives of this cycle in this thread.
The signs are already here.
• DTCC, the system behind US stock settlement, now lets banks turn stocks, ETFs and Treasuries into blockchain tokens. JPMorgan, Bank of America, Citi, Morgan Stanley and Fidelity are among the first firms using it.
• Janus Henderson, a $500 billion asset manager, launched the first licensed tokenized fund tracking the Nasdaq-100.
• Aviva Investors put £50 million (about $66.7 million) into a tokenized version of its £22 billion money market fund on the XRP Ledger.
• Hong Kong approved 24/7 trading of tokenized funds for retail investors for the first time.
• Ondo brought tokenized Apple, Meta, Tesla and Google shares to Robinhood Chain.
• Securitize, one of the biggest tokenization firms, expanded to the Stellar blockchain.
• The owner of the New York Stock Exchange is planning a regulated US market for 24/7 perpetual futures built on Hyperliquid.
All of this happened in just 9 days.
{future}(BTCUSDT)
A MASSIVE TOKENIZATION WAVE IS COMING TO CRYPTO.
9 days ago, we named real world asset tokenization as one of the biggest narratives of this cycle in this thread.
The signs are already here.
• DTCC, the system behind US stock settlement, now lets banks turn stocks, ETFs and Treasuries into blockchain tokens. JPMorgan, Bank of America, Citi, Morgan Stanley and Fidelity are among the first firms using it.
• Janus Henderson, a $500 billion asset manager, launched the first licensed tokenized fund tracking the Nasdaq-100.
• Aviva Investors put £50 million (about $66.7 million) into a tokenized version of its £22 billion money market fund on the XRP Ledger.
• Hong Kong approved 24/7 trading of tokenized funds for retail investors for the first time.
• Ondo brought tokenized Apple, Meta, Tesla and Google shares to Robinhood Chain.
• Securitize, one of the biggest tokenization firms, expanded to the Stellar blockchain.
• The owner of the New York Stock Exchange is planning a regulated US market for 24/7 perpetual futures built on Hyperliquid.
All of this happened in just 9 days.
1
199
·
--
See translation
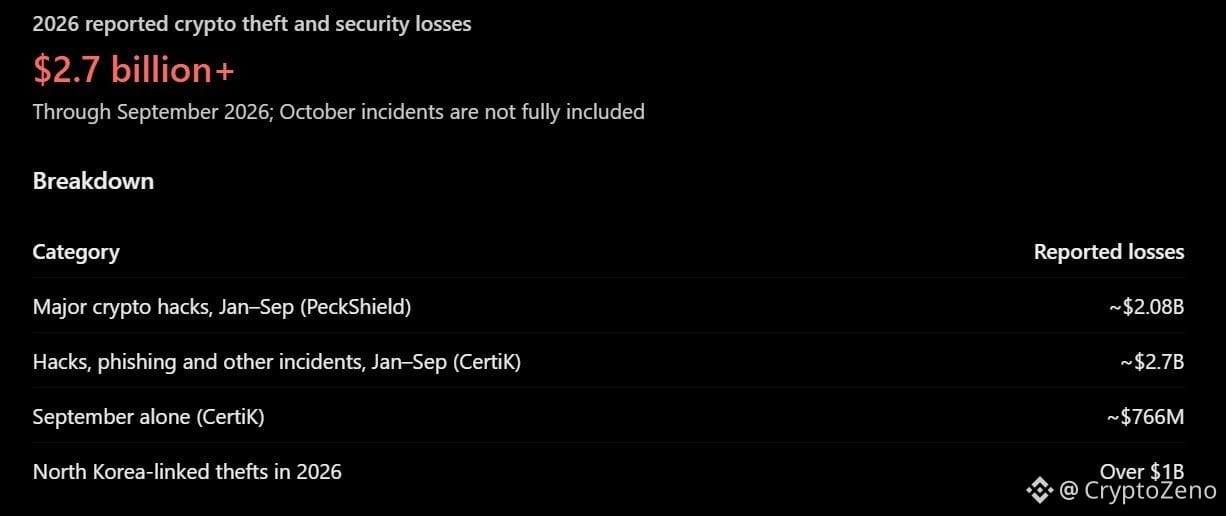
Over $2.7 BILLION has been lost to crypto hacks and security breaches in 2026 alone
And that's only through September
More than $1 BILLION has been attributed to North Korean hackers
We’ve built an entire financial system around protecting private keys and somehow BILLIONS keep disappearing every year
And that's only through September
More than $1 BILLION has been attributed to North Korean hackers
We’ve built an entire financial system around protecting private keys and somehow BILLIONS keep disappearing every year
2
995
·
--
See translation
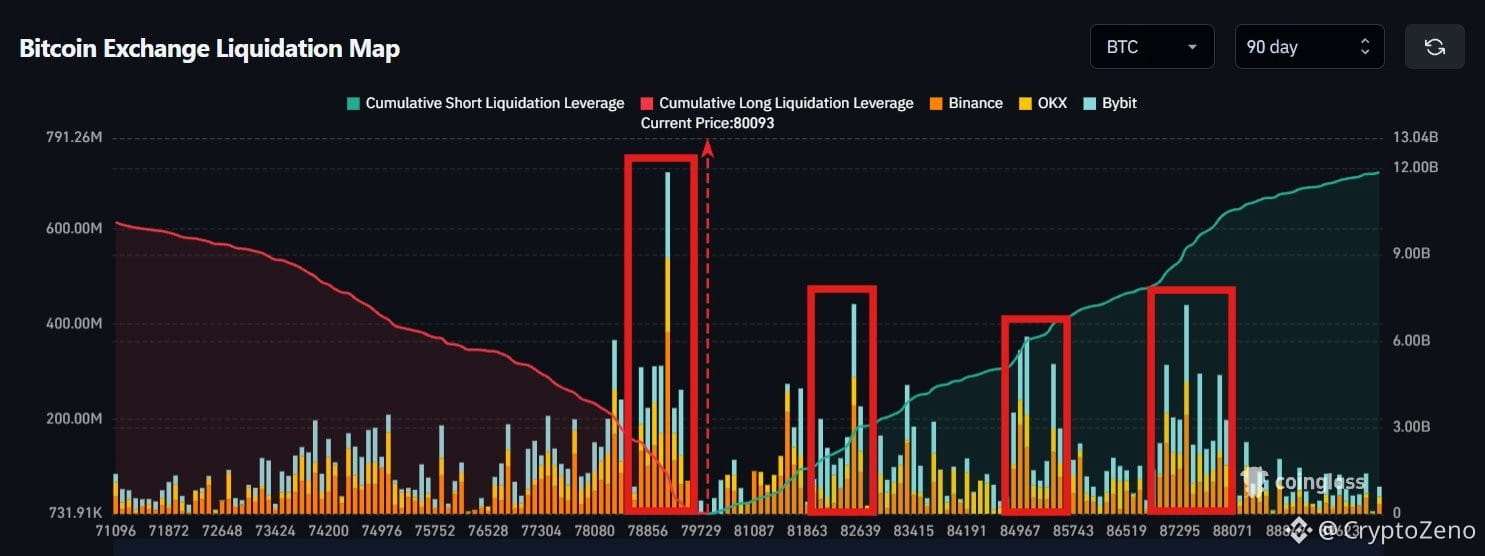
$BTC Looking at the higher timeframe liquidation map, four clusters stand out.
{future}(BTCUSDT)
The closest one sits around $79K, with over $2.5B in long liquidations.
Above price, we have three major clusters around $82K, $85K and $87K, containing more than $10B in short liquidations combined.
Interestingly, the total amount of liquidity is almost equally distributed on both sides, with slightly more sitting above price.
However, below $79K, there are no major clusters left as liquidity is spread out across a much wider price range.
While I still consider a sweep of $79K very likely, my overall bullish outlook remains unchanged.
I still favor the upside as the next major direction.
$BTC Looking at the higher timeframe liquidation map, four clusters stand out.
The closest one sits around $79K, with over $2.5B in long liquidations.
Above price, we have three major clusters around $82K, $85K and $87K, containing more than $10B in short liquidations combined.
Interestingly, the total amount of liquidity is almost equally distributed on both sides, with slightly more sitting above price.
However, below $79K, there are no major clusters left as liquidity is spread out across a much wider price range.
While I still consider a sweep of $79K very likely, my overall bullish outlook remains unchanged.
I still favor the upside as the next major direction.
5
541
·
--
See translation
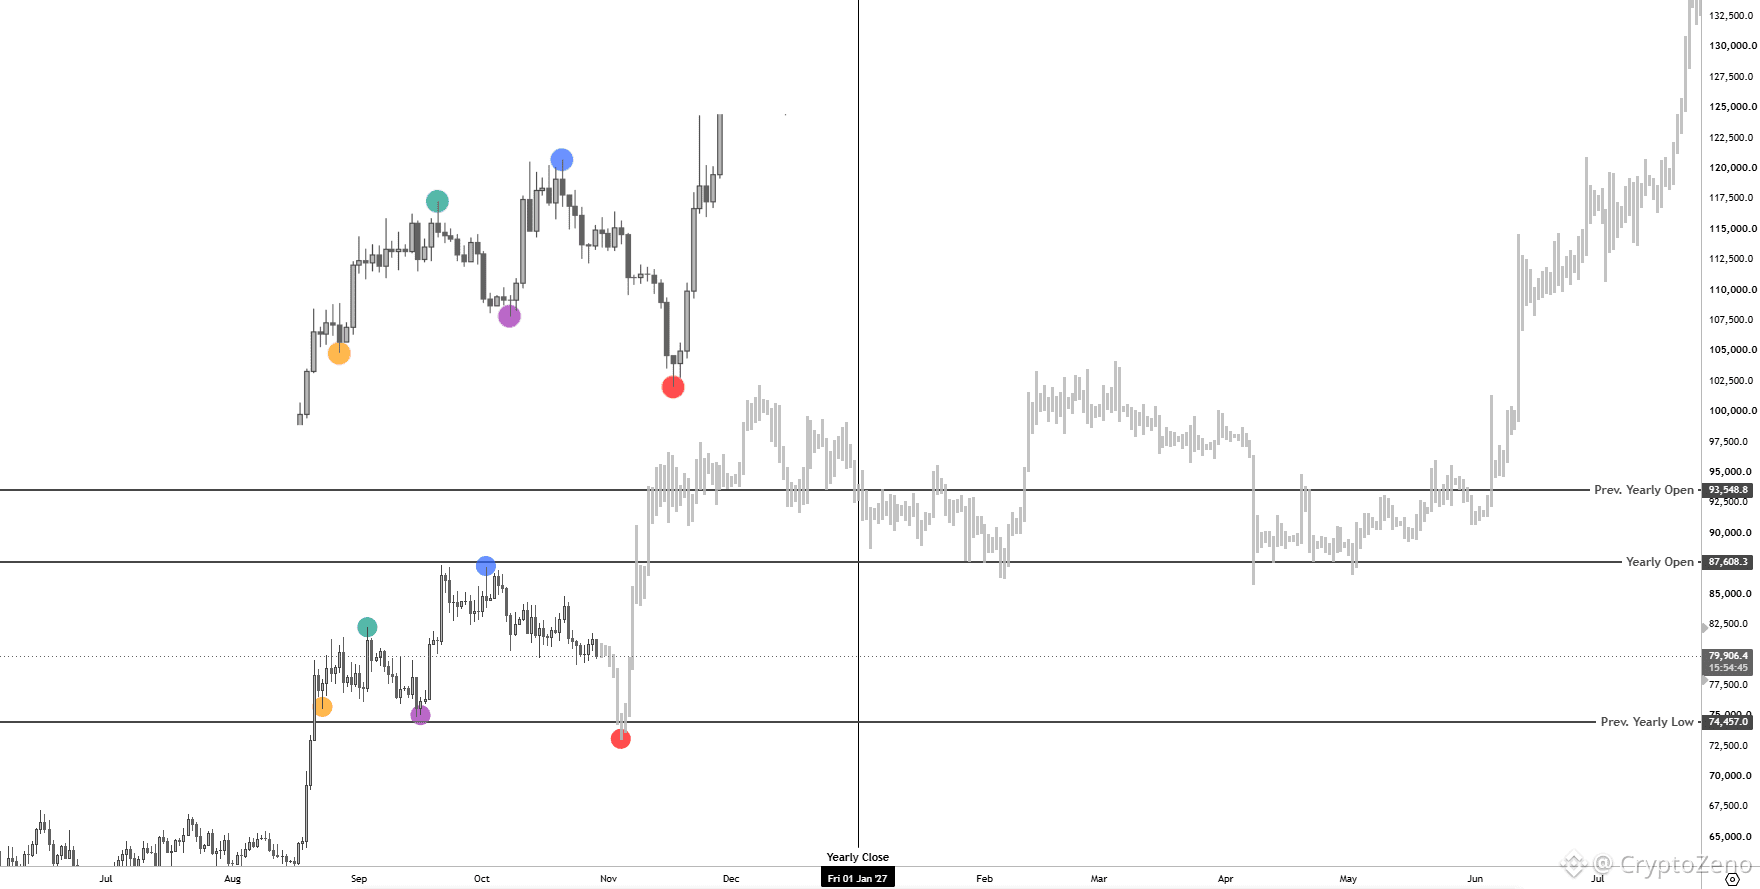
$BTC Zoomed in w/ Last Cycle's Fractals
{future}(BTCUSDT)
Now, We all know that we've been following the Last Cycle's PA pretty much to the dot so far. However, I don't solely rely on historical references as they're never guaranteed to play out again, and each cycle's PA is different from the last one in one way or another.
But the thing is, When I couple the Yearly Candle Time + Liquidity analysis I shared above with the last cycle's price action, They pretty much complement each other.
In fact, It feels less like a historical PA reference here and more like a visual representation of that thought process on the chart right now.
Based on this Fractal, The roadmap is the same:
--> Retest of the previous yearly candle's low to complete HTF Wave 2.
--> Pump back above the yearly open and close the year in green around 93.6k
--> Next yearly candle holds the current yearly open and continues towards the upside.
Pretty much what I shared in the post above, and both scenarios line up pretty well and complement each other.
So where I'm getting at is that if we lose the current lows, It would very likely mean we repeat something similar to what we saw back in 2023.
A HTF correction is due, and the 74k-72k region has always remained on my radar.
However, For that region to come into play, We first need to break below the 0.618 Fib on the 1D, sitting at 79.6k.
$BTC Zoomed in w/ Last Cycle's Fractals
Now, We all know that we've been following the Last Cycle's PA pretty much to the dot so far. However, I don't solely rely on historical references as they're never guaranteed to play out again, and each cycle's PA is different from the last one in one way or another.
But the thing is, When I couple the Yearly Candle Time + Liquidity analysis I shared above with the last cycle's price action, They pretty much complement each other.
In fact, It feels less like a historical PA reference here and more like a visual representation of that thought process on the chart right now.
Based on this Fractal, The roadmap is the same:
--> Retest of the previous yearly candle's low to complete HTF Wave 2.
--> Pump back above the yearly open and close the year in green around 93.6k
--> Next yearly candle holds the current yearly open and continues towards the upside.
Pretty much what I shared in the post above, and both scenarios line up pretty well and complement each other.
So where I'm getting at is that if we lose the current lows, It would very likely mean we repeat something similar to what we saw back in 2023.
A HTF correction is due, and the 74k-72k region has always remained on my radar.
However, For that region to come into play, We first need to break below the 0.618 Fib on the 1D, sitting at 79.6k.
3
417
·
--
See translation
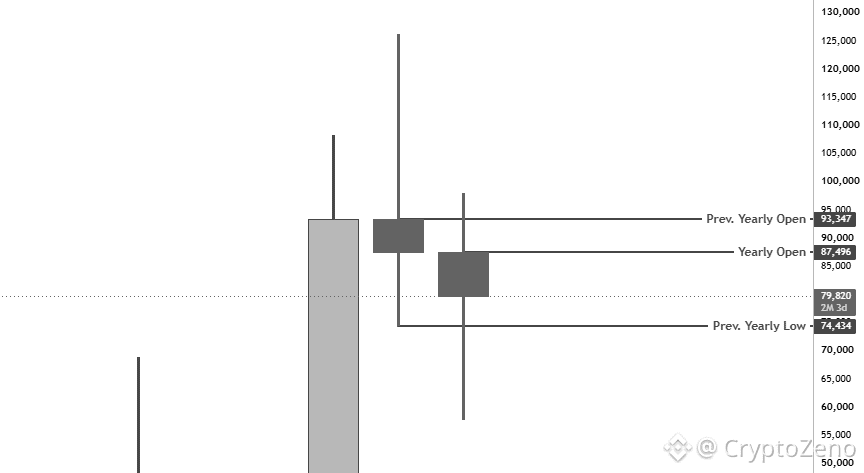
$BTC This yearly candle is important.
{future}(BTCUSDT)
My base scenario was that we would deviate above the yearly open and tap 93.6k before retracing back below 87.4k and closing the yearly candle in red.
Then, when the 2027 yearly candle opens, it would first fill some of the wick of the current year's candle, where we'd get a retest of the 74.5k region before continuing towards the upside.
Now, Putting a Wave Count on this thesis, It would look something like this:
Deviation above 93k = Monthly Wave 1.
Yearly close below 87.4k, making the candle close in red.
The 2027 candle fills some of the wick of the 2026 candle = Monthly Wave 2 around the 74k region.
Following that wick fill, We pump towards the upside inside Wave 3 and create a new ATH.
This was my overall time, price + liquidity thesis behind the Wave Count I'm tracking on the Weekly/Monthly, and it's still pretty much valid as long as we keep holding the 0.618 Fib and the trendline on the Daily.
However, The catch is that if we lose that 0.618 Fib / trendline on the Daily and actually complete Wave 2 in the start of next month, It would change the timeline significantly.
Meaning that the imbalance which should ideally be cleared by next year's candle would instead be filled during the current yearly session.
Now, Given that we have liquidity stacked above the yearly open as of now, A tap into the 76k-74k region for completing Wave 2 within this year would mean we're likely to pump for the rest of Q4 and close the yearly candle in green, potentially around the 93.3k region.
From there, The next yearly candle would only come down to the 87.4k region for a minor retest before continuing higher.
So if we complete the Weekly Wave 2 in the upcoming days, It would mean we're setting up for a bigger impulse before the end of the year, and November-December could take us into the 93k-96k region.
$BTC This yearly candle is important.
My base scenario was that we would deviate above the yearly open and tap 93.6k before retracing back below 87.4k and closing the yearly candle in red.
Then, when the 2027 yearly candle opens, it would first fill some of the wick of the current year's candle, where we'd get a retest of the 74.5k region before continuing towards the upside.
Now, Putting a Wave Count on this thesis, It would look something like this:
Deviation above 93k = Monthly Wave 1.
Yearly close below 87.4k, making the candle close in red.
The 2027 candle fills some of the wick of the 2026 candle = Monthly Wave 2 around the 74k region.
Following that wick fill, We pump towards the upside inside Wave 3 and create a new ATH.
This was my overall time, price + liquidity thesis behind the Wave Count I'm tracking on the Weekly/Monthly, and it's still pretty much valid as long as we keep holding the 0.618 Fib and the trendline on the Daily.
However, The catch is that if we lose that 0.618 Fib / trendline on the Daily and actually complete Wave 2 in the start of next month, It would change the timeline significantly.
Meaning that the imbalance which should ideally be cleared by next year's candle would instead be filled during the current yearly session.
Now, Given that we have liquidity stacked above the yearly open as of now, A tap into the 76k-74k region for completing Wave 2 within this year would mean we're likely to pump for the rest of Q4 and close the yearly candle in green, potentially around the 93.3k region.
From there, The next yearly candle would only come down to the 87.4k region for a minor retest before continuing higher.
So if we complete the Weekly Wave 2 in the upcoming days, It would mean we're setting up for a bigger impulse before the end of the year, and November-December could take us into the 93k-96k region.
2
308
·
--
See translation
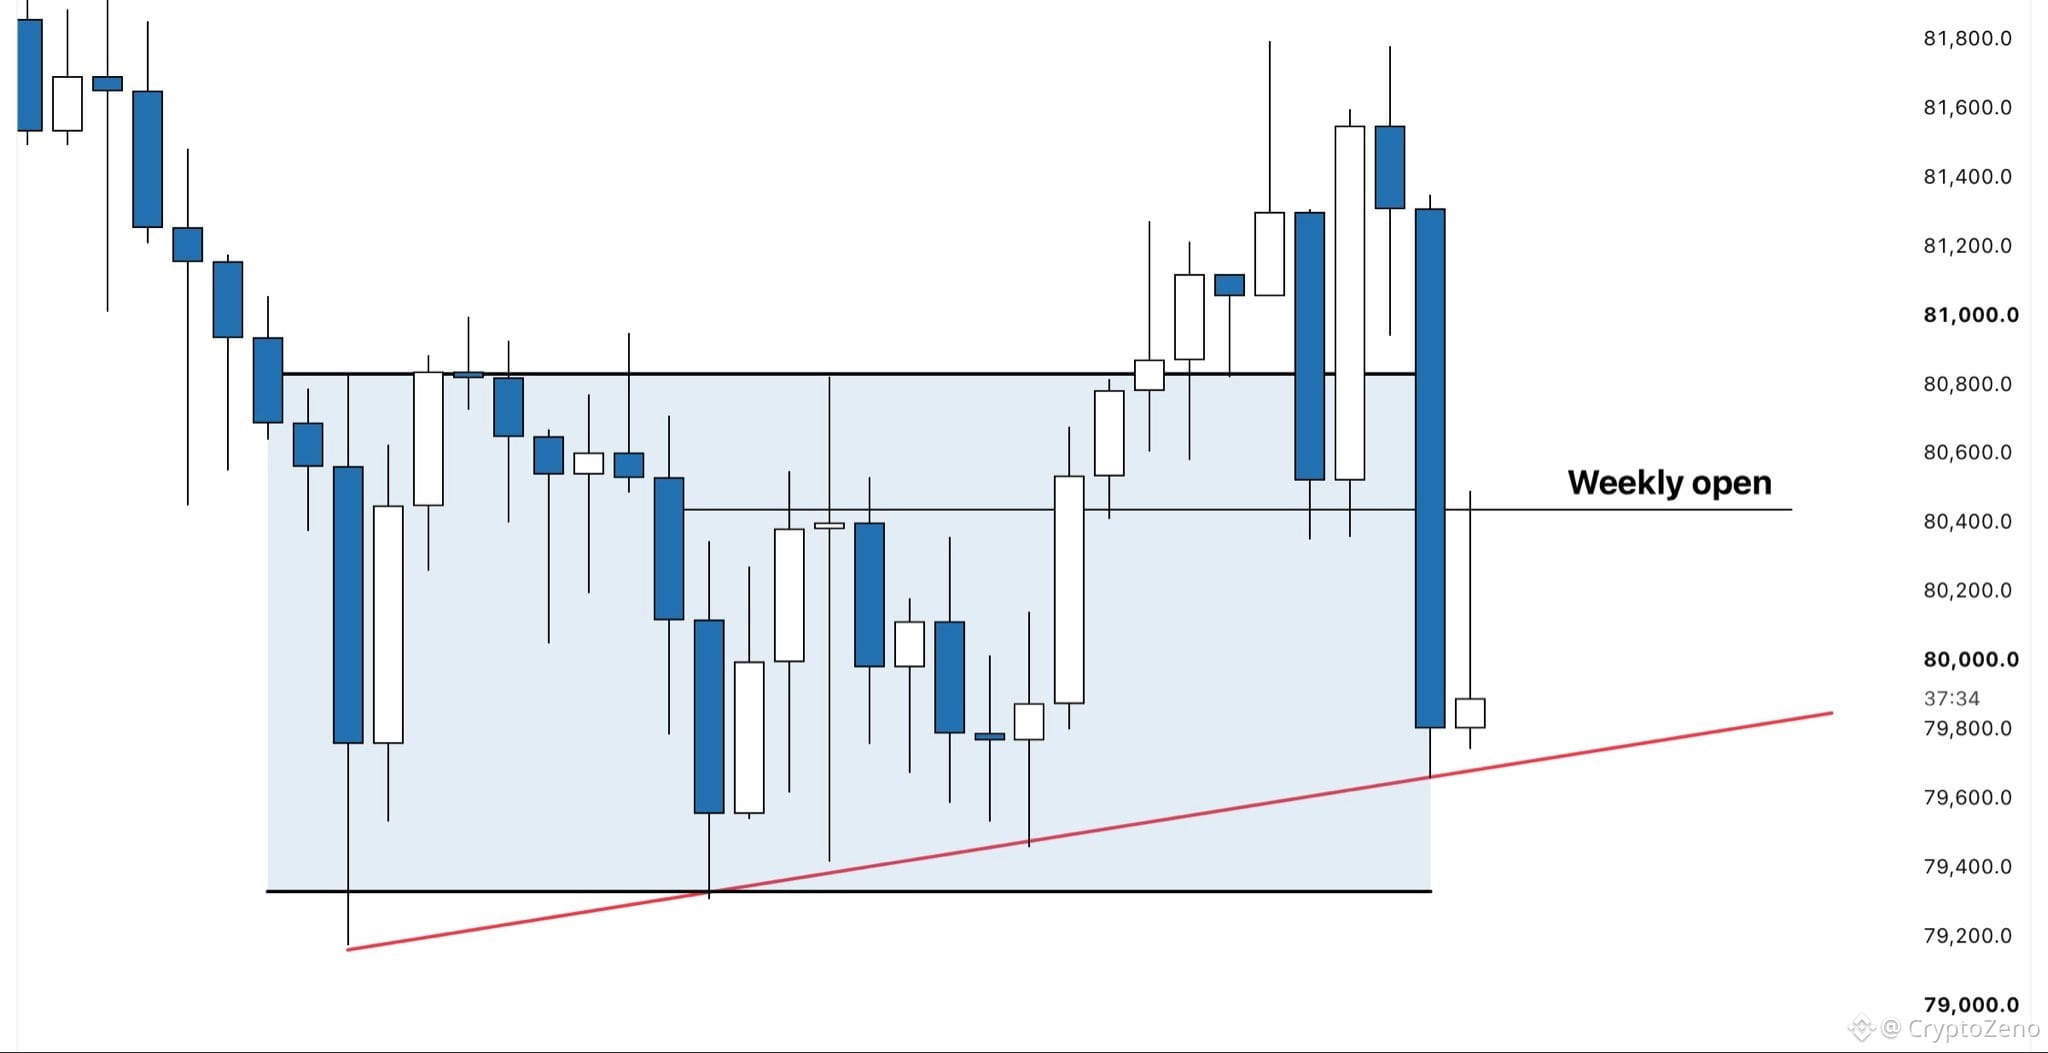
$BTC Yesterday's FOMC breakout didn't last long.
{future}(BTCUSDT)
Buyers failed to sustain the move, sending price back into the range and below the weekly open.
Now all eyes are on the ascending trendline and the range lows, both of which are still holding.
What's keeping me optimistic is the order flow.
Spot participants continue to buy while perp sellers are trying to push price lower.
As long as spot demand remains strong, I expect buyers to keep defending these levels.
But if spot starts selling as well, things could get ugly pretty quickly.
$BTC Yesterday's FOMC breakout didn't last long.
Buyers failed to sustain the move, sending price back into the range and below the weekly open.
Now all eyes are on the ascending trendline and the range lows, both of which are still holding.
What's keeping me optimistic is the order flow.
Spot participants continue to buy while perp sellers are trying to push price lower.
As long as spot demand remains strong, I expect buyers to keep defending these levels.
But if spot starts selling as well, things could get ugly pretty quickly.
3
202
·
--
See translation
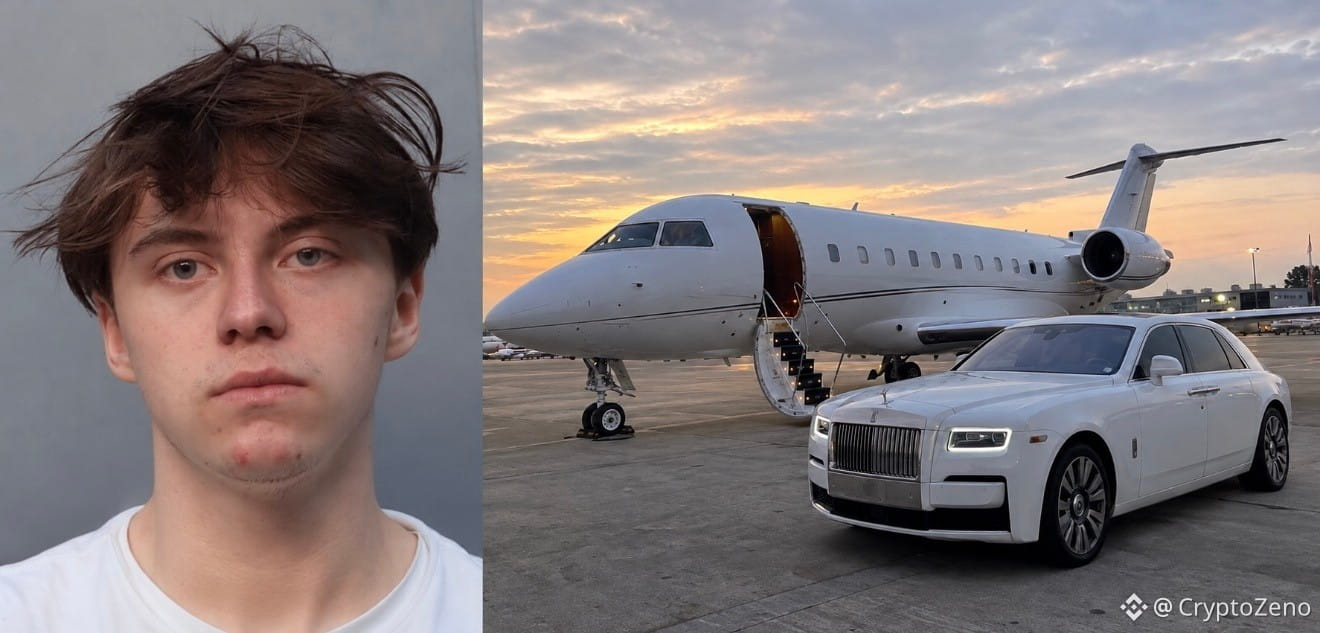
THIS IS ACTUALLY CRAZY!
A 19 year old named Trenton Johnston stole 185 $BTC worth $13 MILLION with just one phone call.
He called pretending to be Google and Trezor support and told the victim their wallet was getting hacked.
They panicked and handed over their keys.
He blew the money on a Lamborghini, a Rolls-Royce and private jets.
Then went and bragged about it on Signal and Discord.
11 days later, cops caught him for speeding in that same Rolls-Royce.
The victim lost all his life savings, but this guy only got a 25-month sentence.
If you're in crypto, never share your keys with anyone. Not even "support."
{future}(BTCUSDT)
THIS IS ACTUALLY CRAZY!
A 19 year old named Trenton Johnston stole 185 $BTC worth $13 MILLION with just one phone call.
He called pretending to be Google and Trezor support and told the victim their wallet was getting hacked.
They panicked and handed over their keys.
He blew the money on a Lamborghini, a Rolls-Royce and private jets.
Then went and bragged about it on Signal and Discord.
11 days later, cops caught him for speeding in that same Rolls-Royce.
The victim lost all his life savings, but this guy only got a 25-month sentence.
If you're in crypto, never share your keys with anyone. Not even "support."
2
247
·
--
Article
See translation
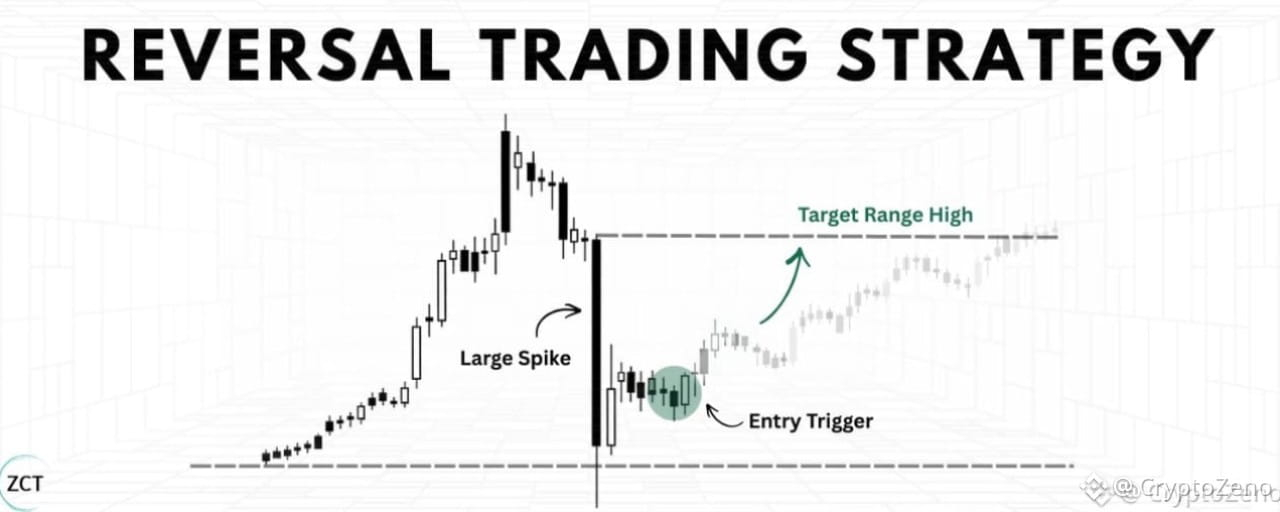
My Reversal Trading StrategyMy job everyday is to come to the table, look around and decide where could certain hands move price or force itself into the books in order to move price.
At least on the lower time frames I do this through tools like open interest, funding rates, live liquidations, delta, plus some intuition from repeatedly seeing the same patterns of liquidity repeated after years of watching the same market. These are the tools which give me the ability across a fragmented BTC market to identify where people are positioning, which side they are on, and which moves could force their hand.
I like to frame my thinking around a single quesiton before getting into a position:
Has the market priced this in yet?
If it hasn't been priced in then there's edge in what i'm trying to execute from. If I see the market has priced it in already then the edge has diminished and the trade is no longer there.
A good example of this is when looking for trapped traders, specifically looking at whether open interest has decreased or not to spot whether those "trapped positions" have forced their position back into the market.
The end goal is to position myself into the market early enough to exploit something Ive seen which I believe the market hasn't priced in yet.
Another great example of this, is through understanding liquidity in particular how thin books can allow for exaggerated price movements. If you pair that alongside trapped positioning you will very often get a very nice mean reversion setup.
A common misconception is that "thin books" can only be identified in real time and through looking at the dom. This is not true. Using volume candles or looking at how far price moved in relation to how much volume pushed it can help answer this question too. Alongside identifying surges in open interest to help identify trapped positions.
It's about finding your thesis for why you should get paid from the trade you want to take, then going to the technical board and figuring out which tools will help identify this in real time.
Don't pick random tools and use them because they look fancy, think about where your edge comes from (at route level) then decide which tools allow you to spot that mispriced event faster and in a more reliable manner than anyone else could.
A fast move into a predictable stop/tp zone that happens unusually fast relative to local regime is one thing I commonly look for. These moves are often engineered, meaning someone/group of people have forced price to a certain local level for liquidity purposes.
> Force price up
> Stops/liquidations triggered
> Limit sell orders filled
> No real conviction
> Price reverses
This requires some level of intuition to reliably identify, but in essence upon a break of a level I want to see excessive buying in the form of aggressive stops being hit or liquidations being forced into the book. Both offer up opportunity for opposing side limits to be filled, and if the move was manufactured or deliberately pushed up in this manner, theres no real conviction behind it, allows for a easy reversal.
It all comes down the fact that if I know why i'm looking for something at a certain location, that can be transferred over much easier than just punting random levels without reasoning.
Think about who you are trading against and how you can profit off that info before it is priced in, you are in the research business.
#CryptoZeno #CanGoogleDefindItsCore $BTC $Q
My Reversal Trading Strategy
My job everyday is to come to the table, look around and decide where could certain hands move price or force itself into the books in order to move price.
At least on the lower time frames I do this through tools like open interest, funding rates, live liquidations, delta, plus some intuition from repeatedly seeing the same patterns of liquidity repeated after years of watching the same market. These are the tools which give me the ability across a fragmented BTC market to identify where people are positioning, which side they are on, and which moves could force their hand.
I like to frame my thinking around a single quesiton before getting into a position:
Has the market priced this in yet?
If it hasn't been priced in then there's edge in what i'm trying to execute from. If I see the market has priced it in already then the edge has diminished and the trade is no longer there.
A good example of this is when looking for trapped traders, specifically looking at whether open interest has decreased or not to spot whether those "trapped positions" have forced their position back into the market.
The end goal is to position myself into the market early enough to exploit something Ive seen which I believe the market hasn't priced in yet.
Another great example of this, is through understanding liquidity in particular how thin books can allow for exaggerated price movements. If you pair that alongside trapped positioning you will very often get a very nice mean reversion setup.
A common misconception is that "thin books" can only be identified in real time and through looking at the dom. This is not true. Using volume candles or looking at how far price moved in relation to how much volume pushed it can help answer this question too. Alongside identifying surges in open interest to help identify trapped positions.
It's about finding your thesis for why you should get paid from the trade you want to take, then going to the technical board and figuring out which tools will help identify this in real time.
Don't pick random tools and use them because they look fancy, think about where your edge comes from (at route level) then decide which tools allow you to spot that mispriced event faster and in a more reliable manner than anyone else could.
A fast move into a predictable stop/tp zone that happens unusually fast relative to local regime is one thing I commonly look for. These moves are often engineered, meaning someone/group of people have forced price to a certain local level for liquidity purposes.
> Force price up
> Stops/liquidations triggered
> Limit sell orders filled
> No real conviction
> Price reverses
This requires some level of intuition to reliably identify, but in essence upon a break of a level I want to see excessive buying in the form of aggressive stops being hit or liquidations being forced into the book. Both offer up opportunity for opposing side limits to be filled, and if the move was manufactured or deliberately pushed up in this manner, theres no real conviction behind it, allows for a easy reversal.
It all comes down the fact that if I know why i'm looking for something at a certain location, that can be transferred over much easier than just punting random levels without reasoning.
Think about who you are trading against and how you can profit off that info before it is priced in, you are in the research business.
#CryptoZeno #CanGoogleDefindItsCore $BTC $Q
214
17
316
·
--
Article
See translation
How Limit Orders Help You Trade Precisely When the Market Gets VolatileLimit Order is a type of trade order that lets you set the exact price you want to buy or sell assets (such as crypto, stock…). Unlike a Market Order, which executes immediately at the current market price, a Limit Order only executes when the market reaches the price you set.
Market Orders are useful when you need to enter or exit immediately and don’t care about small price differences. Limit Orders are for people who want price control, can wait, or trade low-liquidity tokens.
What is Limit Order?
How Limit Orders help preventing Slippage
Slippage is the difference between the price you expect and the price you actually get when your order executes. According to research from the Sei, total slippage costs in 2024 exceeded $2.7B, up 34% from the previous year.
Slippage is usually driven by a combination of market conditions and execution mechanics. It often occurs when liquidity is low, meaning there are not enough matching orders at the desired price. During periods of high volatility, prices can move rapidly while an order is being processed.
Large trade sizes can also cause slippage by consuming multiple price levels. On DEXs, AMM mechanics amplify this effect, as large trades shift the token ratio in the pool and push the execution price away from the expected level.
What is slippage?
How does a Limit Order solve the slippage problem?
By placing a Limit Order, you clearly define the maximum price you are willing to buy or the minimum price you are willing to sell. The order will never execute at a worse price than what you set, helping you avoid negative slippage even in volatile or low-liquidity markets.
Common Types of Limit Orders
Buy Limit Order
You place a buy order at a price lower than the current price. The order executes only when the price drops to your specified level or lower. This fits when you believe the price may dip before moving up.
For example, if BTC is trading at $70,500 and you believe a short-term pullback is likely, you can place a buy limit order at $70,000. The order will only execute if the market trades at that price or lower. This approach helps avoid buying into temporary price spikes and gives you more control over entry price.
Buy Limit Order
Sell Limit Order
You place a sell order at a price higher than the current price. The order executes only when the price rises to your specified level or higher. This is commonly used to take profit at a target price.
Suppose BTC is trading at $60,000 and your target is $80,000. By placing a sell limit order at $80,000, the trade will execute automatically once the price reaches that level. If the market fails to rally, the order remains open. This method enables disciplined profit-taking without constant monitoring.
Sell Limit Order
Stop-Limit Order
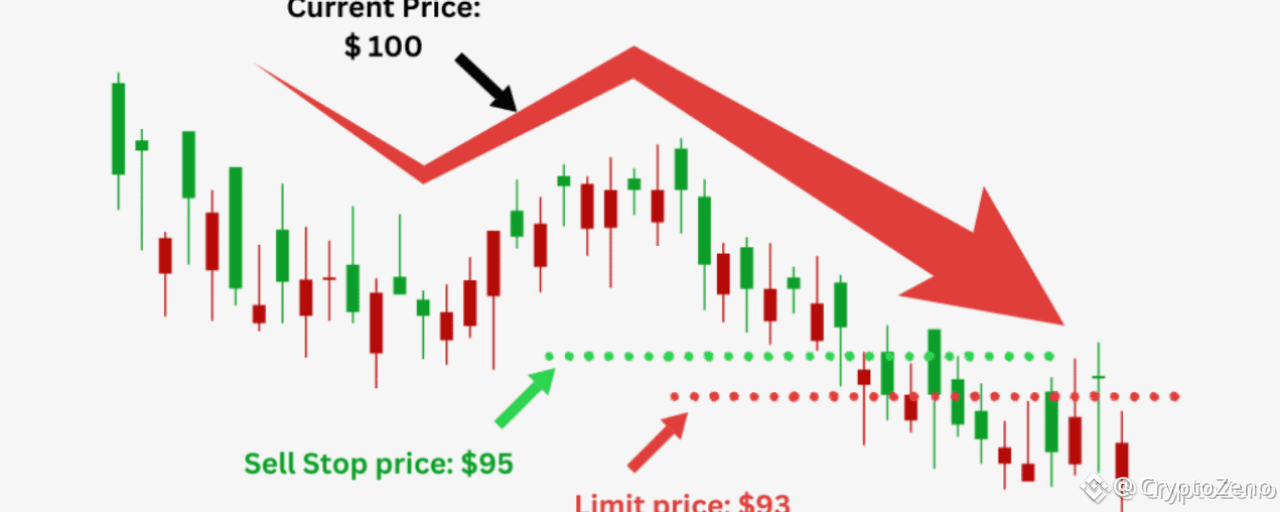
This combines a Stop Order and a Limit Order. You set two prices: a Stop Price (trigger price) and a Limit Price (execution price). When the market hits the Stop Price, the Limit Order becomes active.
For example, you bought SOL at $120 and it is now trading at $135. To protect profits, you set a stop price at $128 and a limit price at $126.
When the market hits $128, a sell limit order at $126 becomes active. The trade executes only if liquidity exists at that price, avoiding extreme slippage during sharp moves.
Stop-Limit Order
Differences between Limit Order vs Market Order
The main difference between limit orders and market orders comes down to the trade-off between price certainty and execution speed. A market order prioritizes immediate execution, making it useful when speed matters, but it exposes traders to slippage, especially during high volatility or when liquidity is thin.
A limit order, on the other hand, lets you define the exact price you are willing to trade at, offering better cost control and discipline. The downside is that execution is not guaranteed, and fast-moving markets can leave limit orders unfilled.
Differences between Limit Order vs Market Order
Pros and Cons of Limit Orders
Pros
First, limit orders give you full control over execution price. You choose exactly where you want to buy or sell, rather than accepting whatever the market offers at that moment. This is especially useful in choppy conditions, where small price differences can meaningfully affect long-term returns.
Second, because a limit order only executes at your chosen price or better, it protects you from unexpected slippage during volatile moves. Even when the market spikes or drops quickly, you will never be filled at a worse price than intended, which helps preserve your risk-reward assumptions.
Third, once a limit order is placed, it works for you in the background. You do not need to watch the chart constantly or react emotionally to short-term price movements. When price reaches your level, the trade executes automatically, making execution more systematic and less stressful.
Finally, using limit orders encourages patience and discipline. Instead of chasing price or reacting to sudden momentum, you commit to predefined levels aligned with your strategy. Over time, this reduces FOMO-driven decisions and helps maintain consistency across different market conditions.
Pros of Limit Order
Cons
The biggest downside of limit orders is that execution is not always guaranteed. If the market moves close to your price but never actually trades at it, the order remains unfilled. In strong trends, this can mean watching price move away without you.
Furthermore, even if the market touches your limit price, a limit order may not fully execute. If available liquidity at that level is limited, only part of your order will be filled, while the rest stays open. This can be frustrating during fast or crowded markets.
Markets do not always move cleanly. Price can reverse sharply or continue trending in your favor without ever touching your limit level. In those cases, a strict limit order may cause you to miss an otherwise profitable trade, especially during high-momentum moves.
Limit Orders are a must-have tool for any serious trader, especially in prediction markets where liquidity is often low and spreads are wide. They help you control your trading price, avoid slippage, and trade with more discipline.
As a leading Trading Terminal Aggregator, Whales Prediction provides everything from professional charts and order book depth to smart money tracking and multiple order types, including Limit Orders. It’s a solid platform for both beginners learning prediction markets and experienced traders optimizing their strategies.
#CryptoZeno #CanMicrosoftDeliverOnAI $BTC $XRP
How Limit Orders Help You Trade Precisely When the Market Gets Volatile
Limit Order is a type of trade order that lets you set the exact price you want to buy or sell assets (such as crypto, stock…). Unlike a Market Order, which executes immediately at the current market price, a Limit Order only executes when the market reaches the price you set.
Market Orders are useful when you need to enter or exit immediately and don’t care about small price differences. Limit Orders are for people who want price control, can wait, or trade low-liquidity tokens.
What is Limit Order?
How Limit Orders help preventing Slippage
Slippage is the difference between the price you expect and the price you actually get when your order executes. According to research from the Sei, total slippage costs in 2024 exceeded $2.7B, up 34% from the previous year.
Slippage is usually driven by a combination of market conditions and execution mechanics. It often occurs when liquidity is low, meaning there are not enough matching orders at the desired price. During periods of high volatility, prices can move rapidly while an order is being processed.
Large trade sizes can also cause slippage by consuming multiple price levels. On DEXs, AMM mechanics amplify this effect, as large trades shift the token ratio in the pool and push the execution price away from the expected level.
What is slippage?
How does a Limit Order solve the slippage problem?
By placing a Limit Order, you clearly define the maximum price you are willing to buy or the minimum price you are willing to sell. The order will never execute at a worse price than what you set, helping you avoid negative slippage even in volatile or low-liquidity markets.
Common Types of Limit Orders
Buy Limit Order
You place a buy order at a price lower than the current price. The order executes only when the price drops to your specified level or lower. This fits when you believe the price may dip before moving up.
For example, if BTC is trading at $70,500 and you believe a short-term pullback is likely, you can place a buy limit order at $70,000. The order will only execute if the market trades at that price or lower. This approach helps avoid buying into temporary price spikes and gives you more control over entry price.
Buy Limit Order
Sell Limit Order
You place a sell order at a price higher than the current price. The order executes only when the price rises to your specified level or higher. This is commonly used to take profit at a target price.
Suppose BTC is trading at $60,000 and your target is $80,000. By placing a sell limit order at $80,000, the trade will execute automatically once the price reaches that level. If the market fails to rally, the order remains open. This method enables disciplined profit-taking without constant monitoring.
Sell Limit Order
Stop-Limit Order
This combines a Stop Order and a Limit Order. You set two prices: a Stop Price (trigger price) and a Limit Price (execution price). When the market hits the Stop Price, the Limit Order becomes active.
For example, you bought SOL at $120 and it is now trading at $135. To protect profits, you set a stop price at $128 and a limit price at $126.
When the market hits $128, a sell limit order at $126 becomes active. The trade executes only if liquidity exists at that price, avoiding extreme slippage during sharp moves.
Stop-Limit Order
Differences between Limit Order vs Market Order
The main difference between limit orders and market orders comes down to the trade-off between price certainty and execution speed. A market order prioritizes immediate execution, making it useful when speed matters, but it exposes traders to slippage, especially during high volatility or when liquidity is thin.
A limit order, on the other hand, lets you define the exact price you are willing to trade at, offering better cost control and discipline. The downside is that execution is not guaranteed, and fast-moving markets can leave limit orders unfilled.
Differences between Limit Order vs Market Order
Pros and Cons of Limit Orders
Pros
First, limit orders give you full control over execution price. You choose exactly where you want to buy or sell, rather than accepting whatever the market offers at that moment. This is especially useful in choppy conditions, where small price differences can meaningfully affect long-term returns.
Second, because a limit order only executes at your chosen price or better, it protects you from unexpected slippage during volatile moves. Even when the market spikes or drops quickly, you will never be filled at a worse price than intended, which helps preserve your risk-reward assumptions.
Third, once a limit order is placed, it works for you in the background. You do not need to watch the chart constantly or react emotionally to short-term price movements. When price reaches your level, the trade executes automatically, making execution more systematic and less stressful.
Finally, using limit orders encourages patience and discipline. Instead of chasing price or reacting to sudden momentum, you commit to predefined levels aligned with your strategy. Over time, this reduces FOMO-driven decisions and helps maintain consistency across different market conditions.
Pros of Limit Order
Cons
The biggest downside of limit orders is that execution is not always guaranteed. If the market moves close to your price but never actually trades at it, the order remains unfilled. In strong trends, this can mean watching price move away without you.
Furthermore, even if the market touches your limit price, a limit order may not fully execute. If available liquidity at that level is limited, only part of your order will be filled, while the rest stays open. This can be frustrating during fast or crowded markets.
Markets do not always move cleanly. Price can reverse sharply or continue trending in your favor without ever touching your limit level. In those cases, a strict limit order may cause you to miss an otherwise profitable trade, especially during high-momentum moves.
Limit Orders are a must-have tool for any serious trader, especially in prediction markets where liquidity is often low and spreads are wide. They help you control your trading price, avoid slippage, and trade with more discipline.
As a leading Trading Terminal Aggregator, Whales Prediction provides everything from professional charts and order book depth to smart money tracking and multiple order types, including Limit Orders. It’s a solid platform for both beginners learning prediction markets and experienced traders optimizing their strategies.
#CryptoZeno #CanMicrosoftDeliverOnAI $BTC $XRP
208
17
313
·
--
See translation
$BTC Price dumped into our bottom pivot window (28-30th),
{future}(BTCUSDT)
It didn't went for the sweep of the mFVG (75k) following our last fractal and is now starting to form bottom like structure here,
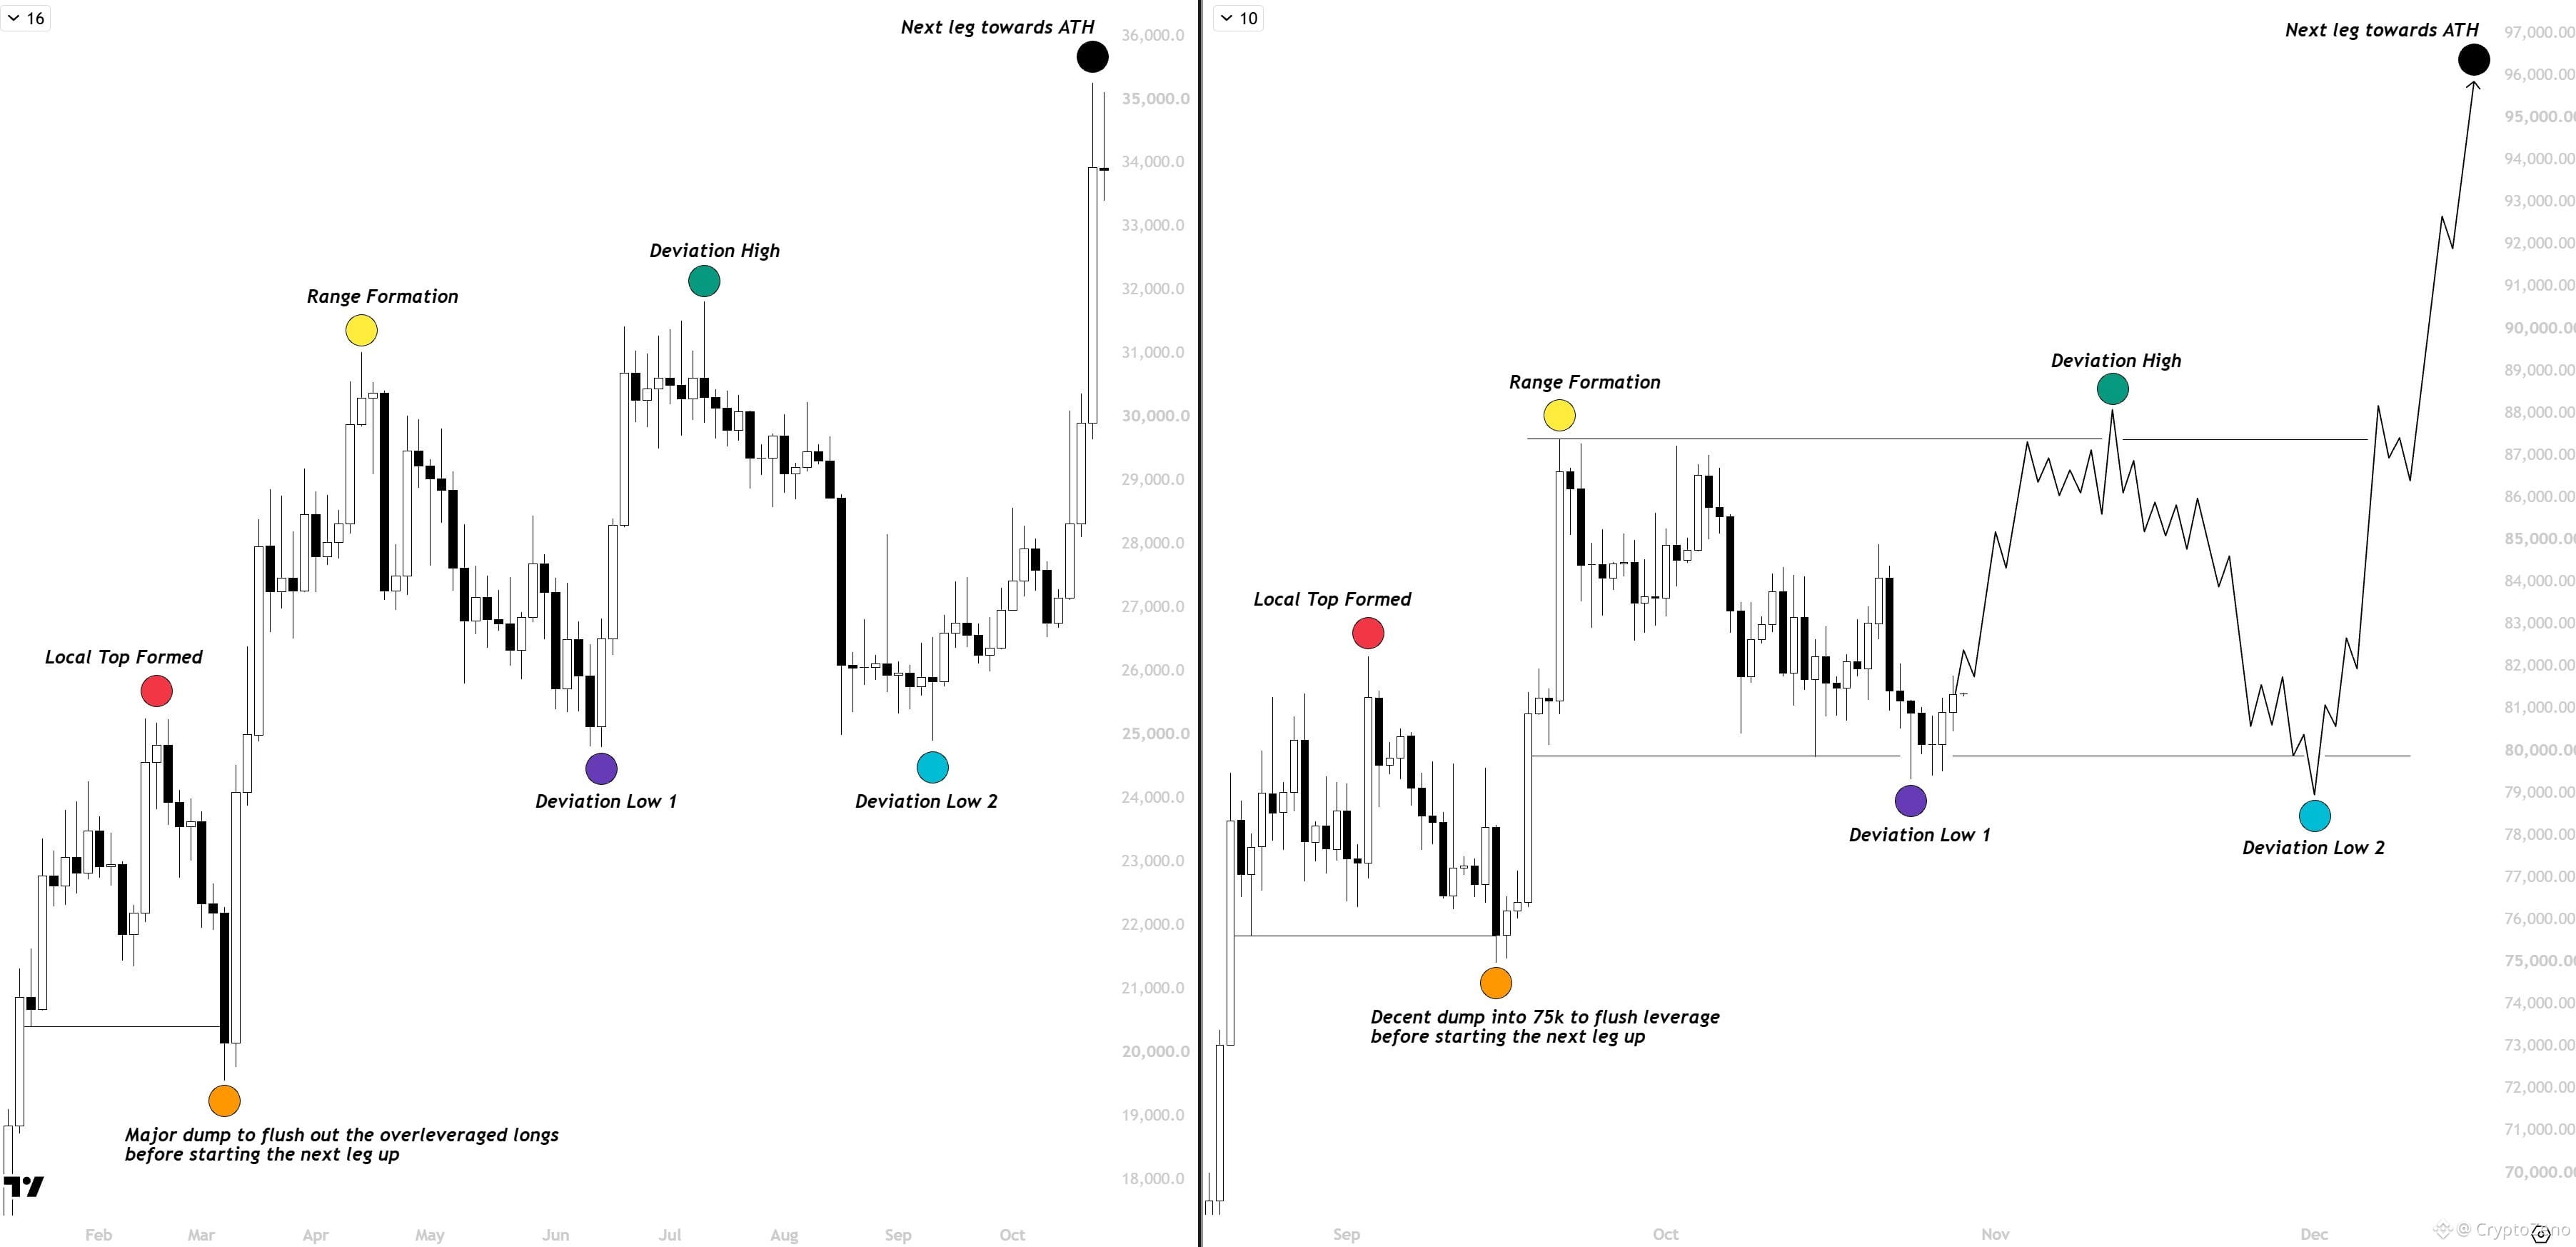
Considering it, I think we have already got the flush in the last pullback (to 75k),
This is still an idea for now but looking at the time pivot and the current market structure.
It looks like we have formed our purple dot and now it's time to hunt the cluster of liquidity above 88k and form the green dot there.
I am swing long from 79.8k and will be adding some alts if we get any pullback (SOL, ETH, HYPE).
$BTC Price dumped into our bottom pivot window (28-30th),
It didn't went for the sweep of the mFVG (75k) following our last fractal and is now starting to form bottom like structure here,
Considering it, I think we have already got the flush in the last pullback (to 75k),
This is still an idea for now but looking at the time pivot and the current market structure.
It looks like we have formed our purple dot and now it's time to hunt the cluster of liquidity above 88k and form the green dot there.
I am swing long from 79.8k and will be adding some alts if we get any pullback (SOL, ETH, HYPE).
2
2
7
6.2k
·
--
See translation
WARNING: THE NEXT MARKET CRASH WILL BE BRUTAL
The AI bubble has officially started to collapse.
Stocks.
Bonds.
Metals.
Crypto.
Every asset class will feel the shock.
2000 → The dot-com bubble burst
2008 → The housing market collapsed
2026 → The AI bubble pops
People who ignore the warning signs always become exit liquidity.
Remember:
I’ve spent 10+ years studying markets and calling market tops and bottoms.
My next call will be posted here first.
7
733
·
--
See translation
$1.8M to $21.9M in 34 days.
Ondo put three BlackRock modelled portfolios onchain on 24 September.
• High Growth $11.3M
• Diversified Growth $5.9M
• High Income $4.7M
$1.8M to $21.9M in 34 days.
Ondo put three BlackRock modelled portfolios onchain on 24 September.
• High Growth $11.3M
• Diversified Growth $5.9M
• High Income $4.7M
Ondo put three BlackRock modelled portfolios onchain on 24 September.
• High Growth $11.3M
• Diversified Growth $5.9M
• High Income $4.7M
1
4
578
·
--
See translation
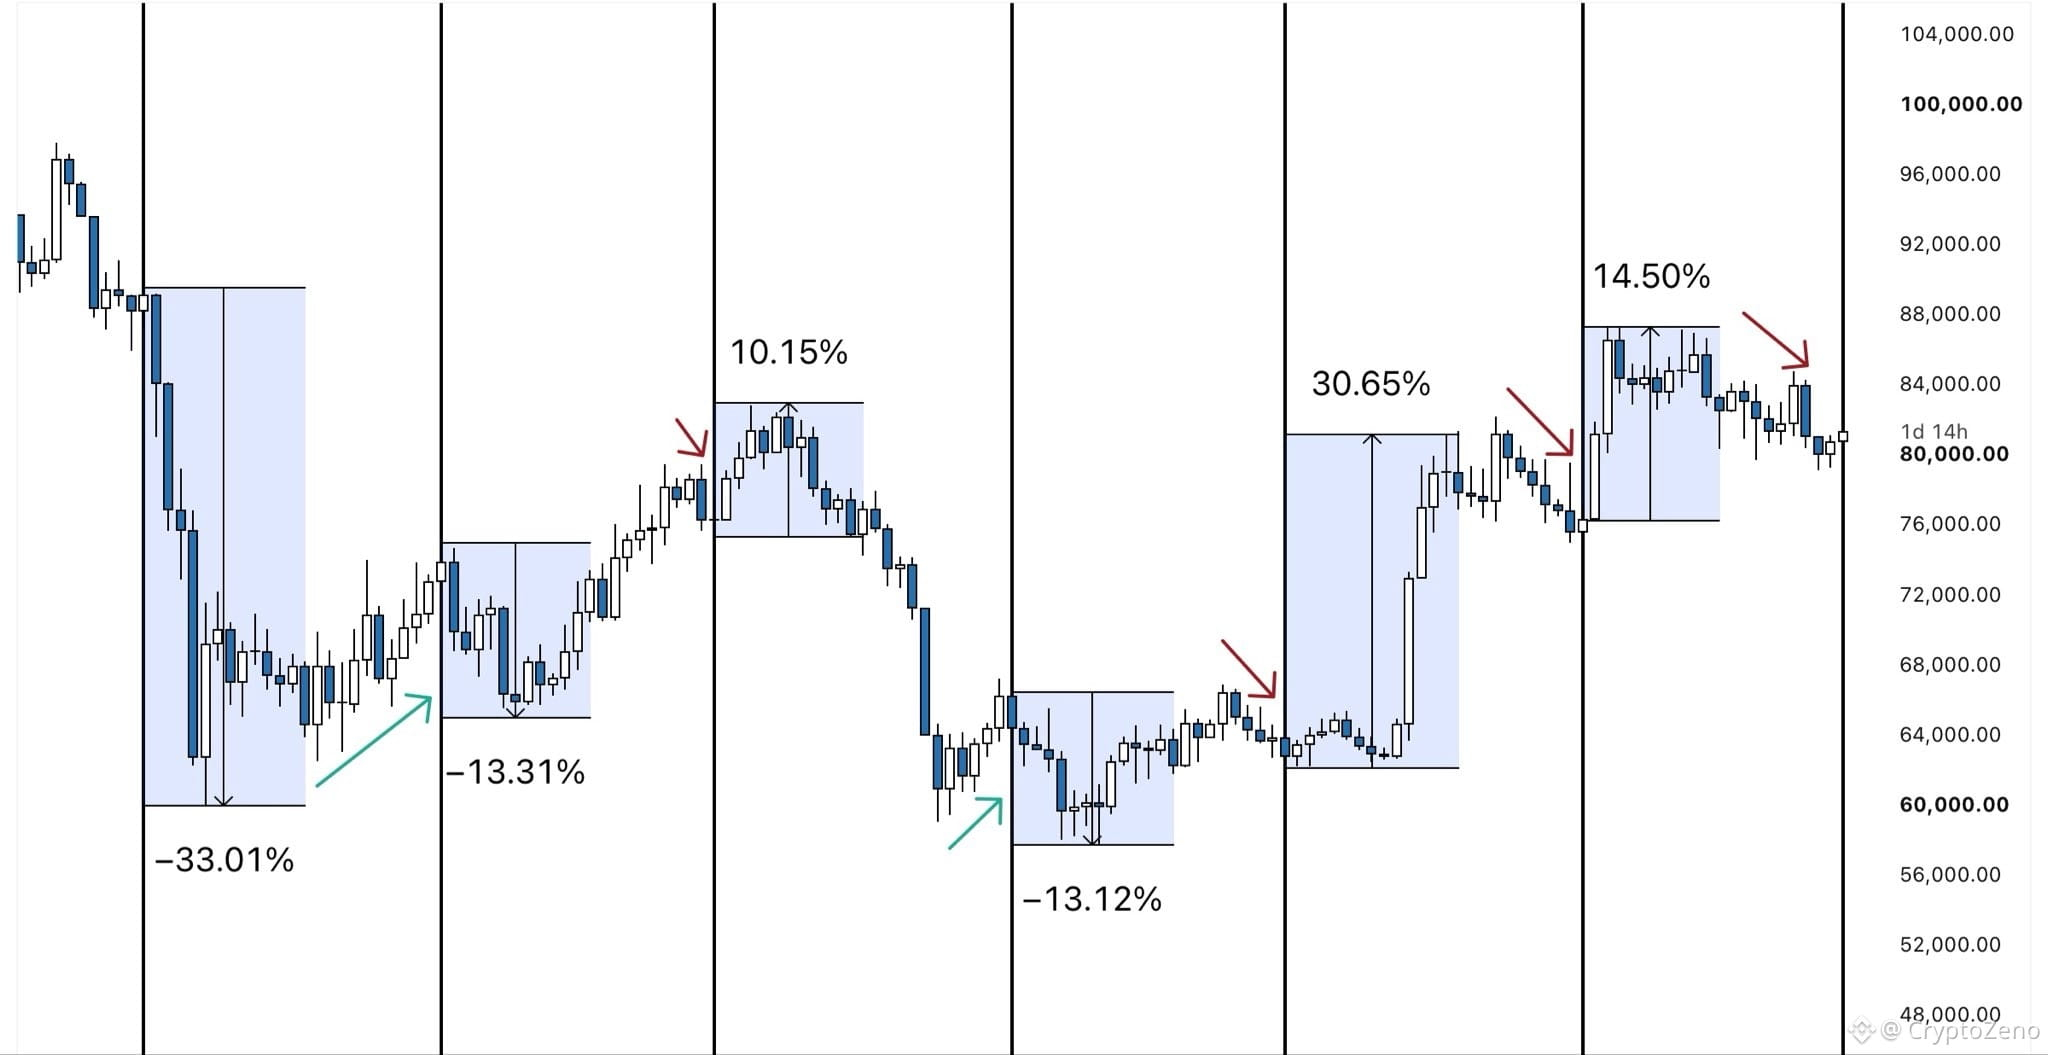
$BTC Today is FOMC, and there's an interesting pattern I've noticed.
{future}(BTCUSDT)
Looking back at every FOMC meeting this year, BTC has consistently moved in the opposite direction after the event compared to how it performed leading up to it.
During the last two meetings, price sold off beforehand, only to reverse and pump afterward.
Now, looking at today's price action, we're seeing a similar setup.
BTC has once again been selling off ahead of the meeting.
If this pattern continues, we could see another reversal to the upside later today.
$BTC Today is FOMC, and there's an interesting pattern I've noticed.
Looking back at every FOMC meeting this year, BTC has consistently moved in the opposite direction after the event compared to how it performed leading up to it.
During the last two meetings, price sold off beforehand, only to reverse and pump afterward.
Now, looking at today's price action, we're seeing a similar setup.
BTC has once again been selling off ahead of the meeting.
If this pattern continues, we could see another reversal to the upside later today.
285
2
19
479
·
--
See translation
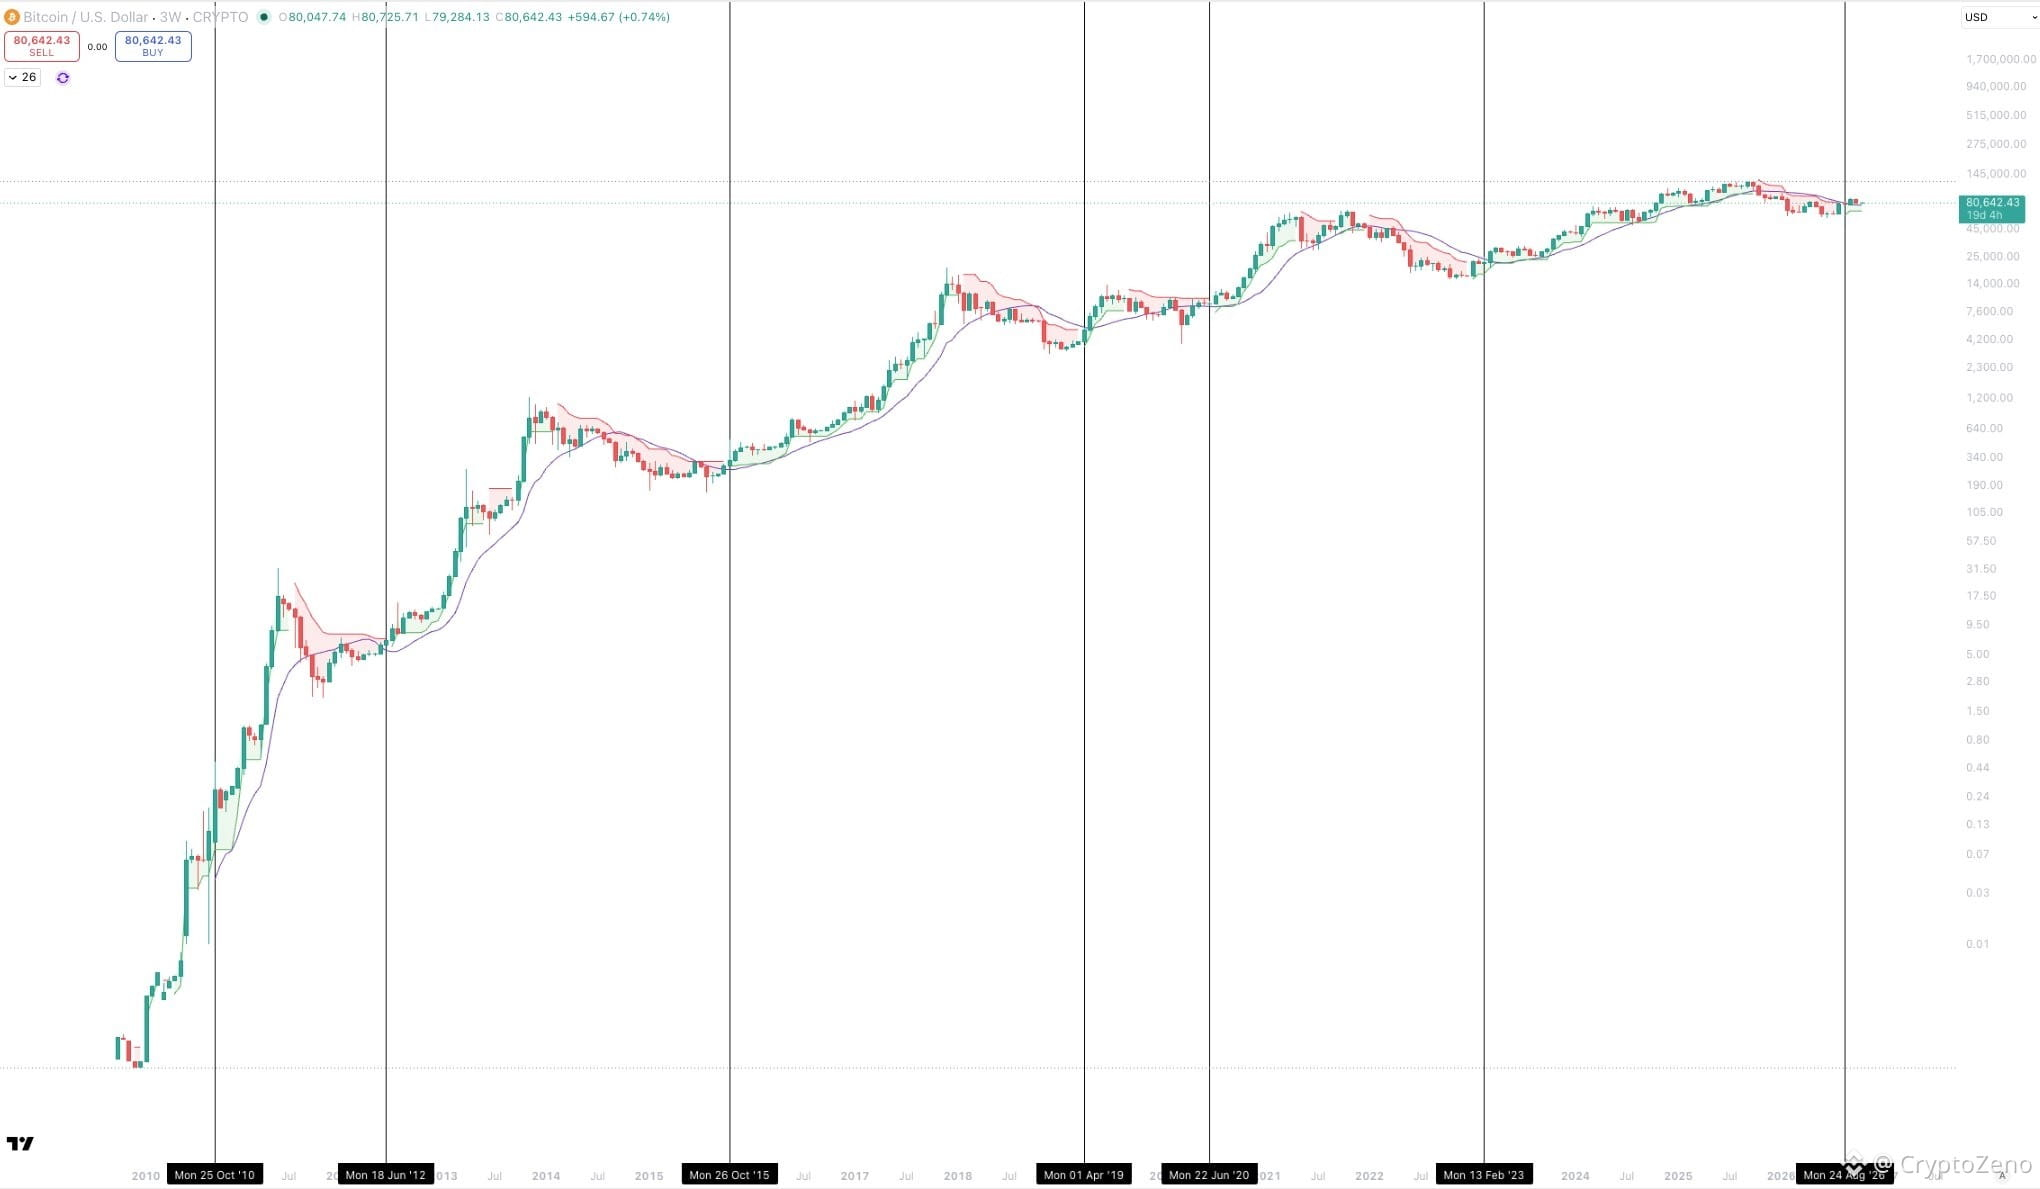
Bitcoins next major expansion is loading.
There has never been a time in Bitcoins history where it has reclaimed:
1. 1W 50SMA
2. 1W Supertrend
And not gone forward to greatly expand.
Not only has it always gone on to majorly expand, it has also never dropped back below the price where it initially reclaimed them both.
This happened in:
1. 2010
2. 2012
3. 2015
4. 2019
5. 2020
6. 2023
And right now.
This is one of the highest beta signals that exists, and it is highly structural.
Simply put, price structure does not reclaim these levels if it is not, in fact, bullish.
Being bearish under these conditions does not favour you.
{future}(BTCUSDT)
Bitcoins next major expansion is loading.
There has never been a time in Bitcoins history where it has reclaimed:
1. 1W 50SMA
2. 1W Supertrend
And not gone forward to greatly expand.
Not only has it always gone on to majorly expand, it has also never dropped back below the price where it initially reclaimed them both.
This happened in:
1. 2010
2. 2012
3. 2015
4. 2019
5. 2020
6. 2023
And right now.
This is one of the highest beta signals that exists, and it is highly structural.
Simply put, price structure does not reclaim these levels if it is not, in fact, bullish.
Being bearish under these conditions does not favour you.
230
1
22
361
·
--
Article
See translation
How to draw, confirm, and trade Trendlines.Most traders draw trendlines wrong and lose money because of it.
Here's exactly how to draw, confirm, and trade them.
2 — THE BASICS
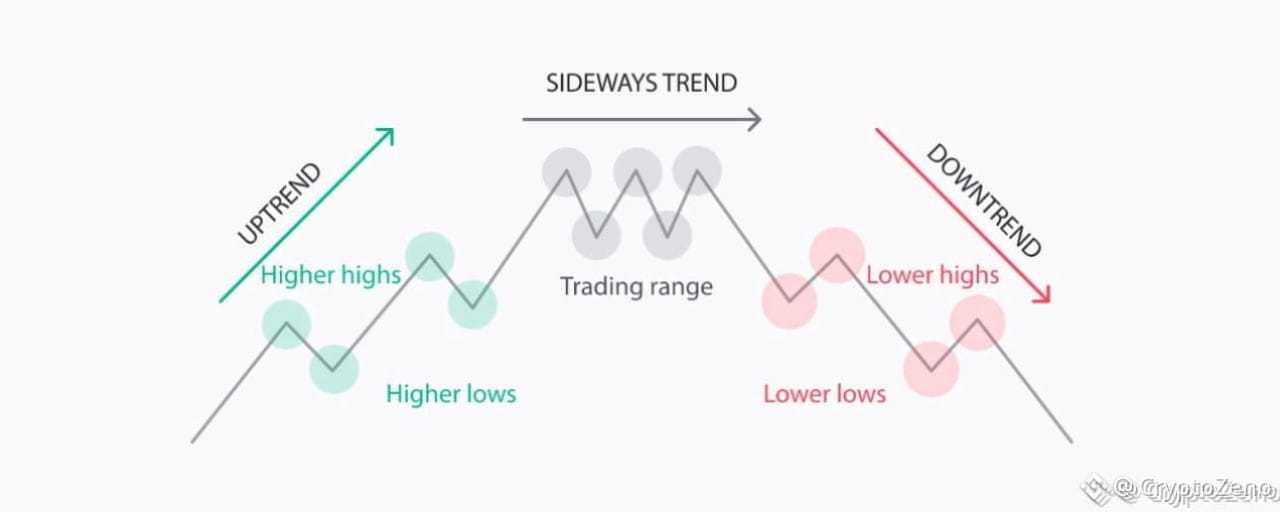
Uptrend = connect higher lows (line below price = support)
Downtrend = connect lower highs (line above price = resistance)
That's the foundation. Now here's what actually matters.
3 — DRAWING RULES
2 touches → draw it
3 touches → it's valid
4+ touches → it's powerful (and likely close to breaking)
Wicks OR candle closes. Pick one. Never mix. Mixing = garbage signals.
4 — ANGLE MATTERS
Steep trendlines snap.
Flat trendlines do nothing.
Sweet spot: 20–35 degrees.
Boring grinds run for months. Exciting rockets crash in days.
5 — TRADE A: THE BOUNCE
Price pulls back to trendline → wait for the 3rd or 4th touch → buy the hold
Entry: $122
Stop: just below the line → $119
Target: prior swing high → $130
Risk $3, reward $8. Clean 2.5:1.
6 — TRADE B: BREAK & RETEST
A wick through the line means nothing.
Wait for a full candle CLOSE beyond it — with volume.
Old resistance becomes new support.
The retest is where the clean entry lives.
7 — #1 TRAP: FAKEOUTS
❌ Wick pokes through → closes back inside → low volume → price snaps back
✅ Full candle close beyond → volume 2–3x average → retest gets rejected → real move
Algos hunt stops at obvious trendlines.
Don't be the liquidity.
8 — TIMEFRAMES
Higher timeframe sets the trend.
Lower timeframe finds the entry.
Daily uptrend + hourly pullback to support = trade it.
Daily downtrend + 15-min bounce = skip it.
When timeframes fight, patience wins.
9 — CONFLUENCE = EDGE
One trendline touch is interesting.
Three or four signals at the same zone is a trade.
Stack: trendline + SMA + horizontal support
→ Enter $142, stop $139, target $152. Risk $3, reward $10.
That's how setups become high-conviction.
10 — 5 MISTAKES KILLING YOUR PnL
❌ Forcing lines to fit your bias — if you're redrawing it, it doesn't exist
❌ Mixing wicks and closes — your levels will be off every time
❌ Trading 2-touch lines — wait for touch 3 before risking real money
❌ Ignoring volume on breaks — low volume breaks fail constantly
❌ Deleting breached lines — old trendlines matter again on retests
11 — CHEAT SHEET
→ Min. 3 touches for validity
→ Angle: 20–35 degrees
→ Bounce entry: 3rd or 4th touch
→ Break confirmation: close + volume spike
→ Safest entry: wait for the retest
→ Stop: just beyond the line
→ R:R minimum: 1:2
→ Confluence: 3+ factors, same zone
12 — CLOSER
Trendlines do 4 jobs:
Define the trend.
Frame the entry.
Place the stop.
Tell you when the trade is wrong.
Draw clean. Confirm with volume. Stack confluences. Execute with patience.
#CryptoZeno #CanGoogleDefindItsCore
How to draw, confirm, and trade Trendlines.
Most traders draw trendlines wrong and lose money because of it.
Here's exactly how to draw, confirm, and trade them.
2 — THE BASICS
Uptrend = connect higher lows (line below price = support)
Downtrend = connect lower highs (line above price = resistance)
That's the foundation. Now here's what actually matters.
3 — DRAWING RULES
2 touches → draw it
3 touches → it's valid
4+ touches → it's powerful (and likely close to breaking)
Wicks OR candle closes. Pick one. Never mix. Mixing = garbage signals.
4 — ANGLE MATTERS
Steep trendlines snap.
Flat trendlines do nothing.
Sweet spot: 20–35 degrees.
Boring grinds run for months. Exciting rockets crash in days.
5 — TRADE A: THE BOUNCE
Price pulls back to trendline → wait for the 3rd or 4th touch → buy the hold
Entry: $122
Stop: just below the line → $119
Target: prior swing high → $130
Risk $3, reward $8. Clean 2.5:1.
6 — TRADE B: BREAK & RETEST
A wick through the line means nothing.
Wait for a full candle CLOSE beyond it — with volume.
Old resistance becomes new support.
The retest is where the clean entry lives.
7 — #1 TRAP: FAKEOUTS
❌ Wick pokes through → closes back inside → low volume → price snaps back
✅ Full candle close beyond → volume 2–3x average → retest gets rejected → real move
Algos hunt stops at obvious trendlines.
Don't be the liquidity.
8 — TIMEFRAMES
Higher timeframe sets the trend.
Lower timeframe finds the entry.
Daily uptrend + hourly pullback to support = trade it.
Daily downtrend + 15-min bounce = skip it.
When timeframes fight, patience wins.
9 — CONFLUENCE = EDGE
One trendline touch is interesting.
Three or four signals at the same zone is a trade.
Stack: trendline + SMA + horizontal support
→ Enter $142, stop $139, target $152. Risk $3, reward $10.
That's how setups become high-conviction.
10 — 5 MISTAKES KILLING YOUR PnL
❌ Forcing lines to fit your bias — if you're redrawing it, it doesn't exist
❌ Mixing wicks and closes — your levels will be off every time
❌ Trading 2-touch lines — wait for touch 3 before risking real money
❌ Ignoring volume on breaks — low volume breaks fail constantly
❌ Deleting breached lines — old trendlines matter again on retests
11 — CHEAT SHEET
→ Min. 3 touches for validity
→ Angle: 20–35 degrees
→ Bounce entry: 3rd or 4th touch
→ Break confirmation: close + volume spike
→ Safest entry: wait for the retest
→ Stop: just beyond the line
→ R:R minimum: 1:2
→ Confluence: 3+ factors, same zone
12 — CLOSER
Trendlines do 4 jobs:
Define the trend.
Frame the entry.
Place the stop.
Tell you when the trade is wrong.
Draw clean. Confirm with volume. Stack confluences. Execute with patience.
#CryptoZeno #CanGoogleDefindItsCore
260
2
19
307
·
--
Article
See translation
Ross Ulbricht and the Uncomfortable Truth About Bitcoin Early DaysWhen #Bitcoin was trading at just fifty cents, almost nobody took it seriously. It was a curiosity for cryptographers, libertarians, and a small group of internet idealists. Few could imagine it would one day reshape finance, politics, and power. Even fewer could imagine that one man would build an entire underground economy around it.
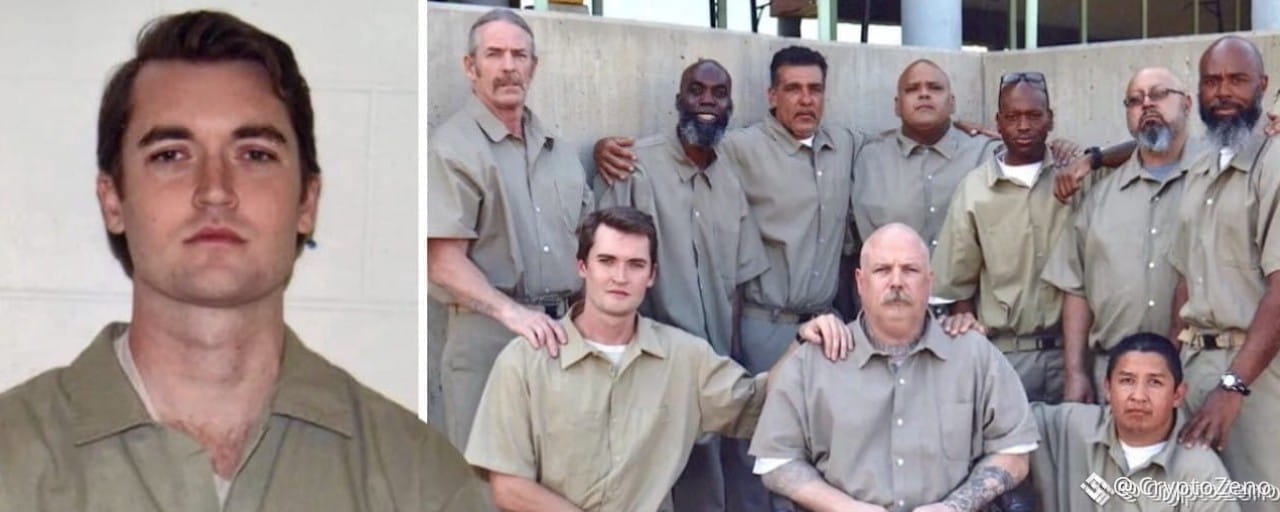
That man was Ross Ulbricht.
Today, his story reads less like a crime report and more like a case study in technology, ideology, and unintended consequences. He was given two life sentences, later pardoned, and recently linked to a mysterious transfer of 300 Bitcoin. Whether viewed as a criminal or a pioneer, his impact on crypto history is undeniable.
Ross Ulbricht did not begin his journey as a criminal mastermind. He studied physics and materials science, was deeply interested in economics, and strongly believed that governments exercised far too much control over individual freedom. Bitcoin represented something radical to him: money without permission, value without borders, and trade without centralized oversight.
In 2011, driven by those beliefs, Ross created a website called Silk Road. It was not accessible through normal browsers. Users had to use Tor, a privacy-focused network designed to anonymize traffic. All transactions were conducted exclusively in Bitcoin, and the entire platform was built around anonymity.
Ross vision was a free market without government interference. In his mind, Silk Road was an experiment in economic freedom rather than a criminal enterprise.
The experiment grew far faster than anyone expected. Silk Road attracted more than one hundred thousand users in a short period of time. People bought drugs, fake identification documents, and hacking tools. At one point, a significant portion of all Bitcoin transactions globally flowed through the platform. For many early adopters, Silk Road was their first real exposure to Bitcoin as usable money.
But anonymity is fragile, and ideology does not protect against human error.
Ross operated online under several aliases, the most famous being “Dread Pirate Roberts.” For a long time, his identity remained hidden. Then came a small mistake. He once posted a technical question online using his real email address. That single slip was enough for investigators to begin connecting the dots.
On October 1, 2013, the FBI arrested Ross Ulbricht inside a public library in San Francisco. Agents waited until his laptop was open, then seized it before he could encrypt or lock it. The laptop contained everything. Administrative access to Silk Road, private messages, transaction logs, and access to wallets holding roughly 150 million dollars’ worth of Bitcoin at the time.
In 2015, Ross was convicted on multiple charges, including drug trafficking, money laundering, hacking, and operating a criminal enterprise. The sentence shocked many observers. Two life sentences plus forty years, with no possibility of parole. Even people who believed #SilkRoad was illegal questioned whether the punishment was wildly disproportionate.
The government also seized more than 144,000 Bitcoin from Ross laptop. Those coins were later sold at auction for roughly 334 dollars per Bitcoin, generating about 48 million dollars. Today, those same coins would be worth well over nine billion dollars, making the seizure one of the most expensive mistakes in financial history.
Over time, Ross Ulbricht became more than a prisoner. He became a symbol.
To some, he was a villain who enabled illegal markets. To others, he was a martyr for digital freedom and a warning about state overreach in the age of code. More than half a million people signed petitions calling for a reduced sentence. His name became deeply embedded in crypto culture, representing both its ideals and its risks.
In 2020, rumors began circulating that President Trump might pardon Ross. Figures close to the administration hinted at discussions behind the scenes. The crypto community was hopeful, but the pardon never came. Still, the idea refused to die.
Even in prison, Ross remained active. He wrote essays, created artwork, and continued to engage with the outside world through his family, who managed his social media presence. Over time, his following grew, especially among crypto-native audiences who saw his imprisonment as symbolic.
Then, unexpectedly, everything changed.
In 2025, Ross Ulbricht was suddenly pardoned. Activists, legal advocates, and crypto-friendly political figures had quietly pushed for years. When he re-emerged, he appeared at major crypto events and received standing ovations. Many described it as the return of a legend.
Not long after, another mystery surfaced. One of Ross old $BTC wallets received 300 BTC, worth more than 30 million dollars at the time. The funds were routed through a mixer designed to obscure their origin. No one knows who sent the Bitcoin or why. Speculation exploded, but no definitive answers emerged.
#RossUlbricht story continues to matter because it forces uncomfortable questions into the open. Can technology truly be neutral? Who ultimately controls the internet? How much power should governments have over code, markets, and individual choice? And can a single person, armed with nothing but an idea and software, reshape the world?
Whether you see Ross as a criminal, a pioneer, or something in between, one thing is certain. His story is not finished.
In an era defined by digital surveillance, financial control, and programmable money, the legacy of Silk Road still echoes. And we may not have seen the last of Ross Ulbricht’s influence on crypto and the internet itself.
#CryptoZeno #CanMicrosoftDeliverOnAI
Ross Ulbricht and the Uncomfortable Truth About Bitcoin Early Days
When #Bitcoin was trading at just fifty cents, almost nobody took it seriously. It was a curiosity for cryptographers, libertarians, and a small group of internet idealists. Few could imagine it would one day reshape finance, politics, and power. Even fewer could imagine that one man would build an entire underground economy around it.
That man was Ross Ulbricht.
Today, his story reads less like a crime report and more like a case study in technology, ideology, and unintended consequences. He was given two life sentences, later pardoned, and recently linked to a mysterious transfer of 300 Bitcoin. Whether viewed as a criminal or a pioneer, his impact on crypto history is undeniable.
Ross Ulbricht did not begin his journey as a criminal mastermind. He studied physics and materials science, was deeply interested in economics, and strongly believed that governments exercised far too much control over individual freedom. Bitcoin represented something radical to him: money without permission, value without borders, and trade without centralized oversight.
In 2011, driven by those beliefs, Ross created a website called Silk Road. It was not accessible through normal browsers. Users had to use Tor, a privacy-focused network designed to anonymize traffic. All transactions were conducted exclusively in Bitcoin, and the entire platform was built around anonymity.
Ross vision was a free market without government interference. In his mind, Silk Road was an experiment in economic freedom rather than a criminal enterprise.
The experiment grew far faster than anyone expected. Silk Road attracted more than one hundred thousand users in a short period of time. People bought drugs, fake identification documents, and hacking tools. At one point, a significant portion of all Bitcoin transactions globally flowed through the platform. For many early adopters, Silk Road was their first real exposure to Bitcoin as usable money.
But anonymity is fragile, and ideology does not protect against human error.
Ross operated online under several aliases, the most famous being “Dread Pirate Roberts.” For a long time, his identity remained hidden. Then came a small mistake. He once posted a technical question online using his real email address. That single slip was enough for investigators to begin connecting the dots.
On October 1, 2013, the FBI arrested Ross Ulbricht inside a public library in San Francisco. Agents waited until his laptop was open, then seized it before he could encrypt or lock it. The laptop contained everything. Administrative access to Silk Road, private messages, transaction logs, and access to wallets holding roughly 150 million dollars’ worth of Bitcoin at the time.
In 2015, Ross was convicted on multiple charges, including drug trafficking, money laundering, hacking, and operating a criminal enterprise. The sentence shocked many observers. Two life sentences plus forty years, with no possibility of parole. Even people who believed #SilkRoad was illegal questioned whether the punishment was wildly disproportionate.
The government also seized more than 144,000 Bitcoin from Ross laptop. Those coins were later sold at auction for roughly 334 dollars per Bitcoin, generating about 48 million dollars. Today, those same coins would be worth well over nine billion dollars, making the seizure one of the most expensive mistakes in financial history.
Over time, Ross Ulbricht became more than a prisoner. He became a symbol.
To some, he was a villain who enabled illegal markets. To others, he was a martyr for digital freedom and a warning about state overreach in the age of code. More than half a million people signed petitions calling for a reduced sentence. His name became deeply embedded in crypto culture, representing both its ideals and its risks.
In 2020, rumors began circulating that President Trump might pardon Ross. Figures close to the administration hinted at discussions behind the scenes. The crypto community was hopeful, but the pardon never came. Still, the idea refused to die.
Even in prison, Ross remained active. He wrote essays, created artwork, and continued to engage with the outside world through his family, who managed his social media presence. Over time, his following grew, especially among crypto-native audiences who saw his imprisonment as symbolic.
Then, unexpectedly, everything changed.
In 2025, Ross Ulbricht was suddenly pardoned. Activists, legal advocates, and crypto-friendly political figures had quietly pushed for years. When he re-emerged, he appeared at major crypto events and received standing ovations. Many described it as the return of a legend.
Not long after, another mystery surfaced. One of Ross old $BTC wallets received 300 BTC, worth more than 30 million dollars at the time. The funds were routed through a mixer designed to obscure their origin. No one knows who sent the Bitcoin or why. Speculation exploded, but no definitive answers emerged.
#RossUlbricht story continues to matter because it forces uncomfortable questions into the open. Can technology truly be neutral? Who ultimately controls the internet? How much power should governments have over code, markets, and individual choice? And can a single person, armed with nothing but an idea and software, reshape the world?
Whether you see Ross as a criminal, a pioneer, or something in between, one thing is certain. His story is not finished.
In an era defined by digital surveillance, financial control, and programmable money, the legacy of Silk Road still echoes. And we may not have seen the last of Ross Ulbricht’s influence on crypto and the internet itself.
#CryptoZeno #CanMicrosoftDeliverOnAI
347
1
16
347
·
--
See translation
$BTC Price tried breaking out towards the upside,
But the sellers pushed it back in the range and now we have around ~180M in trapped longs above 81k.
If we are unable to reclaim the 81k level, then the price is going to rotate back to the lows.
Also not to forget we still have stacked un-swept lows below us meaning we got liquidity below it.
And if we go to test the level again, I think it's gonna break this time and potentially test 77-78k.
My trade plan remains the same with 40% in longs currently and will add another 40% if we get a dump to the 77-78k level.
{future}(BTCUSDT)
$BTC Price tried breaking out towards the upside,
But the sellers pushed it back in the range and now we have around ~180M in trapped longs above 81k.
If we are unable to reclaim the 81k level, then the price is going to rotate back to the lows.
Also not to forget we still have stacked un-swept lows below us meaning we got liquidity below it.
And if we go to test the level again, I think it's gonna break this time and potentially test 77-78k.
My trade plan remains the same with 40% in longs currently and will add another 40% if we get a dump to the 77-78k level.
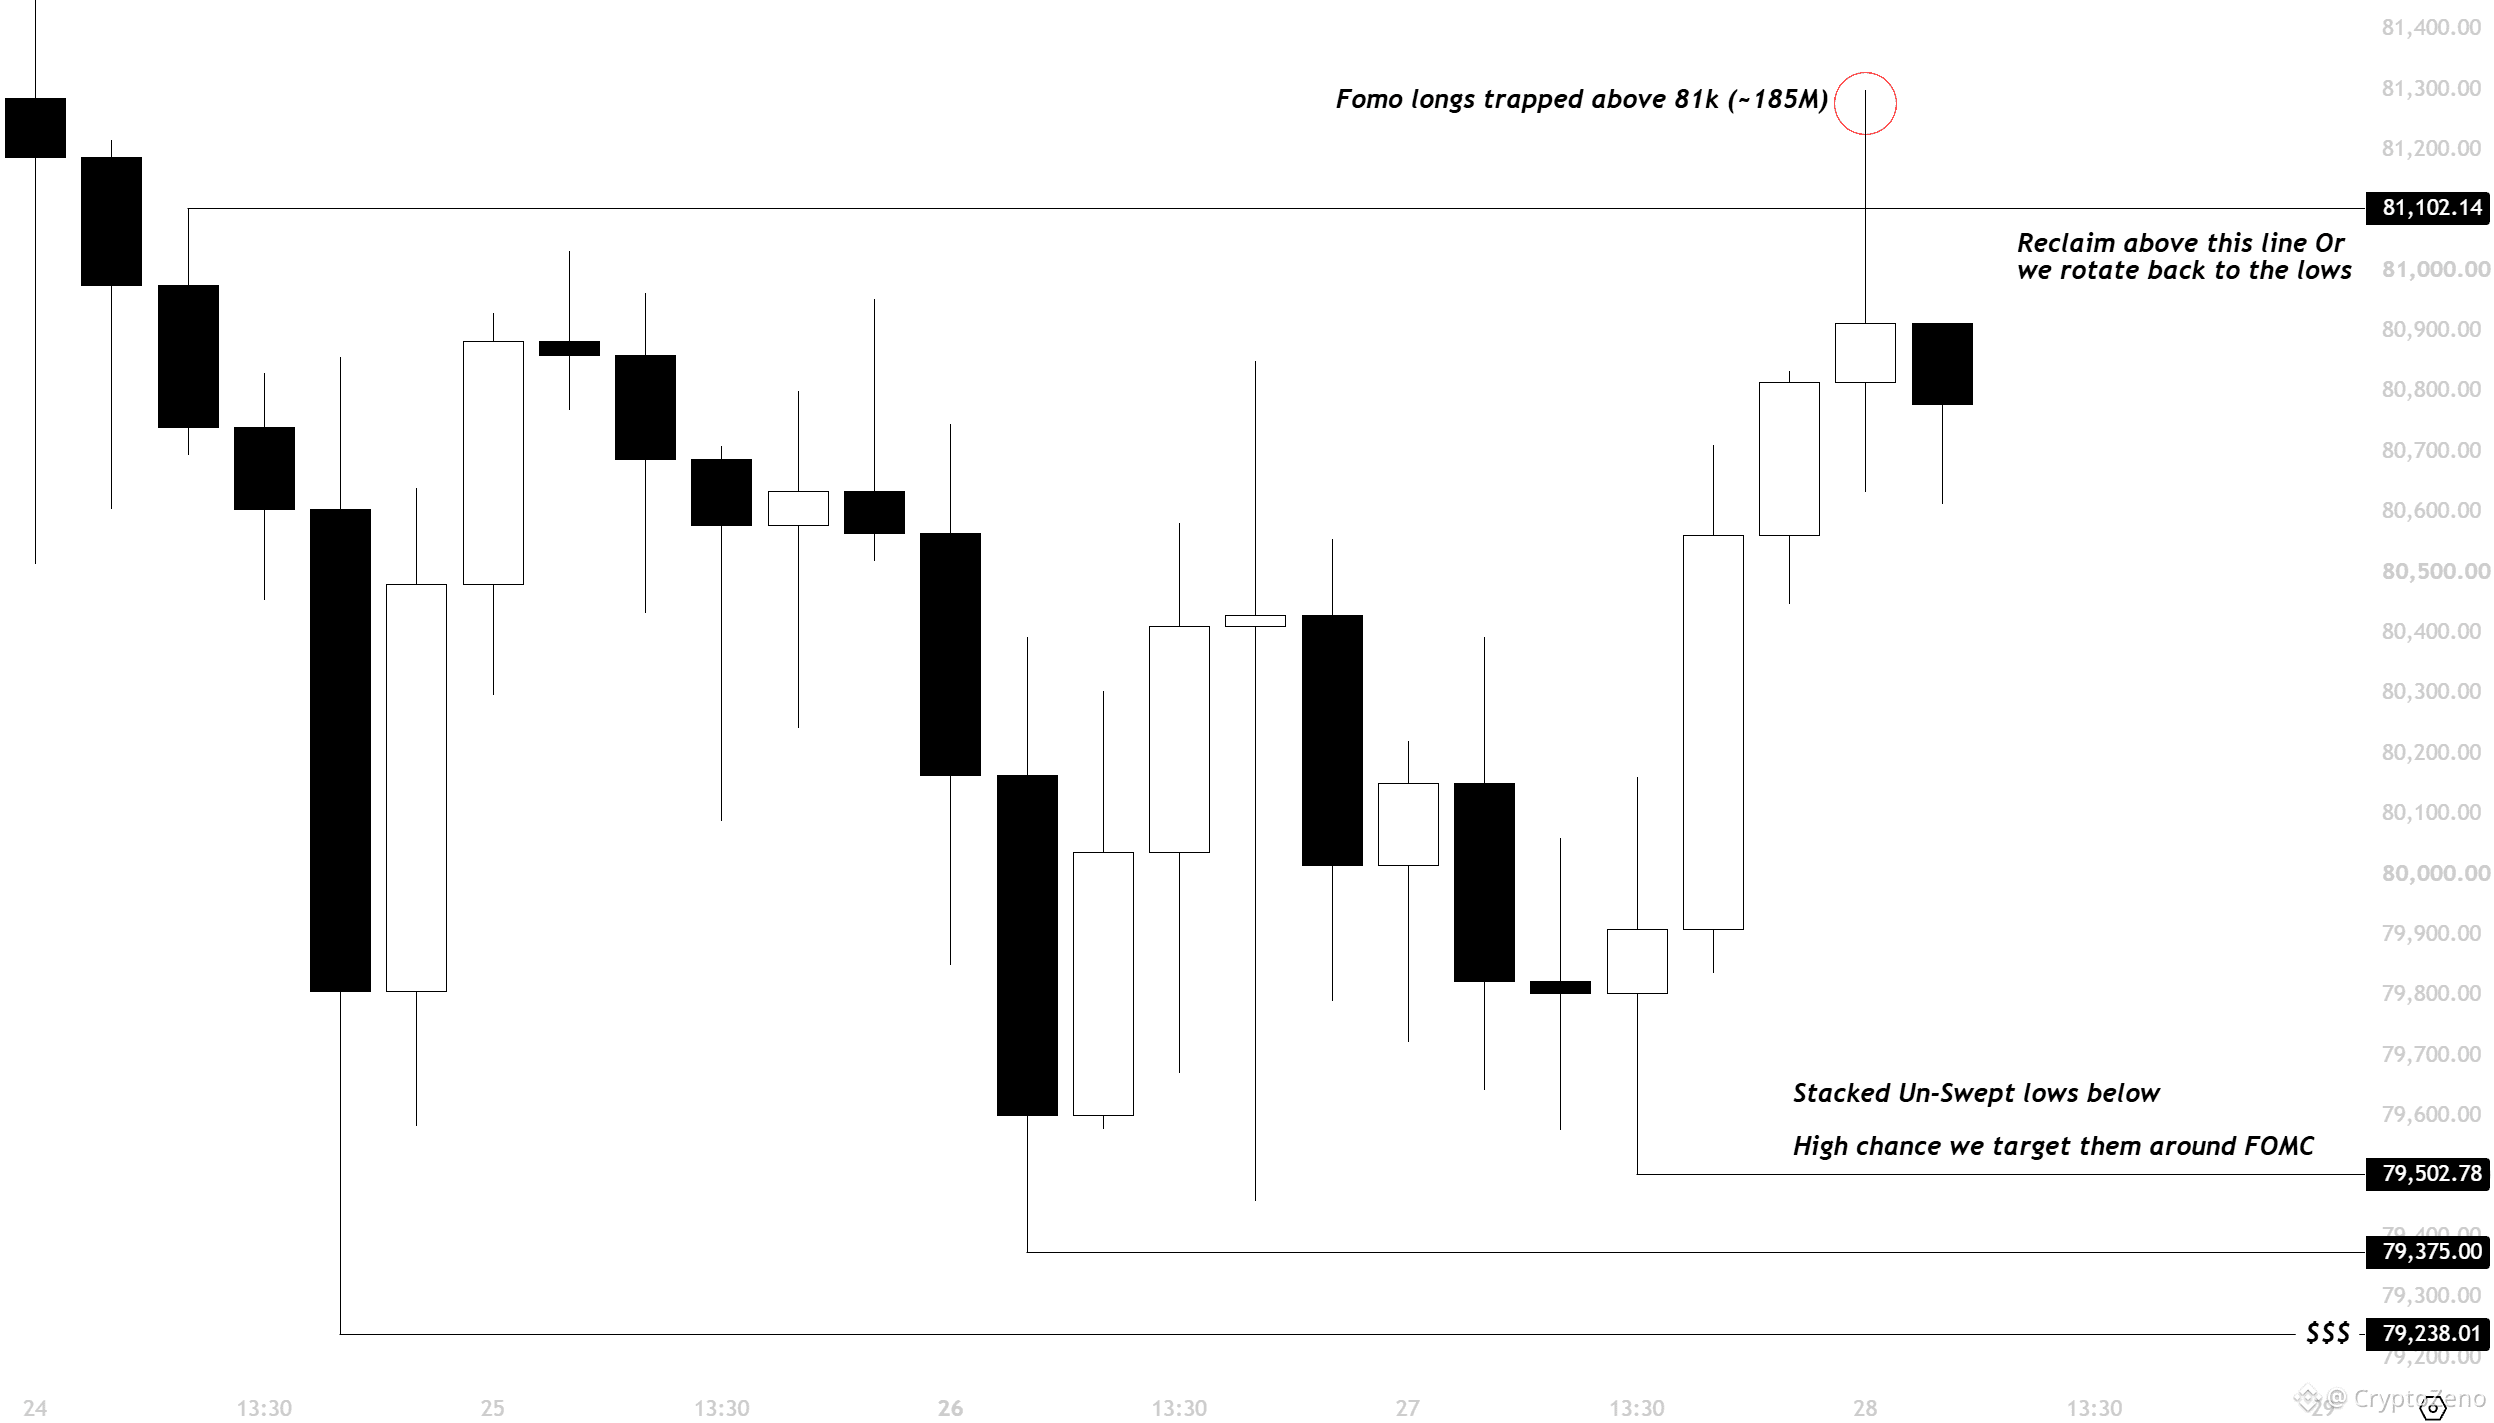
1
5
803
·
--
See translation
🎁🎁🎁 EVERY VOTE OF SUPPORT MATTERS!
👉 [VOTE NOW](https://app.binance.com/uni-qr/cact26user/516)
Every single vote brings me one step closer to my goal! ❤️
🎁 Don't forget to join my group chat for surprise gifts! And make sure to follow me so you don't miss the giveaways in my upcoming posts!
Thank you to everyone who has voted for me! If possible, please invite your friends to join too! 🤝
🎁🎁🎁 EVERY VOTE OF SUPPORT MATTERS!
👉 VOTE NOW
Every single vote brings me one step closer to my goal! ❤️
🎁 Don't forget to join my group chat for surprise gifts! And make sure to follow me so you don't miss the giveaways in my upcoming posts!
Thank you to everyone who has voted for me! If possible, please invite your friends to join too! 🤝
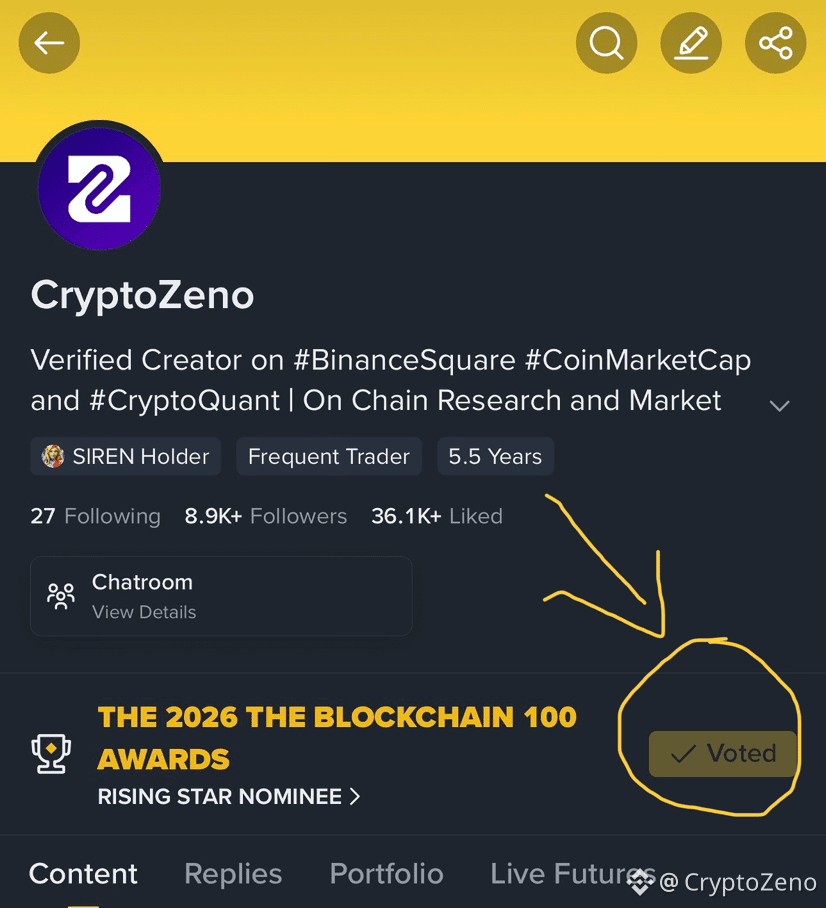
487
3
27
487
Log in to explore more content
Join global crypto users on Binance Square
⚡️ Get latest and useful information about crypto.
💬 Trusted by the world’s largest crypto exchange.
👍 Discover real insights from verified creators.
Email / Phone number
Trending Topics
FedWatch
16.3M views
39,225 Discussing
🚨 THE ALARM BELLS ARE RINGING LOUDLY AGAIN!
As you know, the FED announced its interest rate decision last night, keeping rates unchanged. Here is the situation regarding the other data that followed #FedWatch
Annual inflation rose to 3.6%, while monthly inflation climbed to 0.5%. The core PCE Personal Consumption Expenditures Price Index also reached 3.1% on an annual basis.
Although these figures align with expectations, the truly concerning aspect is that inflation has begun to accelerate once again. The FED’s 2% target still seems quite far off.
In my view, this makes it difficult to justify any interest rate cuts in the near term. If high interest rates persist for a longer period, it could create additional selling pressure on $BTC and altcoins.
Do you think crypto assets will be able to hold their ground?
Kripto Kurdu
·20 Likes
·3.9k views
EarningsSeason
6.4M views
31,931 Discussing
USMidtermElections
27,451 views
537 Discussing