Binance Square
Crypto Skull Signal
8k Posts

Crypto Skull Signal

Square Verified+
X.com/SkullSignal 👈 I’m not only a pretty face… I’ll show step by step how to beat this market, because I already did. Welcome to the family
Level 1 Creator
Level 1 Creator
1 Following
55.8K+ Followers
93.6K+ Liked
1 Badges
Posts
PINNED
·
--
Bearish
See translation
PINNED
See translation
#BITCOIN ANALYSIS I have been warning you for the last 45 days that a big dump was coming and now it’s playing out exactly. Bitcoin has already dumped around $20K and is now trading near 112K, right at the major resistance zone that has triggered every big correction since 2018. A small bounce to 115K–116K is possible, but after that I expect another leg down toward 100K, and potentially lower to 90K. I’m still holding my 50% short position. If anything changes or I close my position, I’ll update you. Remember I mentioned earlier that if BTC went back to 125K–128K, I would add more shorts and that plan hasn’t changed. Till Monday, I expect some volatility, but Monday’s price action will give a clearer direction. 🔸 Weekly: BTC touched the long-term trendline again → clear rejection happened. 👉 Until we get a weekly close above 125K, the risk of a major pullback stays high. 🔸 Daily: Price is inside the 110K–125K supply zone. Structure is weak. If price breaks and resists below 110K, then 100K is the next target. 📊 My Trade: ✅ First target 105K hit Holding 50% shorts, expecting a bounce to 115K, then lower. 📌 Downside Targets: 105K ✅ → 100K → 95K → 90K $BTC #TrumpTariffs {future}(BTCUSDT)
#BITCOIN ANALYSIS

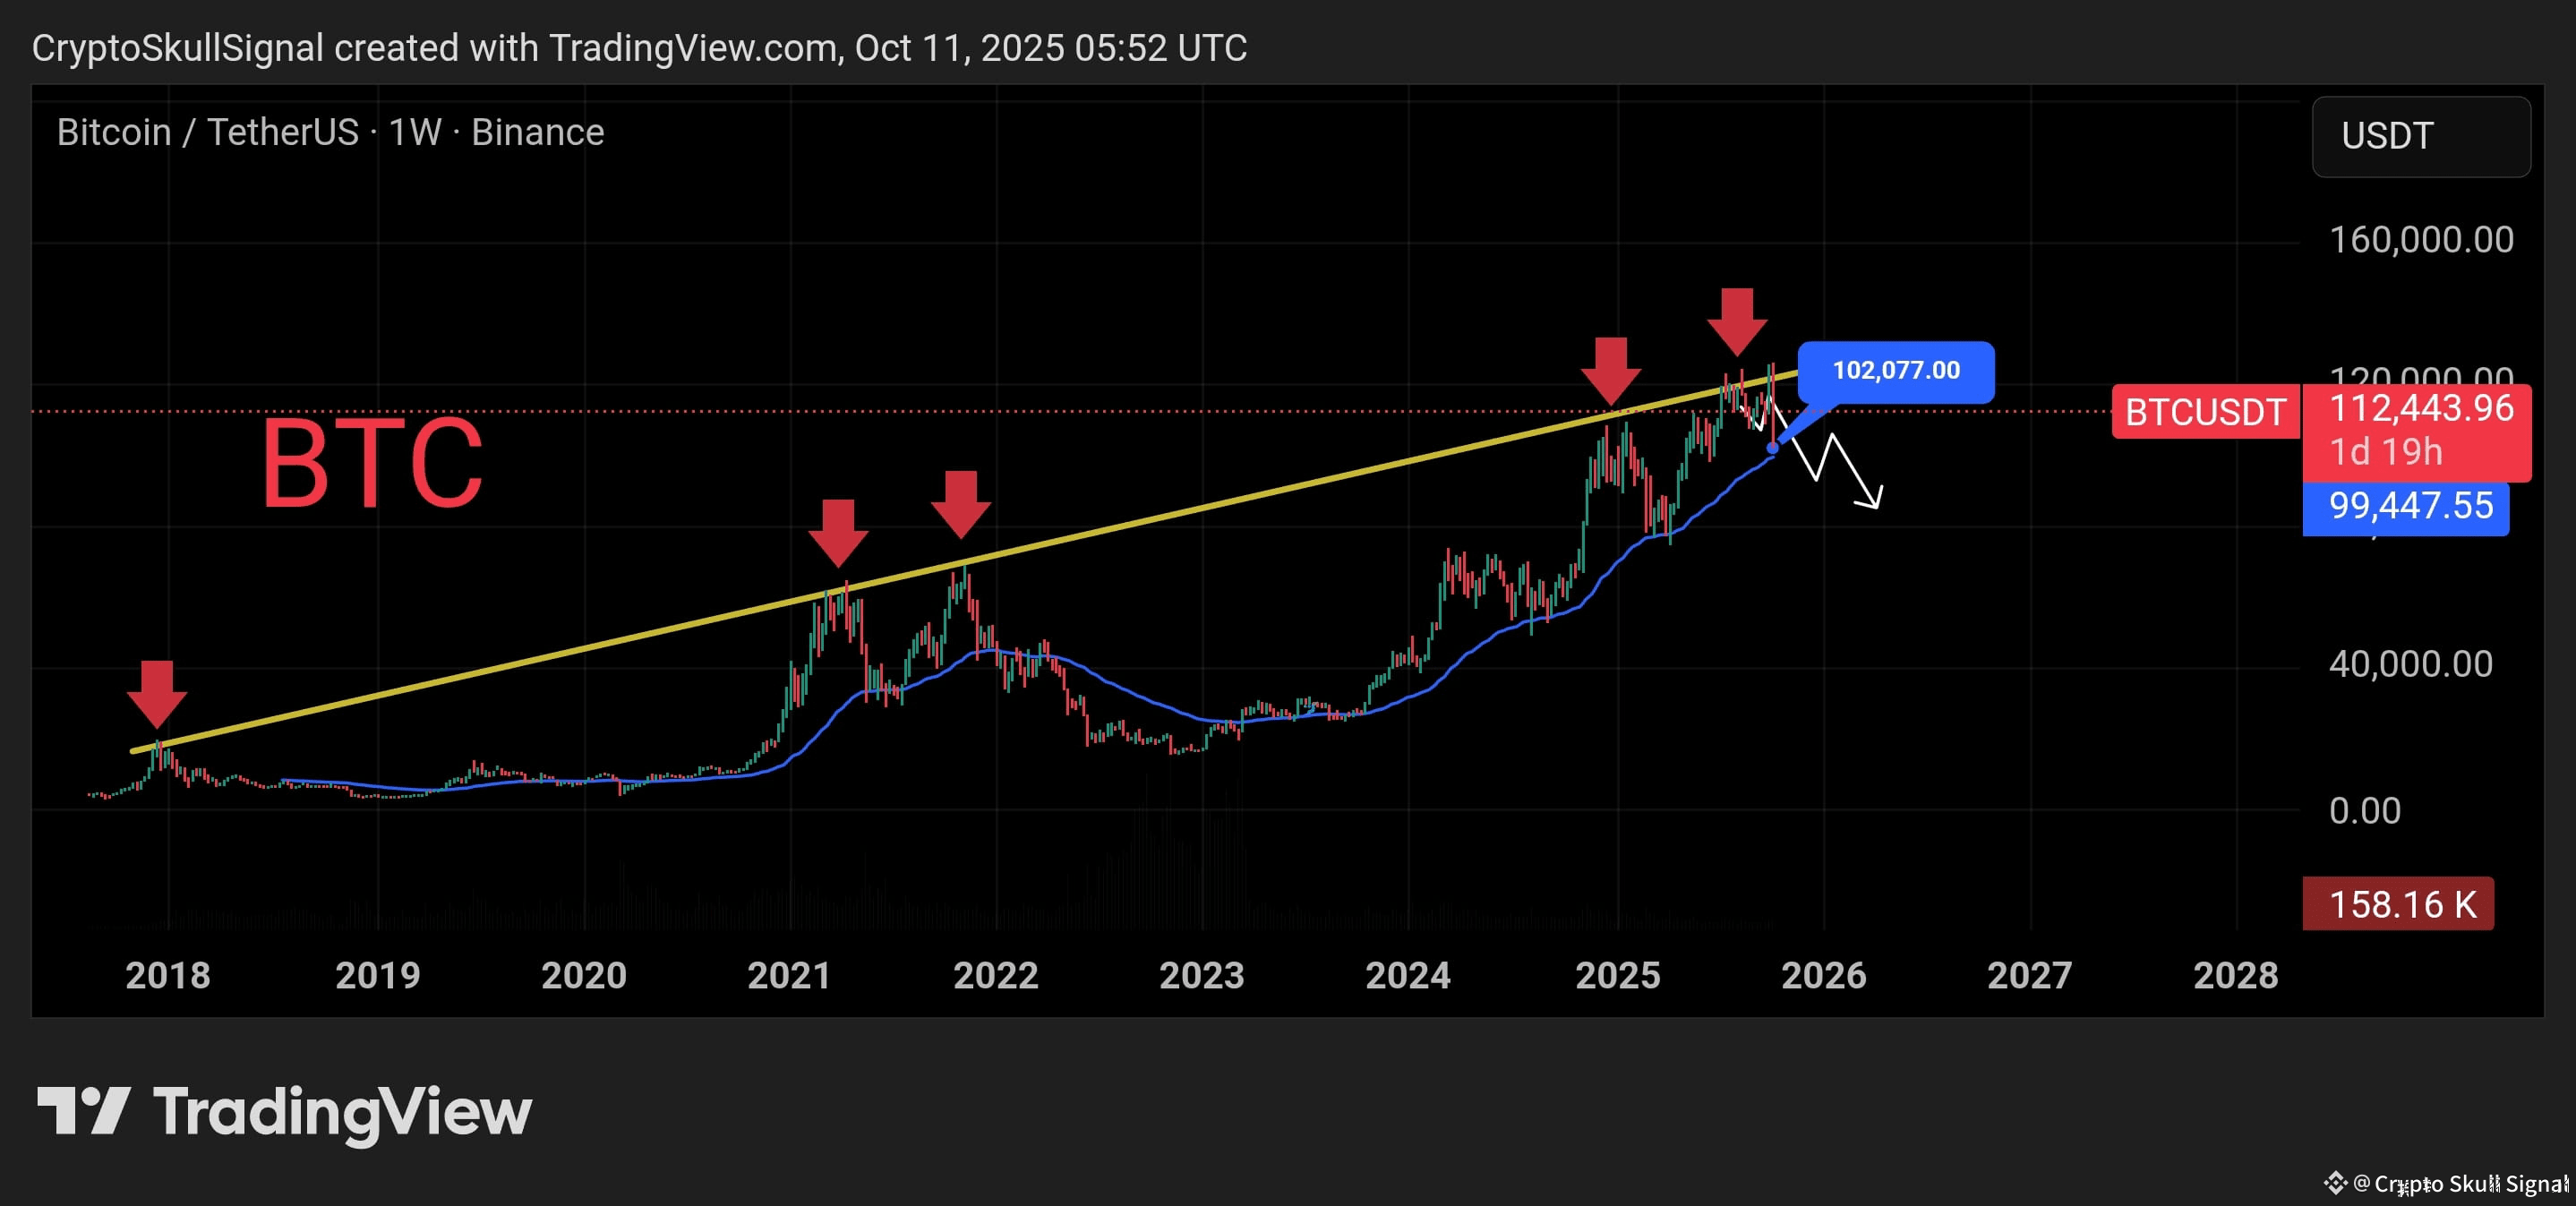
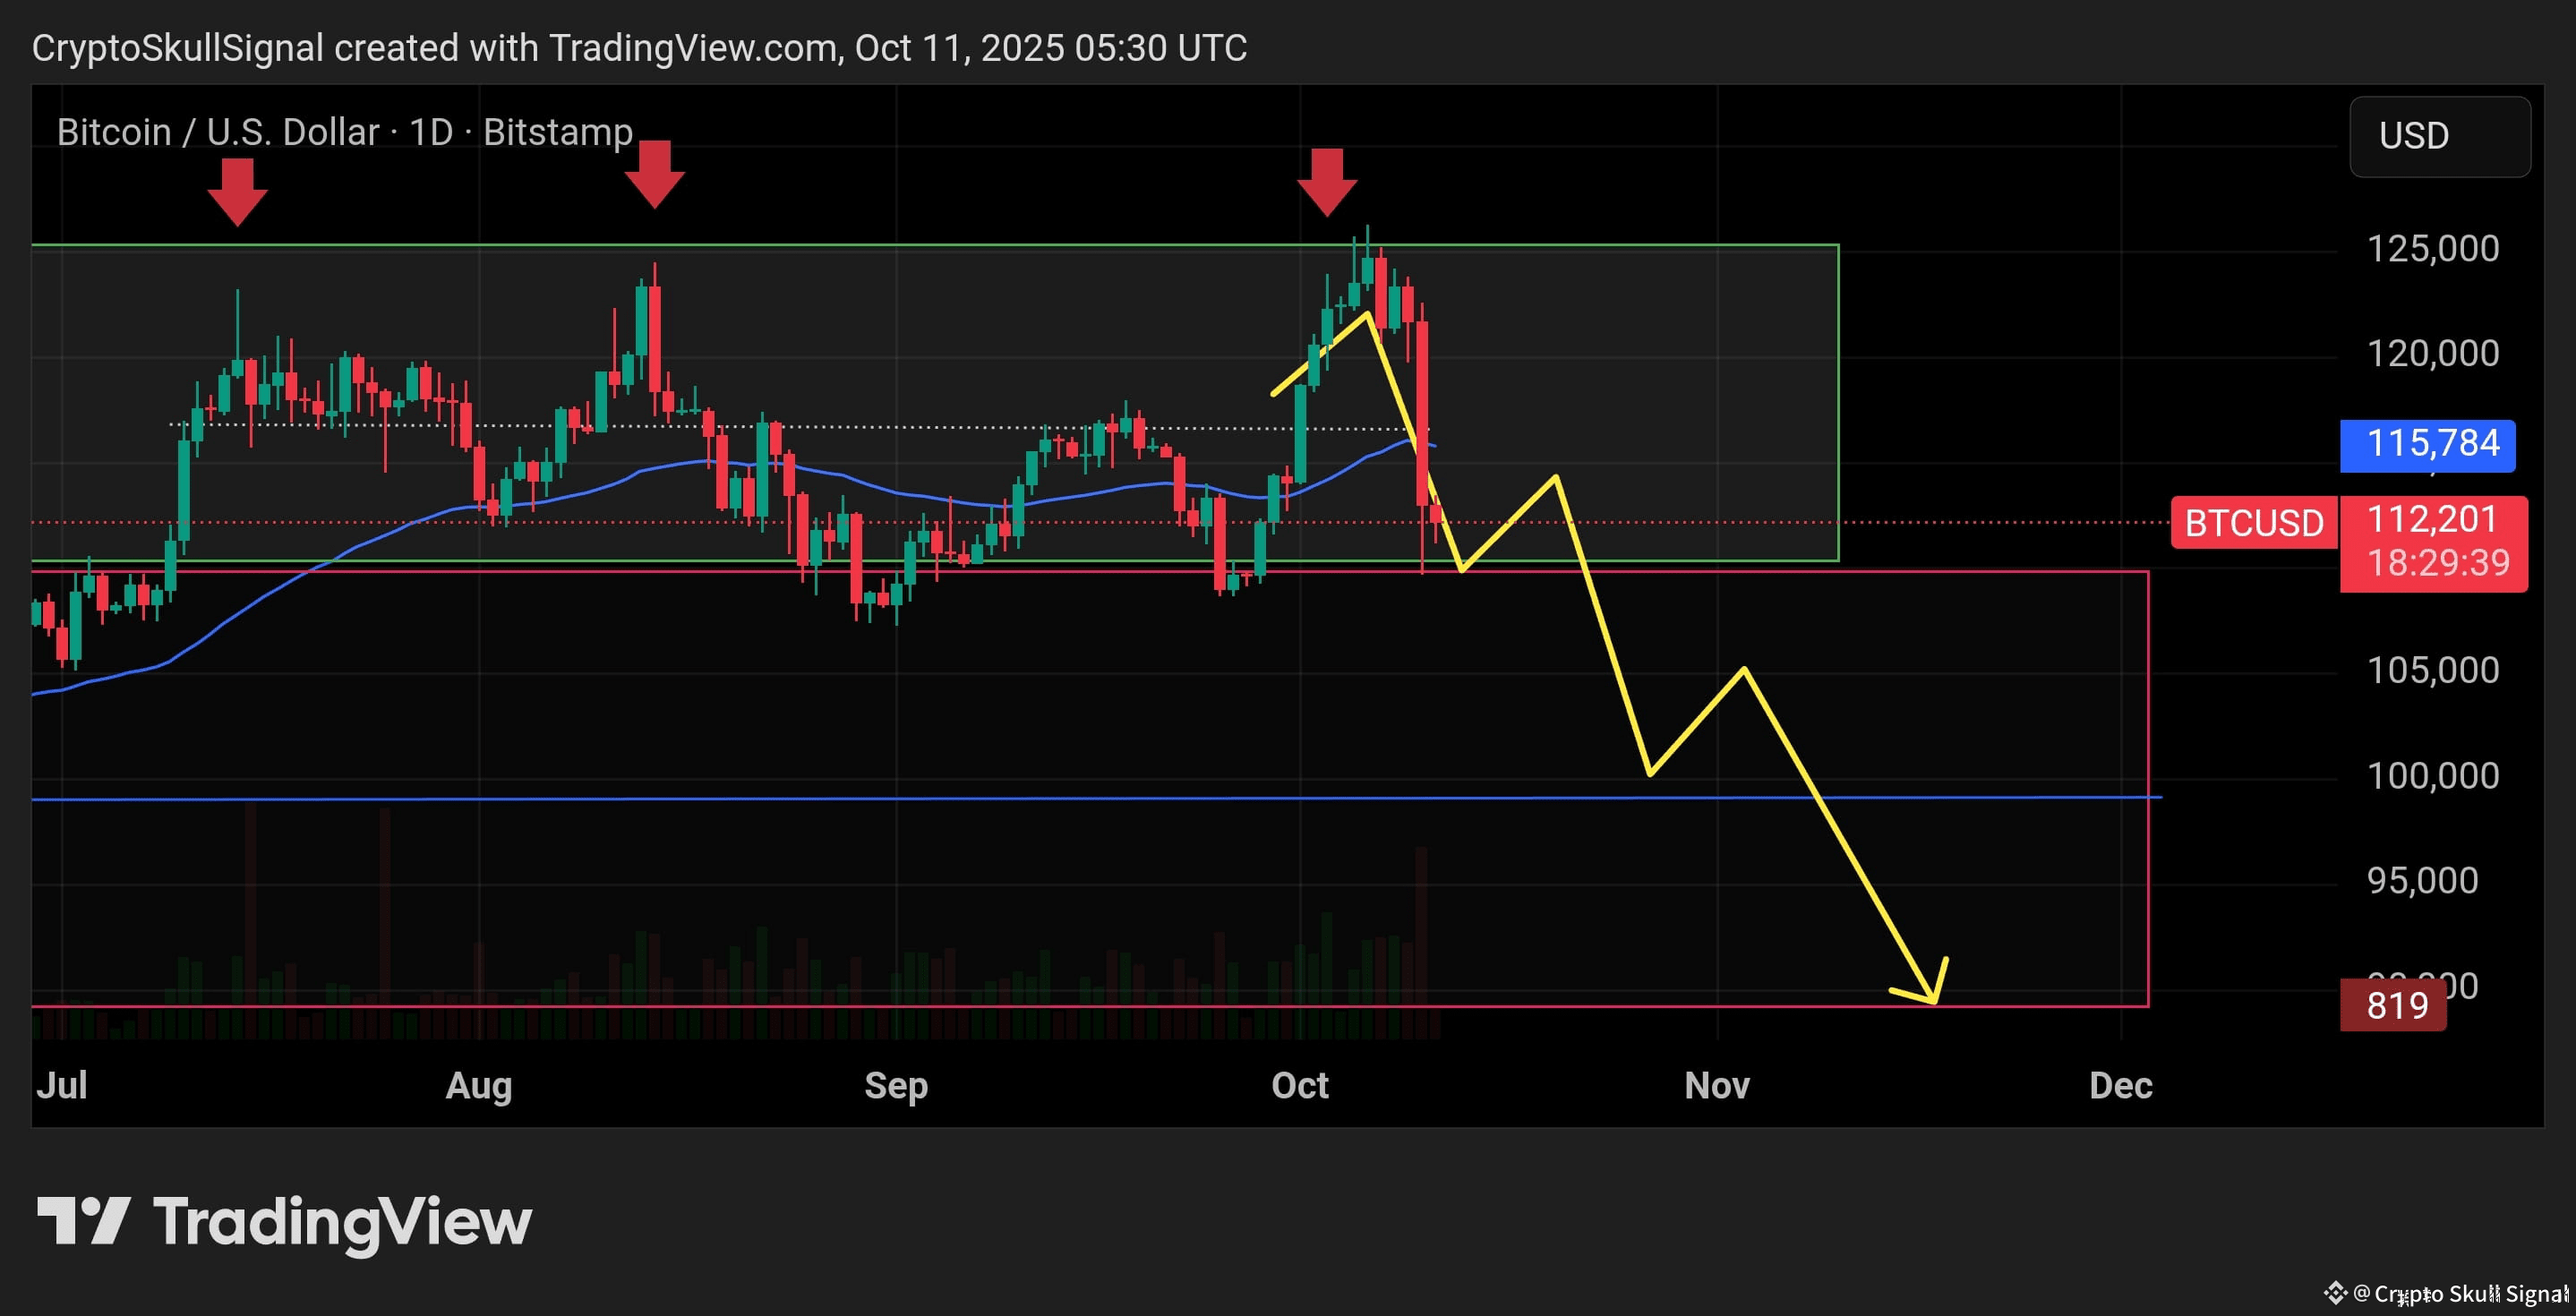
I have been warning you for the last 45 days that a big dump was coming and now it’s playing out exactly. Bitcoin has already dumped around $20K and is now trading near 112K, right at the major resistance zone that has triggered every big correction since 2018.

A small bounce to 115K–116K is possible, but after that I expect another leg down toward 100K, and potentially lower to 90K.
I’m still holding my 50% short position. If anything changes or I close my position, I’ll update you. Remember I mentioned earlier that if BTC went back to 125K–128K, I would add more shorts and that plan hasn’t changed.

Till Monday, I expect some volatility, but Monday’s price action will give a clearer direction.

🔸 Weekly:
BTC touched the long-term trendline again → clear rejection happened.
👉 Until we get a weekly close above 125K, the risk of a major pullback stays high.

🔸 Daily:
Price is inside the 110K–125K supply zone. Structure is weak.
If price breaks and resists below 110K, then 100K is the next target.

📊 My Trade:

✅ First target 105K hit
Holding 50% shorts, expecting a bounce to 115K, then lower.

📌 Downside Targets: 105K ✅ → 100K → 95K → 90K

$BTC #TrumpTariffs
Crypto Skull Signal
·
--
Bearish
#BITCOIN ANALYSIS

For the last 40 days I’ve been telling you guys I’m bearish on $BTC. We already dropped almost 8K twice, but every time Bitcoin reclaimed the levels again. Right now it’s trading around 18K to 119k but nothing has changed for me. I’m still bearish.

I’ve said many times that the 115K to 124K region is a short zone, not a long zone. If you’re still holding longs, I’d strongly suggest you flip to shorts because the chart is flashing multiple top signals.

Don’t get trapped by hype like “Bitcoin to 1 million by the end of this year.” That’s just noise. The structure is weak, liquidity is being engineered, and the bigger downside move is still ahead.

📌 Downside Targets:
105K → 100K → 95K → 90K

$BTC
·
--
Bullish
See translation
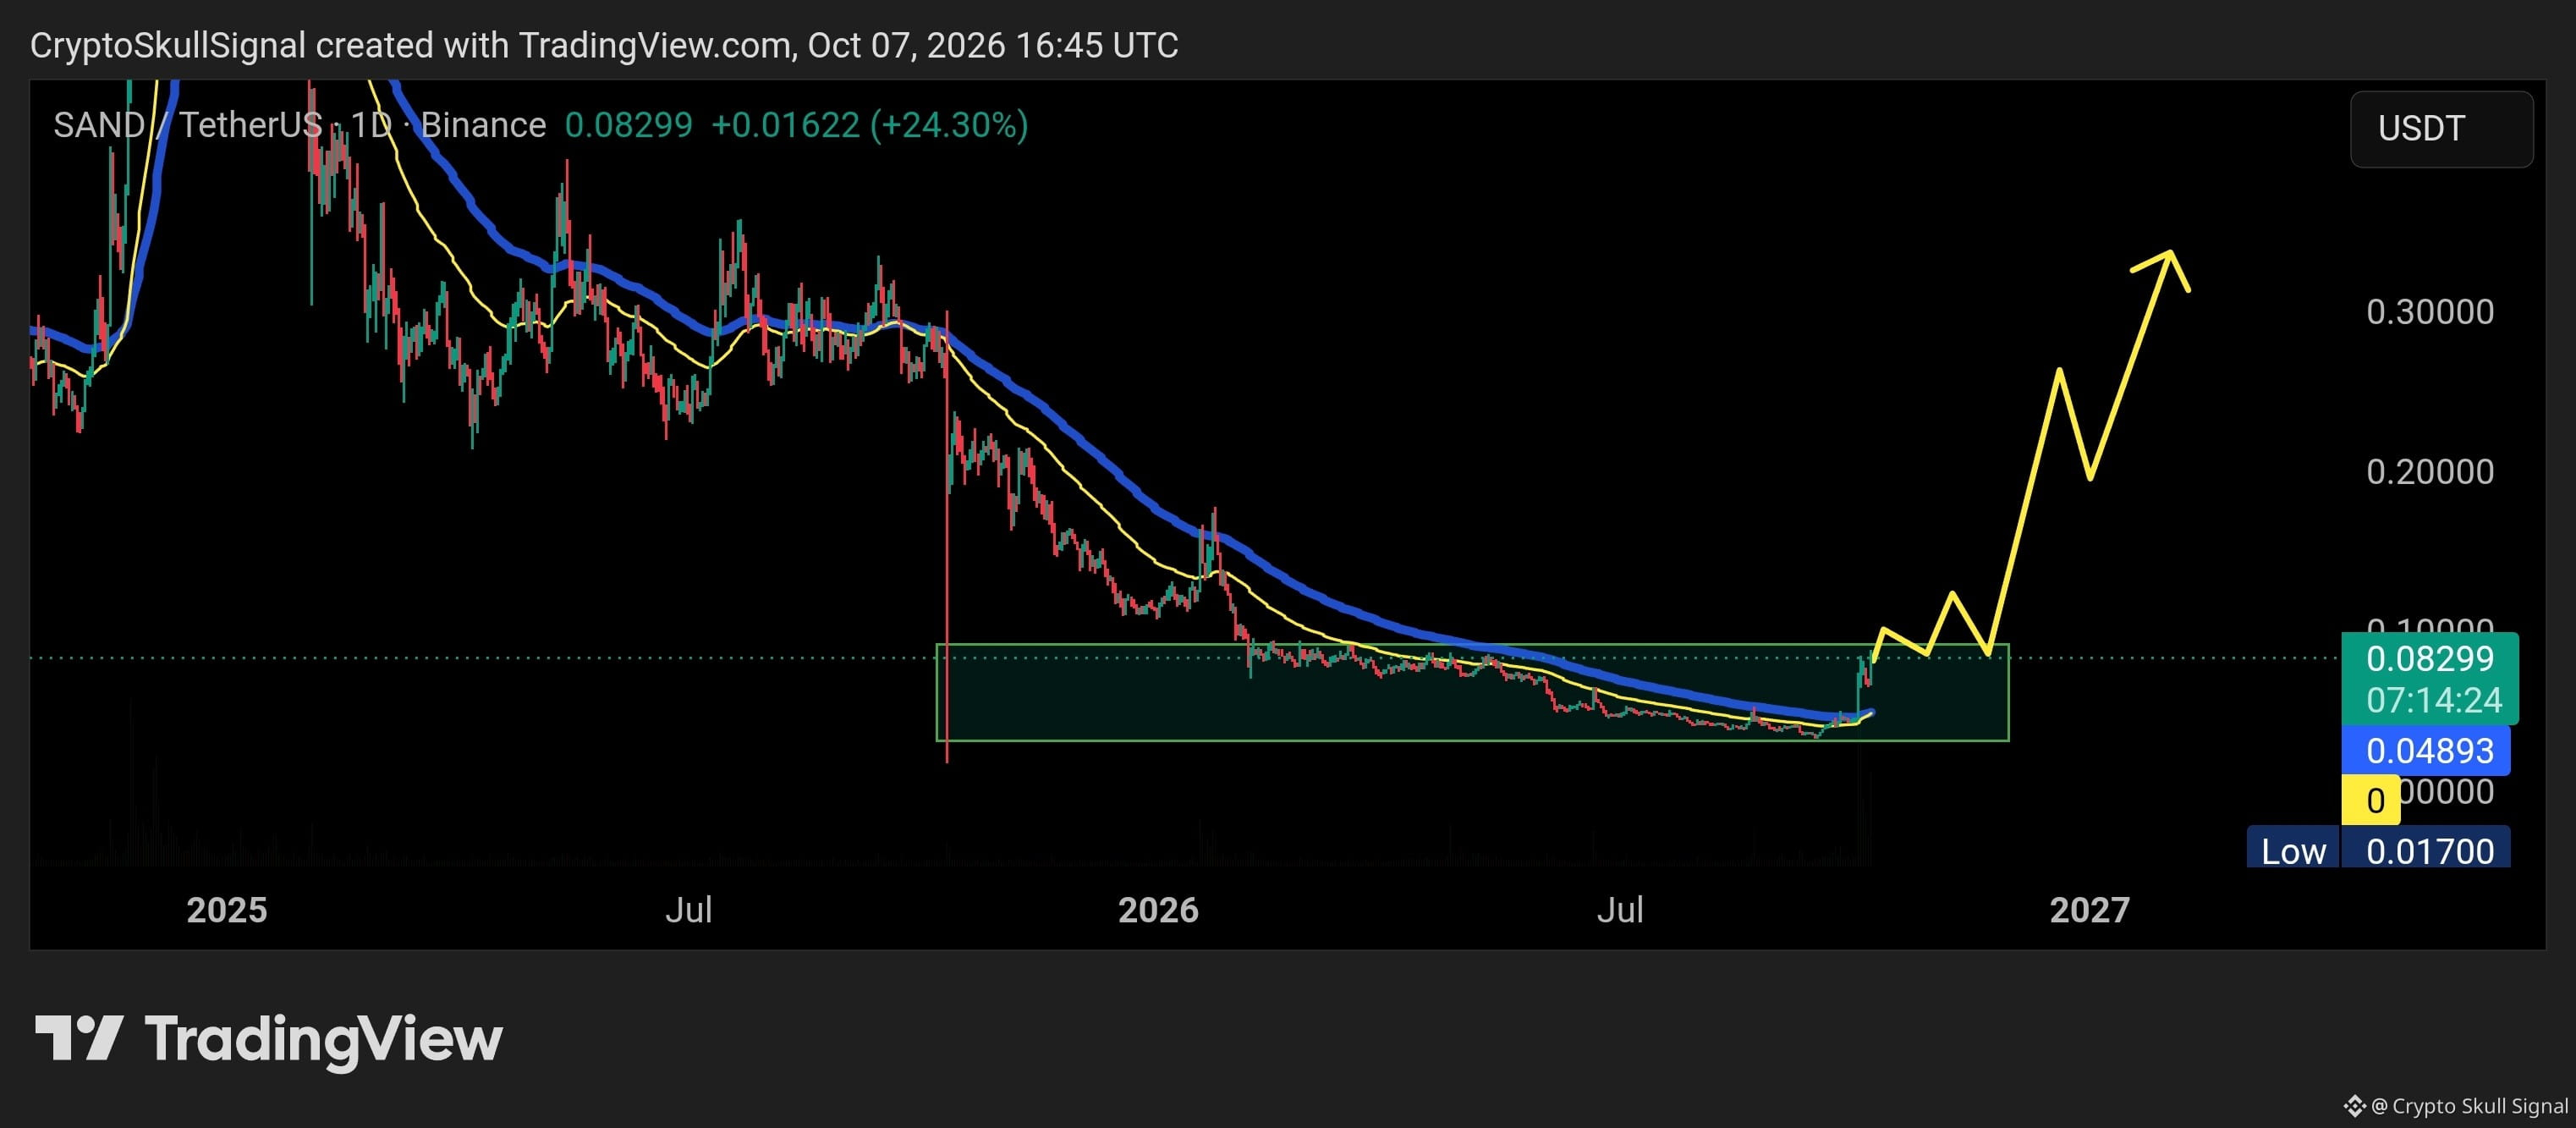
$SAND is finally breaking out of its long accumulation zone. {future}(SANDUSDT) The key now is not just the breakout. We need to see price hold above the breakout zone and turn this area into support. If SAND holds above this level, the structure looks much stronger and I expect the upside move to continue. The chart is showing a clear shift after a long period of accumulation and compression. Breakout → hold above the zone → retest → continuation. If the breakout holds, I’ll be watching the higher resistance levels for the next major move.
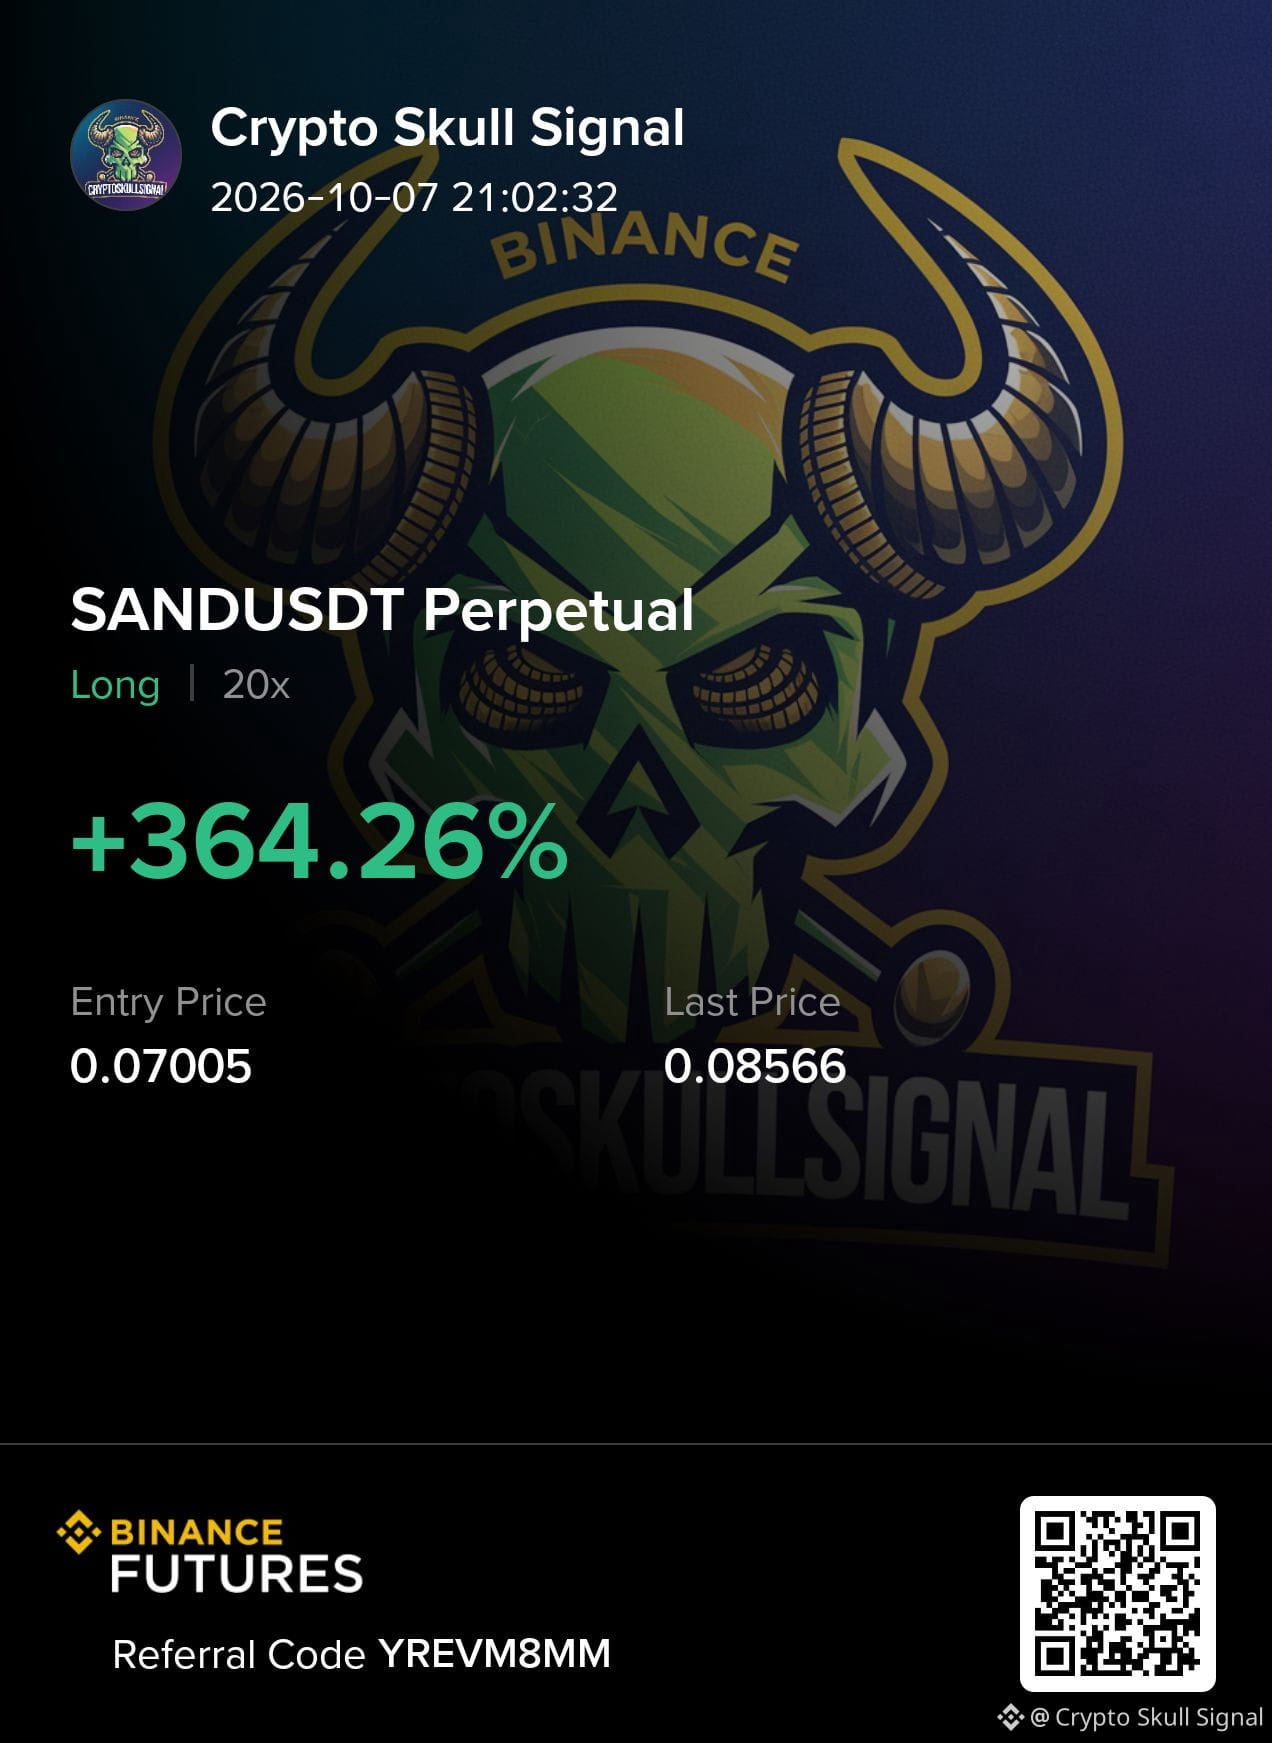
$SAND is finally breaking out of its long accumulation zone.

The key now is not just the breakout. We need to see price hold above the breakout zone and turn this area into support.

If SAND holds above this level, the structure looks much stronger and I expect the upside move to continue. The chart is showing a clear shift after a long period of accumulation and compression.

Breakout → hold above the zone → retest → continuation.

If the breakout holds, I’ll be watching the higher resistance levels for the next major move.
See translation
$SAND /USDT Take-Profit 🚨 ALL TARGETS DONE ✅🚀 Profit: 182.13% with 10x 📈 {future}(SANDUSDT)
$SAND /USDT Take-Profit 🚨

ALL TARGETS DONE ✅🚀

Profit: 182.13% with 10x 📈
Crypto Skull Signal
·
--
$SAND/USDT

🟢 LONG 10X

📍 Entry: 0.07000

🎯 Targets:

TP1: 0.07070
TP2: 0.07140
TP3: 0.07280
TP4: 0.07420
TP5: 0.07630
TP6: 0.07840

❌ Stop Loss: 0.0652

⚠️ Risk: Highly risky trade
See translation
$SAND/USDT Take-Profit TARGET 4 DONE ✅ Profit: 60.89% with 10x 📈
$SAND/USDT Take-Profit

TARGET 4 DONE ✅

Profit: 60.89% with 10x 📈
Crypto Skull Signal
·
--
$SAND/USDT

🟢 LONG 10X

📍 Entry: 0.07000

🎯 Targets:

TP1: 0.07070
TP2: 0.07140
TP3: 0.07280
TP4: 0.07420
TP5: 0.07630
TP6: 0.07840

❌ Stop Loss: 0.0652

⚠️ Risk: Highly risky trade
See translation
$SAND /USDT Take-Profit TARGET 2 DONE ✅ Profit: 20.56% with 10x 📈 {future}(SANDUSDT)
$SAND /USDT Take-Profit

TARGET 2 DONE ✅

Profit: 20.56% with 10x 📈
Crypto Skull Signal
·
--
$SAND/USDT

🟢 LONG 10X

📍 Entry: 0.07000

🎯 Targets:

TP1: 0.07070
TP2: 0.07140
TP3: 0.07280
TP4: 0.07420
TP5: 0.07630
TP6: 0.07840

❌ Stop Loss: 0.0652

⚠️ Risk: Highly risky trade
See translation
$SAND/USDT 🟢 LONG 10X 📍 Entry: 0.07000 🎯 Targets: TP1: 0.07070 TP2: 0.07140 TP3: 0.07280 TP4: 0.07420 TP5: 0.07630 TP6: 0.07840 ❌ Stop Loss: 0.0652 ⚠️ Risk: Highly risky trade
$SAND/USDT

🟢 LONG 10X

📍 Entry: 0.07000

🎯 Targets:

TP1: 0.07070
TP2: 0.07140
TP3: 0.07280
TP4: 0.07420
TP5: 0.07630
TP6: 0.07840

❌ Stop Loss: 0.0652

⚠️ Risk: Highly risky trade
See translation
$HYPE/USDT Take-Profit TARGET 3 DONE ✅ Profit: 42.76% with 10x 📈
$HYPE/USDT Take-Profit

TARGET 3 DONE ✅

Profit: 42.76% with 10x 📈
Crypto Skull Signal
·
--
$HYPE/USDT

🔴 SHORT 10X

📍 Entry: 93.04

🎯 Targets:

TP1: 92.11
TP2: 91.18
TP3: 89.32
TP4: 87.46
TP5: 84.67
TP6: 81.88

❌ Stop Loss: 99.23
See translation
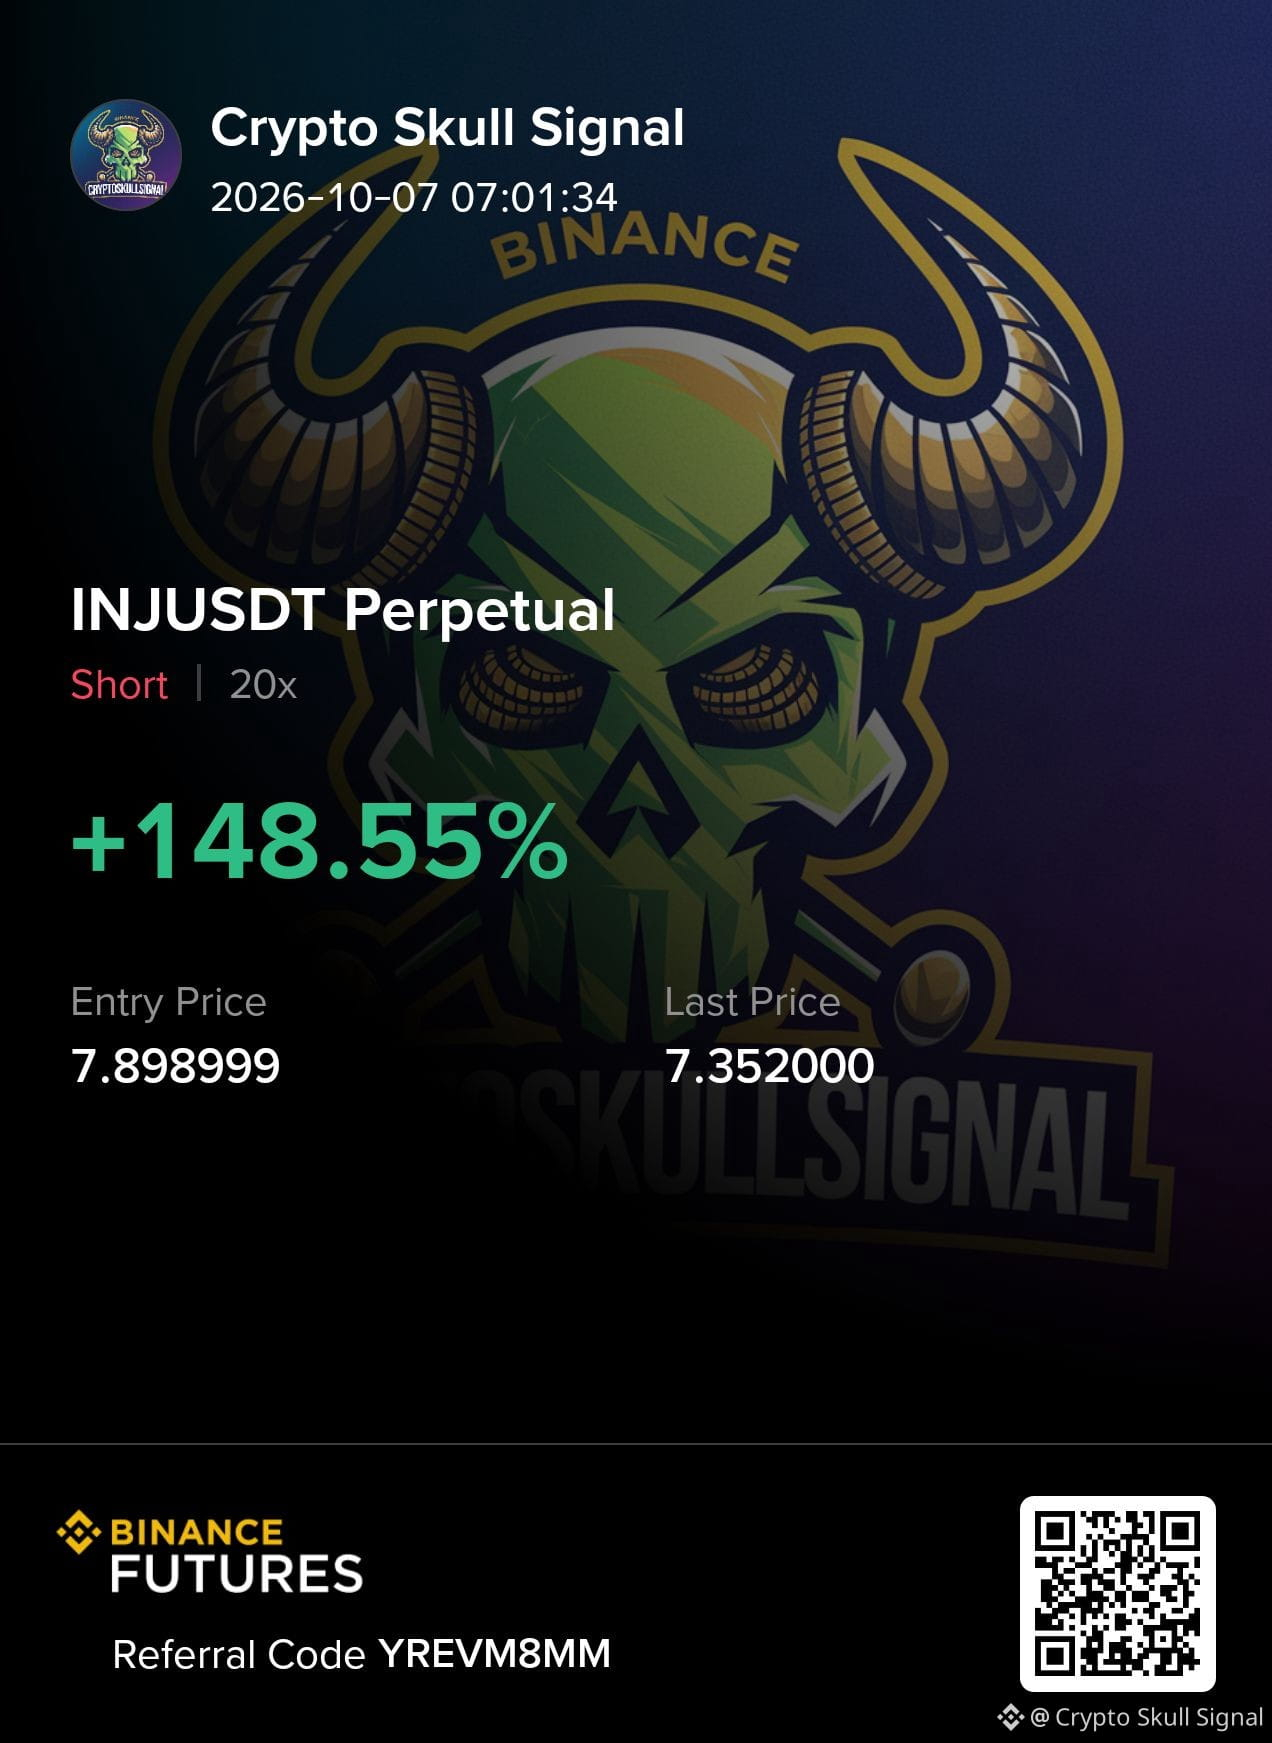
$INJ/USDT Take-Profit TARGET 4 DONE ✅ Profit: 74.26% with 10x 📈
$INJ/USDT Take-Profit

TARGET 4 DONE ✅

Profit: 74.26% with 10x 📈
Crypto Skull Signal
·
--
$INJ/USDT

🔴 SHORT 10X

📍 Entry: 7.898

🎯 Targets:

TP1: 7.819
TP2: 7.740
TP3: 7.582
TP4: 7.424
TP5: 7.187
TP6: 6.950

❌ Stop Loss: 8.455
See translation
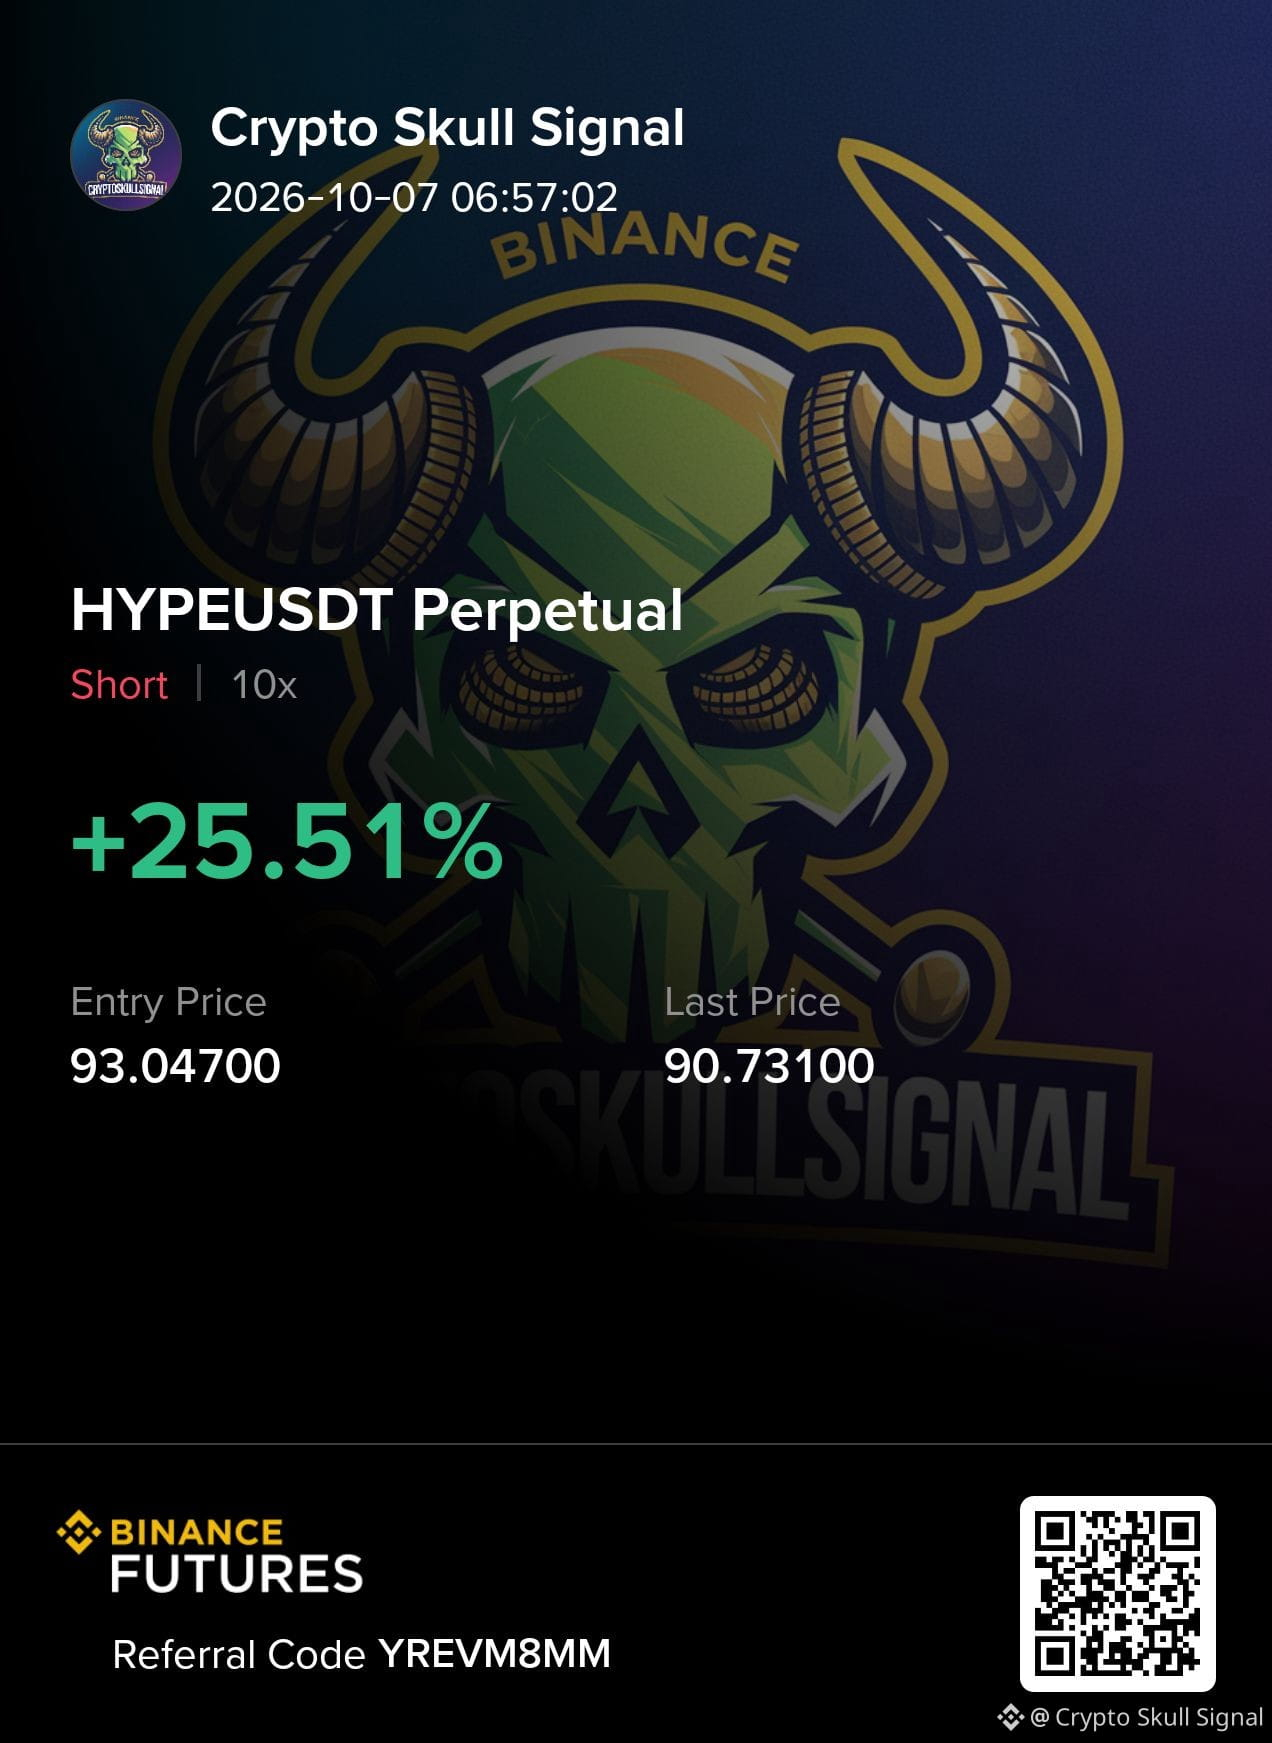
$HYPE /USDT Take-Profit TARGET 2 DONE ✅ Profit: 25.51% with 10x 📈 {future}(HYPEUSDT)
$HYPE /USDT Take-Profit

TARGET 2 DONE ✅

Profit: 25.51% with 10x 📈
Crypto Skull Signal
·
--
$HYPE/USDT

🔴 SHORT 10X

📍 Entry: 93.04

🎯 Targets:

TP1: 92.11
TP2: 91.18
TP3: 89.32
TP4: 87.46
TP5: 84.67
TP6: 81.88

❌ Stop Loss: 99.23
See translation
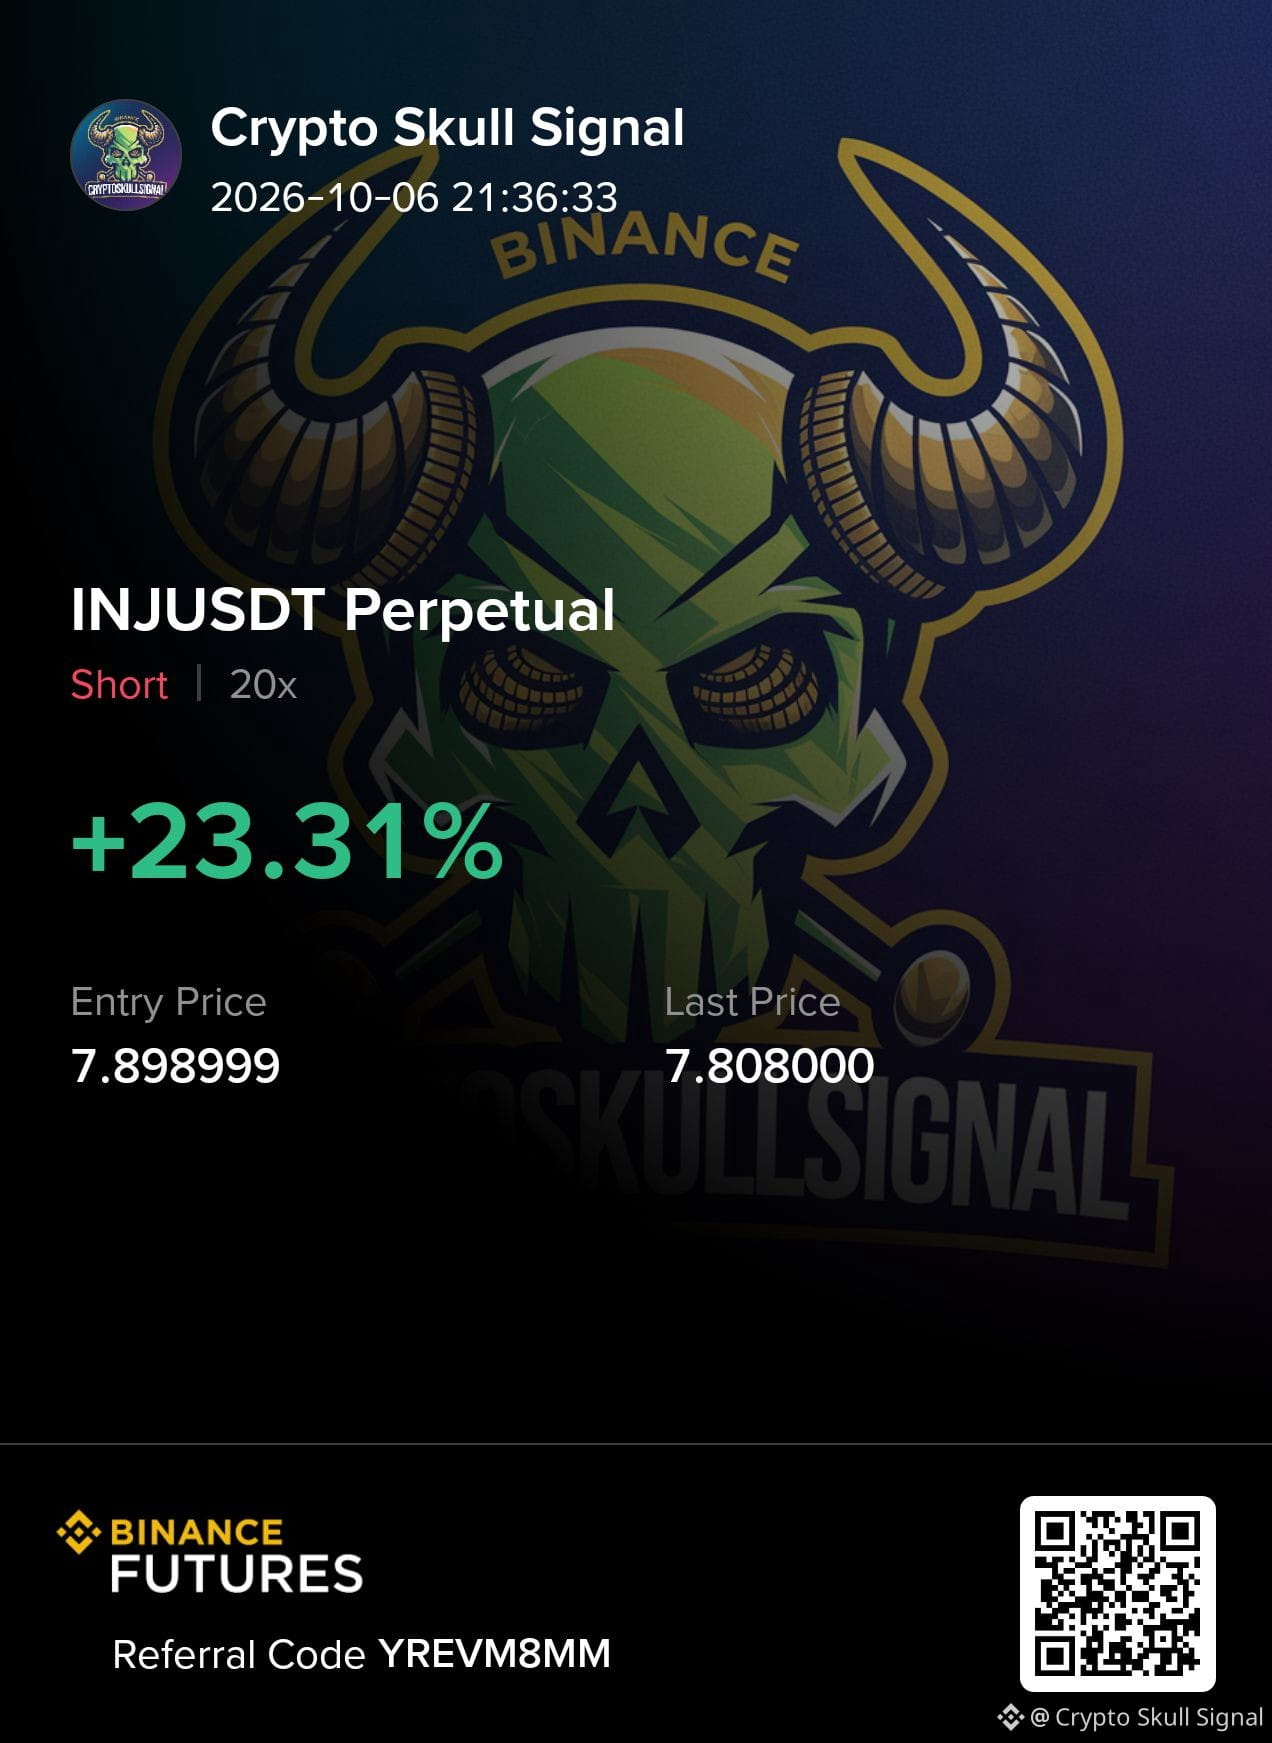
$INJ /USDT Take-Profit TARGET 1 DONE ✅ Profit: 11.72% with 10x 📈
$INJ /USDT Take-Profit

TARGET 1 DONE ✅

Profit: 11.72% with 10x 📈
Crypto Skull Signal
·
--
$INJ/USDT

🔴 SHORT 10X

📍 Entry: 7.898

🎯 Targets:

TP1: 7.819
TP2: 7.740
TP3: 7.582
TP4: 7.424
TP5: 7.187
TP6: 6.950

❌ Stop Loss: 8.455
See translation
$INJ/USDT 🔴 SHORT 10X 📍 Entry: 7.898 🎯 Targets: TP1: 7.819 TP2: 7.740 TP3: 7.582 TP4: 7.424 TP5: 7.187 TP6: 6.950 ❌ Stop Loss: 8.455
$INJ/USDT

🔴 SHORT 10X

📍 Entry: 7.898

🎯 Targets:

TP1: 7.819
TP2: 7.740
TP3: 7.582
TP4: 7.424
TP5: 7.187
TP6: 6.950

❌ Stop Loss: 8.455
See translation
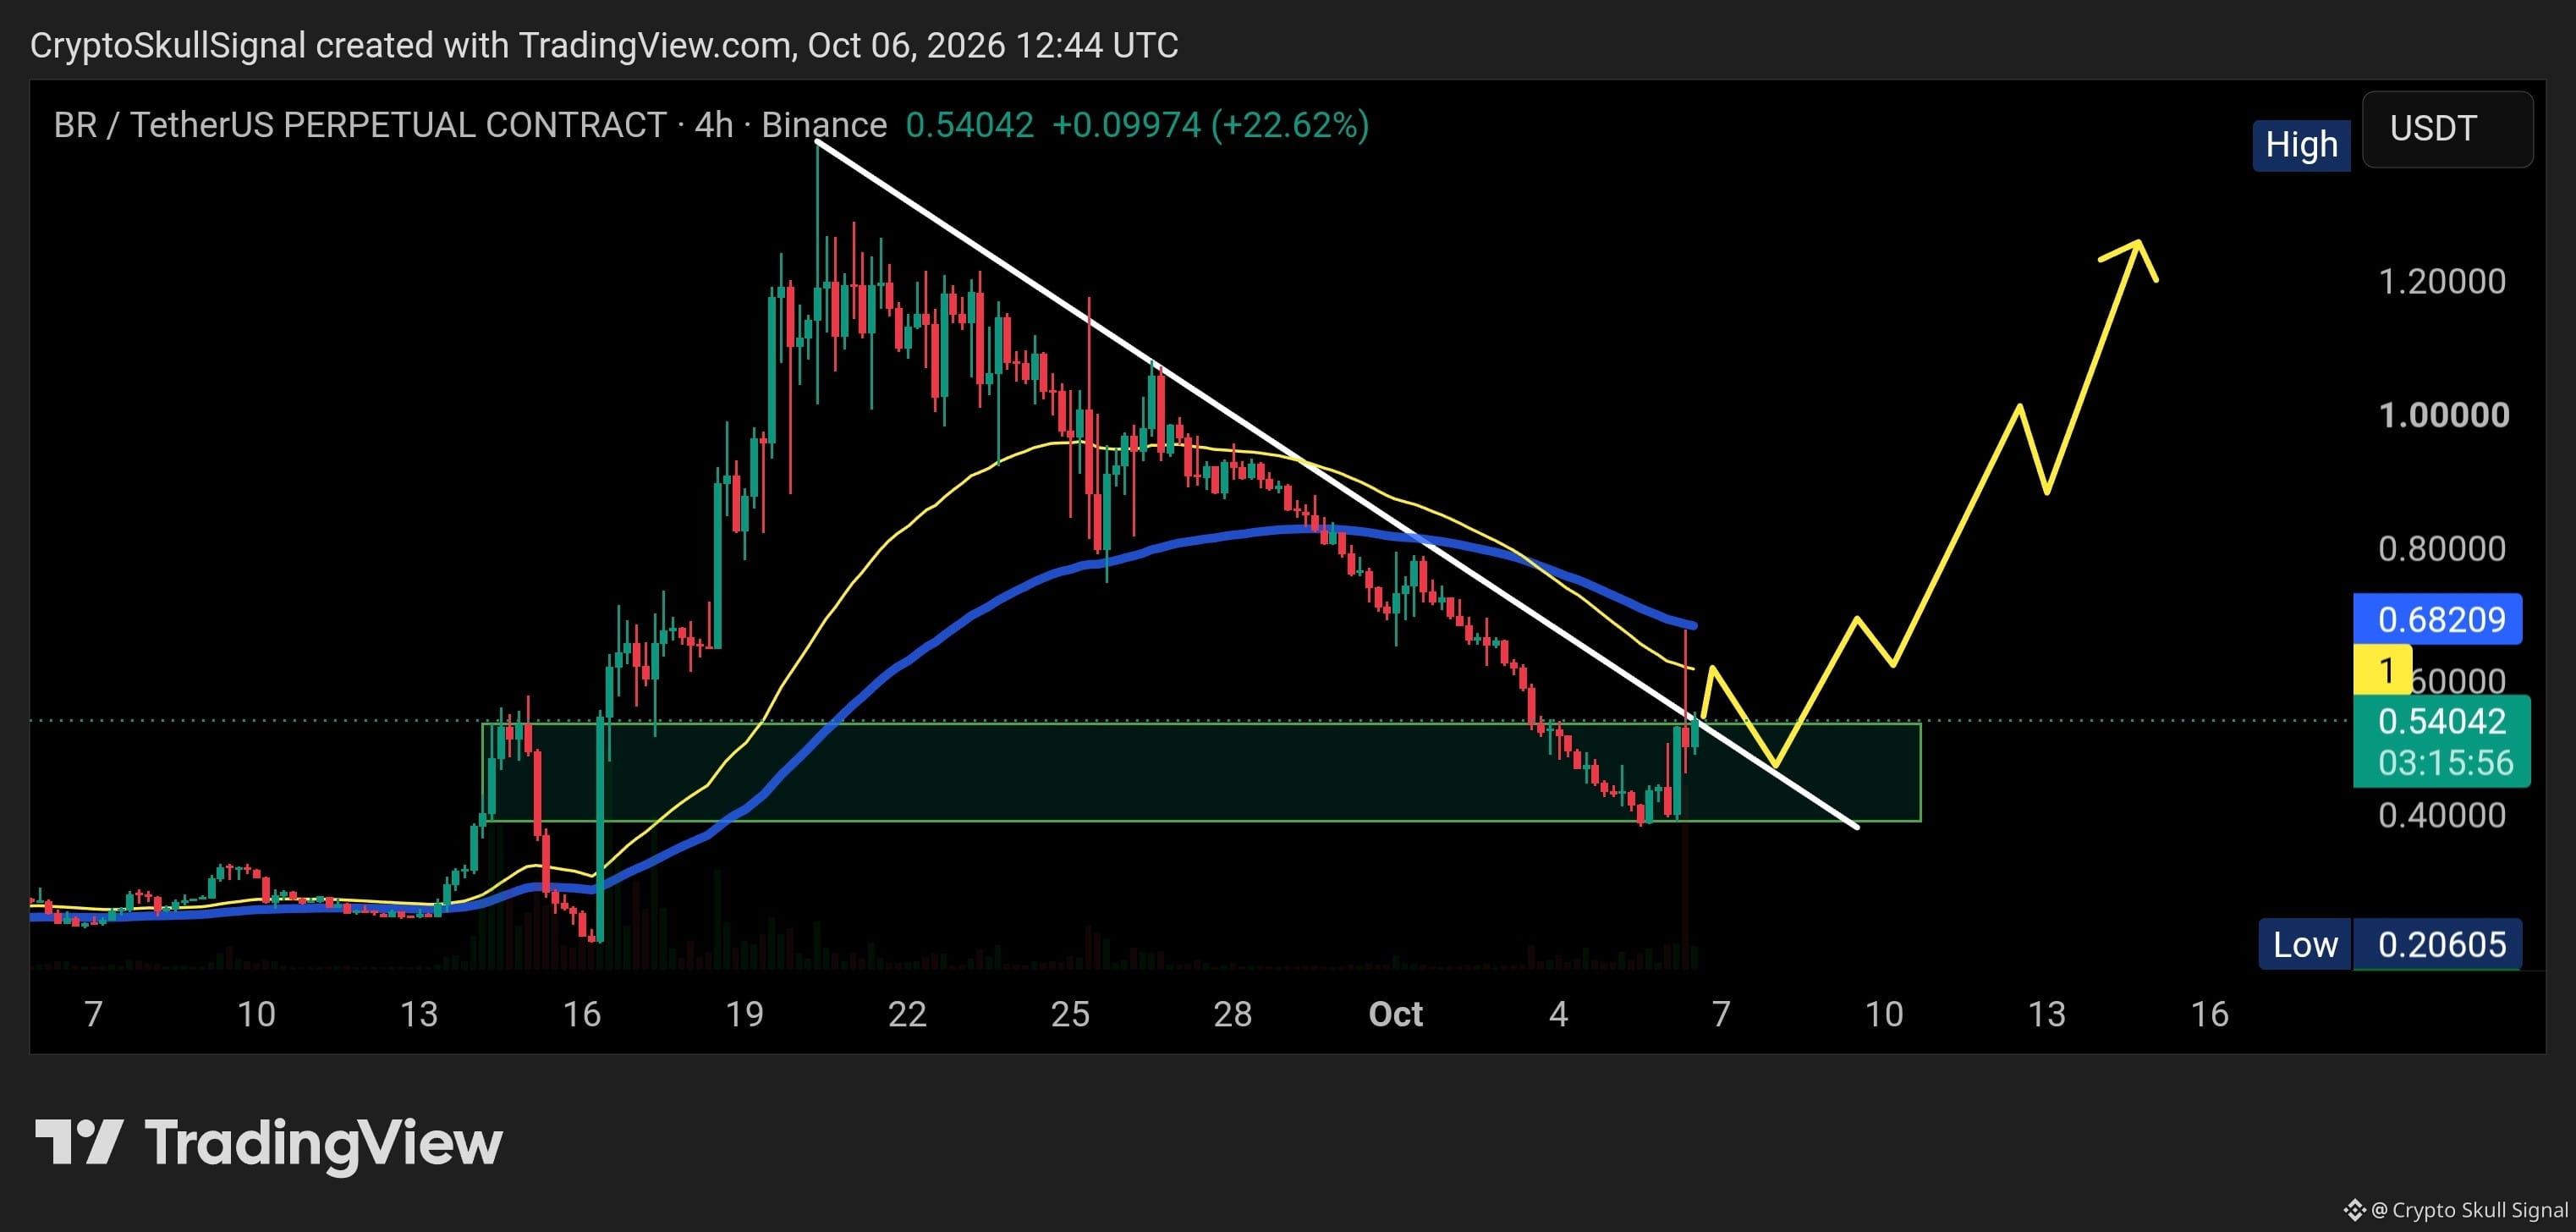
$BR is breaking out, and this is the interesting point on the chart. {future}(BRUSDT) The key level now is $0.54. As long as BR holds above $0.54 and stays above the breakout zone, the structure remains highly bullish and I see strong chances for further upside. The next major resistance is around the 50 EMA and 99 EMA. If BR breaks through both and holds above them, the move can accelerate toward $1.20. For me, the setup is simple: Breakout → hold above $0.54 → break the 50/99 EMA resistance → continuation toward $1.20. The breakout is happening. Now we need the hold.
$BR is breaking out, and this is the interesting point on the chart.

The key level now is $0.54. As long as BR holds above $0.54 and stays above the breakout zone, the structure remains highly bullish and I see strong chances for further upside.

The next major resistance is around the 50 EMA and 99 EMA. If BR breaks through both and holds above them, the move can accelerate toward $1.20.

For me, the setup is simple:

Breakout → hold above $0.54 → break the 50/99 EMA resistance → continuation toward $1.20.

The breakout is happening. Now we need the hold.
See translation
Close $ZEC trade not looking good 👍
Crypto Skull Signal
·
--
Bullish
$ZEC /USDT

🟢 LONG 10X

📍 Entry: 1370.6

🎯 Targets:

TP1: 1384.31
TP2: 1398.01
TP3: 1425.42
TP4: 1452.84
TP5: 1494.95
TP6: 1535.07

❌ Stop Loss: 1279

⚠️ Risk: Use low funds only
See translation
$ZEC /USDT 🟢 LONG 10X 📍 Entry: 1370.6 🎯 Targets: TP1: 1384.31 TP2: 1398.01 TP3: 1425.42 TP4: 1452.84 TP5: 1494.95 TP6: 1535.07 ❌ Stop Loss: 1279 ⚠️ Risk: Use low funds only {future}(ZECUSDT)
$ZEC /USDT

🟢 LONG 10X

📍 Entry: 1370.6

🎯 Targets:

TP1: 1384.31
TP2: 1398.01
TP3: 1425.42
TP4: 1452.84
TP5: 1494.95
TP6: 1535.07

❌ Stop Loss: 1279

⚠️ Risk: Use low funds only
See translation
I’ll remember what each one taught me. Because after all these years, my biggest goal isn't to win every trade. It's to keep learning, keep improving, and build a life where I’m making my own decisions, not letting one trade decide who I am.
I’ll remember what each one taught me.

Because after all these years, my biggest goal isn't to win every trade.

It's to keep learning, keep improving, and build a life where I’m making my own decisions, not letting one trade decide who I am.
Crypto Skull Signal
·
--
If someone asked me today what I’ve gained from all these years in the market, money wouldn’t be my first answer.

I’d probably talk about the nights I couldn’t sleep after taking a loss.

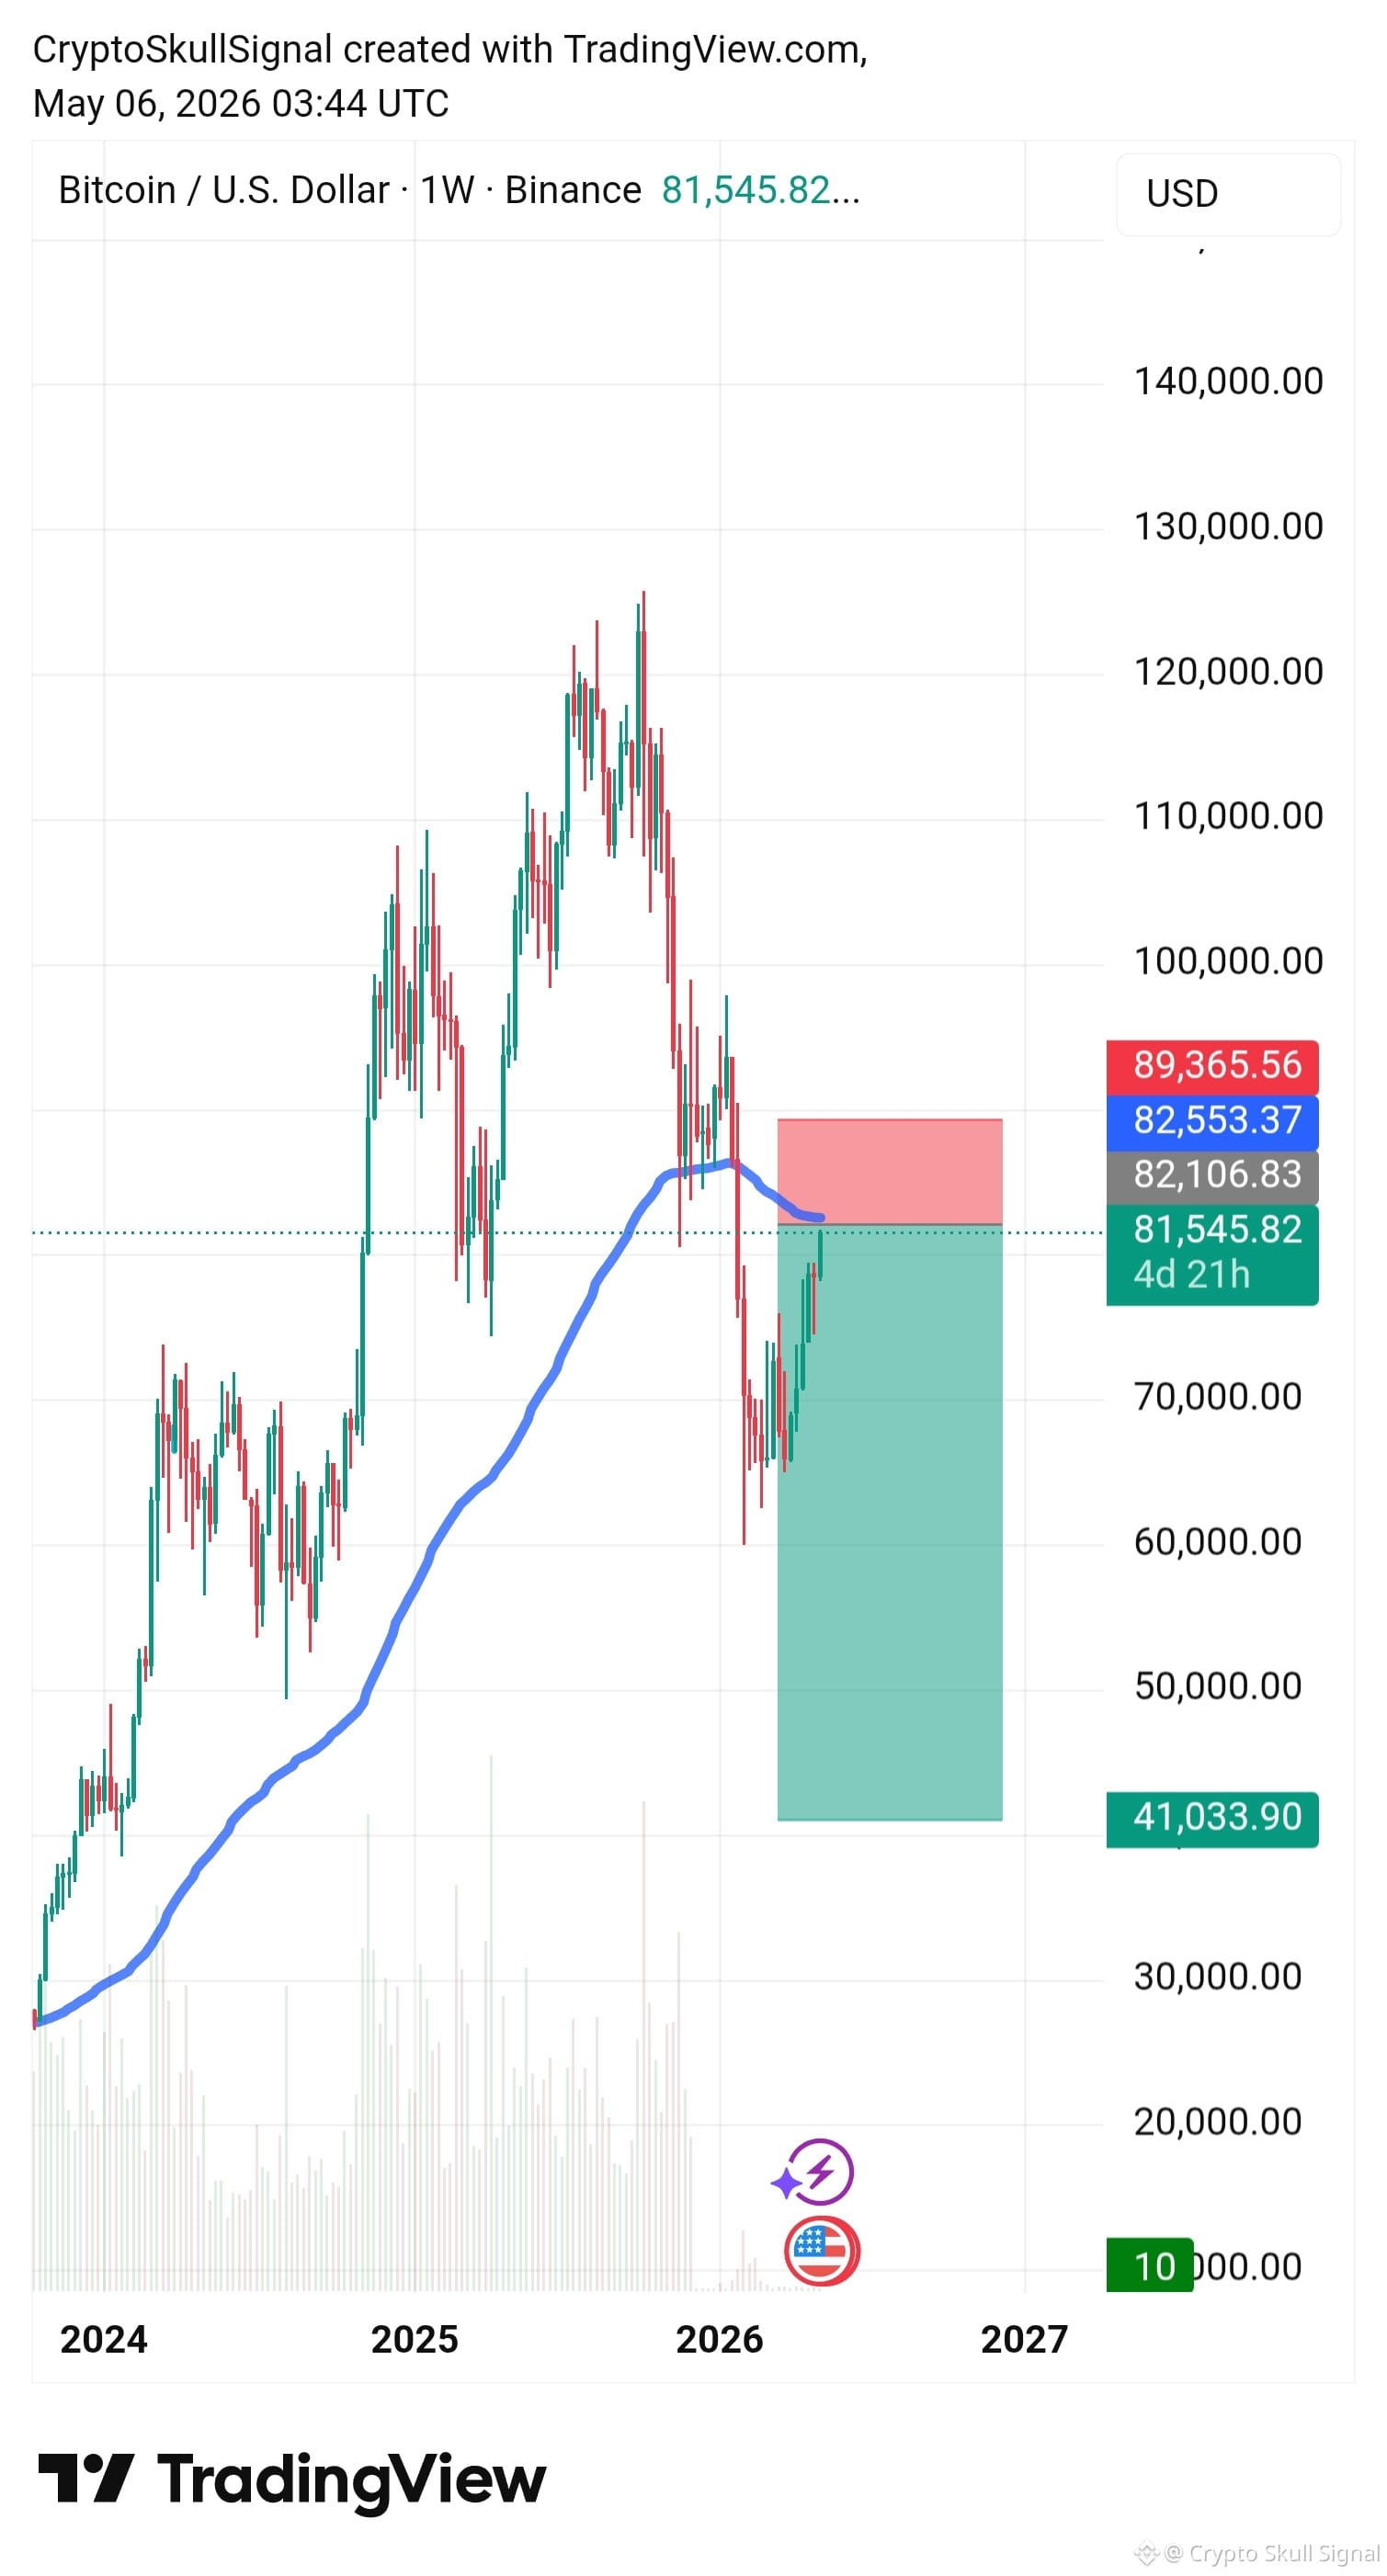
I’d talk about the trades I was convinced would work, only to watch the market prove me wrong. My BTC trade was one of those moments. I had a strong conviction, managed the position, added along the way, and still ended up taking a painful loss when the market moved against my thesis.

That loss hurt.

Not just financially. It made me question my judgment, my timing, and whether all those years of studying the market had actually made me better.

But that's exactly where trading teaches you the things charts can't.

I’ve also learned that people treat you differently when you’re winning. When the numbers look good, everyone wants to know what you’re doing. When you lose, most people suddenly disappear.

So I became quieter.

I stopped feeling the need to explain every trade or prove that I was right. I’m comfortable staying anonymous. I don’t need everyone to understand me.

The market will eventually tell the story for me.

After years of watching Bitcoin, liquidity, market structure and human psychology, I realized something that took much longer to understand than any technical setup:

My biggest opponent was never Bitcoin.

It wasn't the market maker.

It wasn't the trader on the other side of my position.

It was me.

My greed.
My impatience.
My ego.
And especially that feeling after a loss when you desperately want to win the money back.

That’s where good traders can turn into bad ones.

I don’t want to become someone who never loses. That's impossible.

I want to become someone who can take a loss without letting that loss control the next decision.

I’ve taken risks.
I’ve been wrong.
I’ve been right.
I’ve made money.
I’ve lost money.
And that BTC loss taught me more about myself than some of my biggest winning trades ever did.

Some people will remember the money I made.

Some will remember the money I lost.
See translation
If someone asked me today what I’ve gained from all these years in the market, money wouldn’t be my first answer. I’d probably talk about the nights I couldn’t sleep after taking a loss. I’d talk about the trades I was convinced would work, only to watch the market prove me wrong. My BTC trade was one of those moments. I had a strong conviction, managed the position, added along the way, and still ended up taking a painful loss when the market moved against my thesis. That loss hurt. Not just financially. It made me question my judgment, my timing, and whether all those years of studying the market had actually made me better. But that's exactly where trading teaches you the things charts can't. I’ve also learned that people treat you differently when you’re winning. When the numbers look good, everyone wants to know what you’re doing. When you lose, most people suddenly disappear. So I became quieter. I stopped feeling the need to explain every trade or prove that I was right. I’m comfortable staying anonymous. I don’t need everyone to understand me. The market will eventually tell the story for me. After years of watching Bitcoin, liquidity, market structure and human psychology, I realized something that took much longer to understand than any technical setup: My biggest opponent was never Bitcoin. It wasn't the market maker. It wasn't the trader on the other side of my position. It was me. My greed. My impatience. My ego. And especially that feeling after a loss when you desperately want to win the money back. That’s where good traders can turn into bad ones. I don’t want to become someone who never loses. That's impossible. I want to become someone who can take a loss without letting that loss control the next decision. I’ve taken risks. I’ve been wrong. I’ve been right. I’ve made money. I’ve lost money. And that BTC loss taught me more about myself than some of my biggest winning trades ever did. Some people will remember the money I made. Some will remember the money I lost.
If someone asked me today what I’ve gained from all these years in the market, money wouldn’t be my first answer.

I’d probably talk about the nights I couldn’t sleep after taking a loss.

I’d talk about the trades I was convinced would work, only to watch the market prove me wrong. My BTC trade was one of those moments. I had a strong conviction, managed the position, added along the way, and still ended up taking a painful loss when the market moved against my thesis.

That loss hurt.

Not just financially. It made me question my judgment, my timing, and whether all those years of studying the market had actually made me better.

But that's exactly where trading teaches you the things charts can't.

I’ve also learned that people treat you differently when you’re winning. When the numbers look good, everyone wants to know what you’re doing. When you lose, most people suddenly disappear.

So I became quieter.

I stopped feeling the need to explain every trade or prove that I was right. I’m comfortable staying anonymous. I don’t need everyone to understand me.

The market will eventually tell the story for me.

After years of watching Bitcoin, liquidity, market structure and human psychology, I realized something that took much longer to understand than any technical setup:

My biggest opponent was never Bitcoin.

It wasn't the market maker.

It wasn't the trader on the other side of my position.

It was me.

My greed.
My impatience.
My ego.
And especially that feeling after a loss when you desperately want to win the money back.

That’s where good traders can turn into bad ones.

I don’t want to become someone who never loses. That's impossible.

I want to become someone who can take a loss without letting that loss control the next decision.

I’ve taken risks.
I’ve been wrong.
I’ve been right.
I’ve made money.
I’ve lost money.
And that BTC loss taught me more about myself than some of my biggest winning trades ever did.

Some people will remember the money I made.

Some will remember the money I lost.
See translation
$HYPE/USDT Take-Profit TARGET 1 DONE ✅ Profit: 10.64% with 10x 📈
$HYPE/USDT Take-Profit

TARGET 1 DONE ✅

Profit: 10.64% with 10x 📈
Crypto Skull Signal
·
--
$HYPE/USDT

🔴 SHORT 10X

📍 Entry: 93.04

🎯 Targets:

TP1: 92.11
TP2: 91.18
TP3: 89.32
TP4: 87.46
TP5: 84.67
TP6: 81.88

❌ Stop Loss: 99.23
See translation
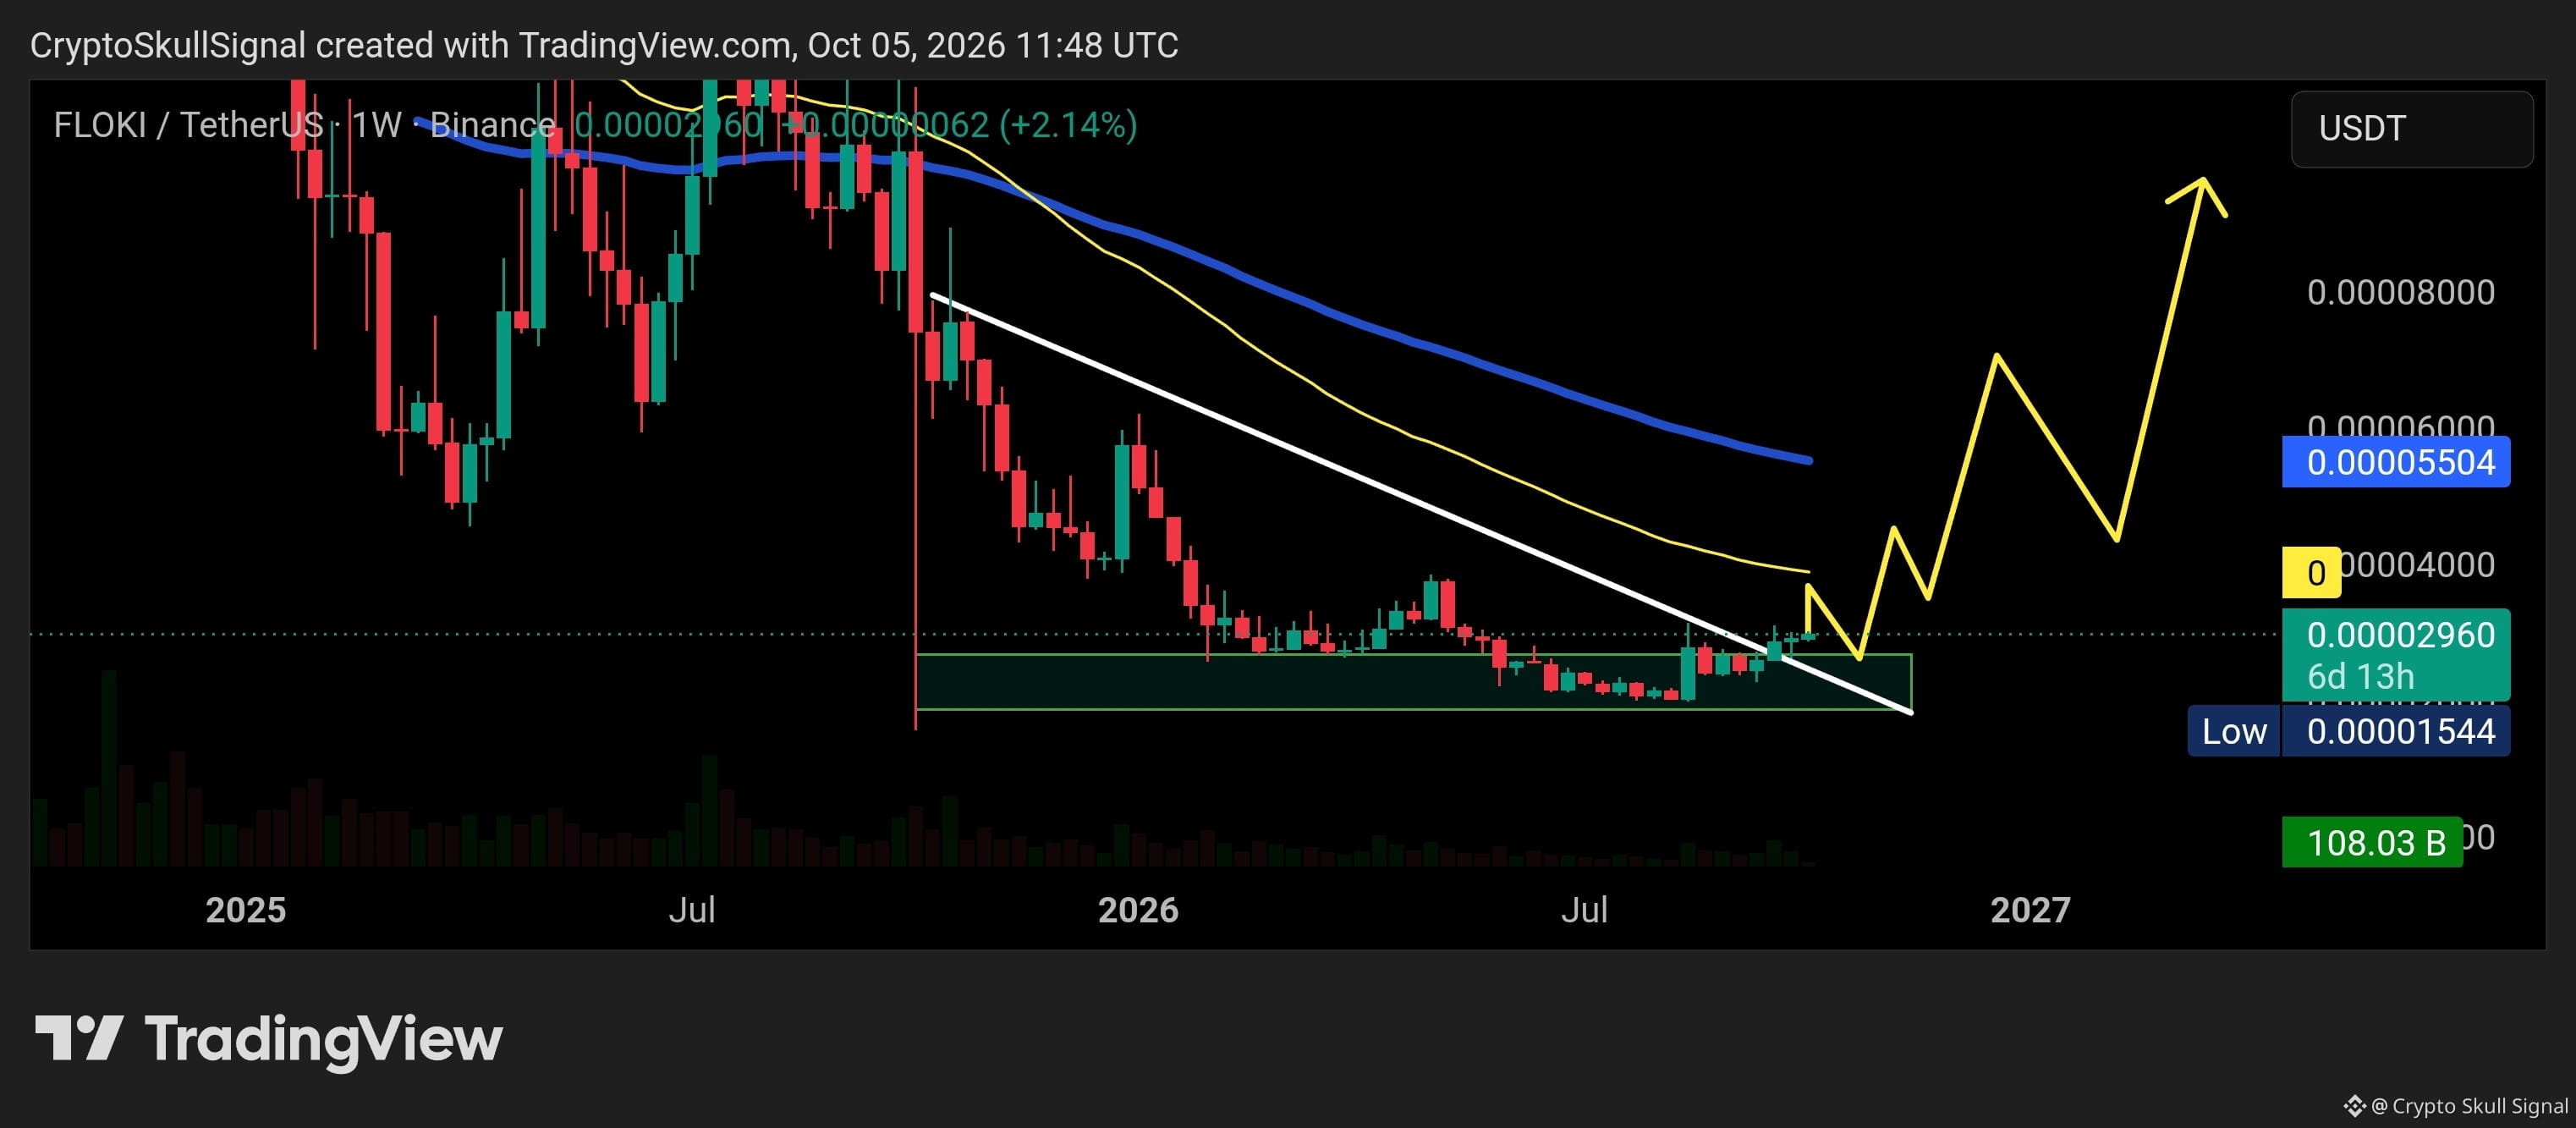
$FLOKI is at a key SR and breakout zone. The breakout is happening, but now the important part is to hold above both the accumulation zone and the breakout level. {spot}(FLOKIUSDT) If FLOKI holds this area as support, I expect the bullish structure to continue and a stronger pump could follow soon. Breakout → hold → retest → continuation. If it loses the accumulation and breakout zone, the setup weakens.
$FLOKI is at a key SR and breakout zone.

The breakout is happening, but now the important part is to hold above both the accumulation zone and the breakout level.

If FLOKI holds this area as support, I expect the bullish structure to continue and a stronger pump could follow soon.

Breakout → hold → retest → continuation.

If it loses the accumulation and breakout zone, the setup weakens.
See translation
$HYPE/USDT 🔴 SHORT 10X 📍 Entry: 93.04 🎯 Targets: TP1: 92.11 TP2: 91.18 TP3: 89.32 TP4: 87.46 TP5: 84.67 TP6: 81.88 ❌ Stop Loss: 99.23
$HYPE/USDT

🔴 SHORT 10X

📍 Entry: 93.04

🎯 Targets:

TP1: 92.11
TP2: 91.18
TP3: 89.32
TP4: 87.46
TP5: 84.67
TP6: 81.88

❌ Stop Loss: 99.23
Log in to explore more content
Join global crypto users on Binance Square
⚡️ Get latest and useful information about crypto.
💬 Trusted by the world’s largest crypto exchange.
👍 Discover real insights from verified creators.
Email / Phone number
Sitemap
Cookie Preferences
Platform T&Cs