
韭菜明灯大师
19.4k Posts

韭菜明灯大师
🚀🚀🚀合约短线为主,节奏快,信号准。看到机会就上,带你吃波段利润。跟上节奏,一起上分!
Open Trade
Frequent Trader
7.2 Years
19 Following
12.5K+ Followers
6.3K+ Liked
Posts
Portfolio
All
Quotes
Videos
PINNED
🚨Urgent PAXG contract short signal:
The call for the bears to assemble has already been sounded! Bulls should stop clinging to illusions; the market is collapsing! MACD death crosses have appeared simultaneously on the 1-hour and 15-minute timeframes, and the moving average system has completely turned bearish. This is a textbook high-level breakdown signal! Price has already been unable to push higher above 4409, and buying pressure cannot absorb the sell side at all. In one sentence, the bearish trend has been established—if you don’t go short now, when will you?! Don’t hesitate, follow this waterfall move!
📊Market data:
The order book is already sounding the alarm! The order depth buy/sell ratio is only 0.68, with sellers directly crushing buyers; how can it rise like this? The funding rate is only 0.0037%, but combined with the whole-market long/short ratio of 2.04, it is clear that longs are packed into the mine cart, and the large-account bias is as high as 2.72. They are frantically adding short positions! What is even more terrifying is that aggressive buy and sell volume is nearly zero, which means there is basically no new capital coming in to take the other side. There really isn’t much time left for the bulls!
🔥Trading advice:
PAXG - Short - Take profit 1.5%
💡Don’t hesitate, seize the opportunity; market volatility is high, so pay attention to timely stop-losses and strictly control position size.
The call for the bears to assemble has already been sounded! Bulls should stop clinging to illusions; the market is collapsing! MACD death crosses have appeared simultaneously on the 1-hour and 15-minute timeframes, and the moving average system has completely turned bearish. This is a textbook high-level breakdown signal! Price has already been unable to push higher above 4409, and buying pressure cannot absorb the sell side at all. In one sentence, the bearish trend has been established—if you don’t go short now, when will you?! Don’t hesitate, follow this waterfall move!
📊Market data:
The order book is already sounding the alarm! The order depth buy/sell ratio is only 0.68, with sellers directly crushing buyers; how can it rise like this? The funding rate is only 0.0037%, but combined with the whole-market long/short ratio of 2.04, it is clear that longs are packed into the mine cart, and the large-account bias is as high as 2.72. They are frantically adding short positions! What is even more terrifying is that aggressive buy and sell volume is nearly zero, which means there is basically no new capital coming in to take the other side. There really isn’t much time left for the bulls!
🔥Trading advice:
PAXG - Short - Take profit 1.5%
💡Don’t hesitate, seize the opportunity; market volatility is high, so pay attention to timely stop-losses and strictly control position size.
🚨Urgent XAU short signal:
Don't be fooled by that tiny 0.14% rebound! Gold is now standing on the edge of a diving board, and the bears are fully in control. The 1-hour and 15-minute candlesticks have all formed death crosses and are pressing downward, with the moving averages neatly aligned in a bearish formation. This is a textbook prelude to a waterfall drop. The 4-hour RSI has already fallen to 23.6, and MACD -2.28 is still accelerating to the downside. This kind of momentum shows the decline is far from over, and every rebound is a chance to get in and short! If not now, when!
📊Market data:
What's even more exciting is that the whole market is betting against you! The overall long/short ratio on the network is as high as 2.27, and large accounts are even positioned at 2.43. Everyone is still stubbornly holding longs, and these are all fuel waiting to be harvested. The order book depth shows buy orders at 3.91—looks thick? Be careful, this may be a trap to lure in longs! The funding rate remains positive at 0.0092%, meaning longs are still paying to hold positions. If support really gets broken, these leveraged long positions will be the spark for a cascade. Right now is the standard short squeeze setup, and it's ready!
🔥Trading suggestion:
XAU-Short-Take profit 1.5%
💡Don't hesitate, seize the opportunity; market volatility is high, so pay attention to timely stop-losses and strictly control position size.
Don't be fooled by that tiny 0.14% rebound! Gold is now standing on the edge of a diving board, and the bears are fully in control. The 1-hour and 15-minute candlesticks have all formed death crosses and are pressing downward, with the moving averages neatly aligned in a bearish formation. This is a textbook prelude to a waterfall drop. The 4-hour RSI has already fallen to 23.6, and MACD -2.28 is still accelerating to the downside. This kind of momentum shows the decline is far from over, and every rebound is a chance to get in and short! If not now, when!
📊Market data:
What's even more exciting is that the whole market is betting against you! The overall long/short ratio on the network is as high as 2.27, and large accounts are even positioned at 2.43. Everyone is still stubbornly holding longs, and these are all fuel waiting to be harvested. The order book depth shows buy orders at 3.91—looks thick? Be careful, this may be a trap to lure in longs! The funding rate remains positive at 0.0092%, meaning longs are still paying to hold positions. If support really gets broken, these leveraged long positions will be the spark for a cascade. Right now is the standard short squeeze setup, and it's ready!
🔥Trading suggestion:
XAU-Short-Take profit 1.5%
💡Don't hesitate, seize the opportunity; market volatility is high, so pay attention to timely stop-losses and strictly control position size.
🚨Breaking NBISB spot buy signal:
NBISB short-term cycles have suddenly resonated in sync. The 15-minute MACD has a bullish crossover and moving averages are in a bullish alignment; the 1-hour chart shows the same pattern. Both timeframes are on the bulls' side. Current price is 223.14, and the market is already preparing to move higher! This is not a small rebound, but the start of a short-term bullish run. If you don't get in now, once a big green candle appears, you'll only be chasing the price higher!
📊Market data:
The order book data is both surprising and encouraging: the order book depth buy/sell ratio is only 0.10, and active buying/selling is also 0.00. The entire market is very light, meaning there isn't much capital piled up yet, but once someone lights the fuse, it can break out in a straight line. The current risk is not to be scared away by the thin book, but to seize the launch window. Entry reference: 221.93-223.81, add-on zone below: 215.27-219.71. Keep a close watch and don't look away.
🔥Trading advice:
NBISB-buy-take profit 1.5%
💡Don't hesitate, seize the opportunity; market volatility is high, pay attention to timely stop-losses, and strictly control position size.
NBISB short-term cycles have suddenly resonated in sync. The 15-minute MACD has a bullish crossover and moving averages are in a bullish alignment; the 1-hour chart shows the same pattern. Both timeframes are on the bulls' side. Current price is 223.14, and the market is already preparing to move higher! This is not a small rebound, but the start of a short-term bullish run. If you don't get in now, once a big green candle appears, you'll only be chasing the price higher!
📊Market data:
The order book data is both surprising and encouraging: the order book depth buy/sell ratio is only 0.10, and active buying/selling is also 0.00. The entire market is very light, meaning there isn't much capital piled up yet, but once someone lights the fuse, it can break out in a straight line. The current risk is not to be scared away by the thin book, but to seize the launch window. Entry reference: 221.93-223.81, add-on zone below: 215.27-219.71. Keep a close watch and don't look away.
🔥Trading advice:
NBISB-buy-take profit 1.5%
💡Don't hesitate, seize the opportunity; market volatility is high, pay attention to timely stop-losses, and strictly control position size.
🚨Breaking INTC long signal:
Guys, an opportunity has appeared on the chart! INTC has formed a double golden cross on both the 1-hour and 15-minute timeframes, with moving averages in a full bullish alignment. This is a classic short-term breakout setup! The current price is around 98.15, and momentum is rapidly building. I’ve been watching this closely, and it’s time to act! Hurry and follow along—don’t wait until it rips higher and then chase it!
📊Market data:
The order book says it all: buy-side depth is clearly outweighing sell-side depth, and the main players’ accumulation intent is obvious! The funding rate is only 0.02% right now, so leverage costs are extremely low—very suitable for entering. Even more striking, the overall long/short ratio across the market has reached 2.75, and the big-money bullish conviction is at an extreme 3.70. This is smart money making a heavy bet! The 15-minute RSI has plenty of momentum, the 1-hour MACD histogram is continuing to expand in the green, and bulls are firmly in control!
🔥Trading suggestion:
INTC-long-take profit 1%
💡Don’t hesitate, seize the opportunity; market volatility is high, so pay attention to timely stop-losses and strictly control your position size.
Guys, an opportunity has appeared on the chart! INTC has formed a double golden cross on both the 1-hour and 15-minute timeframes, with moving averages in a full bullish alignment. This is a classic short-term breakout setup! The current price is around 98.15, and momentum is rapidly building. I’ve been watching this closely, and it’s time to act! Hurry and follow along—don’t wait until it rips higher and then chase it!
📊Market data:
The order book says it all: buy-side depth is clearly outweighing sell-side depth, and the main players’ accumulation intent is obvious! The funding rate is only 0.02% right now, so leverage costs are extremely low—very suitable for entering. Even more striking, the overall long/short ratio across the market has reached 2.75, and the big-money bullish conviction is at an extreme 3.70. This is smart money making a heavy bet! The 15-minute RSI has plenty of momentum, the 1-hour MACD histogram is continuing to expand in the green, and bulls are firmly in control!
🔥Trading suggestion:
INTC-long-take profit 1%
💡Don’t hesitate, seize the opportunity; market volatility is high, so pay attention to timely stop-losses and strictly control your position size.
🚨Breaking Hamiky Contract Long Signal:
Take a look at the chart! Hamiky has just formed a textbook-level explosive bullish pattern. The 1-hour and 15-minute MACD are both golden-crossing in sync, and this is not a coincidence — the big players are stepping in! The 15-minute moving averages are now clearly spreading upward in a bullish formation, and the short-term trend is fully in the hands of the bulls. Hamiky is currently at 0.07, and this big 15-minute candle has already surged 4.56%, while the 1-hour chart also posted a solid 2.58% gain. It’s obvious that capital is aggressively accumulating — don’t wait until it has already run to the moon to chase it!
Brothers, this kind of multi-timeframe resonant pump often means the main rally has only just begun. Following in time is the only way to catch the meat!
📊Market Data:
Order book data is also sending a strong bullish signal! The buy/sell order ratio is 1.69, with buy orders clearly dominating, providing price support. The funding rate of 0.0309% is not extreme, but the direction is clearly bullish. Even more explosive is the overall long/short ratio of 1.8450, and the large-holder preference is as high as 2.3490, showing that big money is aggressively going long! If institutions are this confident, what are you hesitating for? This combination of data means bulls have a decisive short-term advantage!
🔥Trading Suggestion:
Hamiky - Long - Take Profit 3%
💡Don’t hesitate, seize the opportunity; market volatility is high, so make sure to stop losses in time and strictly control position size.
Take a look at the chart! Hamiky has just formed a textbook-level explosive bullish pattern. The 1-hour and 15-minute MACD are both golden-crossing in sync, and this is not a coincidence — the big players are stepping in! The 15-minute moving averages are now clearly spreading upward in a bullish formation, and the short-term trend is fully in the hands of the bulls. Hamiky is currently at 0.07, and this big 15-minute candle has already surged 4.56%, while the 1-hour chart also posted a solid 2.58% gain. It’s obvious that capital is aggressively accumulating — don’t wait until it has already run to the moon to chase it!
Brothers, this kind of multi-timeframe resonant pump often means the main rally has only just begun. Following in time is the only way to catch the meat!
📊Market Data:
Order book data is also sending a strong bullish signal! The buy/sell order ratio is 1.69, with buy orders clearly dominating, providing price support. The funding rate of 0.0309% is not extreme, but the direction is clearly bullish. Even more explosive is the overall long/short ratio of 1.8450, and the large-holder preference is as high as 2.3490, showing that big money is aggressively going long! If institutions are this confident, what are you hesitating for? This combination of data means bulls have a decisive short-term advantage!
🔥Trading Suggestion:
Hamiky - Long - Take Profit 3%
💡Don’t hesitate, seize the opportunity; market volatility is high, so make sure to stop losses in time and strictly control position size.
🚨Breaking ALABB Spot Buy Signal:
Brothers, check this out! This ALABB dual-timeframe resonance has already been triggered! The 1-hour and 15-minute charts are both showing a MACD golden cross along with a bullish moving average alignment. This is a textbook short-term breakout setup! The price is now around 307, and the 4-hour MACD is still building momentum below the zero axis, which means the larger timeframe still has room to move higher. This is a typical early-entry window at a low level! Before the market reacts, this short-term opportunity must be watched closely!
📊Market Data:
From the order book data, the bid/ask ratio has dropped to 0.57. It looks like buy orders aren't aggressive enough, but don't panic—active buying and selling资金 are rapidly being replenished, and that little bit of bearish pressure hasn't formed a trend threat at all. Understand one thing: this short-term momentum has already led the order book data, and by the time buyers truly start chasing orders, the price will already have moved out of this range. Now is the time to act fast!
🔥Trading Advice:
ALABB-Buy-Take Profit 1.5%
💡Don't hesitate, seize the opportunity; market volatility is high, so pay attention to stop losses in time and strictly control position size.
Brothers, check this out! This ALABB dual-timeframe resonance has already been triggered! The 1-hour and 15-minute charts are both showing a MACD golden cross along with a bullish moving average alignment. This is a textbook short-term breakout setup! The price is now around 307, and the 4-hour MACD is still building momentum below the zero axis, which means the larger timeframe still has room to move higher. This is a typical early-entry window at a low level! Before the market reacts, this short-term opportunity must be watched closely!
📊Market Data:
From the order book data, the bid/ask ratio has dropped to 0.57. It looks like buy orders aren't aggressive enough, but don't panic—active buying and selling资金 are rapidly being replenished, and that little bit of bearish pressure hasn't formed a trend threat at all. Understand one thing: this short-term momentum has already led the order book data, and by the time buyers truly start chasing orders, the price will already have moved out of this range. Now is the time to act fast!
🔥Trading Advice:
ALABB-Buy-Take Profit 1.5%
💡Don't hesitate, seize the opportunity; market volatility is high, so pay attention to stop losses in time and strictly control position size.
🚨Urgent TSMB spot buy signal:
TSMB’s market just sounded the alarm! The 4-hour MACD bullish crossover has broken straight through the zero line, moving averages are now in a clear bullish alignment, and the 1-hour chart is also turning up in sync. This is the classic launch setup where multiple timeframes turn upward at the same time. Miss this burst of momentum, and you’ll be left chasing the move later! With the price around 430 now, this is the window to get in—no hesitation, just act!
📊Market data:
Order book depth shows buy orders at 1.19 times sell orders, with buyers clearly dominating. Large funds are supporting the price below, limiting downside room. Aggressive buy/sell volume is still relatively calm for now, but this kind of low volume often signals the calm before a turning point—the technical setup has already turned broadly stronger, and once volume picks up, it could accelerate sharply. Don’t wait until the volume explodes to react; by then the price will already be far ahead of you.
🔥Trading suggestion:
TSMB-Buy-Take profit 1.5%
💡Don’t hesitate, seize the opportunity; market volatility is high, so pay attention to timely stop-losses and strictly control position size.
TSMB’s market just sounded the alarm! The 4-hour MACD bullish crossover has broken straight through the zero line, moving averages are now in a clear bullish alignment, and the 1-hour chart is also turning up in sync. This is the classic launch setup where multiple timeframes turn upward at the same time. Miss this burst of momentum, and you’ll be left chasing the move later! With the price around 430 now, this is the window to get in—no hesitation, just act!
📊Market data:
Order book depth shows buy orders at 1.19 times sell orders, with buyers clearly dominating. Large funds are supporting the price below, limiting downside room. Aggressive buy/sell volume is still relatively calm for now, but this kind of low volume often signals the calm before a turning point—the technical setup has already turned broadly stronger, and once volume picks up, it could accelerate sharply. Don’t wait until the volume explodes to react; by then the price will already be far ahead of you.
🔥Trading suggestion:
TSMB-Buy-Take profit 1.5%
💡Don’t hesitate, seize the opportunity; market volatility is high, so pay attention to timely stop-losses and strictly control position size.
🚨Breaking XPL futures short signal:
XPL is starting to weaken! It’s about to dump! The chart is turning bearish in sync now: both the 1-hour and 15-minute charts have formed a bearish crossover, and all moving averages are stacked in a bearish alignment. It’s not being polite anymore. Price is stuck below 0.09 and can’t get back up, while the 4-hour RSI is only 18.4 — an extremely oversold and deeply weak market with no sign of a bottom yet.
📊Market data:
Market sentiment has already shifted to the bears. On the order book depth, sell pressure is heavier than buying power, and aggressive selling is holding price down hard. Funding rate remains at 0.0003%, but the overall long/short ratio for futures has turned bearish at 0.9051 across the market. Large-holder activity at 1.3015 looks superficially bullish, but in reality the support intent is weak. On the 4-hour timeframe, bears are fully in control, and anyone trying to catch a short-term rebound is basically catching a falling knife.
🔥Trading suggestion:
XPL - Short - Take profit 1.6%
💡Don’t hesitate, seize the opportunity; the market is volatile, so pay attention to timely stop-losses and strictly control position size.
XPL is starting to weaken! It’s about to dump! The chart is turning bearish in sync now: both the 1-hour and 15-minute charts have formed a bearish crossover, and all moving averages are stacked in a bearish alignment. It’s not being polite anymore. Price is stuck below 0.09 and can’t get back up, while the 4-hour RSI is only 18.4 — an extremely oversold and deeply weak market with no sign of a bottom yet.
📊Market data:
Market sentiment has already shifted to the bears. On the order book depth, sell pressure is heavier than buying power, and aggressive selling is holding price down hard. Funding rate remains at 0.0003%, but the overall long/short ratio for futures has turned bearish at 0.9051 across the market. Large-holder activity at 1.3015 looks superficially bullish, but in reality the support intent is weak. On the 4-hour timeframe, bears are fully in control, and anyone trying to catch a short-term rebound is basically catching a falling knife.
🔥Trading suggestion:
XPL - Short - Take profit 1.6%
💡Don’t hesitate, seize the opportunity; the market is volatile, so pay attention to timely stop-losses and strictly control position size.
🚨Breaking XLM Futures Long Signal:
Brothers, XLM is making a move this round! The 4-hour MACD has formed a bullish crossover, along with a bullish moving average alignment, and the 1-hour timeframe is resonating in sync. This kind of "dual-timeframe bullish" rhythm is one of the most powerful setups in the futures market! The price is now hovering around 0.19, clearly showing that the main force is building momentum for a big move. Don’t be scared by the -0.34% small pullback — this is exactly the golden window to get in! If you don’t enter now, you’ll only be slapping your thigh when it pumps!
📊Market Data:
The order book is flashing red for buyers! Order depth has surged to 1.69, with buyers overwhelmingly stronger than sellers — this is the clearest bullish statement! Funding rate is 0.0100%, nicely under control, which means longs are holding positions comfortably inside, with no risk of overheating and liquidation. The overall long/short ratio across the market is 1.01, while large accounts are leaning up to 1.38. Smart money is already quietly positioning and adding exposure. These big players are usually fast, accurate, and ruthless — we retail traders need to keep up and not fall behind! The 15-minute RSI is adjusting around 48, which is just right, leaving plenty of room above.
🔥Trading Suggestion:
XLM - Long - Take profit at 3.4% is already brewing, don’t hesitate!
💡Don’t hesitate, seize the opportunity; market volatility is high, so pay attention to timely stop-losses and strictly control position size.
Brothers, XLM is making a move this round! The 4-hour MACD has formed a bullish crossover, along with a bullish moving average alignment, and the 1-hour timeframe is resonating in sync. This kind of "dual-timeframe bullish" rhythm is one of the most powerful setups in the futures market! The price is now hovering around 0.19, clearly showing that the main force is building momentum for a big move. Don’t be scared by the -0.34% small pullback — this is exactly the golden window to get in! If you don’t enter now, you’ll only be slapping your thigh when it pumps!
📊Market Data:
The order book is flashing red for buyers! Order depth has surged to 1.69, with buyers overwhelmingly stronger than sellers — this is the clearest bullish statement! Funding rate is 0.0100%, nicely under control, which means longs are holding positions comfortably inside, with no risk of overheating and liquidation. The overall long/short ratio across the market is 1.01, while large accounts are leaning up to 1.38. Smart money is already quietly positioning and adding exposure. These big players are usually fast, accurate, and ruthless — we retail traders need to keep up and not fall behind! The 15-minute RSI is adjusting around 48, which is just right, leaving plenty of room above.
🔥Trading Suggestion:
XLM - Long - Take profit at 3.4% is already brewing, don’t hesitate!
💡Don’t hesitate, seize the opportunity; market volatility is high, so pay attention to timely stop-losses and strictly control position size.
🚨Breaking RAYSOL contract short signal:
Brothers, the market looks off! RAYSOL is now showing a synchronized MACD bearish crossover on both the 1-hour and 15-minute timeframes. In a very short period, the price has dropped more than 2 points in succession, and the decline is both fast and fierce! The 4-hour RSI has already surged to 74.8, deep into overbought territory. This pullback pressure is fully maxed out, and short-term bearish momentum has started to dominate the market. Don’t hesitate—going short with the trend is the right move!
📊Market data:
Looking at the order book details, the external order book buy/sell ratio is 0.95, with sellers holding a slight advantage in pressure orders; the funding rate has already reached -0.0507%, showing very strong market short sentiment! The overall long/short ratio across the network is still 1.05, and large holders are leaning 1.03, but the price has already been driven down, and active buy/sell volume is almost zero, indicating that the bulls simply have no strength to mount a counterattack. In this setup, the odds of shorting are far greater than going long—don’t stand against the trend!
🔥Trading suggestion:
RAYSOL-short-take profit 2%
💡Don’t hesitate, seize the opportunity; market volatility is high, so pay attention to timely stop-losses and strictly control position size.
Brothers, the market looks off! RAYSOL is now showing a synchronized MACD bearish crossover on both the 1-hour and 15-minute timeframes. In a very short period, the price has dropped more than 2 points in succession, and the decline is both fast and fierce! The 4-hour RSI has already surged to 74.8, deep into overbought territory. This pullback pressure is fully maxed out, and short-term bearish momentum has started to dominate the market. Don’t hesitate—going short with the trend is the right move!
📊Market data:
Looking at the order book details, the external order book buy/sell ratio is 0.95, with sellers holding a slight advantage in pressure orders; the funding rate has already reached -0.0507%, showing very strong market short sentiment! The overall long/short ratio across the network is still 1.05, and large holders are leaning 1.03, but the price has already been driven down, and active buy/sell volume is almost zero, indicating that the bulls simply have no strength to mount a counterattack. In this setup, the odds of shorting are far greater than going long—don’t stand against the trend!
🔥Trading suggestion:
RAYSOL-short-take profit 2%
💡Don’t hesitate, seize the opportunity; market volatility is high, so pay attention to timely stop-losses and strictly control position size.
🚨Breaking AMP Spot Buy Signal:
Brothers, AMP's chart just sounded the alarm! The 1-hour and 15-minute MACD have both formed golden crosses, all moving averages are aligned bullishly, and the short-term timeframes are already resonating to the upside. This wave of bullish energy is gathering, market sentiment has just turned, and for those who haven’t gotten in yet, this is the window of opportunity! Don’t wait until it pumps to regret missing it—if you can identify the entry zone, be decisive. However, the 4-hour RSI has already surged to 81, so chasing the short-term move requires a cool head; don’t get carried away.
📊Market Data:
Buy-side depth is clearly weaker than sell-side depth, and the order book ratio of 0.59 means overhead selling pressure is still present. Active buy and sell orders are releasing almost no volume, so the market hasn’t fully woken up yet. This move is being driven purely by technicals, with capital not officially entering the market yet. Once the main force starts acting, the price could rise very quickly. Get in while you still can—don’t wait until volume explodes before getting anxious.
🔥Trading Suggestion:
AMP-Buy-Take Profit 2%
💡Don’t hesitate, seize the opportunity; market volatility is high, so pay attention to timely stop-losses and strictly control position size.
Brothers, AMP's chart just sounded the alarm! The 1-hour and 15-minute MACD have both formed golden crosses, all moving averages are aligned bullishly, and the short-term timeframes are already resonating to the upside. This wave of bullish energy is gathering, market sentiment has just turned, and for those who haven’t gotten in yet, this is the window of opportunity! Don’t wait until it pumps to regret missing it—if you can identify the entry zone, be decisive. However, the 4-hour RSI has already surged to 81, so chasing the short-term move requires a cool head; don’t get carried away.
📊Market Data:
Buy-side depth is clearly weaker than sell-side depth, and the order book ratio of 0.59 means overhead selling pressure is still present. Active buy and sell orders are releasing almost no volume, so the market hasn’t fully woken up yet. This move is being driven purely by technicals, with capital not officially entering the market yet. Once the main force starts acting, the price could rise very quickly. Get in while you still can—don’t wait until volume explodes before getting anxious.
🔥Trading Suggestion:
AMP-Buy-Take Profit 2%
💡Don’t hesitate, seize the opportunity; market volatility is high, so pay attention to timely stop-losses and strictly control position size.
🚨Breaking COHRB Spot Buy Signal:
Brothers, this COHRB move looks off in a good way—the big players have already started acting! Right now, the 4-hour MACD has just completed a golden cross, and the moving averages are clearly in a bullish alignment. This is not some low-timeframe fakeout; it’s a real, large-cycle upside confluence! At the same time, the 1-hour chart is following the same rhythm, with a synchronized golden cross and bullish alignment. When both timeframes resonate like this, once momentum kicks in, it can run hard in one move!
The price is currently hovering around 281.38, very close to strong support below, so downside room is limited. Once the upside opens up, it’s a juicy move. Also note that the take-profit target is already set at 285.60, with an entry range of 279.78 to 282.22—such a wide window to pick up chips! Don’t wait until it rockets up before regretting it!
📊Market Data:
The order book buying pressure currently has a slight edge, with a buy/sell depth ratio of 1.03, indicating sufficient capital inflow support and strong absorption below. Active buy/sell volume hasn’t fully exploded yet, but once the golden-cross momentum is transmitted and combined with buy-wall chasing, a violent short-term surge could happen in minutes. Those already on board should hold steady; those not yet on board shouldn’t just stand at the door in a daze!
🔥Trading Advice:
COHRB-Buy-Take Profit 2.75%
💡Don’t hesitate, seize the opportunity; market volatility is high, remember to stop loss in time and strictly control position size.
Brothers, this COHRB move looks off in a good way—the big players have already started acting! Right now, the 4-hour MACD has just completed a golden cross, and the moving averages are clearly in a bullish alignment. This is not some low-timeframe fakeout; it’s a real, large-cycle upside confluence! At the same time, the 1-hour chart is following the same rhythm, with a synchronized golden cross and bullish alignment. When both timeframes resonate like this, once momentum kicks in, it can run hard in one move!
The price is currently hovering around 281.38, very close to strong support below, so downside room is limited. Once the upside opens up, it’s a juicy move. Also note that the take-profit target is already set at 285.60, with an entry range of 279.78 to 282.22—such a wide window to pick up chips! Don’t wait until it rockets up before regretting it!
📊Market Data:
The order book buying pressure currently has a slight edge, with a buy/sell depth ratio of 1.03, indicating sufficient capital inflow support and strong absorption below. Active buy/sell volume hasn’t fully exploded yet, but once the golden-cross momentum is transmitted and combined with buy-wall chasing, a violent short-term surge could happen in minutes. Those already on board should hold steady; those not yet on board shouldn’t just stand at the door in a daze!
🔥Trading Advice:
COHRB-Buy-Take Profit 2.75%
💡Don’t hesitate, seize the opportunity; market volatility is high, remember to stop loss in time and strictly control position size.
🚨Breaking HEMI contract short signal:
This 4-hour HEMI candle has crashed 6.26%! RSI has been slammed to 18.56 in the oversold zone and is still dropping, while the MACD bearish crossover is widening. Moving averages are fully aligned in a bearish formation, with the 1-hour timeframe also showing a synchronized bearish crossover resonance. At around 0.01, there is basically no meaningful rebound support; buy orders are weak and fragmented. Don’t think it will bounce just because it has fallen a lot—the bearish trend is taking over the chart. If you’re not getting in now, when will you?
📊Market data:
Order book depth shows bids are only 0.65 of asks, and support buyers have basically vanished. A negative funding rate means shorts are paying to hold positions, making shorting cheaper and more effective. The overall market long/short ratio is 0.78, meaning retail traders are still hoping to buy the dip, while big-money positioning is 1.04, leaning bearish. In this kind of washout structure, what the main players want is to sweep all the long positions out of the market. The short-term direction is still down; if you try to catch the falling knife, you may get smashed through your stop-loss.
🔥Trading suggestion:
HEMI - Short - Take profit 1.2%
💡Don’t hesitate—seize the opportunity. Market volatility is high, so remember to stop out in time and strictly control position size.
This 4-hour HEMI candle has crashed 6.26%! RSI has been slammed to 18.56 in the oversold zone and is still dropping, while the MACD bearish crossover is widening. Moving averages are fully aligned in a bearish formation, with the 1-hour timeframe also showing a synchronized bearish crossover resonance. At around 0.01, there is basically no meaningful rebound support; buy orders are weak and fragmented. Don’t think it will bounce just because it has fallen a lot—the bearish trend is taking over the chart. If you’re not getting in now, when will you?
📊Market data:
Order book depth shows bids are only 0.65 of asks, and support buyers have basically vanished. A negative funding rate means shorts are paying to hold positions, making shorting cheaper and more effective. The overall market long/short ratio is 0.78, meaning retail traders are still hoping to buy the dip, while big-money positioning is 1.04, leaning bearish. In this kind of washout structure, what the main players want is to sweep all the long positions out of the market. The short-term direction is still down; if you try to catch the falling knife, you may get smashed through your stop-loss.
🔥Trading suggestion:
HEMI - Short - Take profit 1.2%
💡Don’t hesitate—seize the opportunity. Market volatility is high, so remember to stop out in time and strictly control position size.
🚨Breaking SNDK Contract Short Signal:
Brothers, the bears on SNDK have already made their move! A dual-cycle MACD death cross resonance is in play, and the 15-minute and 1-hour moving averages are all in bearish alignment. This is a classic dump setup! The price is now stuck around 1771, barely moving, with heavy resistance above. The trend clearly suggests it is building up for a sharp drop. Don’t try to bottom-fish—the RSI is falling across the board, hovering around 35, and weakness couldn’t be more obvious. Just follow the trend and short it!
📊Market Data:
Market sentiment is overwhelmingly bearish! Buy-side order book depth is only a little more than half of the sell side, and the dumpers aren’t giving you any breathing room. The large-account long/short ratio is only 0.45, meaning these players are quietly building short positions. Overall open interest is also suppressed at 0.44, showing bears fully in control. Funding rates are flat near zero, which means there are basically no longs stepping in to take the other side. Every rebound is just an opportunity to escape! There is no active buying support on the order book, and this downtrend is firmly established!
🔥Trading Advice:
SNDK-Short-Take Profit 2%
💡Don’t hesitate, seize the opportunity; volatility is high, so pay attention to timely stop-losses and strictly control position size.
Brothers, the bears on SNDK have already made their move! A dual-cycle MACD death cross resonance is in play, and the 15-minute and 1-hour moving averages are all in bearish alignment. This is a classic dump setup! The price is now stuck around 1771, barely moving, with heavy resistance above. The trend clearly suggests it is building up for a sharp drop. Don’t try to bottom-fish—the RSI is falling across the board, hovering around 35, and weakness couldn’t be more obvious. Just follow the trend and short it!
📊Market Data:
Market sentiment is overwhelmingly bearish! Buy-side order book depth is only a little more than half of the sell side, and the dumpers aren’t giving you any breathing room. The large-account long/short ratio is only 0.45, meaning these players are quietly building short positions. Overall open interest is also suppressed at 0.44, showing bears fully in control. Funding rates are flat near zero, which means there are basically no longs stepping in to take the other side. Every rebound is just an opportunity to escape! There is no active buying support on the order book, and this downtrend is firmly established!
🔥Trading Advice:
SNDK-Short-Take Profit 2%
💡Don’t hesitate, seize the opportunity; volatility is high, so pay attention to timely stop-losses and strictly control position size.
🚨Breaking ATM Spot Buy Signal:
ATM short-term trend has suddenly turned bullish across the board. The 1-hour and 15-minute MACD have both just formed a bullish crossover, the moving average system is in a bullish alignment, and the pattern has just started. This is a very critical point! The current price is 1.16, right at the threshold before a breakout. Funds have already started flowing in to accumulate positions. Keep a close eye on this level and don’t chase after it has already gone up! Now is the time to get in while momentum has just started!
📊Market Data:
On the order book side, buying strength is outweighing selling pressure, with an order depth ratio of 1.07, indicating solid support below. Active buying and selling remain balanced, and market sentiment is shifting from hesitation to a unanimous bullish outlook. Short-term momentum has already strengthened first. Once it breaks out with volume, the upside room will open quickly. For this kind of volume-price coordinated move, you should act decisively.
🔥Trading Advice:
ATM-Buy-Take Profit 2%
💡Don’t hesitate, seize the opportunity; market volatility is high, so pay attention to timely stop-losses and strictly control position size.
ATM short-term trend has suddenly turned bullish across the board. The 1-hour and 15-minute MACD have both just formed a bullish crossover, the moving average system is in a bullish alignment, and the pattern has just started. This is a very critical point! The current price is 1.16, right at the threshold before a breakout. Funds have already started flowing in to accumulate positions. Keep a close eye on this level and don’t chase after it has already gone up! Now is the time to get in while momentum has just started!
📊Market Data:
On the order book side, buying strength is outweighing selling pressure, with an order depth ratio of 1.07, indicating solid support below. Active buying and selling remain balanced, and market sentiment is shifting from hesitation to a unanimous bullish outlook. Short-term momentum has already strengthened first. Once it breaks out with volume, the upside room will open quickly. For this kind of volume-price coordinated move, you should act decisively.
🔥Trading Advice:
ATM-Buy-Take Profit 2%
💡Don’t hesitate, seize the opportunity; market volatility is high, so pay attention to timely stop-losses and strictly control position size.
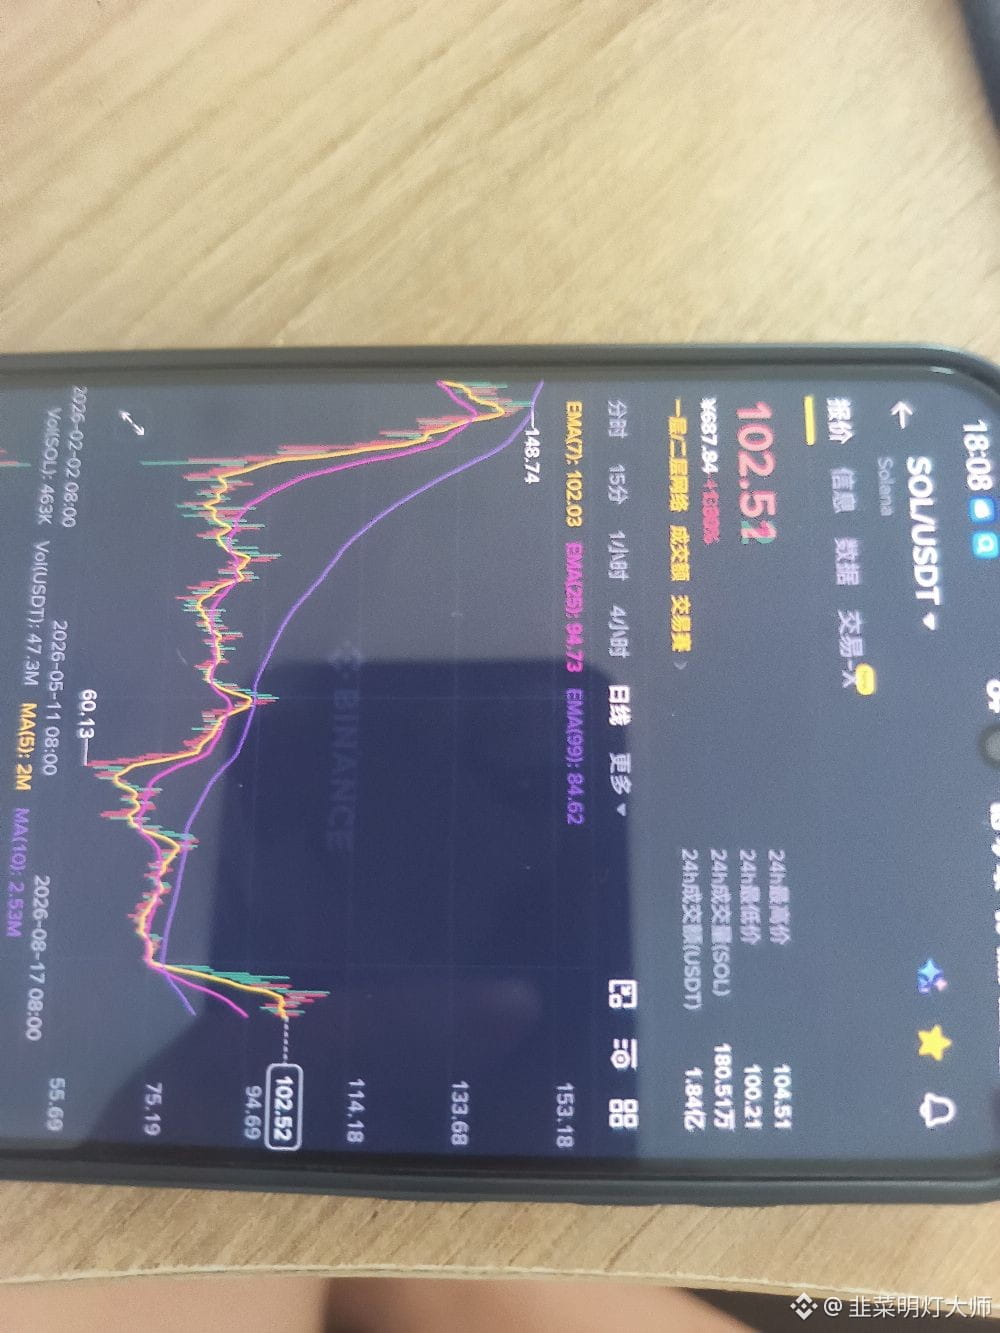
🚨Urgent SOL futures short signal:
Bro, the market looks off! SOL short-term bears have already sounded the alarm! On the 1-hour and 15-minute charts, MACD has formed a bearish crossover on both timeframes, moving averages are fully aligned in a bearish setup, rebounds have no strength, and bullish momentum has completely dropped out! Although the 4-hour chart is still stubbornly holding a golden cross, that’s just a baiting-up illusion; the bigger trend is already rolling over. If 105 cannot hold, the drop could happen in an instant. Don’t fight the trend—if not short now, when?
📊Market data:
Sentiment in the market is also very weak! Funding rates are flat at zero, which means leveraged longs haven’t stepped in to prop things up; order book depth is evenly split between bids and asks, and no one is willing to aggressively lift offers with large orders. The global long-short ratio is 1.95, while the big-money direction is 2.17, clearly showing retail traders are heavily long while the pros are quietly shorting. Combined with weak bid support, the main players could flip and dump at any moment! With this kind of data structure, the support levels are all paper-thin.
🔥Trading idea:
SOL - Short - Take profit 1.5%
💡Don’t hesitate, seize the opportunity; market volatility is high, so make sure to cut losses in time and strictly control position size.
Bro, the market looks off! SOL short-term bears have already sounded the alarm! On the 1-hour and 15-minute charts, MACD has formed a bearish crossover on both timeframes, moving averages are fully aligned in a bearish setup, rebounds have no strength, and bullish momentum has completely dropped out! Although the 4-hour chart is still stubbornly holding a golden cross, that’s just a baiting-up illusion; the bigger trend is already rolling over. If 105 cannot hold, the drop could happen in an instant. Don’t fight the trend—if not short now, when?
📊Market data:
Sentiment in the market is also very weak! Funding rates are flat at zero, which means leveraged longs haven’t stepped in to prop things up; order book depth is evenly split between bids and asks, and no one is willing to aggressively lift offers with large orders. The global long-short ratio is 1.95, while the big-money direction is 2.17, clearly showing retail traders are heavily long while the pros are quietly shorting. Combined with weak bid support, the main players could flip and dump at any moment! With this kind of data structure, the support levels are all paper-thin.
🔥Trading idea:
SOL - Short - Take profit 1.5%
💡Don’t hesitate, seize the opportunity; market volatility is high, so make sure to cut losses in time and strictly control position size.
🚨Breaking NEXO spot buy signal:
NEXO needs to be watched closely now! On the 1-hour and 15-minute charts, MACD golden crosses have appeared simultaneously, and the moving averages are also lined up in a bullish formation. Short-term momentum is already strongly resonating. The price is holding steady around 0.84, and the market is voting with its feet. Once this level breaks out with volume, it will be the ignition point for an acceleration move upward! Don’t wait to chase after it has already risen; now is the best time to position early!
📊Market data:
Order book bids are slightly weaker than asks, and order purity is moderately neutral, but active buying and selling funds have not shown any obvious retreat, indicating limited selling pressure. Short-term momentum has just started. As long as volume follows through, breaking the upper resistance will simply be a matter of moving with the trend. Don’t hesitate—signals of multi-timeframe synchronized strength like this do not come often! Hold firm as long as 0.83 remains unbroken, and keep the long position!
🔥Trading suggestion:
NEXO-Buy-Take profit 2%
💡Don’t hesitate, seize the opportunity; market volatility is high, pay attention to timely stop-losses, and strictly control position size.
NEXO needs to be watched closely now! On the 1-hour and 15-minute charts, MACD golden crosses have appeared simultaneously, and the moving averages are also lined up in a bullish formation. Short-term momentum is already strongly resonating. The price is holding steady around 0.84, and the market is voting with its feet. Once this level breaks out with volume, it will be the ignition point for an acceleration move upward! Don’t wait to chase after it has already risen; now is the best time to position early!
📊Market data:
Order book bids are slightly weaker than asks, and order purity is moderately neutral, but active buying and selling funds have not shown any obvious retreat, indicating limited selling pressure. Short-term momentum has just started. As long as volume follows through, breaking the upper resistance will simply be a matter of moving with the trend. Don’t hesitate—signals of multi-timeframe synchronized strength like this do not come often! Hold firm as long as 0.83 remains unbroken, and keep the long position!
🔥Trading suggestion:
NEXO-Buy-Take profit 2%
💡Don’t hesitate, seize the opportunity; market volatility is high, pay attention to timely stop-losses, and strictly control position size.
🚨Urgent SNXX contract short signal:
This SNXX trend looks off! On both the 1-hour and 15-minute charts, MACD has crossed bearish, and the moving averages are all arranged in a bearish formation. The market is already giving off a strong downside vibe. Price is barely holding around 17.96 now, but this is just the calm before the storm. Bulls can’t hold it up at all—want a rebound? Not a chance! The current price is exactly where bears should take action. Don’t hesitate, follow this move!
📊Market data:
Selling pressure is clearly dominating the market now, with the order book buy/sell ratio at only 0.56, and aggressive sell orders continuing to build. The funding rate has dropped to -0.0541%, and the futures market has already tilted toward the bearish camp. The global long/short ratio has fallen to 0.8365, and the large-account direction is down to 0.8957, which means the big players don’t plan to leave any room for the bulls either. Enough downward momentum has accumulated on the chart, just waiting for the moment of a breakdown to trigger it.
🔥Trading suggestion:
SNXX-Short-Take profit 1.5%
💡Don’t hesitate, seize the opportunity; market volatility is high, so pay attention to timely stop-losses and strictly control position size.
This SNXX trend looks off! On both the 1-hour and 15-minute charts, MACD has crossed bearish, and the moving averages are all arranged in a bearish formation. The market is already giving off a strong downside vibe. Price is barely holding around 17.96 now, but this is just the calm before the storm. Bulls can’t hold it up at all—want a rebound? Not a chance! The current price is exactly where bears should take action. Don’t hesitate, follow this move!
📊Market data:
Selling pressure is clearly dominating the market now, with the order book buy/sell ratio at only 0.56, and aggressive sell orders continuing to build. The funding rate has dropped to -0.0541%, and the futures market has already tilted toward the bearish camp. The global long/short ratio has fallen to 0.8365, and the large-account direction is down to 0.8957, which means the big players don’t plan to leave any room for the bulls either. Enough downward momentum has accumulated on the chart, just waiting for the moment of a breakdown to trigger it.
🔥Trading suggestion:
SNXX-Short-Take profit 1.5%
💡Don’t hesitate, seize the opportunity; market volatility is high, so pay attention to timely stop-losses and strictly control position size.
🚨Breaking VIRTUAL Futures Long Signal:
Brothers, the VIRTUAL bulls are taking charge! The 4-hour MACD has just formed a golden cross and pushed up sharply, moving averages are aligned in a full bullish formation, and the 1-hour timeframe is in synchronous resonance. This is a textbook dual-timeframe bullish breakout setup! Price has just started moving around 0.71, volume is beginning to release, so don’t wait any longer. Signals like this don’t come around often! Bears are standing on the sidelines in a daze, while bulls have already taken control of the pace. Just go for it!
📊Market Data:
Market sentiment is interesting: the global long/short ratio is only 0.81, which shows retail traders are still waiting or even leaning bearish, but whales are pushing it straight up to 1.25. Smart money is moving against retail again—do we really need to hesitate about this direction? Funding rates are as low as 0.005%, so the futures market is not overheated, and there’s no burden on the bullish push. Note that the buy/sell ratio of 0.64 is slightly defensive, but once the main players light the fuse, short covering will become fuel for the rally!
🔥Trading Suggestion:
VIRTUAL-Long-Take Profit 4%
💡Don’t hesitate, seize the opportunity; market volatility is high, so pay attention to timely stop-losses and strictly control position size.
Brothers, the VIRTUAL bulls are taking charge! The 4-hour MACD has just formed a golden cross and pushed up sharply, moving averages are aligned in a full bullish formation, and the 1-hour timeframe is in synchronous resonance. This is a textbook dual-timeframe bullish breakout setup! Price has just started moving around 0.71, volume is beginning to release, so don’t wait any longer. Signals like this don’t come around often! Bears are standing on the sidelines in a daze, while bulls have already taken control of the pace. Just go for it!
📊Market Data:
Market sentiment is interesting: the global long/short ratio is only 0.81, which shows retail traders are still waiting or even leaning bearish, but whales are pushing it straight up to 1.25. Smart money is moving against retail again—do we really need to hesitate about this direction? Funding rates are as low as 0.005%, so the futures market is not overheated, and there’s no burden on the bullish push. Note that the buy/sell ratio of 0.64 is slightly defensive, but once the main players light the fuse, short covering will become fuel for the rally!
🔥Trading Suggestion:
VIRTUAL-Long-Take Profit 4%
💡Don’t hesitate, seize the opportunity; market volatility is high, so pay attention to timely stop-losses and strictly control position size.
Log in to explore more content