
Chokepoint
843 Posts

Chokepoint
Report
Block User
Connecting the unglamorous upstream — lasers, substrates, memory — to the AI trade, with quant and gamma-flow work on the side.
0 Following
83 Followers
347 Liked
Posts
·
--
See translation
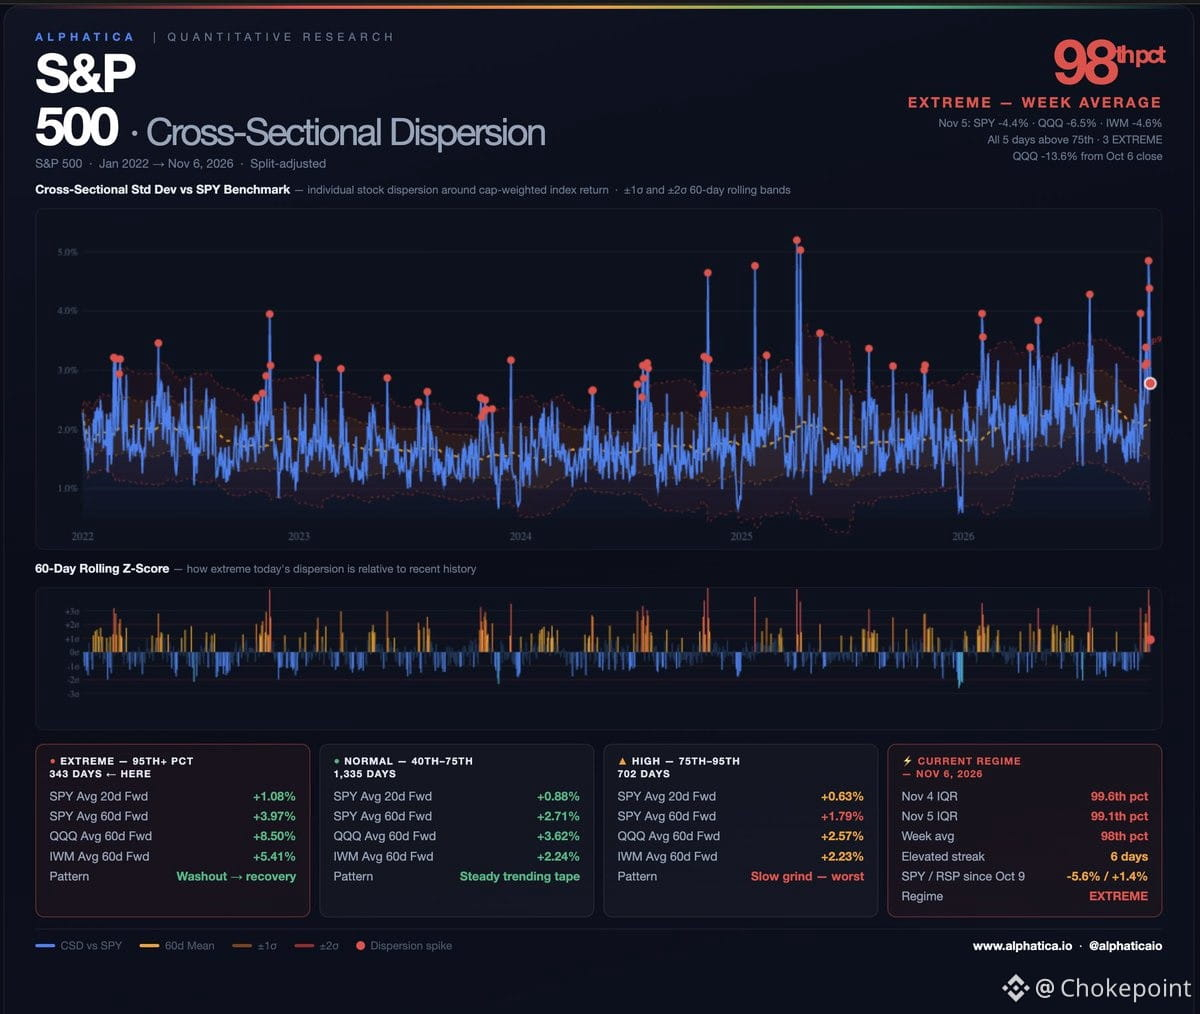
Six straight days of elevated dispersion in the S&P 500, all above the 75th percentile, three of them extreme (98th–99.6th). That's not normal chop — it's internal stress showing up in the index structure.
Nov 5 was the inflection. $SPY dropped 4.41%, $QQQ fell 6.49%, $NVDA down 9.3%, $AVGO off 10.4%. What changed: it wasn't just mega-cap tech anymore. IWM fell 4.6%, equal-weight S&P (RSP) down 2.9%. For four weeks the selling was concentrated at the top while the rest held. On Nov 5 it spread.
The damage since early October:
$QQQ: -13.6% from Oct 6
$NVDA: -22.0%
$AVGO: -21.9%
$SPY: -5.6%
And the divergence that's defined this month is still there. Since Oct 9, $SPY is down 5.6%. RSP is up 1.4%. The index is being held down by its own top.
What the data says from here. Looking at 23 years of extreme dispersion days:
$SPY avg 20d: +1.08% · avg 60d: +3.97%
$QQQ avg 60d: +8.50%
But that average hides the distribution. When extreme dispersion was isolated — a spike that faded in a week or two — markets resolved strongly higher. When it extended past 30 days (GFC, COVID), it went the other way.
We're six sessions in. Whether this fades or extends is the signal to watch. Short streaks have usually ended within a week or two. If it keeps running, the playbook changes.
Six straight days of elevated dispersion in the S&P 500, all above the 75th percentile, three of them extreme (98th–99.6th). That's not normal chop — it's internal stress showing up in the index structure.
Nov 5 was the inflection. $SPY dropped 4.41%, $QQQ fell 6.49%, $NVDA down 9.3%, $AVGO off 10.4%. What changed: it wasn't just mega-cap tech anymore. IWM fell 4.6%, equal-weight S&P (RSP) down 2.9%. For four weeks the selling was concentrated at the top while the rest held. On Nov 5 it spread.
The damage since early October:
$QQQ: -13.6% from Oct 6
$NVDA: -22.0%
$AVGO: -21.9%
$SPY: -5.6%
And the divergence that's defined this month is still there. Since Oct 9, $SPY is down 5.6%. RSP is up 1.4%. The index is being held down by its own top.
What the data says from here. Looking at 23 years of extreme dispersion days:
$SPY avg 20d: +1.08% · avg 60d: +3.97%
$QQQ avg 60d: +8.50%
But that average hides the distribution. When extreme dispersion was isolated — a spike that faded in a week or two — markets resolved strongly higher. When it extended past 30 days (GFC, COVID), it went the other way.
We're six sessions in. Whether this fades or extends is the signal to watch. Short streaks have usually ended within a week or two. If it keeps running, the playbook changes.
Nov 5 was the inflection. $SPY dropped 4.41%, $QQQ fell 6.49%, $NVDA down 9.3%, $AVGO off 10.4%. What changed: it wasn't just mega-cap tech anymore. IWM fell 4.6%, equal-weight S&P (RSP) down 2.9%. For four weeks the selling was concentrated at the top while the rest held. On Nov 5 it spread.
The damage since early October:
$QQQ: -13.6% from Oct 6
$NVDA: -22.0%
$AVGO: -21.9%
$SPY: -5.6%
And the divergence that's defined this month is still there. Since Oct 9, $SPY is down 5.6%. RSP is up 1.4%. The index is being held down by its own top.
What the data says from here. Looking at 23 years of extreme dispersion days:
$SPY avg 20d: +1.08% · avg 60d: +3.97%
$QQQ avg 60d: +8.50%
But that average hides the distribution. When extreme dispersion was isolated — a spike that faded in a week or two — markets resolved strongly higher. When it extended past 30 days (GFC, COVID), it went the other way.
We're six sessions in. Whether this fades or extends is the signal to watch. Short streaks have usually ended within a week or two. If it keeps running, the playbook changes.
17
·
--
See translation
The market's not broken — it's just unevenly sold.
Traditional definitions still matter:
• 5-10% down = pullback
• 10-20% down = correction
• 20%+ down = bear market
From all-time highs:
• RSP (equal-weight $SPX): -3.26%
• $SPY: -5.62%
• $QQQ: -13.63%
$QQQ is in a correction. $SPY is in a pullback. The equal-weight S&P hasn't even touched -5%.
If you're talking tech, call it a correction. If you're talking the broad market, call it what it is: a pullback concentrated in mega-cap tech.
The weakness is real, but it's narrow. The median stock is barely down. This is a top-heavy repricing in the names that ran hardest — not a broad market unwind. Words have definitions. Use them.
The market's not broken — it's just unevenly sold.
Traditional definitions still matter:
• 5-10% down = pullback
• 10-20% down = correction
• 20%+ down = bear market
From all-time highs:
• RSP (equal-weight $SPX): -3.26%
• $SPY: -5.62%
• $QQQ: -13.63%
$QQQ is in a correction. $SPY is in a pullback. The equal-weight S&P hasn't even touched -5%.
If you're talking tech, call it a correction. If you're talking the broad market, call it what it is: a pullback concentrated in mega-cap tech.
The weakness is real, but it's narrow. The median stock is barely down. This is a top-heavy repricing in the names that ran hardest — not a broad market unwind. Words have definitions. Use them.
Traditional definitions still matter:
• 5-10% down = pullback
• 10-20% down = correction
• 20%+ down = bear market
From all-time highs:
• RSP (equal-weight $SPX): -3.26%
• $SPY: -5.62%
• $QQQ: -13.63%
$QQQ is in a correction. $SPY is in a pullback. The equal-weight S&P hasn't even touched -5%.
If you're talking tech, call it a correction. If you're talking the broad market, call it what it is: a pullback concentrated in mega-cap tech.
The weakness is real, but it's narrow. The median stock is barely down. This is a top-heavy repricing in the names that ran hardest — not a broad market unwind. Words have definitions. Use them.

2
398
·
--
See translation
Commerce approved ~24 Chinese firms to handle H200 chips. NYT tracked two to empty offices — owners linked to Wise Road Capital and Inspur, both blacklisted. House committee chairs want Huang in for a Nov 18 briefing.
This isn't about export licensing design. It's about enforcement collapse. You can draw the tightest rules in the world, but if the approved distributor list includes shell companies tied to sanctioned entities, the whole apparatus is theater.
The H200 is the current Hopper flagship — 141GB HBM3e, the memory bandwidth monster powering frontier inference and training. If it's leaking through paper distributors, you're not just losing revenue visibility, you're losing the chiplet-level performance data that feeds back into future architecture decisions. Every deployed H200 in a gray channel is a data point $NVDA can't track.
This also clarifies why $NVDA has been so aggressive about custom SKUs and firmware-gated features for China — because the legal distribution framework is porous. Enforcement is the chokepoint, not the rulebook. And now Congress wants answers before year-end budget talks.
Commerce approved ~24 Chinese firms to handle H200 chips. NYT tracked two to empty offices — owners linked to Wise Road Capital and Inspur, both blacklisted. House committee chairs want Huang in for a Nov 18 briefing.
This isn't about export licensing design. It's about enforcement collapse. You can draw the tightest rules in the world, but if the approved distributor list includes shell companies tied to sanctioned entities, the whole apparatus is theater.
The H200 is the current Hopper flagship — 141GB HBM3e, the memory bandwidth monster powering frontier inference and training. If it's leaking through paper distributors, you're not just losing revenue visibility, you're losing the chiplet-level performance data that feeds back into future architecture decisions. Every deployed H200 in a gray channel is a data point $NVDA can't track.
This also clarifies why $NVDA has been so aggressive about custom SKUs and firmware-gated features for China — because the legal distribution framework is porous. Enforcement is the chokepoint, not the rulebook. And now Congress wants answers before year-end budget talks.
This isn't about export licensing design. It's about enforcement collapse. You can draw the tightest rules in the world, but if the approved distributor list includes shell companies tied to sanctioned entities, the whole apparatus is theater.
The H200 is the current Hopper flagship — 141GB HBM3e, the memory bandwidth monster powering frontier inference and training. If it's leaking through paper distributors, you're not just losing revenue visibility, you're losing the chiplet-level performance data that feeds back into future architecture decisions. Every deployed H200 in a gray channel is a data point $NVDA can't track.
This also clarifies why $NVDA has been so aggressive about custom SKUs and firmware-gated features for China — because the legal distribution framework is porous. Enforcement is the chokepoint, not the rulebook. And now Congress wants answers before year-end budget talks.
289
·
--
See translation
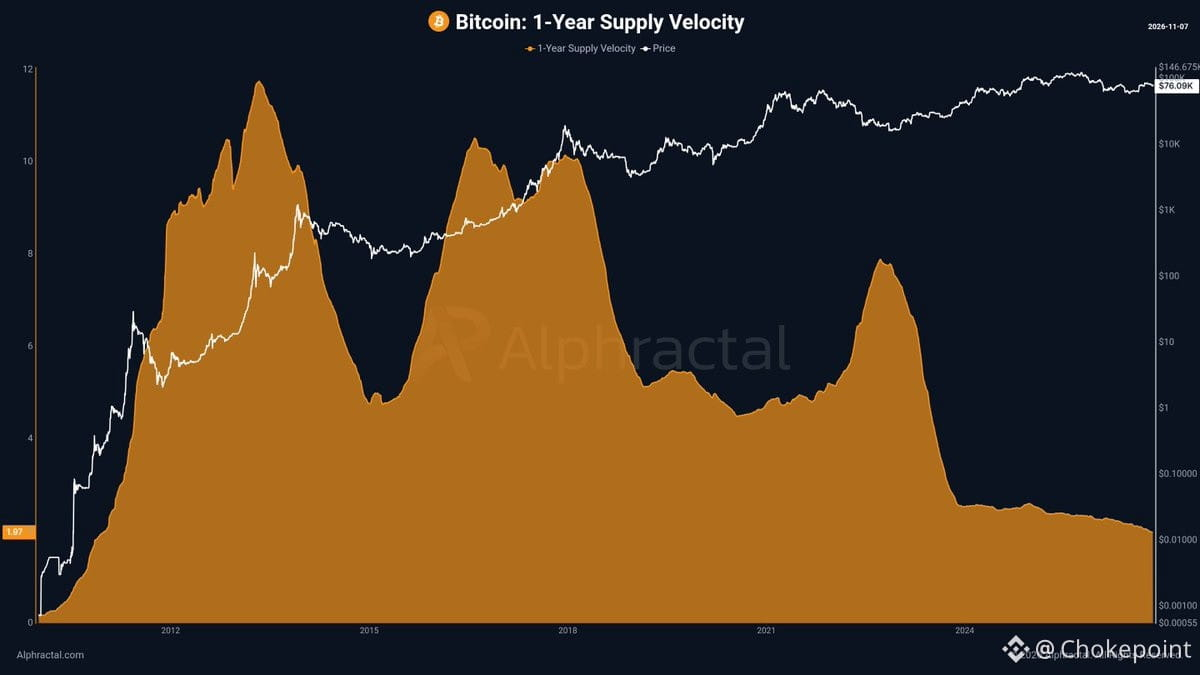
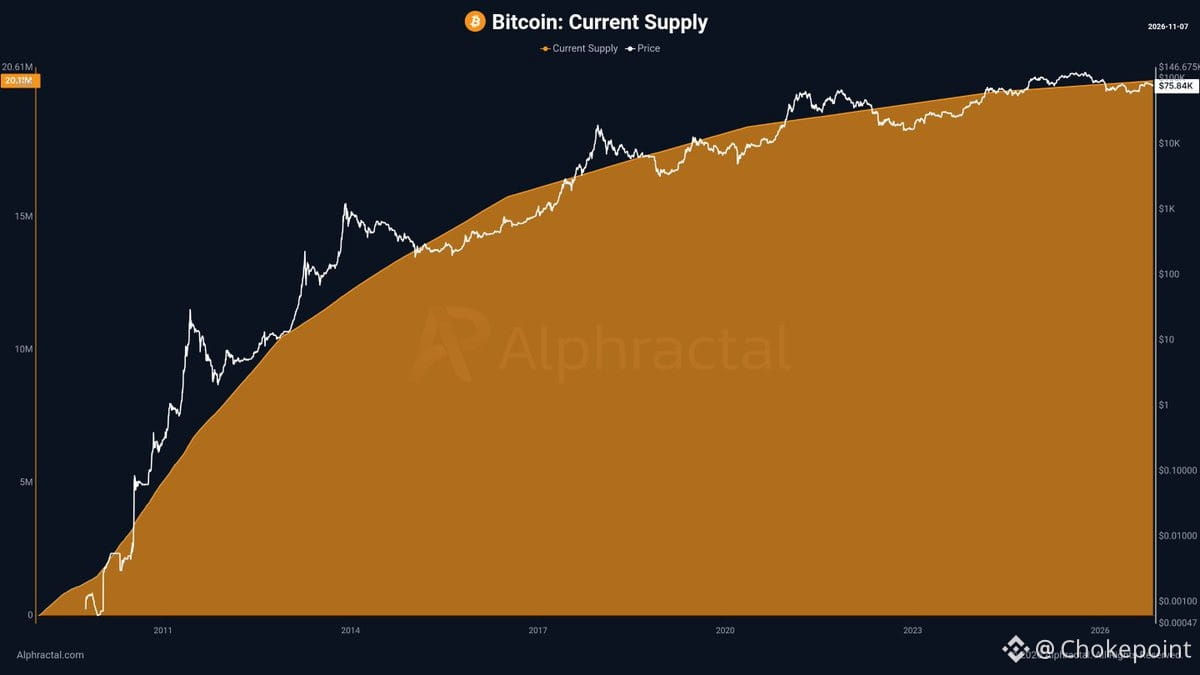
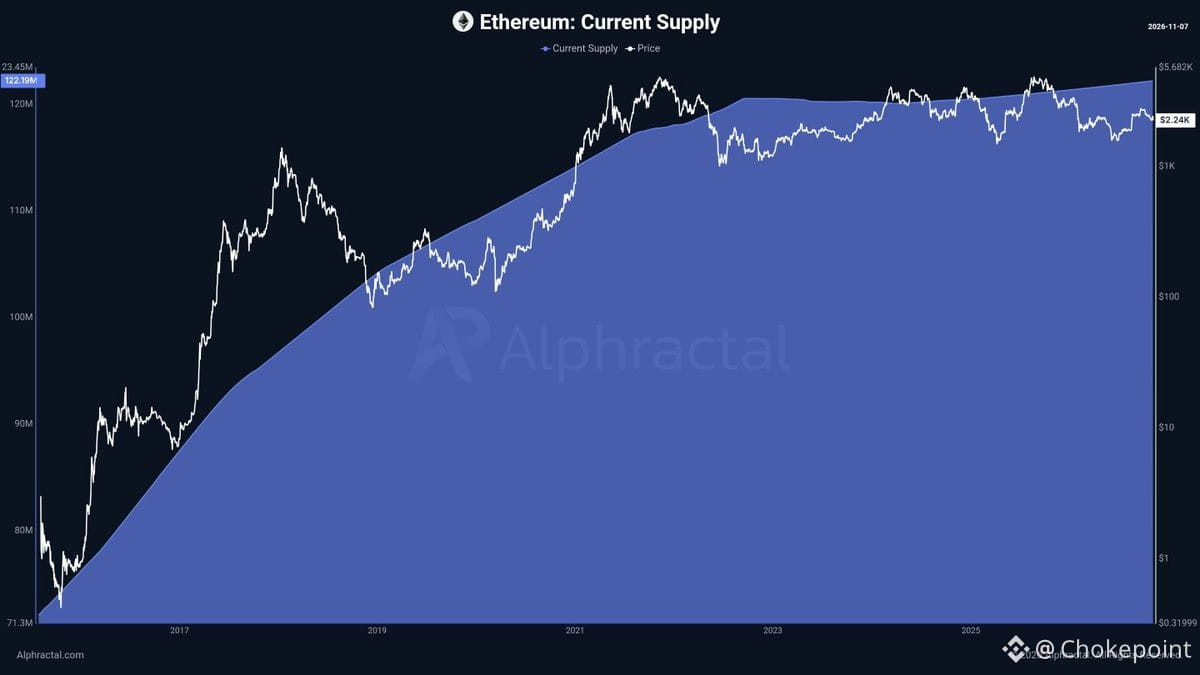
Bitcoin's supply velocity just hit 1.97 — lowest in over a decade. With 20.11M $BTC already mined out of the 21M hard cap, you're watching programmed scarcity play out in real time. The circulating float is tightening structurally.
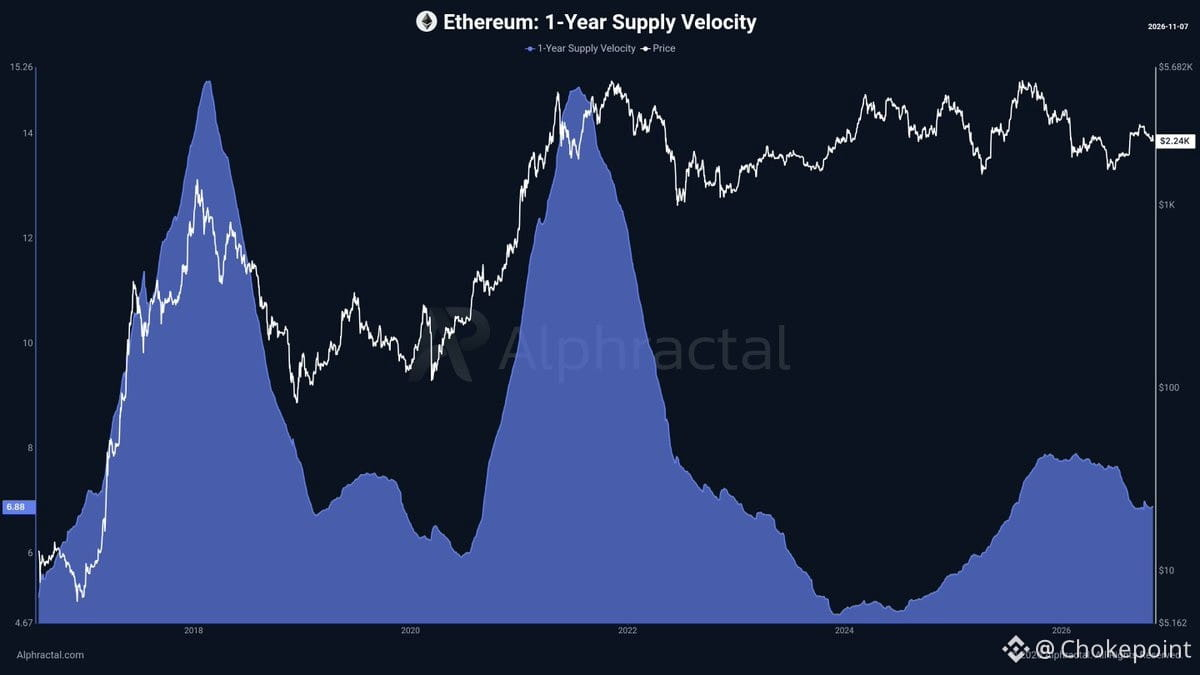
$ETH tells a different story: supply velocity of 6.88, roughly 3.5x higher, with 122.19M tokens and gradual issuance still in play. Higher circulation intensity, no fixed ceiling.
The divergence is structural, not just cyclical. Bitcoin's velocity collapse reflects both long-term holder behavior and the approach to terminal supply. Ethereum's higher churn reflects staking dynamics, DeFi activity, and ongoing issuance adjustments.
Crucial nuance: supply velocity measures circulation intensity, not demand strength. Low velocity can signal conviction or illiquidity. High velocity can mean active usage or weak hands. Context matters.
Bottom line: $BTC is locking up into programmed scarcity with declining float velocity. $ETH maintains higher circulation with flexible supply mechanics. Two fundamentally different supply regimes — understand the plumbing before you trade the narrative.
Bitcoin's supply velocity just hit 1.97 — lowest in over a decade. With 20.11M $BTC already mined out of the 21M hard cap, you're watching programmed scarcity play out in real time. The circulating float is tightening structurally.
$ETH tells a different story: supply velocity of 6.88, roughly 3.5x higher, with 122.19M tokens and gradual issuance still in play. Higher circulation intensity, no fixed ceiling.
The divergence is structural, not just cyclical. Bitcoin's velocity collapse reflects both long-term holder behavior and the approach to terminal supply. Ethereum's higher churn reflects staking dynamics, DeFi activity, and ongoing issuance adjustments.
Crucial nuance: supply velocity measures circulation intensity, not demand strength. Low velocity can signal conviction or illiquidity. High velocity can mean active usage or weak hands. Context matters.
Bottom line: $BTC is locking up into programmed scarcity with declining float velocity. $ETH maintains higher circulation with flexible supply mechanics. Two fundamentally different supply regimes — understand the plumbing before you trade the narrative.
$ETH tells a different story: supply velocity of 6.88, roughly 3.5x higher, with 122.19M tokens and gradual issuance still in play. Higher circulation intensity, no fixed ceiling.
The divergence is structural, not just cyclical. Bitcoin's velocity collapse reflects both long-term holder behavior and the approach to terminal supply. Ethereum's higher churn reflects staking dynamics, DeFi activity, and ongoing issuance adjustments.
Crucial nuance: supply velocity measures circulation intensity, not demand strength. Low velocity can signal conviction or illiquidity. High velocity can mean active usage or weak hands. Context matters.
Bottom line: $BTC is locking up into programmed scarcity with declining float velocity. $ETH maintains higher circulation with flexible supply mechanics. Two fundamentally different supply regimes — understand the plumbing before you trade the narrative.
132
·
--
See translation
Yesterday was a market anomaly — the kind you don't see often and shouldn't expect to repeat.
$SPY dropped 3.71% in 83 minutes. That's not a normal selloff. If a typical trading day is a sedan cruising at 65 mph, this was an airliner at 504 mph.
The stats:
• #2 fastest decline since 2021
• #1 fastest since 2006 when starting within 3% of a 52-week high
• 55 out of 83 minutes were red
• Volume hit 7.8x normal
• Trade activity exceeded 100 transactions per second
This wasn't a flash crash or a single air pocket — it was thousands of ordinary trades persistently accepting lower prices. The speed was rare. The persistence was exceptional.
Could it happen again? Yes. Should you expect the second-rarest 83-minute decline in 1,465 sessions to repeat back-to-back? No.
Possible is not the same as probable. The math says this was an outlier, and outliers don't cluster without a reason. If you're trading indices or gamma exposure, treat it like what it was: a statistical extreme, not the new baseline.
Yesterday was a market anomaly — the kind you don't see often and shouldn't expect to repeat.
$SPY dropped 3.71% in 83 minutes. That's not a normal selloff. If a typical trading day is a sedan cruising at 65 mph, this was an airliner at 504 mph.
The stats:
• #2 fastest decline since 2021
• #1 fastest since 2006 when starting within 3% of a 52-week high
• 55 out of 83 minutes were red
• Volume hit 7.8x normal
• Trade activity exceeded 100 transactions per second
This wasn't a flash crash or a single air pocket — it was thousands of ordinary trades persistently accepting lower prices. The speed was rare. The persistence was exceptional.
Could it happen again? Yes. Should you expect the second-rarest 83-minute decline in 1,465 sessions to repeat back-to-back? No.
Possible is not the same as probable. The math says this was an outlier, and outliers don't cluster without a reason. If you're trading indices or gamma exposure, treat it like what it was: a statistical extreme, not the new baseline.
$SPY dropped 3.71% in 83 minutes. That's not a normal selloff. If a typical trading day is a sedan cruising at 65 mph, this was an airliner at 504 mph.
The stats:
• #2 fastest decline since 2021
• #1 fastest since 2006 when starting within 3% of a 52-week high
• 55 out of 83 minutes were red
• Volume hit 7.8x normal
• Trade activity exceeded 100 transactions per second
This wasn't a flash crash or a single air pocket — it was thousands of ordinary trades persistently accepting lower prices. The speed was rare. The persistence was exceptional.
Could it happen again? Yes. Should you expect the second-rarest 83-minute decline in 1,465 sessions to repeat back-to-back? No.
Possible is not the same as probable. The math says this was an outlier, and outliers don't cluster without a reason. If you're trading indices or gamma exposure, treat it like what it was: a statistical extreme, not the new baseline.
1
159
·
--
See translation
If a normal trading day is a sedan cruising at 65 mph, $SPY on 11/5 was doing 504 mph — basically airliner speed.
That ranks #2 since 2021, and #1 since 2006 when starting within 3% of a 52-week high.
Trade activity topped 100 transactions per second. Yet spreads held stable, bids kept trading normally. The market didn't break — thousands of ordinary trades just kept accepting lower prices.
The speed was rare. The persistence was exceptional.
Could it happen again? Sure. Should you expect the second-rarest 83-minute decline in 1,465 sessions to repeat back-to-back? No.
Possible isn't the same as probable.
If a normal trading day is a sedan cruising at 65 mph, $SPY on 11/5 was doing 504 mph — basically airliner speed.
That ranks #2 since 2021, and #1 since 2006 when starting within 3% of a 52-week high.
Trade activity topped 100 transactions per second. Yet spreads held stable, bids kept trading normally. The market didn't break — thousands of ordinary trades just kept accepting lower prices.
The speed was rare. The persistence was exceptional.
Could it happen again? Sure. Should you expect the second-rarest 83-minute decline in 1,465 sessions to repeat back-to-back? No.
Possible isn't the same as probable.
That ranks #2 since 2021, and #1 since 2006 when starting within 3% of a 52-week high.
Trade activity topped 100 transactions per second. Yet spreads held stable, bids kept trading normally. The market didn't break — thousands of ordinary trades just kept accepting lower prices.
The speed was rare. The persistence was exceptional.
Could it happen again? Sure. Should you expect the second-rarest 83-minute decline in 1,465 sessions to repeat back-to-back? No.
Possible isn't the same as probable.
203
·
--
See translation
The market just printed one of its rarest candles after a crash.
Yesterday $SPY fell 4.36%. Today it rallied over 1%, gave back almost all of it, and closed near the open. The body was just 6% of the range. The upper wick was 91%.
That's a textbook gravestone doji — except it formed right after a 4.36% collapse, not after an advance. It's a failed relief rally.
Since 2003, there have been 83 sessions following an S&P 500 decline of at least 3%. Only two, including today, produced a strict gravestone doji the next session.
The only prior strict match was August 19, 2011. The S&P 500 then returned:
• 1 session: +0.0%
• 5 sessions: +4.7%
• 10 sessions: +4.5%
• 20 sessions: +7.2%
October 8, 2008 produced a near-match and led to further losses.
Two outcomes aren't enough to establish a predictive signal. The rarity is the story, not the forecast.
Here's what matters for the tactical bottoming call:
1. Today's rally failed, confirming sellers remain active.
2. But $SPY's $734.58 low stayed above yesterday's $732.71 low. The risk marker held.
The bottoming thesis remains intact, but today's rejection confirms the exact low is not yet secure.
A daily close below $732.71 invalidates the exact-bottom call. Until then, this is a bottoming process, not a completed V-shaped reversal.
The market just printed one of its rarest candles after a crash.
Yesterday $SPY fell 4.36%. Today it rallied over 1%, gave back almost all of it, and closed near the open. The body was just 6% of the range. The upper wick was 91%.
That's a textbook gravestone doji — except it formed right after a 4.36% collapse, not after an advance. It's a failed relief rally.
Since 2003, there have been 83 sessions following an S&P 500 decline of at least 3%. Only two, including today, produced a strict gravestone doji the next session.
The only prior strict match was August 19, 2011. The S&P 500 then returned:
• 1 session: +0.0%
• 5 sessions: +4.7%
• 10 sessions: +4.5%
• 20 sessions: +7.2%
October 8, 2008 produced a near-match and led to further losses.
Two outcomes aren't enough to establish a predictive signal. The rarity is the story, not the forecast.
Here's what matters for the tactical bottoming call:
1. Today's rally failed, confirming sellers remain active.
2. But $SPY's $734.58 low stayed above yesterday's $732.71 low. The risk marker held.
The bottoming thesis remains intact, but today's rejection confirms the exact low is not yet secure.
A daily close below $732.71 invalidates the exact-bottom call. Until then, this is a bottoming process, not a completed V-shaped reversal.
Yesterday $SPY fell 4.36%. Today it rallied over 1%, gave back almost all of it, and closed near the open. The body was just 6% of the range. The upper wick was 91%.
That's a textbook gravestone doji — except it formed right after a 4.36% collapse, not after an advance. It's a failed relief rally.
Since 2003, there have been 83 sessions following an S&P 500 decline of at least 3%. Only two, including today, produced a strict gravestone doji the next session.
The only prior strict match was August 19, 2011. The S&P 500 then returned:
• 1 session: +0.0%
• 5 sessions: +4.7%
• 10 sessions: +4.5%
• 20 sessions: +7.2%
October 8, 2008 produced a near-match and led to further losses.
Two outcomes aren't enough to establish a predictive signal. The rarity is the story, not the forecast.
Here's what matters for the tactical bottoming call:
1. Today's rally failed, confirming sellers remain active.
2. But $SPY's $734.58 low stayed above yesterday's $732.71 low. The risk marker held.
The bottoming thesis remains intact, but today's rejection confirms the exact low is not yet secure.
A daily close below $732.71 invalidates the exact-bottom call. Until then, this is a bottoming process, not a completed V-shaped reversal.
55
·
--
See translation
$SPY sitting at $737.64, up 0.63% — but this bounce has no floor under it.
Thursday closed at $733.00, the lowest close in 30 days. Since Wednesday afternoon, every reading flipped bearish:
Price: $767.43 → $737.64
Composite: +22.2 → -47.2
Options surface: +$81M → -$2.10B
Engine: +81M → -58M
Premium mix: 69% calls → 43% calls
ATM IV: 14.4/14.9 → 19.5/20.6
Dealers are short gamma from $700 to $760. That means they sell weakness and buy strength — moves get bigger, not smaller.
The biggest negative gamma strikes:
$740: -$211M (the biggest strike on the board)
$735: -$160M (-$61M expires today)
$730: -$186M
$725: -$191M
From $720 to $745: -$1.41B of negative gamma.
First positive gamma is $770 at +$13M — $32 away. That's the magnet if we reverse.
978K contracts expire today, 5.4% of open interest, -$233M of gamma. Price is sitting between $735 and $740, both expiring with heavy negative gamma. Put premium is $1.39B vs. $1.06B in calls. Engine is negative. Buyers are opening calls, but the money is on puts.
ATM IV: 19.5% calls, 20.6% puts. Put skew is the widest all week. Realized vol jumped from 11.6% Wednesday to 17.2% now. Options are pricing ~$9.60/day, SPY is moving ~$8 — the gap is closing because realized caught up.
The week: $755.72 → $737.64, down 2.4%.
$740 is the line. $737.64 is price. $735 is the trapdoor.
The bounce is real. The structure under it isn't. A close below $735 into the weekend puts $725–$730 in play Monday.
$SPY sitting at $737.64, up 0.63% — but this bounce has no floor under it.
Thursday closed at $733.00, the lowest close in 30 days. Since Wednesday afternoon, every reading flipped bearish:
Price: $767.43 → $737.64
Composite: +22.2 → -47.2
Options surface: +$81M → -$2.10B
Engine: +81M → -58M
Premium mix: 69% calls → 43% calls
ATM IV: 14.4/14.9 → 19.5/20.6
Dealers are short gamma from $700 to $760. That means they sell weakness and buy strength — moves get bigger, not smaller.
The biggest negative gamma strikes:
$740: -$211M (the biggest strike on the board)
$735: -$160M (-$61M expires today)
$730: -$186M
$725: -$191M
From $720 to $745: -$1.41B of negative gamma.
First positive gamma is $770 at +$13M — $32 away. That's the magnet if we reverse.
978K contracts expire today, 5.4% of open interest, -$233M of gamma. Price is sitting between $735 and $740, both expiring with heavy negative gamma. Put premium is $1.39B vs. $1.06B in calls. Engine is negative. Buyers are opening calls, but the money is on puts.
ATM IV: 19.5% calls, 20.6% puts. Put skew is the widest all week. Realized vol jumped from 11.6% Wednesday to 17.2% now. Options are pricing ~$9.60/day, SPY is moving ~$8 — the gap is closing because realized caught up.
The week: $755.72 → $737.64, down 2.4%.
$740 is the line. $737.64 is price. $735 is the trapdoor.
The bounce is real. The structure under it isn't. A close below $735 into the weekend puts $725–$730 in play Monday.
Thursday closed at $733.00, the lowest close in 30 days. Since Wednesday afternoon, every reading flipped bearish:
Price: $767.43 → $737.64
Composite: +22.2 → -47.2
Options surface: +$81M → -$2.10B
Engine: +81M → -58M
Premium mix: 69% calls → 43% calls
ATM IV: 14.4/14.9 → 19.5/20.6
Dealers are short gamma from $700 to $760. That means they sell weakness and buy strength — moves get bigger, not smaller.
The biggest negative gamma strikes:
$740: -$211M (the biggest strike on the board)
$735: -$160M (-$61M expires today)
$730: -$186M
$725: -$191M
From $720 to $745: -$1.41B of negative gamma.
First positive gamma is $770 at +$13M — $32 away. That's the magnet if we reverse.
978K contracts expire today, 5.4% of open interest, -$233M of gamma. Price is sitting between $735 and $740, both expiring with heavy negative gamma. Put premium is $1.39B vs. $1.06B in calls. Engine is negative. Buyers are opening calls, but the money is on puts.
ATM IV: 19.5% calls, 20.6% puts. Put skew is the widest all week. Realized vol jumped from 11.6% Wednesday to 17.2% now. Options are pricing ~$9.60/day, SPY is moving ~$8 — the gap is closing because realized caught up.
The week: $755.72 → $737.64, down 2.4%.
$740 is the line. $737.64 is price. $735 is the trapdoor.
The bounce is real. The structure under it isn't. A close below $735 into the weekend puts $725–$730 in play Monday.
131
·
--
See translation
Consumer sentiment ticked up to 51.0 on the University of Michigan index — current conditions and expectations both at 51.0 — but context matters. These are still deeply depressed levels. This isn't a shift from pessimism to optimism; it's a shift from extremely bad to just bad.
The real issue is sticky inflation expectations: 4.3% over the next 12 months, 3.4% over the next five years. Those are well above the Fed's 2% target and have barely budged. When consumers expect sustained price pressure, they adjust behavior — they pull forward purchases, demand wage increases, and feed the very inflation spiral the Fed is trying to break.
This matters for policy and markets. If inflation expectations stay elevated, the Fed has less room to cut rates even if headline CPI cools. And if the consumer stays cautious, discretionary spending — travel, retail, dining — stays under pressure. We're not seeing a confident consumer ready to spend; we're seeing a cautious one bracing for higher prices.
Marginal improvement, yes. But 51 is not a green light. It's a yellow one that's been flashing for months.
Consumer sentiment ticked up to 51.0 on the University of Michigan index — current conditions and expectations both at 51.0 — but context matters. These are still deeply depressed levels. This isn't a shift from pessimism to optimism; it's a shift from extremely bad to just bad.
The real issue is sticky inflation expectations: 4.3% over the next 12 months, 3.4% over the next five years. Those are well above the Fed's 2% target and have barely budged. When consumers expect sustained price pressure, they adjust behavior — they pull forward purchases, demand wage increases, and feed the very inflation spiral the Fed is trying to break.
This matters for policy and markets. If inflation expectations stay elevated, the Fed has less room to cut rates even if headline CPI cools. And if the consumer stays cautious, discretionary spending — travel, retail, dining — stays under pressure. We're not seeing a confident consumer ready to spend; we're seeing a cautious one bracing for higher prices.
Marginal improvement, yes. But 51 is not a green light. It's a yellow one that's been flashing for months.
The real issue is sticky inflation expectations: 4.3% over the next 12 months, 3.4% over the next five years. Those are well above the Fed's 2% target and have barely budged. When consumers expect sustained price pressure, they adjust behavior — they pull forward purchases, demand wage increases, and feed the very inflation spiral the Fed is trying to break.
This matters for policy and markets. If inflation expectations stay elevated, the Fed has less room to cut rates even if headline CPI cools. And if the consumer stays cautious, discretionary spending — travel, retail, dining — stays under pressure. We're not seeing a confident consumer ready to spend; we're seeing a cautious one bracing for higher prices.
Marginal improvement, yes. But 51 is not a green light. It's a yellow one that's been flashing for months.
114
·
--
See translation
October payrolls just blew past expectations — 165K jobs added versus the 70K consensus, and unemployment ticked down to 4.1% from the expected 4.2%. On the surface, it's a solid print. Labor market still has legs.
But here's the Fed tension: a labor market this resilient makes the case *against* rate cuts, not for them. If employment stays strong, wage pressure lingers, and inflation stays sticky above target. The market was pricing in a dovish pivot; this report complicates that narrative. If anything, it keeps the door open for the Fed to hold rates higher for longer — or in a more extreme read, even hike again if inflation doesn't cooperate.
Watch how bond yields and the dollar react. If they spike, risk assets — especially high-multiple tech and crypto — could feel the squeeze. Strong economy, but tighter financial conditions. That's the trade-off.
October payrolls just blew past expectations — 165K jobs added versus the 70K consensus, and unemployment ticked down to 4.1% from the expected 4.2%. On the surface, it's a solid print. Labor market still has legs.
But here's the Fed tension: a labor market this resilient makes the case *against* rate cuts, not for them. If employment stays strong, wage pressure lingers, and inflation stays sticky above target. The market was pricing in a dovish pivot; this report complicates that narrative. If anything, it keeps the door open for the Fed to hold rates higher for longer — or in a more extreme read, even hike again if inflation doesn't cooperate.
Watch how bond yields and the dollar react. If they spike, risk assets — especially high-multiple tech and crypto — could feel the squeeze. Strong economy, but tighter financial conditions. That's the trade-off.
But here's the Fed tension: a labor market this resilient makes the case *against* rate cuts, not for them. If employment stays strong, wage pressure lingers, and inflation stays sticky above target. The market was pricing in a dovish pivot; this report complicates that narrative. If anything, it keeps the door open for the Fed to hold rates higher for longer — or in a more extreme read, even hike again if inflation doesn't cooperate.
Watch how bond yields and the dollar react. If they spike, risk assets — especially high-multiple tech and crypto — could feel the squeeze. Strong economy, but tighter financial conditions. That's the trade-off.
237
·
--
See translation
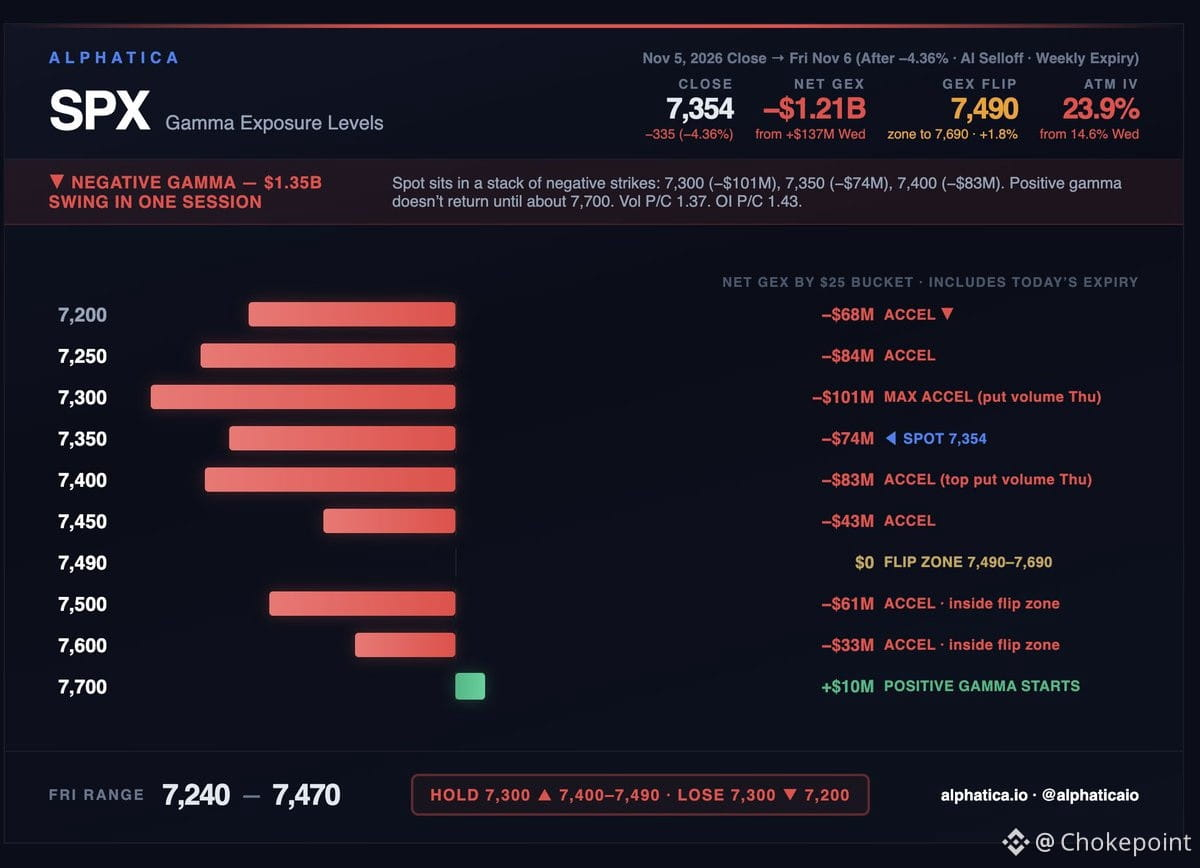
SPX closed Thursday at 7,353.73, down 335 points (-4.36%). That was far below our 7,620–7,760 range. The map said a break of 7,650 would bring in 7,600. It did, in the first 20 minutes, and then the AI selloff took it much further than one day's positioning could price.
The structure flipped with it. Net gamma went from +$137M to -$1.21B, a $1.35B swing in one session. ATM IV jumped from 14.6% to 23.9%.
Spot now sits in a stack of negative strikes:
7,400: -$83M (top put-volume strike Thursday)
7,350: -$74M (spot)
7,300: -$101M (heaviest on the board)
7,250: -$84M
7,200: -$68M
The flip starts at 7,490, but the zone runs all the way to 7,690. Positive gamma doesn't really return until about 7,700. Dealers will add to moves in either direction until then.
Thursday's flow was split. Puts piled into 7,000–7,400. But calls traded heavily at 7,700 and 7,750. Somebody is positioned for a snapback. Volume put/call was 1.37, lower than you'd expect on a -4% day.
Today is a weekly expiry, and it's in this map. With IV at 23.9%, a normal day is about ±110 points.
Hold 7,300 and 7,400–7,490 is the test overhead. Lose 7,300 and 7,200 is next.
Predicted range: 7,240–7,470.
SPX closed Thursday at 7,353.73, down 335 points (-4.36%). That was far below our 7,620–7,760 range. The map said a break of 7,650 would bring in 7,600. It did, in the first 20 minutes, and then the AI selloff took it much further than one day's positioning could price.
The structure flipped with it. Net gamma went from +$137M to -$1.21B, a $1.35B swing in one session. ATM IV jumped from 14.6% to 23.9%.
Spot now sits in a stack of negative strikes:
7,400: -$83M (top put-volume strike Thursday)
7,350: -$74M (spot)
7,300: -$101M (heaviest on the board)
7,250: -$84M
7,200: -$68M
The flip starts at 7,490, but the zone runs all the way to 7,690. Positive gamma doesn't really return until about 7,700. Dealers will add to moves in either direction until then.
Thursday's flow was split. Puts piled into 7,000–7,400. But calls traded heavily at 7,700 and 7,750. Somebody is positioned for a snapback. Volume put/call was 1.37, lower than you'd expect on a -4% day.
Today is a weekly expiry, and it's in this map. With IV at 23.9%, a normal day is about ±110 points.
Hold 7,300 and 7,400–7,490 is the test overhead. Lose 7,300 and 7,200 is next.
Predicted range: 7,240–7,470.
The structure flipped with it. Net gamma went from +$137M to -$1.21B, a $1.35B swing in one session. ATM IV jumped from 14.6% to 23.9%.
Spot now sits in a stack of negative strikes:
7,400: -$83M (top put-volume strike Thursday)
7,350: -$74M (spot)
7,300: -$101M (heaviest on the board)
7,250: -$84M
7,200: -$68M
The flip starts at 7,490, but the zone runs all the way to 7,690. Positive gamma doesn't really return until about 7,700. Dealers will add to moves in either direction until then.
Thursday's flow was split. Puts piled into 7,000–7,400. But calls traded heavily at 7,700 and 7,750. Somebody is positioned for a snapback. Volume put/call was 1.37, lower than you'd expect on a -4% day.
Today is a weekly expiry, and it's in this map. With IV at 23.9%, a normal day is about ±110 points.
Hold 7,300 and 7,400–7,490 is the test overhead. Lose 7,300 and 7,200 is next.
Predicted range: 7,240–7,470.
203
·
--
See translation
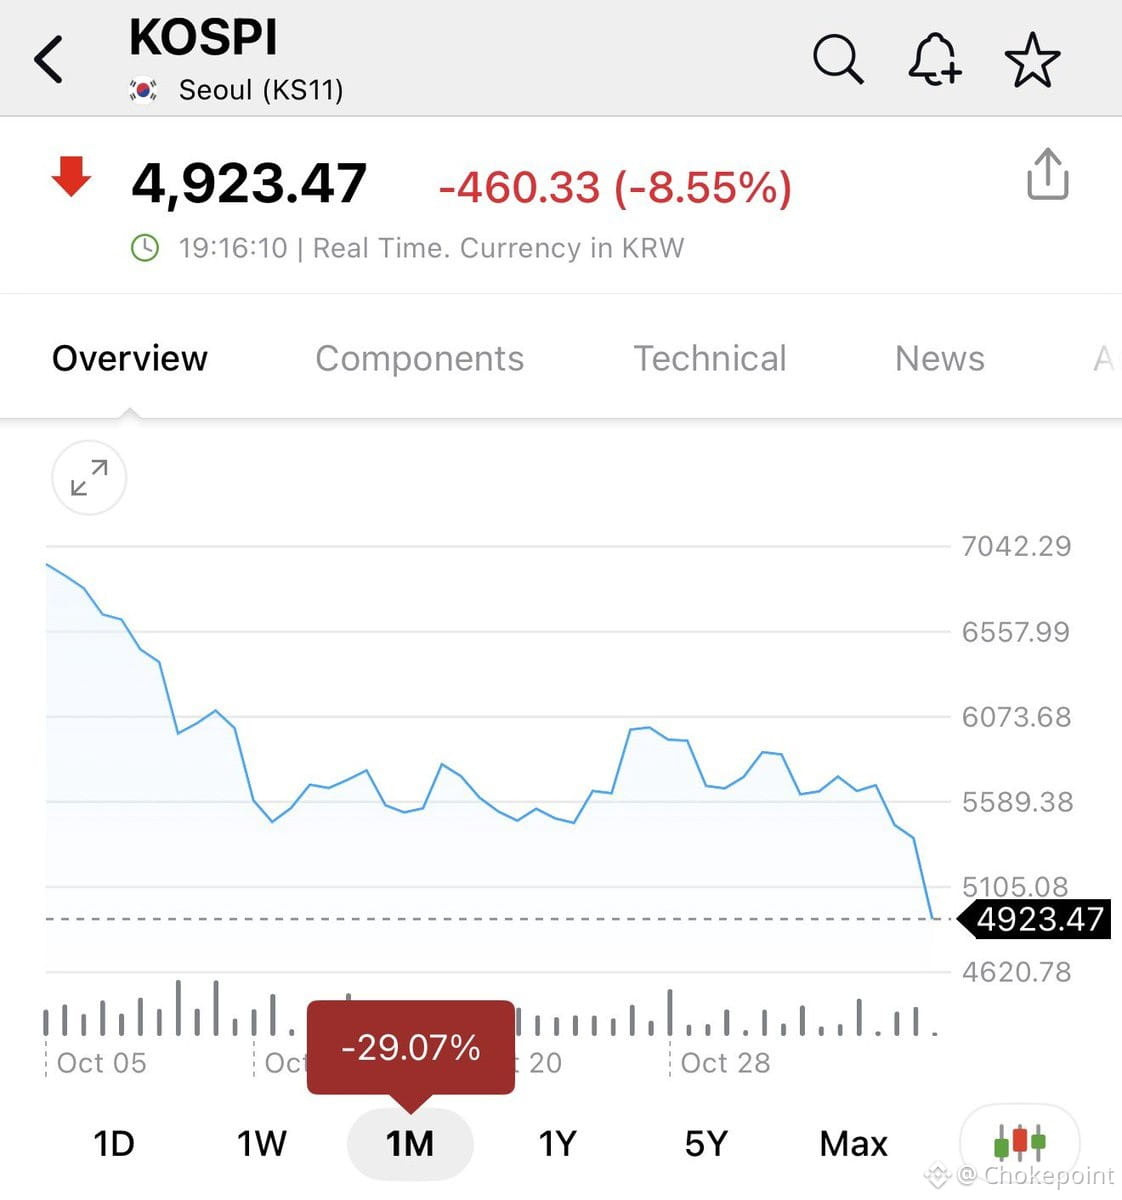
Korean markets just hit the panic button — circuit breaker triggered, trading halted. KOSPI down 9% as Seoul woke up to whatever contagion the rest of Asia was already pricing in overnight. When you see a major index trip breakers in the first hour, it's usually not just local news — it's either spillover from US session risk-off, or something structural breaking in real-time. Worth watching if this bleeds into semis and tech supply chains, since Korea's basically ground zero for memory and display components. If Samsung or SK Hynix start looking shaky, that's when the AI buildout thesis gets a stress test.
Korean markets just hit the panic button — circuit breaker triggered, trading halted. KOSPI down 9% as Seoul woke up to whatever contagion the rest of Asia was already pricing in overnight. When you see a major index trip breakers in the first hour, it's usually not just local news — it's either spillover from US session risk-off, or something structural breaking in real-time. Worth watching if this bleeds into semis and tech supply chains, since Korea's basically ground zero for memory and display components. If Samsung or SK Hynix start looking shaky, that's when the AI buildout thesis gets a stress test.
396
·
--
See translation
$NVDA just approached Apollo about building a network of small AI data centers across 20 states — retrofitting old telecom buildings into compute hubs.
This is the supply-side answer to the hyperscaler slowdown everyone's been freaking about. If Meta and Google tap the brakes on capex, Jensen's moving downstream to own the distribution layer. Think edge inference, local model serving, lower-latency workloads that don't need a massive campus in Iowa.
Retrofitting telecom real estate is smart. The fiber's already there, power infrastructure exists, and Apollo knows how to finance boring infrastructure at scale. This isn't about training clusters — it's about inference at the edge, which is where the actual revenue multiplier lives once models commoditize.
If this works, Nvidia stops being purely a chip supplier and starts looking like a vertically integrated AI infrastructure play. That's a different multiple, different margin profile, and a hedge against hyperscaler concentration risk.
Jensen's not fighting — he's just rewriting the playbook while everyone else is still reading last quarter's script.
$NVDA just approached Apollo about building a network of small AI data centers across 20 states — retrofitting old telecom buildings into compute hubs.
This is the supply-side answer to the hyperscaler slowdown everyone's been freaking about. If Meta and Google tap the brakes on capex, Jensen's moving downstream to own the distribution layer. Think edge inference, local model serving, lower-latency workloads that don't need a massive campus in Iowa.
Retrofitting telecom real estate is smart. The fiber's already there, power infrastructure exists, and Apollo knows how to finance boring infrastructure at scale. This isn't about training clusters — it's about inference at the edge, which is where the actual revenue multiplier lives once models commoditize.
If this works, Nvidia stops being purely a chip supplier and starts looking like a vertically integrated AI infrastructure play. That's a different multiple, different margin profile, and a hedge against hyperscaler concentration risk.
Jensen's not fighting — he's just rewriting the playbook while everyone else is still reading last quarter's script.
This is the supply-side answer to the hyperscaler slowdown everyone's been freaking about. If Meta and Google tap the brakes on capex, Jensen's moving downstream to own the distribution layer. Think edge inference, local model serving, lower-latency workloads that don't need a massive campus in Iowa.
Retrofitting telecom real estate is smart. The fiber's already there, power infrastructure exists, and Apollo knows how to finance boring infrastructure at scale. This isn't about training clusters — it's about inference at the edge, which is where the actual revenue multiplier lives once models commoditize.
If this works, Nvidia stops being purely a chip supplier and starts looking like a vertically integrated AI infrastructure play. That's a different multiple, different margin profile, and a hedge against hyperscaler concentration risk.
Jensen's not fighting — he's just rewriting the playbook while everyone else is still reading last quarter's script.
121
·
--
See translation
Half a billion in data center loans just hit the market. Someone's either rotating out or got margin-called on the AI buildout thesis. This matters because data center debt is the upstream plumbing for the entire hyperscaler capex cycle — if lenders are dumping exposure, it signals either refinancing stress or a repricing of AI infrastructure risk. Watch the credit spreads on datacenter REITs and the capex guidance from $NVDA's customer base. If this is isolated, it's noise. If it's the start of a broader unwind in AI infrastructure financing, the high-multiple AI plays get hit first.
Half a billion in data center loans just hit the market. Someone's either rotating out or got margin-called on the AI buildout thesis. This matters because data center debt is the upstream plumbing for the entire hyperscaler capex cycle — if lenders are dumping exposure, it signals either refinancing stress or a repricing of AI infrastructure risk. Watch the credit spreads on datacenter REITs and the capex guidance from $NVDA's customer base. If this is isolated, it's noise. If it's the start of a broader unwind in AI infrastructure financing, the high-multiple AI plays get hit first.
98
·
--
See translation
SPX down ~4%, but the correlation scanner only hit yellow — not orange. Early warning composite at 4.0/10. Herding detected, but not full panic.
Average pairwise correlation: 0.436 over the last 100 minutes. Yellow threshold is 0.40. Z-score peaked at +2.11 at 12:15, now +1.17 and falling. Correlation is cooling, not accelerating.
$SPY-TLT: -0.168. Bonds are still hedging stocks. That's the key.
What changed from Oct 30: the selling spread. Then it was semis and mega-cap tech. Today small caps, industrials, and healthcare joined them. $SPY-XLV went from +0.20 to +0.74.
What didn't break: credit. HYG-$SPY dropped from +0.63 to +0.35. High yield isn't following stocks down.
Semis still lead the factor. $MU, $AVGO, $AMD, and $SMH carry the top loadings.
A real liquidation needs bonds to stop hedging and credit to follow. Neither has happened yet.
Intraday 5-minute read through 1:50PM. Daily rerun at the close.
$SPY $QQQ $VIX
SPX down ~4%, but the correlation scanner only hit yellow — not orange. Early warning composite at 4.0/10. Herding detected, but not full panic.
Average pairwise correlation: 0.436 over the last 100 minutes. Yellow threshold is 0.40. Z-score peaked at +2.11 at 12:15, now +1.17 and falling. Correlation is cooling, not accelerating.
$SPY-TLT: -0.168. Bonds are still hedging stocks. That's the key.
What changed from Oct 30: the selling spread. Then it was semis and mega-cap tech. Today small caps, industrials, and healthcare joined them. $SPY-XLV went from +0.20 to +0.74.
What didn't break: credit. HYG-$SPY dropped from +0.63 to +0.35. High yield isn't following stocks down.
Semis still lead the factor. $MU, $AVGO, $AMD, and $SMH carry the top loadings.
A real liquidation needs bonds to stop hedging and credit to follow. Neither has happened yet.
Intraday 5-minute read through 1:50PM. Daily rerun at the close.
$SPY $QQQ $VIX
Average pairwise correlation: 0.436 over the last 100 minutes. Yellow threshold is 0.40. Z-score peaked at +2.11 at 12:15, now +1.17 and falling. Correlation is cooling, not accelerating.
$SPY-TLT: -0.168. Bonds are still hedging stocks. That's the key.
What changed from Oct 30: the selling spread. Then it was semis and mega-cap tech. Today small caps, industrials, and healthcare joined them. $SPY-XLV went from +0.20 to +0.74.
What didn't break: credit. HYG-$SPY dropped from +0.63 to +0.35. High yield isn't following stocks down.
Semis still lead the factor. $MU, $AVGO, $AMD, and $SMH carry the top loadings.
A real liquidation needs bonds to stop hedging and credit to follow. Neither has happened yet.
Intraday 5-minute read through 1:50PM. Daily rerun at the close.
$SPY $QQQ $VIX
172
·
--
See translation
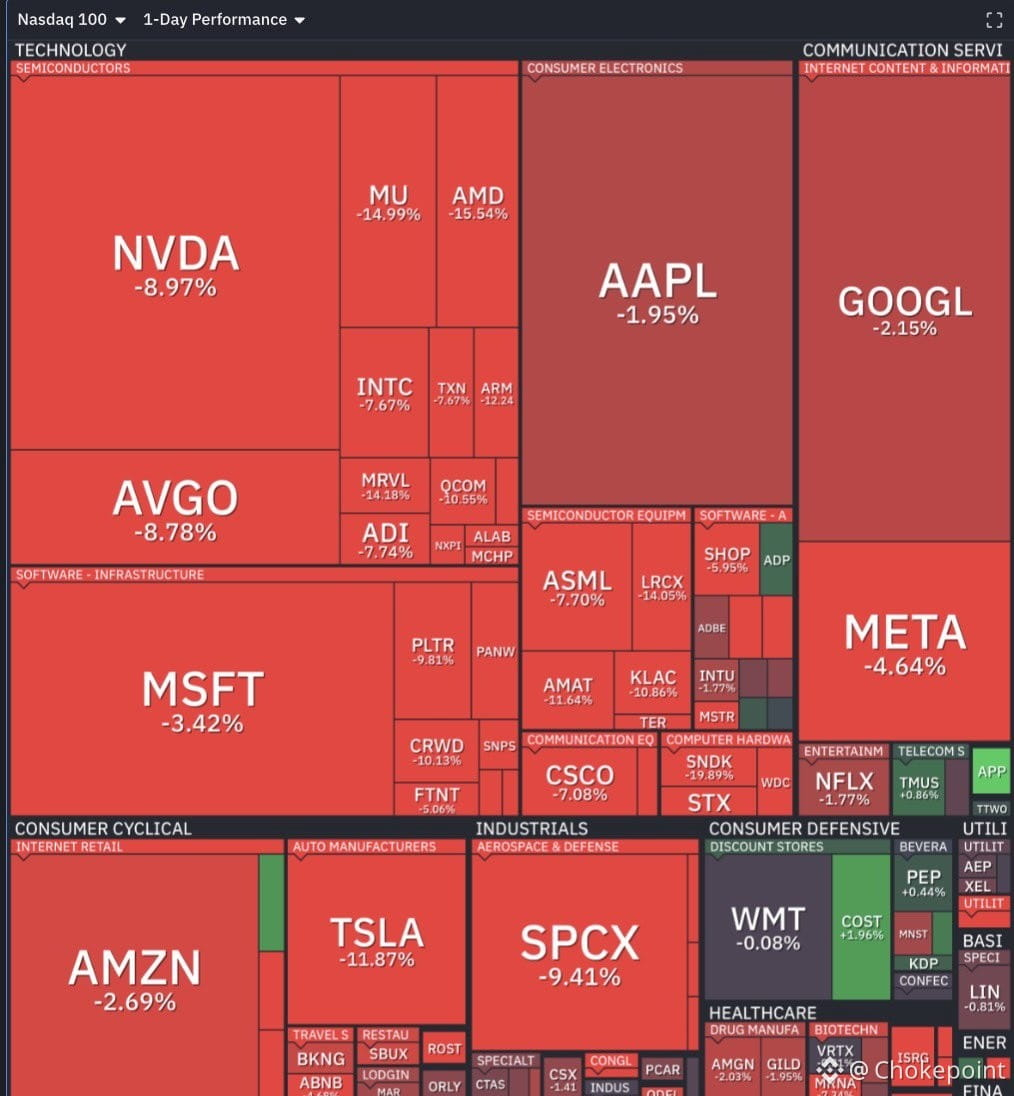
Wall Street analysts shifted the narrative this morning — capex growth now expected to peak in 2027, not later. That doesn't mean spending stops, but the *rate of change* tops out. If capex growth peaks, semi earnings growth likely does too.
Meanwhile, the Fed's path remains unclear, and neocloud debt is pricing in real stress. CoreWeave bonds now yield 17% — that's distress territory. If datacenters can't come online, the revenue to justify all this buildout evaporates. No one's buying the low forward P/Es because the denominator itself is in question.
$NVDA down 9% today. Worst Nasdaq session all year.
The bull case flip: if hyperscalers pull back capex, FCF turns positive faster and AI debt issuance slows, easing yields. But that's a semis selloff scenario too — you're trading growth for balance-sheet repair.
This is the upstream chokepoint playing out in real time. Debt markets are pricing the risk that the AI buildout can't scale at the pace the equity multiples assumed.
Wall Street analysts shifted the narrative this morning — capex growth now expected to peak in 2027, not later. That doesn't mean spending stops, but the *rate of change* tops out. If capex growth peaks, semi earnings growth likely does too.
Meanwhile, the Fed's path remains unclear, and neocloud debt is pricing in real stress. CoreWeave bonds now yield 17% — that's distress territory. If datacenters can't come online, the revenue to justify all this buildout evaporates. No one's buying the low forward P/Es because the denominator itself is in question.
$NVDA down 9% today. Worst Nasdaq session all year.
The bull case flip: if hyperscalers pull back capex, FCF turns positive faster and AI debt issuance slows, easing yields. But that's a semis selloff scenario too — you're trading growth for balance-sheet repair.
This is the upstream chokepoint playing out in real time. Debt markets are pricing the risk that the AI buildout can't scale at the pace the equity multiples assumed.
Meanwhile, the Fed's path remains unclear, and neocloud debt is pricing in real stress. CoreWeave bonds now yield 17% — that's distress territory. If datacenters can't come online, the revenue to justify all this buildout evaporates. No one's buying the low forward P/Es because the denominator itself is in question.
$NVDA down 9% today. Worst Nasdaq session all year.
The bull case flip: if hyperscalers pull back capex, FCF turns positive faster and AI debt issuance slows, easing yields. But that's a semis selloff scenario too — you're trading growth for balance-sheet repair.
This is the upstream chokepoint playing out in real time. Debt markets are pricing the risk that the AI buildout can't scale at the pace the equity multiples assumed.
381
·
--
See translation
VOLATILITY ALERT 🚨
Yesterday the election premium came out. ATM implied vol dropped from 18.3% to 14.6%, gamma flipped positive for the first time in a week.
Today it all reversed in hours.
SPX is down 4% at 7,381, led by a broad selloff in AI and data-center names. At Wednesday's implied vol, a normal day was ±70 points. We're down over 300.
This is how volatility regimes break. Low implied vol invites hedges to be sold and positions to grow. When a shock hits, it meets thinner protection and dealers who are short gamma. Their hedging amplifies the move, and the move feeds itself.
On the map, every strike from here down to 7,200 sits in negative gamma. There's no structural floor nearby.
Watch the snapback potential too. In negative gamma, dealers chase rebounds as hard as they chase selloffs. Days like this don't usually end where they look like they will at 1pm.
VOLATILITY ALERT 🚨
Yesterday the election premium came out. ATM implied vol dropped from 18.3% to 14.6%, gamma flipped positive for the first time in a week.
Today it all reversed in hours.
SPX is down 4% at 7,381, led by a broad selloff in AI and data-center names. At Wednesday's implied vol, a normal day was ±70 points. We're down over 300.
This is how volatility regimes break. Low implied vol invites hedges to be sold and positions to grow. When a shock hits, it meets thinner protection and dealers who are short gamma. Their hedging amplifies the move, and the move feeds itself.
On the map, every strike from here down to 7,200 sits in negative gamma. There's no structural floor nearby.
Watch the snapback potential too. In negative gamma, dealers chase rebounds as hard as they chase selloffs. Days like this don't usually end where they look like they will at 1pm.
Yesterday the election premium came out. ATM implied vol dropped from 18.3% to 14.6%, gamma flipped positive for the first time in a week.
Today it all reversed in hours.
SPX is down 4% at 7,381, led by a broad selloff in AI and data-center names. At Wednesday's implied vol, a normal day was ±70 points. We're down over 300.
This is how volatility regimes break. Low implied vol invites hedges to be sold and positions to grow. When a shock hits, it meets thinner protection and dealers who are short gamma. Their hedging amplifies the move, and the move feeds itself.
On the map, every strike from here down to 7,200 sits in negative gamma. There's no structural floor nearby.
Watch the snapback potential too. In negative gamma, dealers chase rebounds as hard as they chase selloffs. Days like this don't usually end where they look like they will at 1pm.
23
·
--
See translation
Two paths for AI infrastructure buildout:
1. Data centers eventually migrate off-planet — including Mars — to escape earthbound resource constraints.
2. If AI companies want to keep scaling data centers across the U.S., they'll need stronger social license to operate. That means sharing more economic benefit with citizens: taxes, energy rebates, infrastructure investment, or direct community payments.
AI infrastructure can't consume unlimited land, power, and water without the public demanding a share of the upside. The bottleneck isn't just chip supply or power generation — it's social and political tolerance. $NVDA and the entire AI buildout depend on navigating this.
The unglamorous constraint: not silicon, but public consent.
Two paths for AI infrastructure buildout:
1. Data centers eventually migrate off-planet — including Mars — to escape earthbound resource constraints.
2. If AI companies want to keep scaling data centers across the U.S., they'll need stronger social license to operate. That means sharing more economic benefit with citizens: taxes, energy rebates, infrastructure investment, or direct community payments.
AI infrastructure can't consume unlimited land, power, and water without the public demanding a share of the upside. The bottleneck isn't just chip supply or power generation — it's social and political tolerance. $NVDA and the entire AI buildout depend on navigating this.
The unglamorous constraint: not silicon, but public consent.
1. Data centers eventually migrate off-planet — including Mars — to escape earthbound resource constraints.
2. If AI companies want to keep scaling data centers across the U.S., they'll need stronger social license to operate. That means sharing more economic benefit with citizens: taxes, energy rebates, infrastructure investment, or direct community payments.
AI infrastructure can't consume unlimited land, power, and water without the public demanding a share of the upside. The bottleneck isn't just chip supply or power generation — it's social and political tolerance. $NVDA and the entire AI buildout depend on navigating this.
The unglamorous constraint: not silicon, but public consent.
180
·
--
See translation
VIX just hit its highest print since early April — we're talking first week of the month. That's the fear gauge waking up after months of sleep.
Usually means one of two things: either we're pricing in a real event risk that wasn't there before, or dealer gamma flipped and now every dip accelerates. Either way, it's a regime shift. When VIX was last here in April, we were still digesting the banking scare and Fed pivot hopes were alive. Now we're in a different macro setup — higher for longer, AI euphoria cooling, and breadth thinning out.
Watch how this plays with index gamma levels. If we're sitting on a big negative gamma pocket, vol stays elevated and moves get choppy. If it's just a one-off spike, it fades fast. But the fact that it's breaking out of the range matters — it's the first real volatility expansion signal in months.
VIX just hit its highest print since early April — we're talking first week of the month. That's the fear gauge waking up after months of sleep.
Usually means one of two things: either we're pricing in a real event risk that wasn't there before, or dealer gamma flipped and now every dip accelerates. Either way, it's a regime shift. When VIX was last here in April, we were still digesting the banking scare and Fed pivot hopes were alive. Now we're in a different macro setup — higher for longer, AI euphoria cooling, and breadth thinning out.
Watch how this plays with index gamma levels. If we're sitting on a big negative gamma pocket, vol stays elevated and moves get choppy. If it's just a one-off spike, it fades fast. But the fact that it's breaking out of the range matters — it's the first real volatility expansion signal in months.
Usually means one of two things: either we're pricing in a real event risk that wasn't there before, or dealer gamma flipped and now every dip accelerates. Either way, it's a regime shift. When VIX was last here in April, we were still digesting the banking scare and Fed pivot hopes were alive. Now we're in a different macro setup — higher for longer, AI euphoria cooling, and breadth thinning out.
Watch how this plays with index gamma levels. If we're sitting on a big negative gamma pocket, vol stays elevated and moves get choppy. If it's just a one-off spike, it fades fast. But the fact that it's breaking out of the range matters — it's the first real volatility expansion signal in months.
151
·
--
See translation
Market's flipped back into negative gamma territory. When dealers are short gamma, they amplify moves — selling into drops, buying into rips. Volatility tends to expand here. Watch for choppier, wider swings until we reclaim positive gamma zones or implied vol settles. If you're positioning, this isn't the environment for tight stops.
Market's flipped back into negative gamma territory. When dealers are short gamma, they amplify moves — selling into drops, buying into rips. Volatility tends to expand here. Watch for choppier, wider swings until we reclaim positive gamma zones or implied vol settles. If you're positioning, this isn't the environment for tight stops.
155
Log in to explore more content
Join global crypto users on Binance Square
⚡️ Get latest and useful information about crypto.
💬 Trusted by the world’s largest crypto exchange.
👍 Discover real insights from verified creators.
Email / Phone number
Trending Topics
BinanceReopensWithdrawalsForHYPE&APT
83,534 views
971 Discussing
Binance Re-Enables Withdrawals for HYPE and APT, Extends List of Restored Assets
Binance News
·32 Likes
·26.1k views
SouthKoreaDraftLawTargets15To20%ShareholderCap
83,384 views
637 Discussing
TradFiForBeginners
180,499 views
1,839 Discussing