
Gas哥
166 Posts

Gas哥
 Square Verified
Report
Block User
Frequent Trader
7.9 Years
48 Following
20 Followers
12 Liked
Posts
·
--
About 20 days remain until the Micron earnings call on September 30—and the “ledger” with Q4 guidance of roughly $50 billion is still there. Meanwhile, in this 1-hour window, Binance TradFi is already out of sync across the three contracts for storage and computing power. Don’t just weld “same track” directly into “same direction.”
What the company can verify: GlobeNewswire (2026-08-26) schedule—Micron’s FY2026 Q4 earnings call is set for 14:30 U.S. Mountain Time on September 30. SEC / official Q3 release: Q3 revenue is about $41.46B; Q4 guidance revenue is about $50B (±$1B), non-GAAP gross margin about 86%, and EPS about $31 (±$1). The guidance is solid—great for the mid-term narrative—but it doesn’t explain why these three diverge in this 1-hour move.
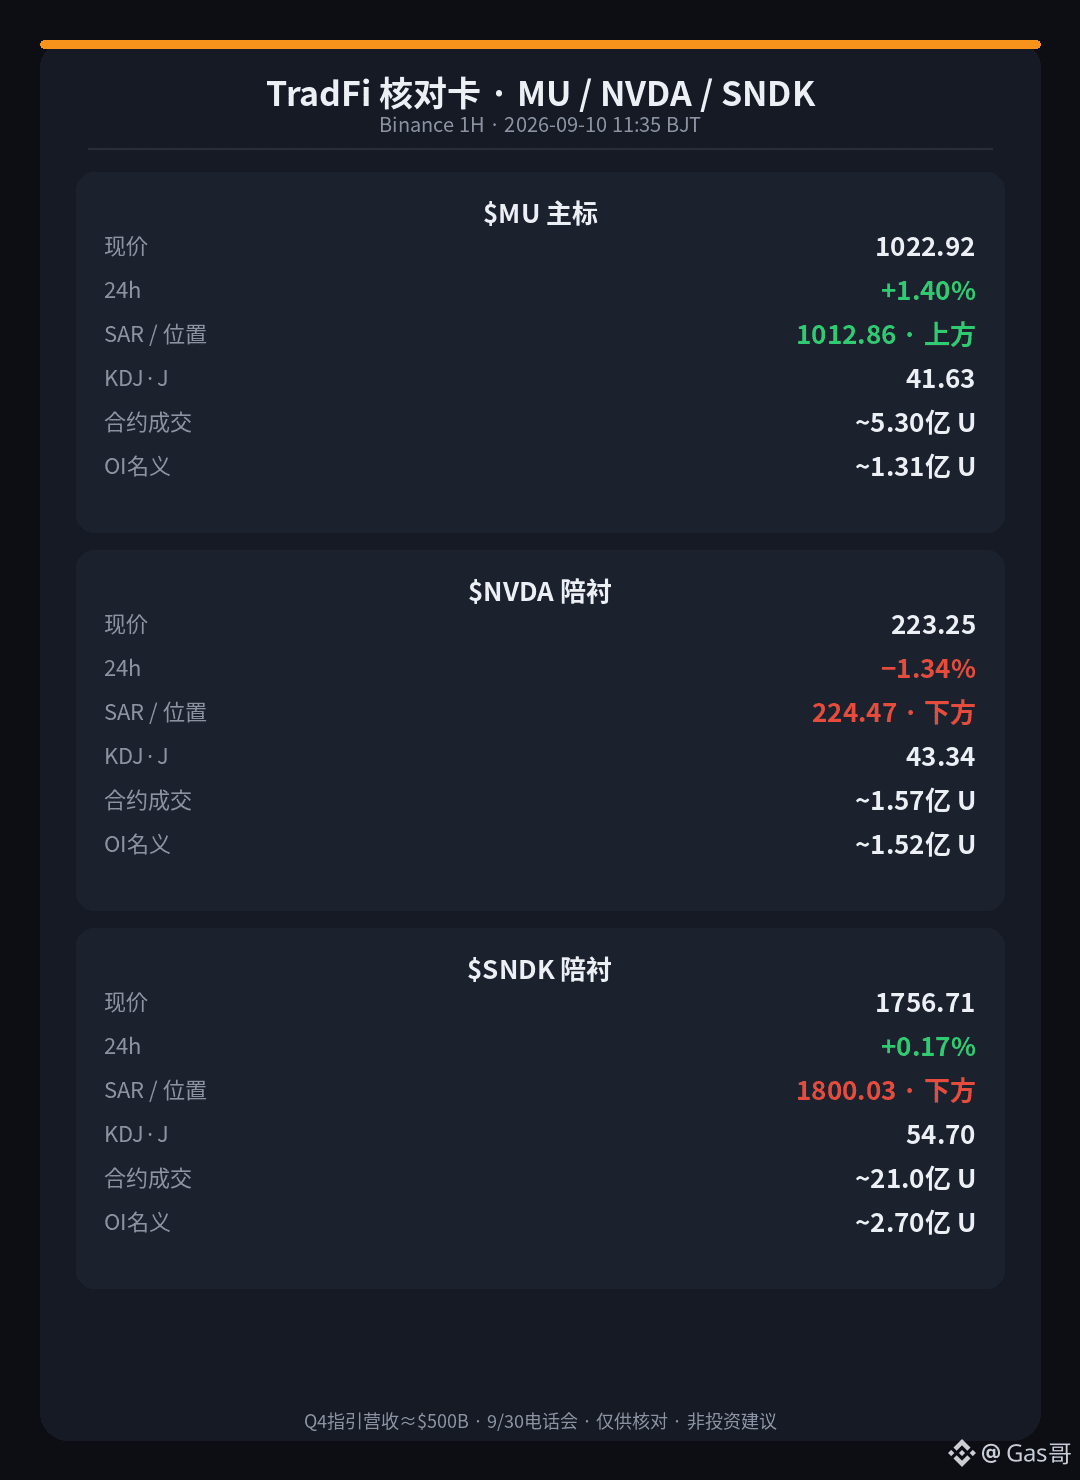
Take a closer look at the main headline. $MU Binance TradFi perpetual 1-hour is around 1022.92, up about +1.40% over 24 hours, with contract volume about $530M USDT. The follow line (SAR) is about 1012.86; price is about 10.1 above it. Plain talk: the short-term parabola is still holding—this isn’t a confirmed break. Momentum J is about 41.63 (K43.93 / D45.08): neither cold nor hot, like it’s grinding above the line. 24-hour high about 1043.27, low about 990.95; open interest about 128.5k contracts, notional about $131M; funding rate about 0. Compare to the move on the 9th on the same marker: that round was “break SAR + J≈24.” Tonight’s structure has already flipped into a stand-line small green—but don’t rush to read this single 1-hour candle as a cycle reversal.
Two supporting contracts, compared first. $NVDA is about 223.25, down about −1.34% over 24 hours; SAR about 224.47 (about 1.22 below); J about 43.34—same AI theme, yet it already dipped through the follow line. Contract volume about $157M; OI notional about $152M. $SNDK is about 1756.71, up about +0.17% and barely moving sideways; SAR about 1800.03 (about 43.3 below); J about 54.70—no big drop on the daily, but the 1-hour structure is already weaker. Volume about $2.10B (the loudest among the three); OI notional about $270M. MU base trend, and NVDA/SNDK breaking lines: same classmates, different structure.
Right now, it feels more like we’re waiting for the 9/30 results, not gambling on the direction of this 1-hour move.
About 20 days remain until the Micron earnings call on September 30—and the “ledger” with Q4 guidance of roughly $50 billion is still there. Meanwhile, in this 1-hour window, Binance TradFi is already out of sync across the three contracts for storage and computing power. Don’t just weld “same track” directly into “same direction.”
What the company can verify: GlobeNewswire (2026-08-26) schedule—Micron’s FY2026 Q4 earnings call is set for 14:30 U.S. Mountain Time on September 30. SEC / official Q3 release: Q3 revenue is about $41.46B; Q4 guidance revenue is about $50B (±$1B), non-GAAP gross margin about 86%, and EPS about $31 (±$1). The guidance is solid—great for the mid-term narrative—but it doesn’t explain why these three diverge in this 1-hour move.
Take a closer look at the main headline. $MU Binance TradFi perpetual 1-hour is around 1022.92, up about +1.40% over 24 hours, with contract volume about $530M USDT. The follow line (SAR) is about 1012.86; price is about 10.1 above it. Plain talk: the short-term parabola is still holding—this isn’t a confirmed break. Momentum J is about 41.63 (K43.93 / D45.08): neither cold nor hot, like it’s grinding above the line. 24-hour high about 1043.27, low about 990.95; open interest about 128.5k contracts, notional about $131M; funding rate about 0. Compare to the move on the 9th on the same marker: that round was “break SAR + J≈24.” Tonight’s structure has already flipped into a stand-line small green—but don’t rush to read this single 1-hour candle as a cycle reversal.
Two supporting contracts, compared first. $NVDA is about 223.25, down about −1.34% over 24 hours; SAR about 224.47 (about 1.22 below); J about 43.34—same AI theme, yet it already dipped through the follow line. Contract volume about $157M; OI notional about $152M. $SNDK is about 1756.71, up about +0.17% and barely moving sideways; SAR about 1800.03 (about 43.3 below); J about 54.70—no big drop on the daily, but the 1-hour structure is already weaker. Volume about $2.10B (the loudest among the three); OI notional about $270M. MU base trend, and NVDA/SNDK breaking lines: same classmates, different structure.
Right now, it feels more like we’re waiting for the 9/30 results, not gambling on the direction of this 1-hour move.
What the company can verify: GlobeNewswire (2026-08-26) schedule—Micron’s FY2026 Q4 earnings call is set for 14:30 U.S. Mountain Time on September 30. SEC / official Q3 release: Q3 revenue is about $41.46B; Q4 guidance revenue is about $50B (±$1B), non-GAAP gross margin about 86%, and EPS about $31 (±$1). The guidance is solid—great for the mid-term narrative—but it doesn’t explain why these three diverge in this 1-hour move.
Take a closer look at the main headline. $MU Binance TradFi perpetual 1-hour is around 1022.92, up about +1.40% over 24 hours, with contract volume about $530M USDT. The follow line (SAR) is about 1012.86; price is about 10.1 above it. Plain talk: the short-term parabola is still holding—this isn’t a confirmed break. Momentum J is about 41.63 (K43.93 / D45.08): neither cold nor hot, like it’s grinding above the line. 24-hour high about 1043.27, low about 990.95; open interest about 128.5k contracts, notional about $131M; funding rate about 0. Compare to the move on the 9th on the same marker: that round was “break SAR + J≈24.” Tonight’s structure has already flipped into a stand-line small green—but don’t rush to read this single 1-hour candle as a cycle reversal.
Two supporting contracts, compared first. $NVDA is about 223.25, down about −1.34% over 24 hours; SAR about 224.47 (about 1.22 below); J about 43.34—same AI theme, yet it already dipped through the follow line. Contract volume about $157M; OI notional about $152M. $SNDK is about 1756.71, up about +0.17% and barely moving sideways; SAR about 1800.03 (about 43.3 below); J about 54.70—no big drop on the daily, but the 1-hour structure is already weaker. Volume about $2.10B (the loudest among the three); OI notional about $270M. MU base trend, and NVDA/SNDK breaking lines: same classmates, different structure.
Right now, it feels more like we’re waiting for the 9/30 results, not gambling on the direction of this 1-hour move.
59
·
--
The platform’s open interest has come back to about $14.3 billion again—yet on Binance, this 1-hour move for $HYPE has already had the follow-through line undercut, and the current price has already pulled back a bit from near the highs. The rebound in positioning is what the platform’s ledger shows; a break in the line is what the price structure shows. Don’t weld these two ideas together.
News/funding data you can verify: Bitzo (2026-09-09, citing The Block) said Hyperliquid’s total open interest is about $14.3B (Sunday’s reading), only about 3% away from roughly $14.7B before the 2025-10-10 crash. Back then, it was hammered from about $14.7B in a single day down to about $6.5B. The same article notes that at the time of writing, HYPE spot is around $88, near a record high, with the month up over about 50%. Also, Bitcoin.com (2026-09-07) previously wrote that spot at one point was around $89.67; Bitwise’s BHYP open interest totals about $166.3M. The three US spot HYPE ETFs (THYP/BHYP/HYPG) as of 9/4 had total net inflows of about $356.6M and net assets of about $480.9M (Sosovalue). The platform’s positioning recovery + the ETF books being fat explains the supply of narrative; it doesn’t explain why, within this 1-hour chart, the price fell below the line.
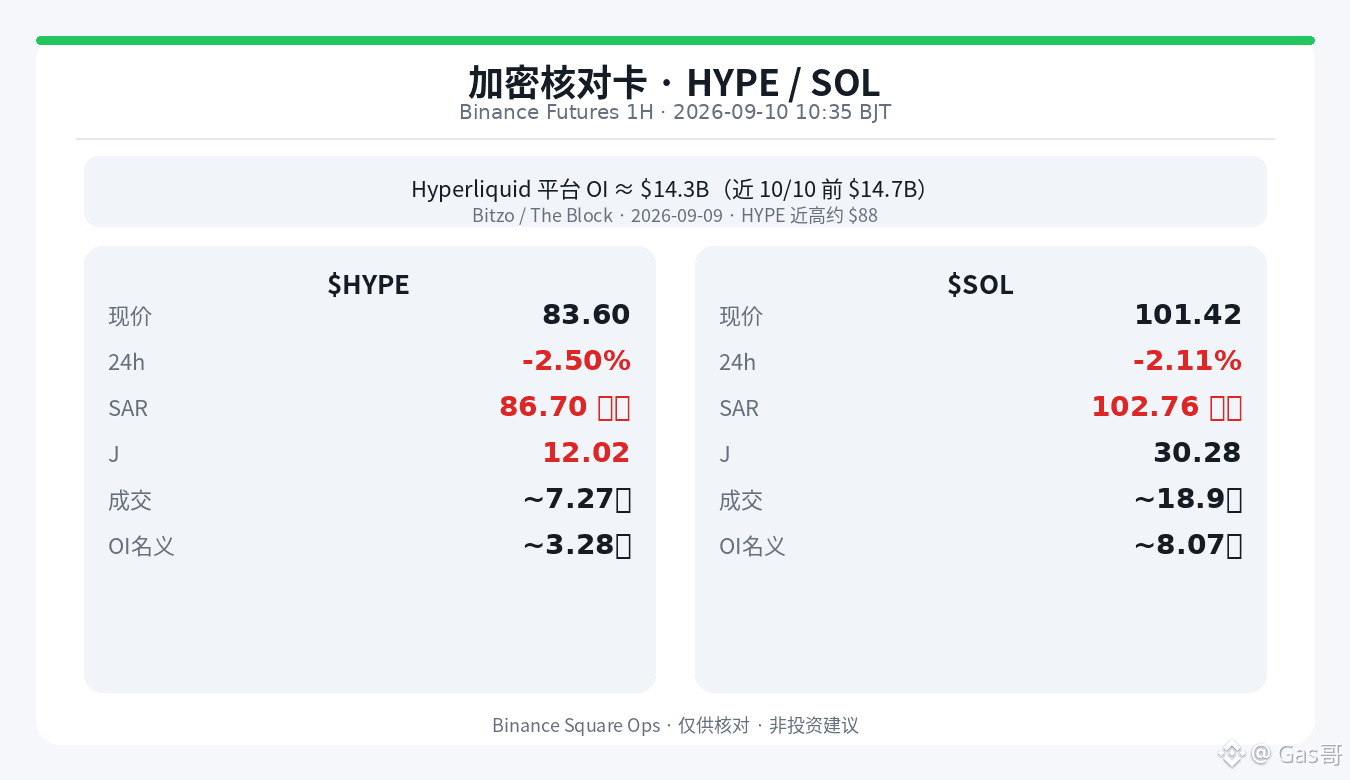
Look at the main chart in detail. Binance Perps $HYPE on 1H is about 83.60, down about −2.50% over 24H, with contract turnover of about $727M USDT—volume isn’t cold. SAR is about 86.70; price is roughly 3.10 below it—plainly: that “follow-through / stop-parabola” short-term line has been undercut; it’s not just grinding right on the line. Momentum J is about 12.02 (K 21.25 / D 25.87), rather cool. Compared with the same-name contract’s prior move 9 days ago where J topped out around 94, the four-day temperature gap is obvious. The 24H high is about 87.06 and the low about 82.42. Open interest is about 3.92 million contracts, notional about $328M. Funding rate is about −0.0007% (slightly skewed toward shorts paying). The ATH narrative is still on the table, but on 1H the market has already priced in the pullback first.
And as a side note for $SOL: about 101.42, down about −2.11% over 24H, SAR about 102.76 (about 1.34 below), J about 30.28—again the line is broken, but the momentum hasn’t cooled to the same level as HYPE. Contract turnover is about $1.89B, OI notional about $807M, and funding rate about −0.010%. The broader market beta is also online—don’t directly translate “platform OI has recovered” into “on-chain beta is already fixed.”
Up or down is allowed; the key is not to read the platform’s OI recovery as if the price structure is already repaired.
The platform’s open interest has come back to about $14.3 billion again—yet on Binance, this 1-hour move for $HYPE has already had the follow-through line undercut, and the current price has already pulled back a bit from near the highs. The rebound in positioning is what the platform’s ledger shows; a break in the line is what the price structure shows. Don’t weld these two ideas together.
News/funding data you can verify: Bitzo (2026-09-09, citing The Block) said Hyperliquid’s total open interest is about $14.3B (Sunday’s reading), only about 3% away from roughly $14.7B before the 2025-10-10 crash. Back then, it was hammered from about $14.7B in a single day down to about $6.5B. The same article notes that at the time of writing, HYPE spot is around $88, near a record high, with the month up over about 50%. Also, Bitcoin.com (2026-09-07) previously wrote that spot at one point was around $89.67; Bitwise’s BHYP open interest totals about $166.3M. The three US spot HYPE ETFs (THYP/BHYP/HYPG) as of 9/4 had total net inflows of about $356.6M and net assets of about $480.9M (Sosovalue). The platform’s positioning recovery + the ETF books being fat explains the supply of narrative; it doesn’t explain why, within this 1-hour chart, the price fell below the line.
Look at the main chart in detail. Binance Perps $HYPE on 1H is about 83.60, down about −2.50% over 24H, with contract turnover of about $727M USDT—volume isn’t cold. SAR is about 86.70; price is roughly 3.10 below it—plainly: that “follow-through / stop-parabola” short-term line has been undercut; it’s not just grinding right on the line. Momentum J is about 12.02 (K 21.25 / D 25.87), rather cool. Compared with the same-name contract’s prior move 9 days ago where J topped out around 94, the four-day temperature gap is obvious. The 24H high is about 87.06 and the low about 82.42. Open interest is about 3.92 million contracts, notional about $328M. Funding rate is about −0.0007% (slightly skewed toward shorts paying). The ATH narrative is still on the table, but on 1H the market has already priced in the pullback first.
And as a side note for $SOL : about 101.42, down about −2.11% over 24H, SAR about 102.76 (about 1.34 below), J about 30.28—again the line is broken, but the momentum hasn’t cooled to the same level as HYPE. Contract turnover is about $1.89B, OI notional about $807M, and funding rate about −0.010%. The broader market beta is also online—don’t directly translate “platform OI has recovered” into “on-chain beta is already fixed.”
Up or down is allowed; the key is not to read the platform’s OI recovery as if the price structure is already repaired.
News/funding data you can verify: Bitzo (2026-09-09, citing The Block) said Hyperliquid’s total open interest is about $14.3B (Sunday’s reading), only about 3% away from roughly $14.7B before the 2025-10-10 crash. Back then, it was hammered from about $14.7B in a single day down to about $6.5B. The same article notes that at the time of writing, HYPE spot is around $88, near a record high, with the month up over about 50%. Also, Bitcoin.com (2026-09-07) previously wrote that spot at one point was around $89.67; Bitwise’s BHYP open interest totals about $166.3M. The three US spot HYPE ETFs (THYP/BHYP/HYPG) as of 9/4 had total net inflows of about $356.6M and net assets of about $480.9M (Sosovalue). The platform’s positioning recovery + the ETF books being fat explains the supply of narrative; it doesn’t explain why, within this 1-hour chart, the price fell below the line.
Look at the main chart in detail. Binance Perps $HYPE on 1H is about 83.60, down about −2.50% over 24H, with contract turnover of about $727M USDT—volume isn’t cold. SAR is about 86.70; price is roughly 3.10 below it—plainly: that “follow-through / stop-parabola” short-term line has been undercut; it’s not just grinding right on the line. Momentum J is about 12.02 (K 21.25 / D 25.87), rather cool. Compared with the same-name contract’s prior move 9 days ago where J topped out around 94, the four-day temperature gap is obvious. The 24H high is about 87.06 and the low about 82.42. Open interest is about 3.92 million contracts, notional about $328M. Funding rate is about −0.0007% (slightly skewed toward shorts paying). The ATH narrative is still on the table, but on 1H the market has already priced in the pullback first.
And as a side note for $SOL : about 101.42, down about −2.11% over 24H, SAR about 102.76 (about 1.34 below), J about 30.28—again the line is broken, but the momentum hasn’t cooled to the same level as HYPE. Contract turnover is about $1.89B, OI notional about $807M, and funding rate about −0.010%. The broader market beta is also online—don’t directly translate “platform OI has recovered” into “on-chain beta is already fixed.”
Up or down is allowed; the key is not to read the platform’s OI recovery as if the price structure is already repaired.
132
·
--
The daily chart is still green, up about +2.4%. The privacy-coin ETF ledger just cleared $500 million—on Binance’s contracts, for this 1-hour candle, $ZEC even breaks through the following line first and steps below the “follow-up/stop-loss parabola.” Momentum (J) is already cooled to about 3.7. The lively part is the ledger; the break is on the chart. Don’t glue the two together.
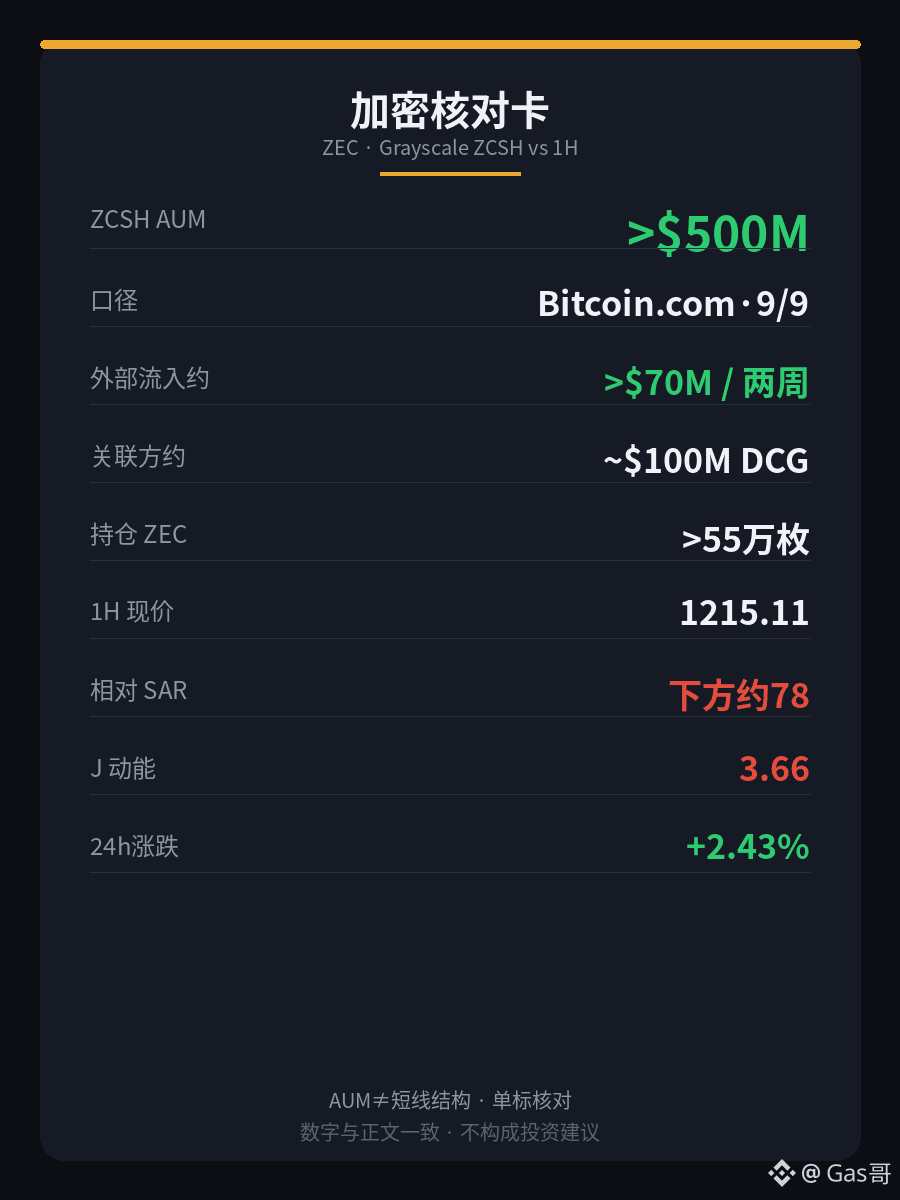
News/Funds that can be verified: Bitcoin.com (2026-09-09, Shiraz Jagati) reports that Grayscale’s spot Zcash ETF (ZCSH, NYSE Arca, listed on 8/25) saw assets under management cross about $500 million as of 9/8, with holdings exceeding about 550,000 ZEC. Breaking it down makes it clearer: the external cumulative inflow is slightly over about $70 million; another roughly $100 million came from a DCG-related party via in-kind subscriptions of about 85,700 ZEC. The scale is established—reading it directly as “a retail tide pouring in” doesn’t hold up. The same article also notes that this week the spot price briefly stood above about $1,200, near the intraday high of around $1,249 (its highest level since around late 2016).
Zoom in on the main signal. $ZEC is trading around 1215, up about +2.43% over the past 24 hours. Contract volume is around 3.12 billion USDT—solid volume. SAR is about 1293, with price sitting roughly 78 below it—plainly speaking: the short-term “follow-up/stop-loss parabola” line has already been pierced; it isn’t just grinding along the line. Momentum J is about 3.66 (K18.65 / D26.15), extremely cold. The daily chart is still green, the 1H has broken below SAR, and J is sitting on the floor—three things stacking together: the gain is a fact, and structural repair isn’t an automatic freebie. 24h high about 1297.5, low about 1172.6; open interest nominal about 672 million; funding rate about +0.005%. The explanation for the ETF crossing $500 million is a supply-demand story—it can’t explain why this 1-hour candle is sitting below the line.
First, figure out whether this is a rebound or a repair—then decide whether to get excited or not.
The daily chart is still green, up about +2.4%. The privacy-coin ETF ledger just cleared $500 million—on Binance’s contracts, for this 1-hour candle, $ZEC even breaks through the following line first and steps below the “follow-up/stop-loss parabola.” Momentum (J) is already cooled to about 3.7. The lively part is the ledger; the break is on the chart. Don’t glue the two together.
News/Funds that can be verified: Bitcoin.com (2026-09-09, Shiraz Jagati) reports that Grayscale’s spot Zcash ETF (ZCSH, NYSE Arca, listed on 8/25) saw assets under management cross about $500 million as of 9/8, with holdings exceeding about 550,000 ZEC. Breaking it down makes it clearer: the external cumulative inflow is slightly over about $70 million; another roughly $100 million came from a DCG-related party via in-kind subscriptions of about 85,700 ZEC. The scale is established—reading it directly as “a retail tide pouring in” doesn’t hold up. The same article also notes that this week the spot price briefly stood above about $1,200, near the intraday high of around $1,249 (its highest level since around late 2016).
Zoom in on the main signal. $ZEC is trading around 1215, up about +2.43% over the past 24 hours. Contract volume is around 3.12 billion USDT—solid volume. SAR is about 1293, with price sitting roughly 78 below it—plainly speaking: the short-term “follow-up/stop-loss parabola” line has already been pierced; it isn’t just grinding along the line. Momentum J is about 3.66 (K18.65 / D26.15), extremely cold. The daily chart is still green, the 1H has broken below SAR, and J is sitting on the floor—three things stacking together: the gain is a fact, and structural repair isn’t an automatic freebie. 24h high about 1297.5, low about 1172.6; open interest nominal about 672 million; funding rate about +0.005%. The explanation for the ETF crossing $500 million is a supply-demand story—it can’t explain why this 1-hour candle is sitting below the line.
First, figure out whether this is a rebound or a repair—then decide whether to get excited or not.
News/Funds that can be verified: Bitcoin.com (2026-09-09, Shiraz Jagati) reports that Grayscale’s spot Zcash ETF (ZCSH, NYSE Arca, listed on 8/25) saw assets under management cross about $500 million as of 9/8, with holdings exceeding about 550,000 ZEC. Breaking it down makes it clearer: the external cumulative inflow is slightly over about $70 million; another roughly $100 million came from a DCG-related party via in-kind subscriptions of about 85,700 ZEC. The scale is established—reading it directly as “a retail tide pouring in” doesn’t hold up. The same article also notes that this week the spot price briefly stood above about $1,200, near the intraday high of around $1,249 (its highest level since around late 2016).
Zoom in on the main signal. $ZEC is trading around 1215, up about +2.43% over the past 24 hours. Contract volume is around 3.12 billion USDT—solid volume. SAR is about 1293, with price sitting roughly 78 below it—plainly speaking: the short-term “follow-up/stop-loss parabola” line has already been pierced; it isn’t just grinding along the line. Momentum J is about 3.66 (K18.65 / D26.15), extremely cold. The daily chart is still green, the 1H has broken below SAR, and J is sitting on the floor—three things stacking together: the gain is a fact, and structural repair isn’t an automatic freebie. 24h high about 1297.5, low about 1172.6; open interest nominal about 672 million; funding rate about +0.005%. The explanation for the ETF crossing $500 million is a supply-demand story—it can’t explain why this 1-hour candle is sitting below the line.
First, figure out whether this is a rebound or a repair—then decide whether to get excited or not.
205
·
--
The article headline is still stuck at “The frog is using a coiling squeeze to close its mouth”—for this Binance perpetual contract over the past 1 hour at night: $PEPE first stepped through the follow-through line; the day’s drop has already moved to about −6.9%. “Closing/coil” is one way of describing it; breaking the line + declining volume is another account.
News/flows you can verify: Blockchain.News (2026-09-09) wrote that PEPE “is still in a closing coil, but the Fed’s boot is lifting”; after the ETF speculation heat faded, participation clearly shrank. In the piece, the bearish scenario watches for the daily line to close below about $0.00000336; the target carries about $0.00000270–$0.00000280. The bullish scenario needs to wait until BTC holds around $80,500 before looking for the daily line to close back up around $0.00000380. There is also another hard fact: Canary Capital’s spot PEPE ETF Form S-1 was filed with the SEC in April 2026 (verifiable on EDGAR), and to date it’s still “filed, not approved”—stories have options; it doesn’t mean the short-term structure is fixed.
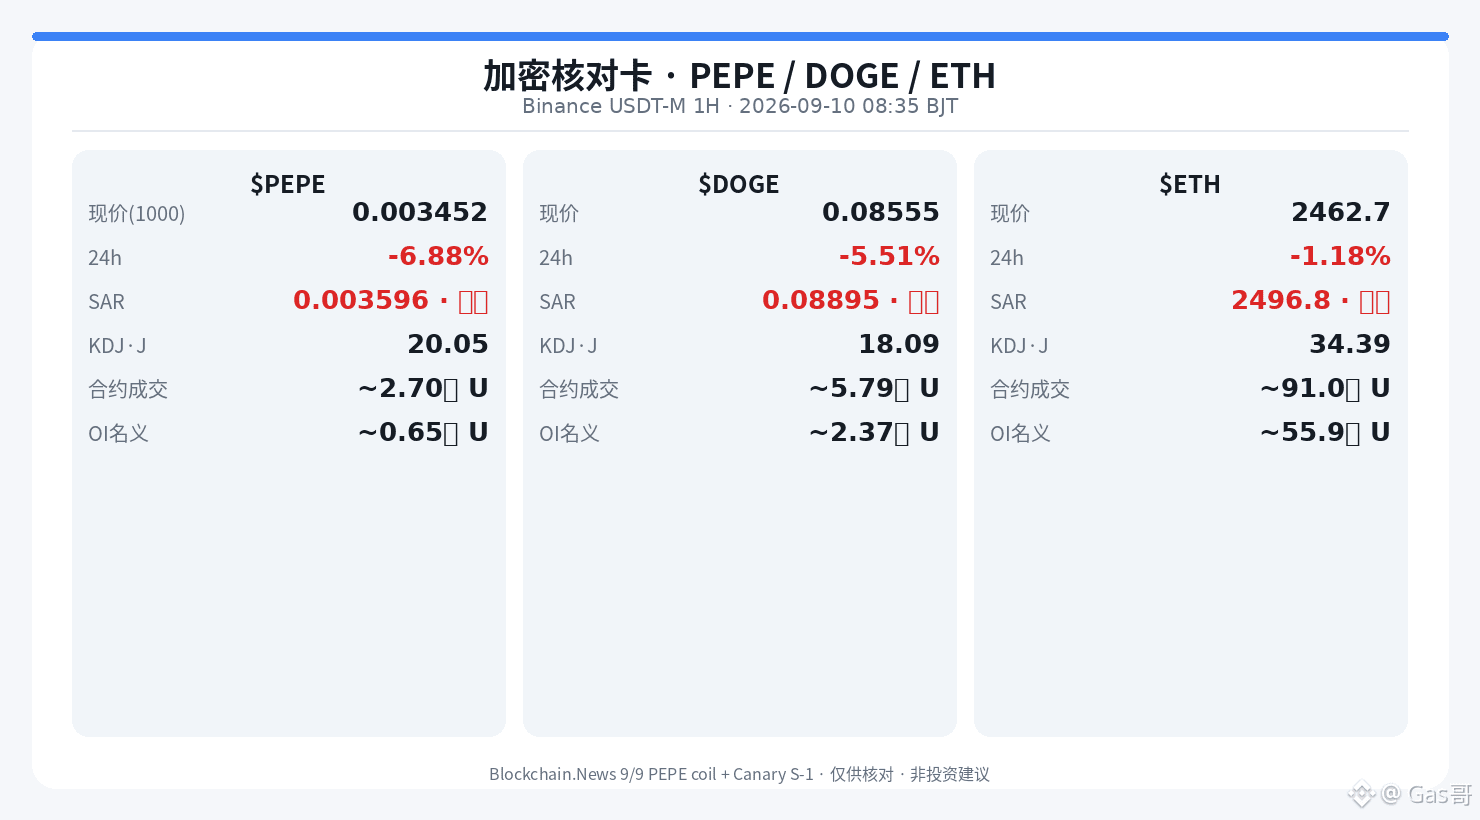
Look closely at the main chart. The contract looks at 1000PEPE: current price about 0.003452 (equivalent per coin about 0.00000345), down about −6.88% over 24 hours, with volume around 270 million USDT. SAR is about 0.003596, and the price is below by roughly 0.000145—plainly: the short-term “follow-through/stop-loss parabola” has been stepped through; it’s not just rubbing along the line. Momentum J is about 20.05 (K21.00 / D21.47). Compared with the early-morning 02:35 snapshot at about 0.003589 when it was just “background,” where J was around 22: the price is lower and the day’s drop is deeper, and J is still rather cold. The 24-hour high is 0.003741 and the low is 0.003396. Open interest notional is about 65 million; the funding rate is about −0.0145%. The current price is sitting slightly above the short-term trigger zone described in the article—don’t weld “still in a closing coil” and “already broken SAR” into one sentence.
For the side-by-side comparison, check the “same classmates, different temperatures.” $DOGE is around 0.08555, the daily line about −5.51%, volume about 579 million; SAR about 0.08895 has broken the line; J about 18.09—colder than PEPE by another notch. $ETH is around 2462.7, the daily line about −1.18%, volume about 9.1 billion; SAR about 2496.8 has broken the line; J about 34.39—relatively warmer, but still below the line. All three broke their SARs, but acceleration isn’t the same tier: the meme is dropping deeper on the day; ETH is more like grinding sideways—same direction doesn’t mean the same risk.
What the market display gives is a clue, not an order.
The article headline is still stuck at “The frog is using a coiling squeeze to close its mouth”—for this Binance perpetual contract over the past 1 hour at night: $PEPE first stepped through the follow-through line; the day’s drop has already moved to about −6.9%. “Closing/coil” is one way of describing it; breaking the line + declining volume is another account.
News/flows you can verify: Blockchain.News (2026-09-09) wrote that PEPE “is still in a closing coil, but the Fed’s boot is lifting”; after the ETF speculation heat faded, participation clearly shrank. In the piece, the bearish scenario watches for the daily line to close below about $0.00000336; the target carries about $0.00000270–$0.00000280. The bullish scenario needs to wait until BTC holds around $80,500 before looking for the daily line to close back up around $0.00000380. There is also another hard fact: Canary Capital’s spot PEPE ETF Form S-1 was filed with the SEC in April 2026 (verifiable on EDGAR), and to date it’s still “filed, not approved”—stories have options; it doesn’t mean the short-term structure is fixed.
Look closely at the main chart. The contract looks at 1000PEPE: current price about 0.003452 (equivalent per coin about 0.00000345), down about −6.88% over 24 hours, with volume around 270 million USDT. SAR is about 0.003596, and the price is below by roughly 0.000145—plainly: the short-term “follow-through/stop-loss parabola” has been stepped through; it’s not just rubbing along the line. Momentum J is about 20.05 (K21.00 / D21.47). Compared with the early-morning 02:35 snapshot at about 0.003589 when it was just “background,” where J was around 22: the price is lower and the day’s drop is deeper, and J is still rather cold. The 24-hour high is 0.003741 and the low is 0.003396. Open interest notional is about 65 million; the funding rate is about −0.0145%. The current price is sitting slightly above the short-term trigger zone described in the article—don’t weld “still in a closing coil” and “already broken SAR” into one sentence.
For the side-by-side comparison, check the “same classmates, different temperatures.” $DOGE is around 0.08555, the daily line about −5.51%, volume about 579 million; SAR about 0.08895 has broken the line; J about 18.09—colder than PEPE by another notch. $ETH is around 2462.7, the daily line about −1.18%, volume about 9.1 billion; SAR about 2496.8 has broken the line; J about 34.39—relatively warmer, but still below the line. All three broke their SARs, but acceleration isn’t the same tier: the meme is dropping deeper on the day; ETH is more like grinding sideways—same direction doesn’t mean the same risk.
What the market display gives is a clue, not an order.
News/flows you can verify: Blockchain.News (2026-09-09) wrote that PEPE “is still in a closing coil, but the Fed’s boot is lifting”; after the ETF speculation heat faded, participation clearly shrank. In the piece, the bearish scenario watches for the daily line to close below about $0.00000336; the target carries about $0.00000270–$0.00000280. The bullish scenario needs to wait until BTC holds around $80,500 before looking for the daily line to close back up around $0.00000380. There is also another hard fact: Canary Capital’s spot PEPE ETF Form S-1 was filed with the SEC in April 2026 (verifiable on EDGAR), and to date it’s still “filed, not approved”—stories have options; it doesn’t mean the short-term structure is fixed.
Look closely at the main chart. The contract looks at 1000PEPE: current price about 0.003452 (equivalent per coin about 0.00000345), down about −6.88% over 24 hours, with volume around 270 million USDT. SAR is about 0.003596, and the price is below by roughly 0.000145—plainly: the short-term “follow-through/stop-loss parabola” has been stepped through; it’s not just rubbing along the line. Momentum J is about 20.05 (K21.00 / D21.47). Compared with the early-morning 02:35 snapshot at about 0.003589 when it was just “background,” where J was around 22: the price is lower and the day’s drop is deeper, and J is still rather cold. The 24-hour high is 0.003741 and the low is 0.003396. Open interest notional is about 65 million; the funding rate is about −0.0145%. The current price is sitting slightly above the short-term trigger zone described in the article—don’t weld “still in a closing coil” and “already broken SAR” into one sentence.
For the side-by-side comparison, check the “same classmates, different temperatures.” $DOGE is around 0.08555, the daily line about −5.51%, volume about 579 million; SAR about 0.08895 has broken the line; J about 18.09—colder than PEPE by another notch. $ETH is around 2462.7, the daily line about −1.18%, volume about 9.1 billion; SAR about 2496.8 has broken the line; J about 34.39—relatively warmer, but still below the line. All three broke their SARs, but acceleration isn’t the same tier: the meme is dropping deeper on the day; ETH is more like grinding sideways—same direction doesn’t mean the same risk.
What the market display gives is a clue, not an order.
362
·
--
Everyone is still staring at that $0.86 wall; what’s even more glaring is that the price has slipped below the $0.78 that the article itself marked—and it even got the short-term line and the breakout-follow line smashed through.
Blockchain.News (2026-09-09, Darius Baruo) writes that $SUI is around $0.83, poised along the SMA200 / the upper Bollinger band of about $0.85–$0.86. Contract OI is about $117 million, up about +4.24% over 24 hours. Top traders are roughly 75% long, and the long/short ratio is about 3:1. Fees are neutral at around 0.01%. In the piece, the upside is written as “the daily close is above $0.86,” and the downside is written as “$0.78 is everything”—and only then do you talk about $0.73 after that level is lost. That’s the ledger of “building up under the wall + smart money leaning long”—but the 1-hour candle we’re looking at on Binance is a different book.
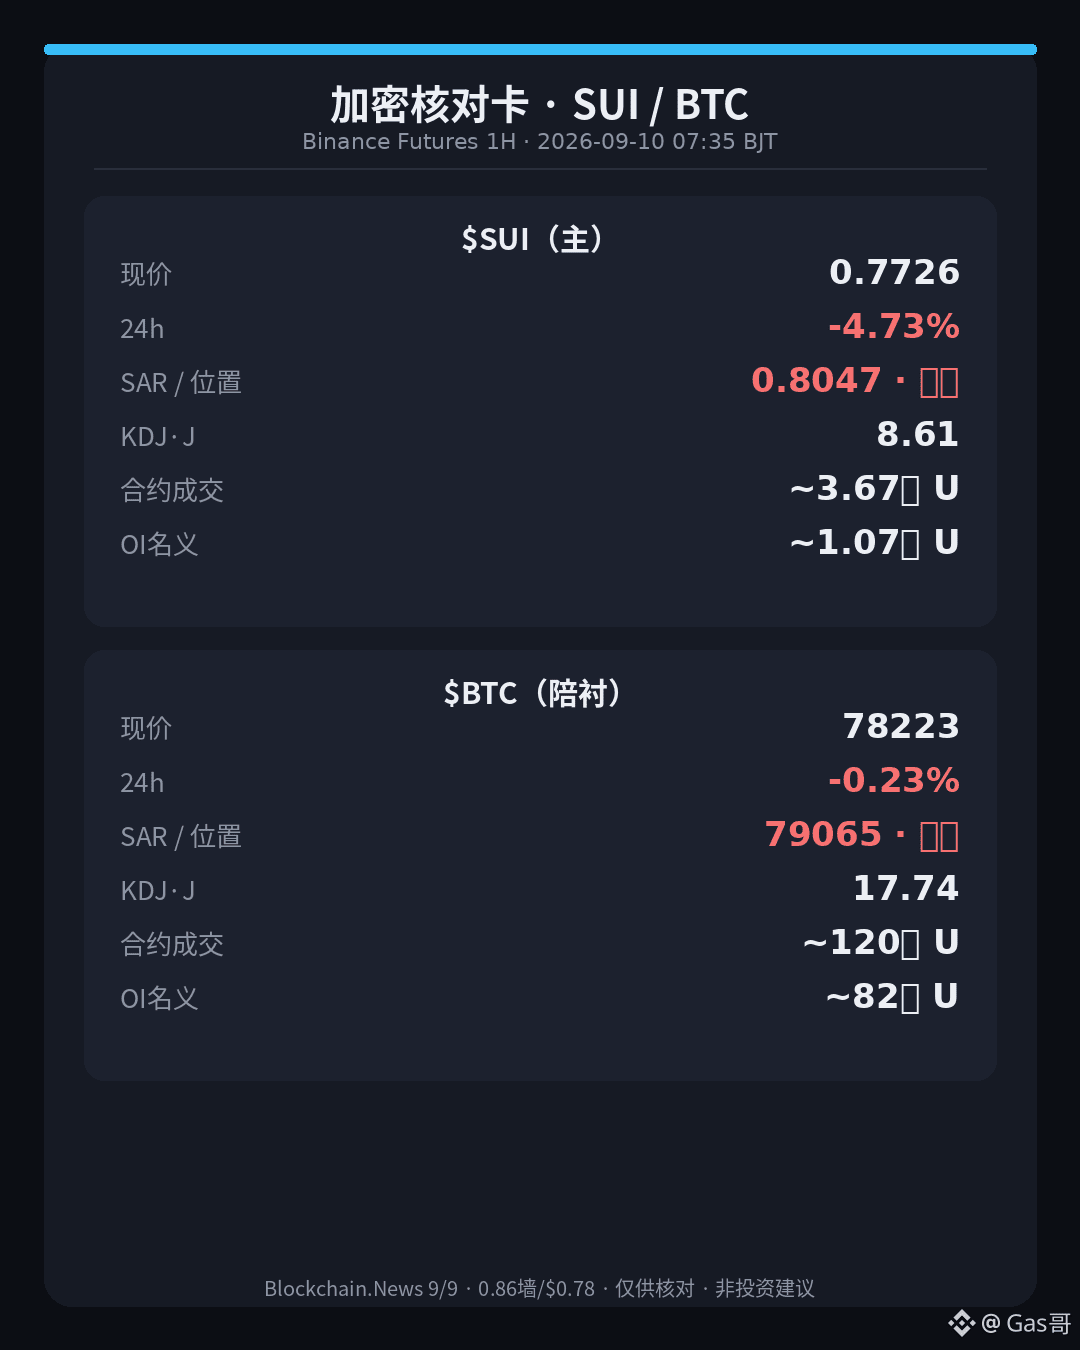
Look at the main chart closely. $SUI current price is about 0.7726, down about −4.73% over 24 hours, with contract volume around $367 million USDT. SAR is about 0.8047, and price is roughly 0.032 below it—plainly: the short-term “follow-through/breakout parabola” used for trailing and stop-loss has been penetrated; this isn’t just grinding along the line. Momentum J is about 8.61 (K16.51 / D20.46). Compared with around 06:35 when it was just a backdrop at about 0.7691 and J≈6.27: price is slightly higher and J is a bit warmer, but it’s still below the article’s target of $0.78 and still breaking SAR. A little warming ≠ repairing the structure. 24h high 0.8293, low 0.7617; open interest nominally about 107 million; funding rate about −0.0028%. The wall, the broken line, and the breakdown below $0.78 all stack together: the clues for the structure are there—the command for direction isn’t.
Now check the market’s beta via the benchmark. $BTC is about 78223, daily about −0.23%, and volume about $12 billion; SAR around 79065 and the line is broken; J is about 17.74, a notch warmer than SUI. When both break in the same direction, the acceleration isn’t on the same tier: BTC is basically grinding sideways, while SUI’s daily drop is deeper—the article has also said BTC-related factors are the exogenous main variable, but don’t weld the idea that “the market isn’t crashing” means “altcoins are still building under the wall.”
SAR has already spoken. The inference that “75% longs = price still building under the $0.86 wall” is a different matter—let’s not pretend otherwise.
Everyone is still staring at that $0.86 wall; what’s even more glaring is that the price has slipped below the $0.78 that the article itself marked—and it even got the short-term line and the breakout-follow line smashed through.
Blockchain.News (2026-09-09, Darius Baruo) writes that $SUI is around $0.83, poised along the SMA200 / the upper Bollinger band of about $0.85–$0.86. Contract OI is about $117 million, up about +4.24% over 24 hours. Top traders are roughly 75% long, and the long/short ratio is about 3:1. Fees are neutral at around 0.01%. In the piece, the upside is written as “the daily close is above $0.86,” and the downside is written as “$0.78 is everything”—and only then do you talk about $0.73 after that level is lost. That’s the ledger of “building up under the wall + smart money leaning long”—but the 1-hour candle we’re looking at on Binance is a different book.
Look at the main chart closely. $SUI current price is about 0.7726, down about −4.73% over 24 hours, with contract volume around $367 million USDT. SAR is about 0.8047, and price is roughly 0.032 below it—plainly: the short-term “follow-through/breakout parabola” used for trailing and stop-loss has been penetrated; this isn’t just grinding along the line. Momentum J is about 8.61 (K16.51 / D20.46). Compared with around 06:35 when it was just a backdrop at about 0.7691 and J≈6.27: price is slightly higher and J is a bit warmer, but it’s still below the article’s target of $0.78 and still breaking SAR. A little warming ≠ repairing the structure. 24h high 0.8293, low 0.7617; open interest nominally about 107 million; funding rate about −0.0028%. The wall, the broken line, and the breakdown below $0.78 all stack together: the clues for the structure are there—the command for direction isn’t.
Now check the market’s beta via the benchmark. $BTC is about 78223, daily about −0.23%, and volume about $12 billion; SAR around 79065 and the line is broken; J is about 17.74, a notch warmer than SUI. When both break in the same direction, the acceleration isn’t on the same tier: BTC is basically grinding sideways, while SUI’s daily drop is deeper—the article has also said BTC-related factors are the exogenous main variable, but don’t weld the idea that “the market isn’t crashing” means “altcoins are still building under the wall.”
SAR has already spoken. The inference that “75% longs = price still building under the $0.86 wall” is a different matter—let’s not pretend otherwise.
Blockchain.News (2026-09-09, Darius Baruo) writes that $SUI is around $0.83, poised along the SMA200 / the upper Bollinger band of about $0.85–$0.86. Contract OI is about $117 million, up about +4.24% over 24 hours. Top traders are roughly 75% long, and the long/short ratio is about 3:1. Fees are neutral at around 0.01%. In the piece, the upside is written as “the daily close is above $0.86,” and the downside is written as “$0.78 is everything”—and only then do you talk about $0.73 after that level is lost. That’s the ledger of “building up under the wall + smart money leaning long”—but the 1-hour candle we’re looking at on Binance is a different book.
Look at the main chart closely. $SUI current price is about 0.7726, down about −4.73% over 24 hours, with contract volume around $367 million USDT. SAR is about 0.8047, and price is roughly 0.032 below it—plainly: the short-term “follow-through/breakout parabola” used for trailing and stop-loss has been penetrated; this isn’t just grinding along the line. Momentum J is about 8.61 (K16.51 / D20.46). Compared with around 06:35 when it was just a backdrop at about 0.7691 and J≈6.27: price is slightly higher and J is a bit warmer, but it’s still below the article’s target of $0.78 and still breaking SAR. A little warming ≠ repairing the structure. 24h high 0.8293, low 0.7617; open interest nominally about 107 million; funding rate about −0.0028%. The wall, the broken line, and the breakdown below $0.78 all stack together: the clues for the structure are there—the command for direction isn’t.
Now check the market’s beta via the benchmark. $BTC is about 78223, daily about −0.23%, and volume about $12 billion; SAR around 79065 and the line is broken; J is about 17.74, a notch warmer than SUI. When both break in the same direction, the acceleration isn’t on the same tier: BTC is basically grinding sideways, while SUI’s daily drop is deeper—the article has also said BTC-related factors are the exogenous main variable, but don’t weld the idea that “the market isn’t crashing” means “altcoins are still building under the wall.”
SAR has already spoken. The inference that “75% longs = price still building under the $0.86 wall” is a different matter—let’s not pretend otherwise.
317
·
--
A “Yes” vote in the referendum can look very eye-catching, but in the short term the price action first has its follow-up lines crushed—don’t just weld “the governance narrative is still hot” directly into “the price won’t give back.”
Crypto Times (2026-09-09) covered OpenGov Referendum #1944 (native stablecoin dotUSD): the decision period hasn’t ended yet. The “Yes” share is about 97.6%, with the Aye side at roughly 2.39 million DOT (31 votes) versus Nay at about 59.9k DOT; support is around 60.1%, with a threshold of about 48.1%. On the same day, nearby headlines were also saying DOT could rise by ~10%, and the order book was brushing 1.18–1.24. That’s “governance heat + a daily pulse”; what we’re tracking on Binance over 1 hour is a different book.
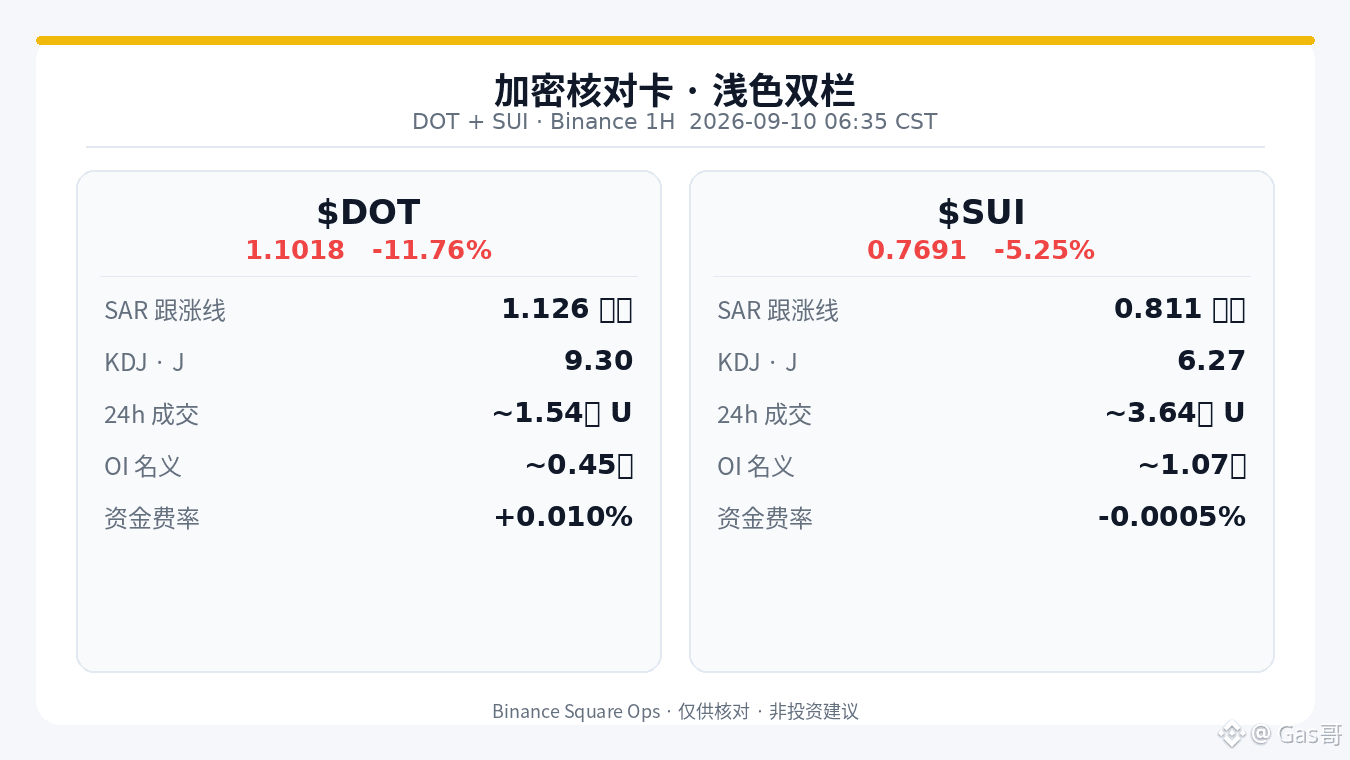
Look at the main chart closely. $DOT current price is about 1.1018, down about −11.76% over 24 hours, with contract volume around 154 million USDT. SAR is about 1.126, with price roughly 0.024 below it—plain words: the short-term “follow-through / stop-loss parabola” has been cracked, not just grinding along the line. Momentum J is about 9.30 (K12.45 / D14.03). Compared with when it was at the backdrop around 05:35, J was approximately 2.97—momentum has slightly warmed up, but the current price is lower and the daily drop is deeper. Lifting J from near freezing doesn’t mean the price has been repaired. 24h high 1.2634, low 1.0915; open interest notional about 0.45 billion; funding rate about +0.01%. “Yes” in the referendum, breaking the line, and a red day stack together: the structural clues are there, but the directional instruction isn’t.
For the supporting classmate L1. $SUI around 0.7691, daily about −5.25%, volume about 364 million (more lively than DOT); SAR about 0.811 broke the line; J about 6.27, colder than DOT. Breaking the line in the same direction doesn’t mean the acceleration is on the same level: DOT’s daily drop is steeper, while SUI has thicker turnover but a shallower decline. “Lively trading” doesn’t equal “stronger structure.”
In one sentence: the factual layer that the referendum “Yes” vote holds is true; the inference that “governance heat = the short term won’t break SAR / won’t give back on the daily” is not true.
A “Yes” vote in the referendum can look very eye-catching, but in the short term the price action first has its follow-up lines crushed—don’t just weld “the governance narrative is still hot” directly into “the price won’t give back.”
Crypto Times (2026-09-09) covered OpenGov Referendum #1944 (native stablecoin dotUSD): the decision period hasn’t ended yet. The “Yes” share is about 97.6%, with the Aye side at roughly 2.39 million DOT (31 votes) versus Nay at about 59.9k DOT; support is around 60.1%, with a threshold of about 48.1%. On the same day, nearby headlines were also saying DOT could rise by ~10%, and the order book was brushing 1.18–1.24. That’s “governance heat + a daily pulse”; what we’re tracking on Binance over 1 hour is a different book.
Look at the main chart closely. $DOT current price is about 1.1018, down about −11.76% over 24 hours, with contract volume around 154 million USDT. SAR is about 1.126, with price roughly 0.024 below it—plain words: the short-term “follow-through / stop-loss parabola” has been cracked, not just grinding along the line. Momentum J is about 9.30 (K12.45 / D14.03). Compared with when it was at the backdrop around 05:35, J was approximately 2.97—momentum has slightly warmed up, but the current price is lower and the daily drop is deeper. Lifting J from near freezing doesn’t mean the price has been repaired. 24h high 1.2634, low 1.0915; open interest notional about 0.45 billion; funding rate about +0.01%. “Yes” in the referendum, breaking the line, and a red day stack together: the structural clues are there, but the directional instruction isn’t.
For the supporting classmate L1. $SUI around 0.7691, daily about −5.25%, volume about 364 million (more lively than DOT); SAR about 0.811 broke the line; J about 6.27, colder than DOT. Breaking the line in the same direction doesn’t mean the acceleration is on the same level: DOT’s daily drop is steeper, while SUI has thicker turnover but a shallower decline. “Lively trading” doesn’t equal “stronger structure.”
In one sentence: the factual layer that the referendum “Yes” vote holds is true; the inference that “governance heat = the short term won’t break SAR / won’t give back on the daily” is not true.
Crypto Times (2026-09-09) covered OpenGov Referendum #1944 (native stablecoin dotUSD): the decision period hasn’t ended yet. The “Yes” share is about 97.6%, with the Aye side at roughly 2.39 million DOT (31 votes) versus Nay at about 59.9k DOT; support is around 60.1%, with a threshold of about 48.1%. On the same day, nearby headlines were also saying DOT could rise by ~10%, and the order book was brushing 1.18–1.24. That’s “governance heat + a daily pulse”; what we’re tracking on Binance over 1 hour is a different book.
Look at the main chart closely. $DOT current price is about 1.1018, down about −11.76% over 24 hours, with contract volume around 154 million USDT. SAR is about 1.126, with price roughly 0.024 below it—plain words: the short-term “follow-through / stop-loss parabola” has been cracked, not just grinding along the line. Momentum J is about 9.30 (K12.45 / D14.03). Compared with when it was at the backdrop around 05:35, J was approximately 2.97—momentum has slightly warmed up, but the current price is lower and the daily drop is deeper. Lifting J from near freezing doesn’t mean the price has been repaired. 24h high 1.2634, low 1.0915; open interest notional about 0.45 billion; funding rate about +0.01%. “Yes” in the referendum, breaking the line, and a red day stack together: the structural clues are there, but the directional instruction isn’t.
For the supporting classmate L1. $SUI around 0.7691, daily about −5.25%, volume about 364 million (more lively than DOT); SAR about 0.811 broke the line; J about 6.27, colder than DOT. Breaking the line in the same direction doesn’t mean the acceleration is on the same level: DOT’s daily drop is steeper, while SUI has thicker turnover but a shallower decline. “Lively trading” doesn’t equal “stronger structure.”
In one sentence: the factual layer that the referendum “Yes” vote holds is true; the inference that “governance heat = the short term won’t break SAR / won’t give back on the daily” is not true.
381
·
--
At dawn, when it was acting as a tail, $LINK still had momentum J, hovering in its early twenties—now it’s the turn of the main marker. J has already fallen to about 6, and the price is still punching through the rising line (SAR). For the same underlying, the four-hour spread is big enough.
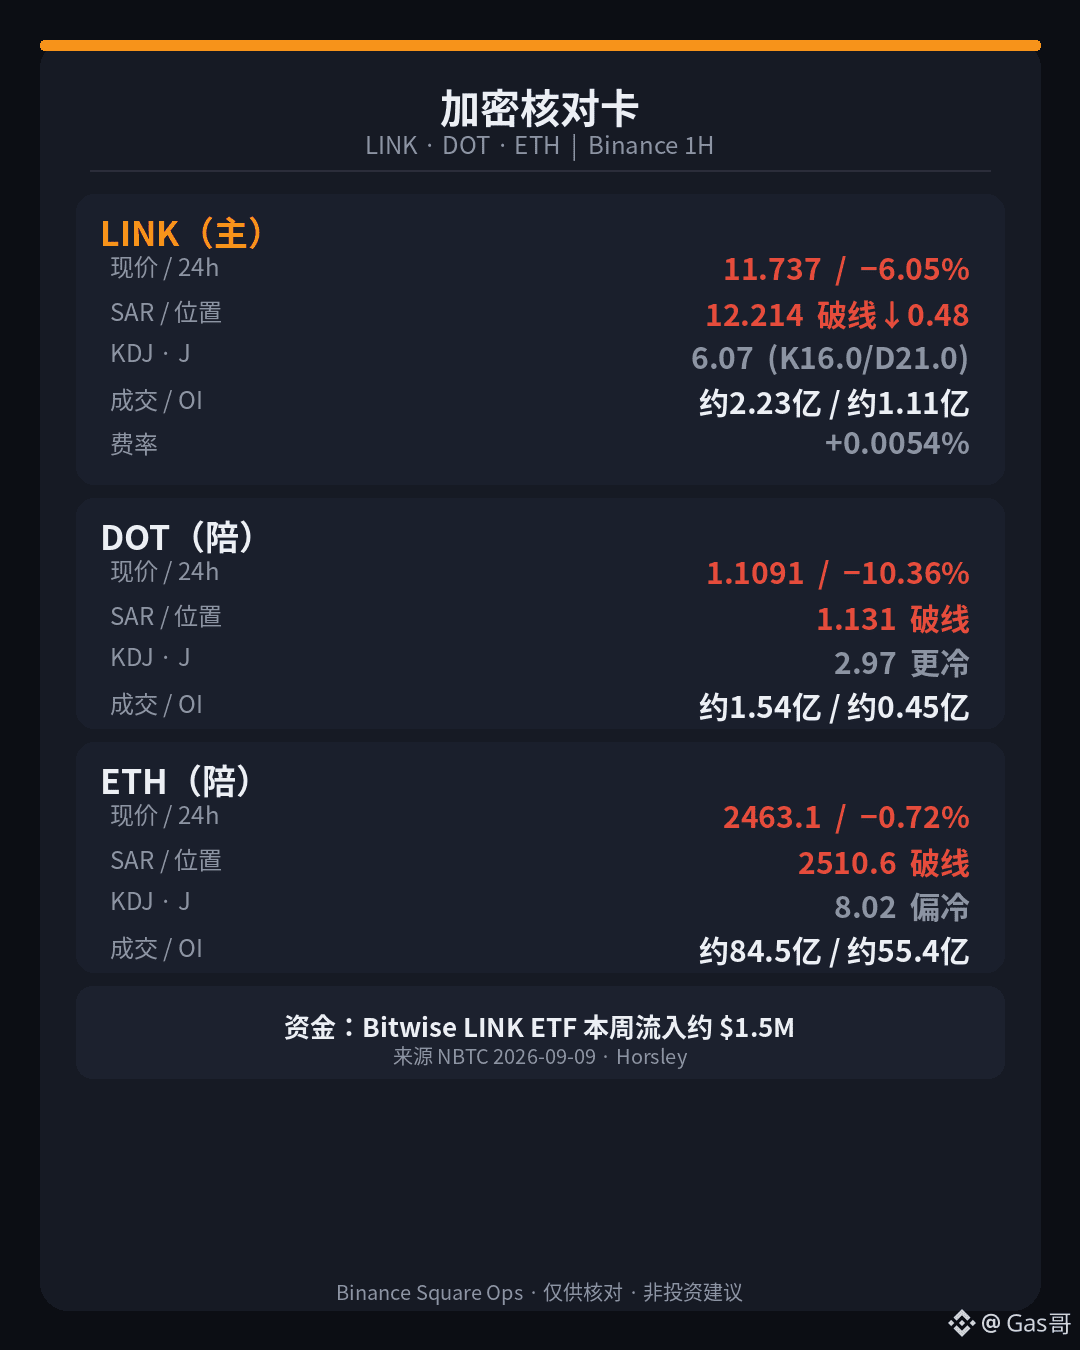
Take a closer look at the main marker. $LINK is trading around 11.737, down about −6.05% over 24 hours, with contract volume of roughly 223 million USDT. SAR is about 12.214, meaning the price is roughly 0.48 below it—plain language: that “follow-through/pullback parabola” for chasing and stop-loss has been breached; it’s not a tight grind right on the line, it’s clearly dropped below it. Momentum J is about 6.07 (K 16.03 / D 21.01). Compared with when it was acting as a tail at 01:35, where J≈23.62, it’s cooled off noticeably, nearing the oversold zone. Don’t read it as “it cooled, so it should be a buy.” The 24h high is 12.632 and the low is 11.70. Open interest is about $111 million (notional). Funding rate is around +0.0054%—slightly long-biased, but not exaggerated. Red daily candles, breaking levels, and J at a near-freezing point all stack together: the structural clues are there, but the directional instruction is not.
The tail is pulling with acceleration. $DOT ’s fellow is even harsher: current price about 1.1091, daily about −10.36%, volume about 154 million; SAR is around 1.131, also breached. J is about 2.97—colder than LINK. $ETH ’s fellow is only about −0.72% on the daily; current price around 2463.1, volume about 8.45 billion; SAR around 2510.6, about 47.5 below. J is about 8.02—still somewhat cold, but the drop is far smaller than LINK/DOT. Across the three companions, all have broken below SAR, but the “acceleration” isn’t the same tier: DOT is steepest, LINK next, and ETH is only lightly pressured.
You can verify the funding narrative: NBTC News (2026-09-09) relays Bitwise CEO Hunter Horsley—Bitwise’s Chainlink ETF (CLNK) showed net inflows on multiple days last week, totaling about $1.5 million for the week, even though the broader market was still weak. That’s the “weekly funding ledger”; the one-hour tick we’re looking at now is “the current market temperature.” The book is still soaking up cash, but that doesn’t mean the short-term SAR won’t break or that J won’t slide into single digits. Don’t glue two different timestamps into one conclusion: “institutions are still buying, so it can’t drop.”
Same direction doesn’t mean the same risk—keep that straight. Don’t mix that layer up.
At dawn, when it was acting as a tail, $LINK still had momentum J, hovering in its early twenties—now it’s the turn of the main marker. J has already fallen to about 6, and the price is still punching through the rising line (SAR). For the same underlying, the four-hour spread is big enough.
Take a closer look at the main marker. $LINK is trading around 11.737, down about −6.05% over 24 hours, with contract volume of roughly 223 million USDT. SAR is about 12.214, meaning the price is roughly 0.48 below it—plain language: that “follow-through/pullback parabola” for chasing and stop-loss has been breached; it’s not a tight grind right on the line, it’s clearly dropped below it. Momentum J is about 6.07 (K 16.03 / D 21.01). Compared with when it was acting as a tail at 01:35, where J≈23.62, it’s cooled off noticeably, nearing the oversold zone. Don’t read it as “it cooled, so it should be a buy.” The 24h high is 12.632 and the low is 11.70. Open interest is about $111 million (notional). Funding rate is around +0.0054%—slightly long-biased, but not exaggerated. Red daily candles, breaking levels, and J at a near-freezing point all stack together: the structural clues are there, but the directional instruction is not.
The tail is pulling with acceleration. $DOT ’s fellow is even harsher: current price about 1.1091, daily about −10.36%, volume about 154 million; SAR is around 1.131, also breached. J is about 2.97—colder than LINK. $ETH ’s fellow is only about −0.72% on the daily; current price around 2463.1, volume about 8.45 billion; SAR around 2510.6, about 47.5 below. J is about 8.02—still somewhat cold, but the drop is far smaller than LINK/DOT. Across the three companions, all have broken below SAR, but the “acceleration” isn’t the same tier: DOT is steepest, LINK next, and ETH is only lightly pressured.
You can verify the funding narrative: NBTC News (2026-09-09) relays Bitwise CEO Hunter Horsley—Bitwise’s Chainlink ETF (CLNK) showed net inflows on multiple days last week, totaling about $1.5 million for the week, even though the broader market was still weak. That’s the “weekly funding ledger”; the one-hour tick we’re looking at now is “the current market temperature.” The book is still soaking up cash, but that doesn’t mean the short-term SAR won’t break or that J won’t slide into single digits. Don’t glue two different timestamps into one conclusion: “institutions are still buying, so it can’t drop.”
Same direction doesn’t mean the same risk—keep that straight. Don’t mix that layer up.
Take a closer look at the main marker. $LINK is trading around 11.737, down about −6.05% over 24 hours, with contract volume of roughly 223 million USDT. SAR is about 12.214, meaning the price is roughly 0.48 below it—plain language: that “follow-through/pullback parabola” for chasing and stop-loss has been breached; it’s not a tight grind right on the line, it’s clearly dropped below it. Momentum J is about 6.07 (K 16.03 / D 21.01). Compared with when it was acting as a tail at 01:35, where J≈23.62, it’s cooled off noticeably, nearing the oversold zone. Don’t read it as “it cooled, so it should be a buy.” The 24h high is 12.632 and the low is 11.70. Open interest is about $111 million (notional). Funding rate is around +0.0054%—slightly long-biased, but not exaggerated. Red daily candles, breaking levels, and J at a near-freezing point all stack together: the structural clues are there, but the directional instruction is not.
The tail is pulling with acceleration. $DOT ’s fellow is even harsher: current price about 1.1091, daily about −10.36%, volume about 154 million; SAR is around 1.131, also breached. J is about 2.97—colder than LINK. $ETH ’s fellow is only about −0.72% on the daily; current price around 2463.1, volume about 8.45 billion; SAR around 2510.6, about 47.5 below. J is about 8.02—still somewhat cold, but the drop is far smaller than LINK/DOT. Across the three companions, all have broken below SAR, but the “acceleration” isn’t the same tier: DOT is steepest, LINK next, and ETH is only lightly pressured.
You can verify the funding narrative: NBTC News (2026-09-09) relays Bitwise CEO Hunter Horsley—Bitwise’s Chainlink ETF (CLNK) showed net inflows on multiple days last week, totaling about $1.5 million for the week, even though the broader market was still weak. That’s the “weekly funding ledger”; the one-hour tick we’re looking at now is “the current market temperature.” The book is still soaking up cash, but that doesn’t mean the short-term SAR won’t break or that J won’t slide into single digits. Don’t glue two different timestamps into one conclusion: “institutions are still buying, so it can’t drop.”
Same direction doesn’t mean the same risk—keep that straight. Don’t mix that layer up.
279
·
--
The article turns $7.85 into “an unspeakable support” — this 1-hour Binance contract had $AVAX already sitting on that line. The short-term rising parabola (SAR) even broke first. The narrative’s pullback was the kind of “band” that the chart used as the current price.
Blockchain.News (2026-09-09, Lawrence Jengar) pinned it around ~$8.04, roughly sticking to the 200-day moving average near ~$8.05: top traders were about 76% long, with the long/short ratio around 3.18; OI over 24h was about +3.09%; funding rates were neutral at ~0.0047%; bearish scenario: a retreat to $7.85, and if that breaks, watch $7.65. The actual overnight price was about 7.852 — it’s not a showdown still waiting at the $8 gate; it has already moved into the first support zone described in the article.
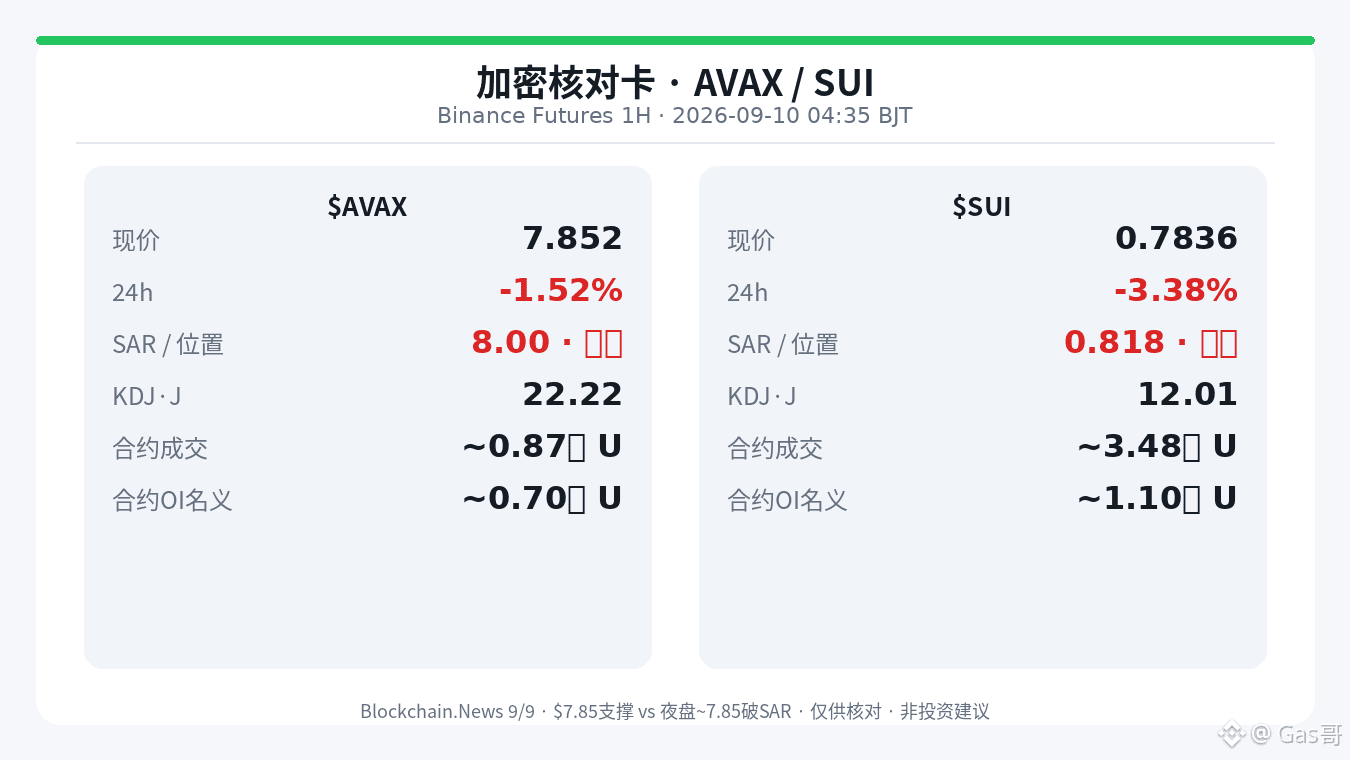
Main mark: $AVAX around 7.852, down ~1.52% over 24h, with contract volume about 0.87 billion U. SAR around 8.00, price roughly 0.15 below — plain talk: the rising/parabola line for follow-through/stop-loss has been breached. Momentum J is about 22.22 (K35.74 / D42.50), on the cooler side; don’t read it as “it must be bottoming, so it will bounce.” 24h high 8.052, low 7.803; nominal OI about 0.70 billion; funding rate about +0.0054%. Price is near $7.85, the line is broken, and J is cool — they stack together, giving structural clues, but no directional instruction.
Supporting classmate L1: $SUI is even cooler — about 0.7836, daily around −3.38%, volume about 0.348 billion; SAR around 0.818 with a break; J about 12.01. Same-direction break, but the drawdown and momentum aren’t on the same level; higher volume doesn’t automatically mean the structure is stronger.
Talk about the next step only after 7.65 breaks; it’s too early to discuss now.
The article turns $7.85 into “an unspeakable support” — this 1-hour Binance contract had $AVAX already sitting on that line. The short-term rising parabola (SAR) even broke first. The narrative’s pullback was the kind of “band” that the chart used as the current price.
Blockchain.News (2026-09-09, Lawrence Jengar) pinned it around ~$8.04, roughly sticking to the 200-day moving average near ~$8.05: top traders were about 76% long, with the long/short ratio around 3.18; OI over 24h was about +3.09%; funding rates were neutral at ~0.0047%; bearish scenario: a retreat to $7.85, and if that breaks, watch $7.65. The actual overnight price was about 7.852 — it’s not a showdown still waiting at the $8 gate; it has already moved into the first support zone described in the article.
Main mark: $AVAX around 7.852, down ~1.52% over 24h, with contract volume about 0.87 billion U. SAR around 8.00, price roughly 0.15 below — plain talk: the rising/parabola line for follow-through/stop-loss has been breached. Momentum J is about 22.22 (K35.74 / D42.50), on the cooler side; don’t read it as “it must be bottoming, so it will bounce.” 24h high 8.052, low 7.803; nominal OI about 0.70 billion; funding rate about +0.0054%. Price is near $7.85, the line is broken, and J is cool — they stack together, giving structural clues, but no directional instruction.
Supporting classmate L1: $SUI is even cooler — about 0.7836, daily around −3.38%, volume about 0.348 billion; SAR around 0.818 with a break; J about 12.01. Same-direction break, but the drawdown and momentum aren’t on the same level; higher volume doesn’t automatically mean the structure is stronger.
Talk about the next step only after 7.65 breaks; it’s too early to discuss now.
Blockchain.News (2026-09-09, Lawrence Jengar) pinned it around ~$8.04, roughly sticking to the 200-day moving average near ~$8.05: top traders were about 76% long, with the long/short ratio around 3.18; OI over 24h was about +3.09%; funding rates were neutral at ~0.0047%; bearish scenario: a retreat to $7.85, and if that breaks, watch $7.65. The actual overnight price was about 7.852 — it’s not a showdown still waiting at the $8 gate; it has already moved into the first support zone described in the article.
Main mark: $AVAX around 7.852, down ~1.52% over 24h, with contract volume about 0.87 billion U. SAR around 8.00, price roughly 0.15 below — plain talk: the rising/parabola line for follow-through/stop-loss has been breached. Momentum J is about 22.22 (K35.74 / D42.50), on the cooler side; don’t read it as “it must be bottoming, so it will bounce.” 24h high 8.052, low 7.803; nominal OI about 0.70 billion; funding rate about +0.0054%. Price is near $7.85, the line is broken, and J is cool — they stack together, giving structural clues, but no directional instruction.
Supporting classmate L1: $SUI is even cooler — about 0.7836, daily around −3.38%, volume about 0.348 billion; SAR around 0.818 with a break; J about 12.01. Same-direction break, but the drawdown and momentum aren’t on the same level; higher volume doesn’t automatically mean the structure is stronger.
Talk about the next step only after 7.65 breaks; it’s too early to discuss now.
325
·
--
0.214. The article is also nailed with “0.22 = SMA200 accumulation level,” and this Binance contract’s 1-hour chart has already fallen below the mid-range.
Blockchain.News (2026-09-09, Felix Pinkston) at the time wrote that $ADA was consolidating at about $0.22: the long/short ratio among top traders was about 2.41, longs about 70.7%; open interest about $83.7M; the funding rate was close to neutral; the main scenario was a breakout above 0.23, and only a drop below 0.21 would count as invalidation. The actual price in the night session was about 0.2142—this isn’t the grid in a screenshot; it’s below the accumulation band.
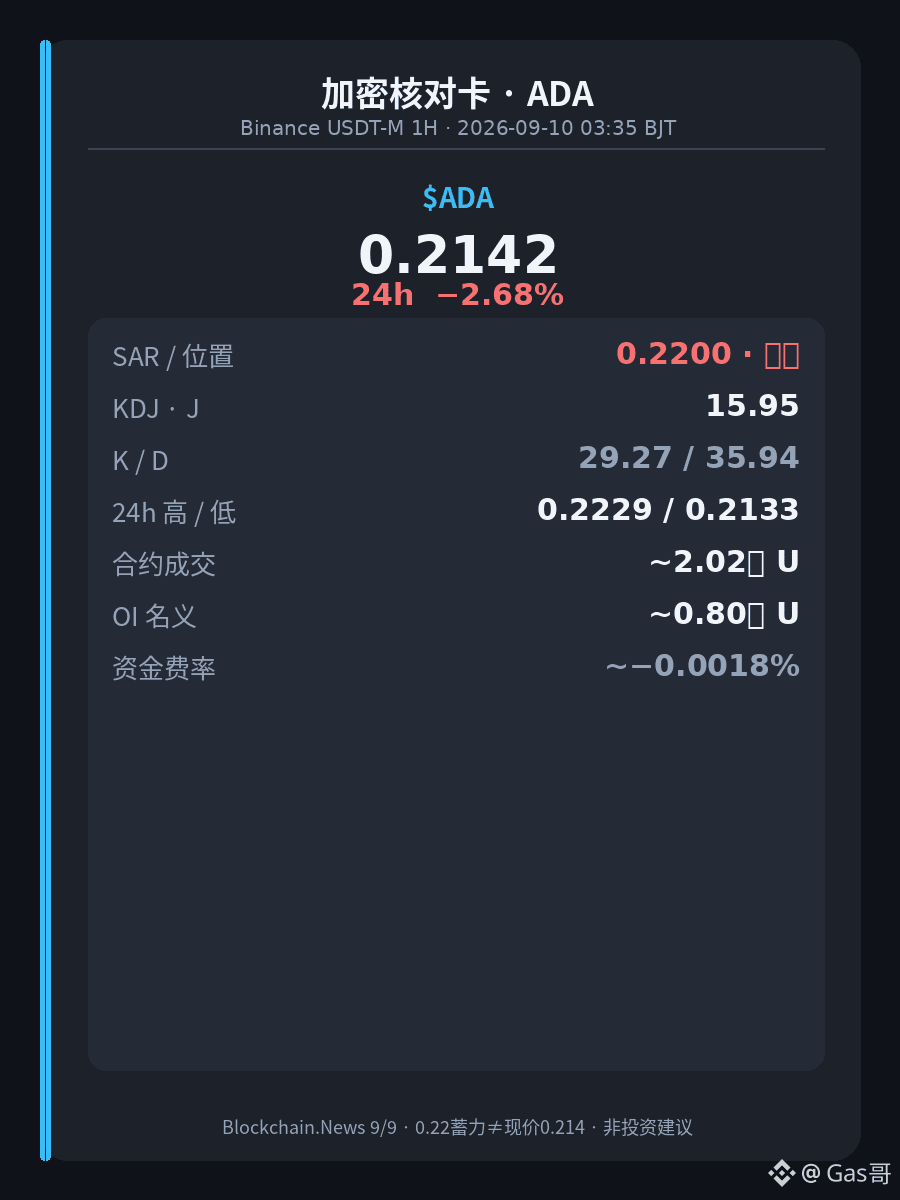
Look at the main markers in detail. The current price of $ADA is about 0.2142, down about −2.68% over 24 hours, and contract volume is about 202 million USDT. SAR is about 0.2200, with price roughly 0.0058 below it. Plainly: that short-term “uptrend/risk-stop parabolic line” has been breached; it’s only a finger’s width away from the 0.22 mentioned in the article, but structurally it’s below the line—not grinding right on it.
Momentum J is about 15.95 (K 29.27 / D 35.94): it has warmed slightly from when it was just a backdrop a few hours earlier (J≈9.25), but it’s still on the cool side—don’t read it as “oversold ignites.” 24-hour high 0.2229, low 0.2133; nominal open interest about $80 million; funding rate about −0.0018%. Red on the day, breaks the line, and J remains cool—those structure clues are there, but no directional instruction.
Today’s post is only recording numbers, not telling a hero story.
0.214. The article is also nailed with “0.22 = SMA200 accumulation level,” and this Binance contract’s 1-hour chart has already fallen below the mid-range.
Blockchain.News (2026-09-09, Felix Pinkston) at the time wrote that $ADA was consolidating at about $0.22: the long/short ratio among top traders was about 2.41, longs about 70.7%; open interest about $83.7M; the funding rate was close to neutral; the main scenario was a breakout above 0.23, and only a drop below 0.21 would count as invalidation. The actual price in the night session was about 0.2142—this isn’t the grid in a screenshot; it’s below the accumulation band.
Look at the main markers in detail. The current price of $ADA is about 0.2142, down about −2.68% over 24 hours, and contract volume is about 202 million USDT. SAR is about 0.2200, with price roughly 0.0058 below it. Plainly: that short-term “uptrend/risk-stop parabolic line” has been breached; it’s only a finger’s width away from the 0.22 mentioned in the article, but structurally it’s below the line—not grinding right on it.
Momentum J is about 15.95 (K 29.27 / D 35.94): it has warmed slightly from when it was just a backdrop a few hours earlier (J≈9.25), but it’s still on the cool side—don’t read it as “oversold ignites.” 24-hour high 0.2229, low 0.2133; nominal open interest about $80 million; funding rate about −0.0018%. Red on the day, breaks the line, and J remains cool—those structure clues are there, but no directional instruction.
Today’s post is only recording numbers, not telling a hero story.
Blockchain.News (2026-09-09, Felix Pinkston) at the time wrote that $ADA was consolidating at about $0.22: the long/short ratio among top traders was about 2.41, longs about 70.7%; open interest about $83.7M; the funding rate was close to neutral; the main scenario was a breakout above 0.23, and only a drop below 0.21 would count as invalidation. The actual price in the night session was about 0.2142—this isn’t the grid in a screenshot; it’s below the accumulation band.
Look at the main markers in detail. The current price of $ADA is about 0.2142, down about −2.68% over 24 hours, and contract volume is about 202 million USDT. SAR is about 0.2200, with price roughly 0.0058 below it. Plainly: that short-term “uptrend/risk-stop parabolic line” has been breached; it’s only a finger’s width away from the 0.22 mentioned in the article, but structurally it’s below the line—not grinding right on it.
Momentum J is about 15.95 (K 29.27 / D 35.94): it has warmed slightly from when it was just a backdrop a few hours earlier (J≈9.25), but it’s still on the cool side—don’t read it as “oversold ignites.” 24-hour high 0.2229, low 0.2133; nominal open interest about $80 million; funding rate about −0.0018%. Red on the day, breaks the line, and J remains cool—those structure clues are there, but no directional instruction.
Today’s post is only recording numbers, not telling a hero story.
127
·
--
The article is still being written: “$0.09 rangebound, whale bulls amassing power, 3.36:1” — during this 1-hour Binance contract tonight, $DOGE has already fallen to about 0.0886, and the uptrend line (SAR) is also below. The story is still stuck at 9, but price has already moved first.
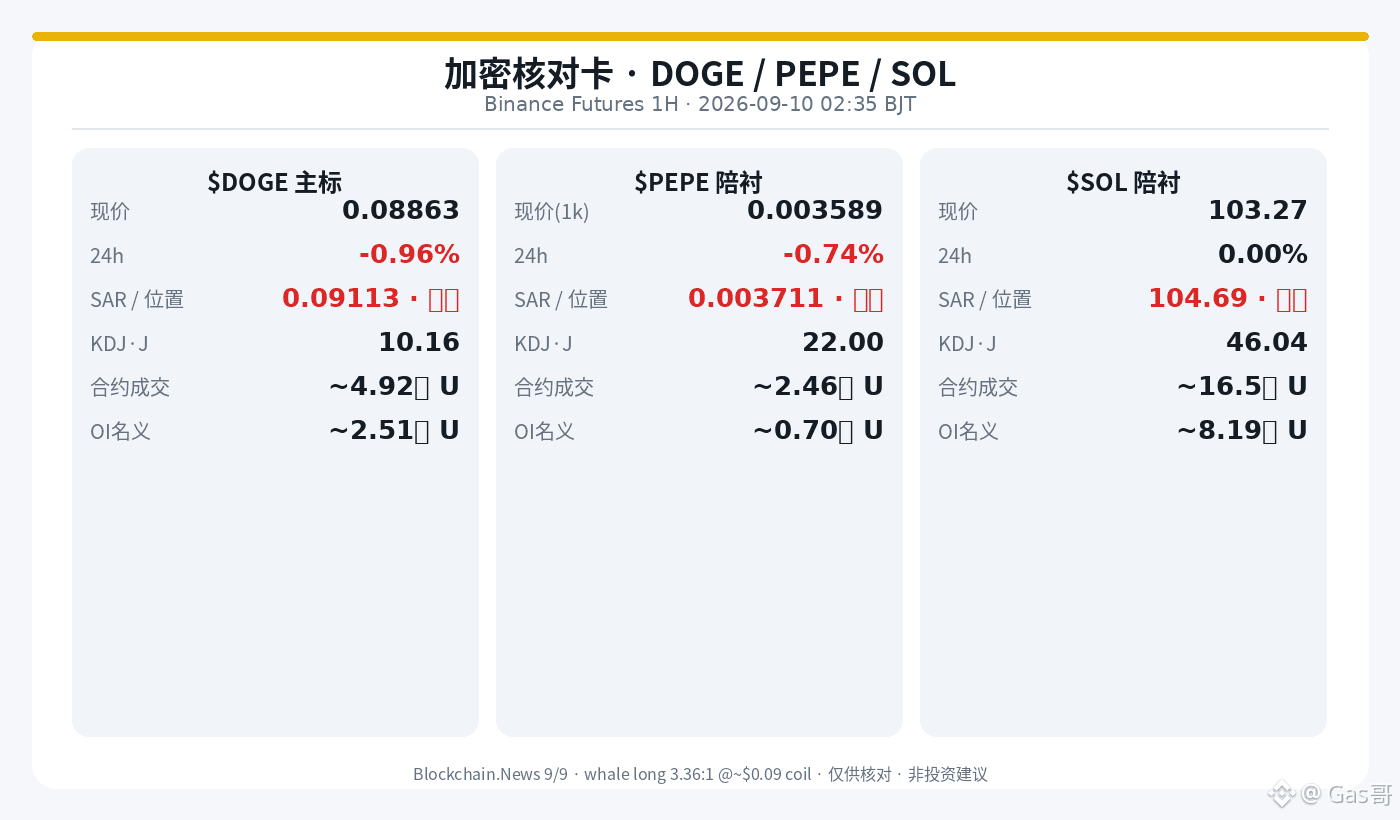
Take a closer look at the main chart. $DOGE current price is about 0.08863, down roughly −0.96% over the past 24 hours; contract volume is about $492 million USDT. SAR is around 0.09113; price is below it by about 0.0025 — plain talk: that short-term “follow-up/risk-parabola” has been breached. This isn’t a tight-range grind; it’s clearly dropped below the line. Momentum J is about 10.16 (K27.45 / D36.10): it has ticked up a bit compared to its earlier cameo (J≈2.65), but it’s still cool. Don’t read it as “oversold ignition.” 24-hour high is 0.09158, low is 0.08801. Open interest nominal is about $251 million. Funding rate is close to 0. A slightly red day, breaking the line, and J running cold all stack together — the structural clues are there, but no directional instruction.
The supporting cast pulls the spread. $PEPE (contract view of 1000PEPE) is about 0.003589 now, down about −0.74% in the past 24 hours, with volume around $246 million. SAR is about 0.003711; the line is broken. J is about 22.0 — warmer than DOGE by a notch, but still below the line. $SOL ’s daily chart is nearly flat (around 0.00%), current price about 103.27, volume about $1.65 billion; SAR is about 104.69, roughly 1.42 below; J is about 46.04, near neutral. All three tickers in the same “classroom” have broken SAR, yet the momentum isn’t the same temperature gauge: DOGE is the coldest, PEPE is in the middle, and SOL is relatively flat.
Verifiable news/funding: Blockchain.News (2026-09-09, Tony Kim) reports DOGE tightening its Bollinger Band around about $0.09 “building up power,” with the top trader long/short ratio around 3.36:1 (about 77.1% longs). At that time, open interest was around $262.87 million, growing roughly in sync with the spot price increase; it also laid out the main scenario: a break above 0.09 to look toward 0.10–0.115. Our 1-hour chart: price is about 0.08863, already slid below the “compressed midrange” mentioned in the article. OI nominal is still thick at about $251 million, but the short-term SAR has already been broken. The article timestamp is: “still talking about building power at 0.09.” The market timestamp is: “the 0.09 midrange first loosened.” Don’t weld those two parts into one sentence: “whale bulls = will pump immediately.”
More short-term noise. Filter out the narrative first, then look at the position.
The article is still being written: “$0.09 rangebound, whale bulls amassing power, 3.36:1” — during this 1-hour Binance contract tonight, $DOGE has already fallen to about 0.0886, and the uptrend line (SAR) is also below. The story is still stuck at 9, but price has already moved first.
Take a closer look at the main chart. $DOGE current price is about 0.08863, down roughly −0.96% over the past 24 hours; contract volume is about $492 million USDT. SAR is around 0.09113; price is below it by about 0.0025 — plain talk: that short-term “follow-up/risk-parabola” has been breached. This isn’t a tight-range grind; it’s clearly dropped below the line. Momentum J is about 10.16 (K27.45 / D36.10): it has ticked up a bit compared to its earlier cameo (J≈2.65), but it’s still cool. Don’t read it as “oversold ignition.” 24-hour high is 0.09158, low is 0.08801. Open interest nominal is about $251 million. Funding rate is close to 0. A slightly red day, breaking the line, and J running cold all stack together — the structural clues are there, but no directional instruction.
The supporting cast pulls the spread. $PEPE (contract view of 1000PEPE) is about 0.003589 now, down about −0.74% in the past 24 hours, with volume around $246 million. SAR is about 0.003711; the line is broken. J is about 22.0 — warmer than DOGE by a notch, but still below the line. $SOL ’s daily chart is nearly flat (around 0.00%), current price about 103.27, volume about $1.65 billion; SAR is about 104.69, roughly 1.42 below; J is about 46.04, near neutral. All three tickers in the same “classroom” have broken SAR, yet the momentum isn’t the same temperature gauge: DOGE is the coldest, PEPE is in the middle, and SOL is relatively flat.
Verifiable news/funding: Blockchain.News (2026-09-09, Tony Kim) reports DOGE tightening its Bollinger Band around about $0.09 “building up power,” with the top trader long/short ratio around 3.36:1 (about 77.1% longs). At that time, open interest was around $262.87 million, growing roughly in sync with the spot price increase; it also laid out the main scenario: a break above 0.09 to look toward 0.10–0.115. Our 1-hour chart: price is about 0.08863, already slid below the “compressed midrange” mentioned in the article. OI nominal is still thick at about $251 million, but the short-term SAR has already been broken. The article timestamp is: “still talking about building power at 0.09.” The market timestamp is: “the 0.09 midrange first loosened.” Don’t weld those two parts into one sentence: “whale bulls = will pump immediately.”
More short-term noise. Filter out the narrative first, then look at the position.
Take a closer look at the main chart. $DOGE current price is about 0.08863, down roughly −0.96% over the past 24 hours; contract volume is about $492 million USDT. SAR is around 0.09113; price is below it by about 0.0025 — plain talk: that short-term “follow-up/risk-parabola” has been breached. This isn’t a tight-range grind; it’s clearly dropped below the line. Momentum J is about 10.16 (K27.45 / D36.10): it has ticked up a bit compared to its earlier cameo (J≈2.65), but it’s still cool. Don’t read it as “oversold ignition.” 24-hour high is 0.09158, low is 0.08801. Open interest nominal is about $251 million. Funding rate is close to 0. A slightly red day, breaking the line, and J running cold all stack together — the structural clues are there, but no directional instruction.
The supporting cast pulls the spread. $PEPE (contract view of 1000PEPE) is about 0.003589 now, down about −0.74% in the past 24 hours, with volume around $246 million. SAR is about 0.003711; the line is broken. J is about 22.0 — warmer than DOGE by a notch, but still below the line. $SOL ’s daily chart is nearly flat (around 0.00%), current price about 103.27, volume about $1.65 billion; SAR is about 104.69, roughly 1.42 below; J is about 46.04, near neutral. All three tickers in the same “classroom” have broken SAR, yet the momentum isn’t the same temperature gauge: DOGE is the coldest, PEPE is in the middle, and SOL is relatively flat.
Verifiable news/funding: Blockchain.News (2026-09-09, Tony Kim) reports DOGE tightening its Bollinger Band around about $0.09 “building up power,” with the top trader long/short ratio around 3.36:1 (about 77.1% longs). At that time, open interest was around $262.87 million, growing roughly in sync with the spot price increase; it also laid out the main scenario: a break above 0.09 to look toward 0.10–0.115. Our 1-hour chart: price is about 0.08863, already slid below the “compressed midrange” mentioned in the article. OI nominal is still thick at about $251 million, but the short-term SAR has already been broken. The article timestamp is: “still talking about building power at 0.09.” The market timestamp is: “the 0.09 midrange first loosened.” Don’t weld those two parts into one sentence: “whale bulls = will pump immediately.”
More short-term noise. Filter out the narrative first, then look at the position.
1
674
·
--
U.S. Eastern time, September 8: Do you still remember that net inflow for the spot XRP ETF? During the night, on this Binance perpetual contract for 1 hour, $XRP has already slipped below the follow-the-price / stop-and-parabola line (SAR). A red ledger doesn’t automatically mean a short-term breakdown—price is still holding its structure.
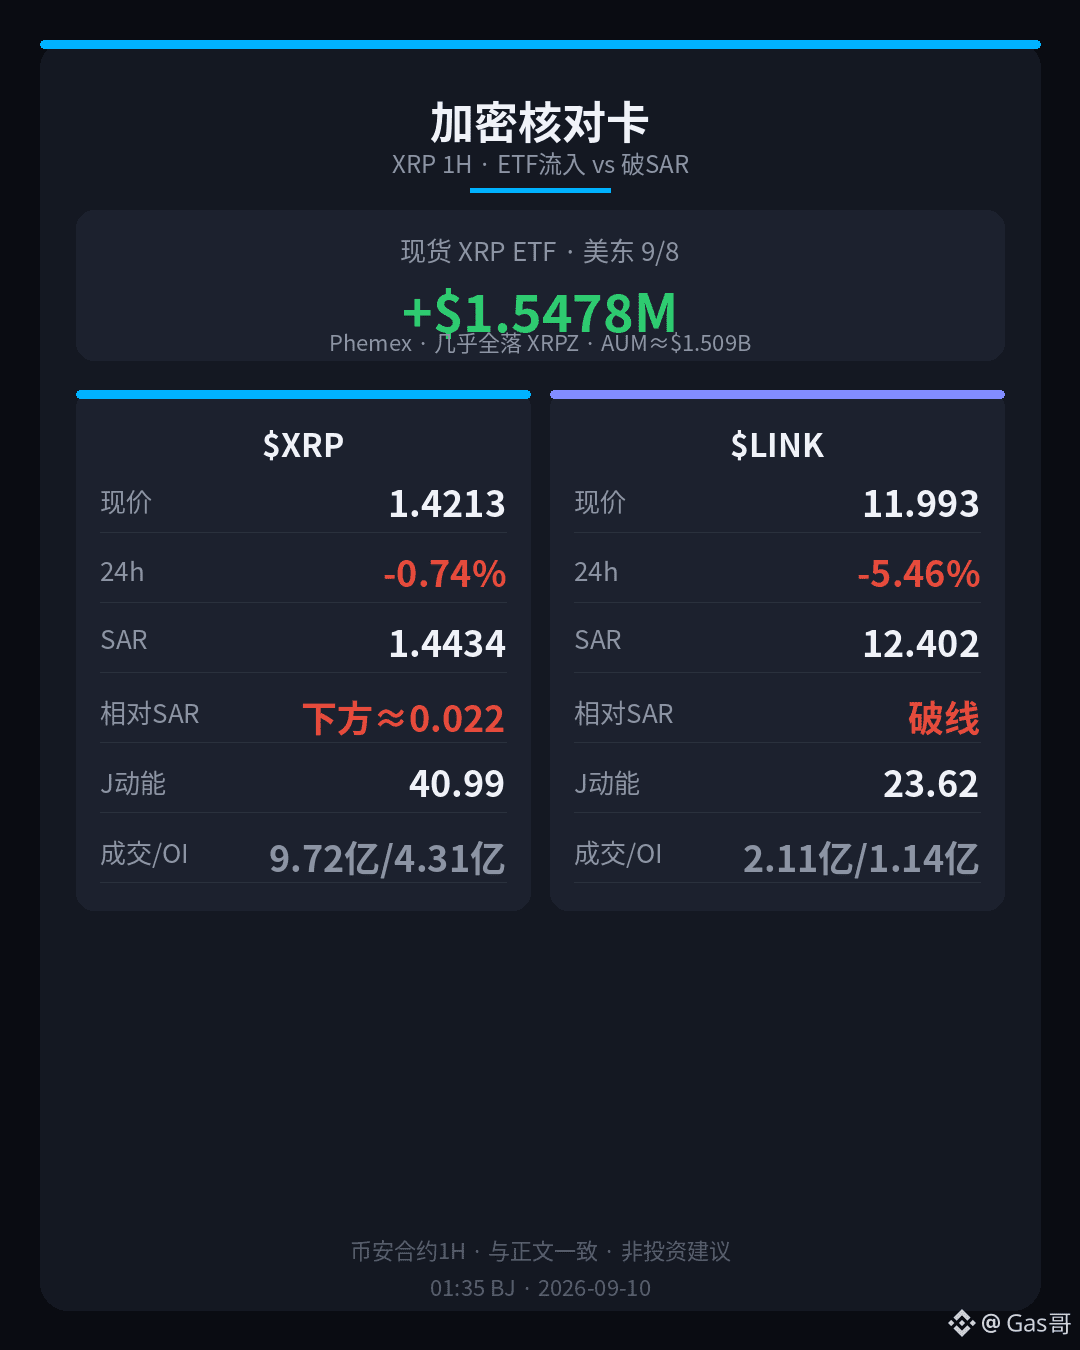
First, look at the main chart. $XRP is trading around 1.4213, about −0.74% over the past 24 hours, with contract volume around 972 million USDT. SAR is about 1.4434; the price is roughly 0.022 below it—plain talk: that “follow-the-price / stop-loss parabola” line has been clearly breached, not just drifting around it on the surface. Momentum J is about 40.99 (K 43.28 / D 44.43). It’s not the kind of “capitulation” plunge that hits an extreme low; more like neutral to slightly flat. Don’t read “breaking the line” directly as “oversold so it must rebound.” The 24h high is 1.4462 and the low is 1.4046. Open interest is around $431 million. Funding rate is about −0.0052%, slightly bearish but not dramatic.
For contrast, the supporting chart is worse: $LINK in the same window—current price around 11.993, daily about −5.46%, with volume around 211 million; SAR is about 12.402 and it has broken the line; J is about 23.62, even colder than XRP. Same direction break, but the drop magnitude and momentum “temperature” are not in the same league.
Funding is verifiable: Phemex News (2026-09-09) paraphrases that on U.S. Eastern September 8, the total net inflow for the U.S. spot XRP ETF was about $1.5478 million, and almost all of it landed in Franklin’s XRPZ. Across the market, total XRP spot ETF net assets are about $1.509 billion, with historical cumulative net inflows around $1.683 billion. That was the “previous trading day’s” funding ledger; what we’re looking at with this 1-hour chart is the “current board temperature.” Don’t glue those two timestamps into one sentence like “institutions are still buying, so short-term can’t break.”
Up or down is allowed—what matters is not reading a single move as a trend reversal.
U.S. Eastern time, September 8: Do you still remember that net inflow for the spot XRP ETF? During the night, on this Binance perpetual contract for 1 hour, $XRP has already slipped below the follow-the-price / stop-and-parabola line (SAR). A red ledger doesn’t automatically mean a short-term breakdown—price is still holding its structure.
First, look at the main chart. $XRP is trading around 1.4213, about −0.74% over the past 24 hours, with contract volume around 972 million USDT. SAR is about 1.4434; the price is roughly 0.022 below it—plain talk: that “follow-the-price / stop-loss parabola” line has been clearly breached, not just drifting around it on the surface. Momentum J is about 40.99 (K 43.28 / D 44.43). It’s not the kind of “capitulation” plunge that hits an extreme low; more like neutral to slightly flat. Don’t read “breaking the line” directly as “oversold so it must rebound.” The 24h high is 1.4462 and the low is 1.4046. Open interest is around $431 million. Funding rate is about −0.0052%, slightly bearish but not dramatic.
For contrast, the supporting chart is worse: $LINK in the same window—current price around 11.993, daily about −5.46%, with volume around 211 million; SAR is about 12.402 and it has broken the line; J is about 23.62, even colder than XRP. Same direction break, but the drop magnitude and momentum “temperature” are not in the same league.
Funding is verifiable: Phemex News (2026-09-09) paraphrases that on U.S. Eastern September 8, the total net inflow for the U.S. spot XRP ETF was about $1.5478 million, and almost all of it landed in Franklin’s XRPZ. Across the market, total XRP spot ETF net assets are about $1.509 billion, with historical cumulative net inflows around $1.683 billion. That was the “previous trading day’s” funding ledger; what we’re looking at with this 1-hour chart is the “current board temperature.” Don’t glue those two timestamps into one sentence like “institutions are still buying, so short-term can’t break.”
Up or down is allowed—what matters is not reading a single move as a trend reversal.
First, look at the main chart. $XRP is trading around 1.4213, about −0.74% over the past 24 hours, with contract volume around 972 million USDT. SAR is about 1.4434; the price is roughly 0.022 below it—plain talk: that “follow-the-price / stop-loss parabola” line has been clearly breached, not just drifting around it on the surface. Momentum J is about 40.99 (K 43.28 / D 44.43). It’s not the kind of “capitulation” plunge that hits an extreme low; more like neutral to slightly flat. Don’t read “breaking the line” directly as “oversold so it must rebound.” The 24h high is 1.4462 and the low is 1.4046. Open interest is around $431 million. Funding rate is about −0.0052%, slightly bearish but not dramatic.
For contrast, the supporting chart is worse: $LINK in the same window—current price around 11.993, daily about −5.46%, with volume around 211 million; SAR is about 12.402 and it has broken the line; J is about 23.62, even colder than XRP. Same direction break, but the drop magnitude and momentum “temperature” are not in the same league.
Funding is verifiable: Phemex News (2026-09-09) paraphrases that on U.S. Eastern September 8, the total net inflow for the U.S. spot XRP ETF was about $1.5478 million, and almost all of it landed in Franklin’s XRPZ. Across the market, total XRP spot ETF net assets are about $1.509 billion, with historical cumulative net inflows around $1.683 billion. That was the “previous trading day’s” funding ledger; what we’re looking at with this 1-hour chart is the “current board temperature.” Don’t glue those two timestamps into one sentence like “institutions are still buying, so short-term can’t break.”
Up or down is allowed—what matters is not reading a single move as a trend reversal.
1
166
·
--
Blockchain.News yesterday even wrote $745 as a “key support”—and during the next 1-hour window, price already slid into the 734–739 slice they claimed. The zone is fact; when it reaches the zone, it should bounce—not “facts.”
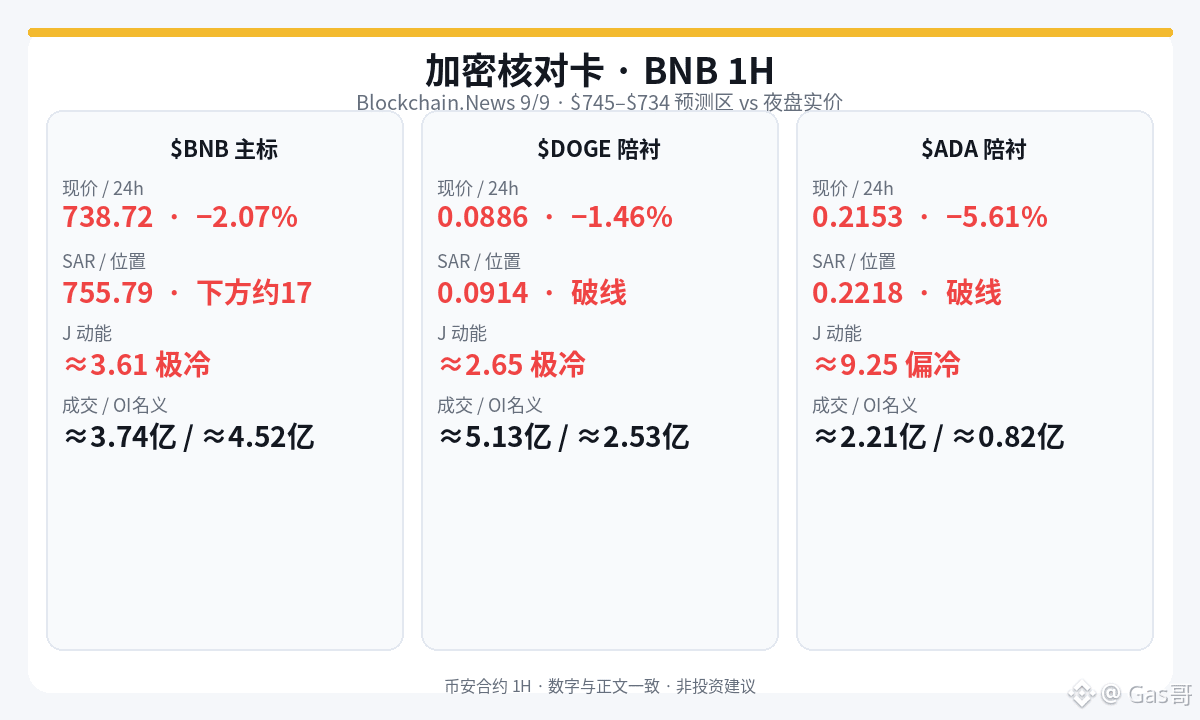
Main headline $BNB: Binance perpetuals 1-hour, current price around 738.72, down about −2.07% over 24 hours; contract volume about $374 million USDT. The breakout-follow line (SAR) is around 755.79, with price about 17 below it—short-term support has been broken through, and it’s not just hovering near the line; it has clearly dropped below it. Momentum J is about 3.61 (K19.5 / D27.44), close to that “it’s been smashed and cooled off” feel. Earlier, when it was just serving as a backdrop in the evening, it was still above SAR, with J around 11; now the main mark has turned into “line-break + extreme cold.” 24-hour high 758.4, low 735.11; open interest about 612,000 contracts, nominal value about $452 million based on the mark price; funding rate about 0. Red day, line break, J bottoming: three things stacking up—don’t weld it into a “must rebound from oversold.”
Backdrops for comparison: $DOGE current price around 0.0886, 24 hours about −1.46%, volume about $513 million; SAR around 0.0914, already broke the line; J about 2.65, also extremely cold. $ADA is even harsher: current price around 0.2153, 24 hours about −5.61%, volume about $221 million; SAR around 0.2218, broke the line; J about 9.25, somewhat cold. All three markers in the same window are line-break and mostly cold—same direction doesn’t mean the same drawdown magnitude; ADA’s daily chart is even worse.
News/funding can be checked: Blockchain.News (2026-09-09, Lawrence Jengar) at the time wrote BNB around 756.58, momentum leveling off; the base scenario (about 65%) was a pullback into the 745–734 support band. It also mentioned that spot selling pressure was actively dominant, with funding rates neutral around 0. Our 1-hour reading: price about 738.72 is already inside that forecast band, and the funding rate is still about 0. The article timestamp is “still looking ahead to a pullback near 756”; the chart timestamp is “the pullback has already progressed into the band”—don’t read those two time points together.
In one sentence: touching the 734–739 forecast zone is valid; “buy when it reaches support” is not.
Blockchain.News yesterday even wrote $745 as a “key support”—and during the next 1-hour window, price already slid into the 734–739 slice they claimed. The zone is fact; when it reaches the zone, it should bounce—not “facts.”
Main headline $BNB : Binance perpetuals 1-hour, current price around 738.72, down about −2.07% over 24 hours; contract volume about $374 million USDT. The breakout-follow line (SAR) is around 755.79, with price about 17 below it—short-term support has been broken through, and it’s not just hovering near the line; it has clearly dropped below it. Momentum J is about 3.61 (K19.5 / D27.44), close to that “it’s been smashed and cooled off” feel. Earlier, when it was just serving as a backdrop in the evening, it was still above SAR, with J around 11; now the main mark has turned into “line-break + extreme cold.” 24-hour high 758.4, low 735.11; open interest about 612,000 contracts, nominal value about $452 million based on the mark price; funding rate about 0. Red day, line break, J bottoming: three things stacking up—don’t weld it into a “must rebound from oversold.”
Backdrops for comparison: $DOGE current price around 0.0886, 24 hours about −1.46%, volume about $513 million; SAR around 0.0914, already broke the line; J about 2.65, also extremely cold. $ADA is even harsher: current price around 0.2153, 24 hours about −5.61%, volume about $221 million; SAR around 0.2218, broke the line; J about 9.25, somewhat cold. All three markers in the same window are line-break and mostly cold—same direction doesn’t mean the same drawdown magnitude; ADA’s daily chart is even worse.
News/funding can be checked: Blockchain.News (2026-09-09, Lawrence Jengar) at the time wrote BNB around 756.58, momentum leveling off; the base scenario (about 65%) was a pullback into the 745–734 support band. It also mentioned that spot selling pressure was actively dominant, with funding rates neutral around 0. Our 1-hour reading: price about 738.72 is already inside that forecast band, and the funding rate is still about 0. The article timestamp is “still looking ahead to a pullback near 756”; the chart timestamp is “the pullback has already progressed into the band”—don’t read those two time points together.
In one sentence: touching the 734–739 forecast zone is valid; “buy when it reaches support” is not.
Main headline $BNB : Binance perpetuals 1-hour, current price around 738.72, down about −2.07% over 24 hours; contract volume about $374 million USDT. The breakout-follow line (SAR) is around 755.79, with price about 17 below it—short-term support has been broken through, and it’s not just hovering near the line; it has clearly dropped below it. Momentum J is about 3.61 (K19.5 / D27.44), close to that “it’s been smashed and cooled off” feel. Earlier, when it was just serving as a backdrop in the evening, it was still above SAR, with J around 11; now the main mark has turned into “line-break + extreme cold.” 24-hour high 758.4, low 735.11; open interest about 612,000 contracts, nominal value about $452 million based on the mark price; funding rate about 0. Red day, line break, J bottoming: three things stacking up—don’t weld it into a “must rebound from oversold.”
Backdrops for comparison: $DOGE current price around 0.0886, 24 hours about −1.46%, volume about $513 million; SAR around 0.0914, already broke the line; J about 2.65, also extremely cold. $ADA is even harsher: current price around 0.2153, 24 hours about −5.61%, volume about $221 million; SAR around 0.2218, broke the line; J about 9.25, somewhat cold. All three markers in the same window are line-break and mostly cold—same direction doesn’t mean the same drawdown magnitude; ADA’s daily chart is even worse.
News/funding can be checked: Blockchain.News (2026-09-09, Lawrence Jengar) at the time wrote BNB around 756.58, momentum leveling off; the base scenario (about 65%) was a pullback into the 745–734 support band. It also mentioned that spot selling pressure was actively dominant, with funding rates neutral around 0. Our 1-hour reading: price about 738.72 is already inside that forecast band, and the funding rate is still about 0. The article timestamp is “still looking ahead to a pullback near 756”; the chart timestamp is “the pullback has already progressed into the band”—don’t read those two time points together.
In one sentence: touching the 734–739 forecast zone is valid; “buy when it reaches support” is not.
1
574
·
--
Three hours ago, $SOL was still sticking to the uptrend line, and now it’s already dropped to about one and a half units below the line—those little green candles on the daily, don’t rush to label it as “still solid.”
Main chart $SOL: Binance perpetual, 1-hour timeframe. Current price is about 103.52, up about +0.26% over the past 24 hours; contract volume is roughly 1.643 billion USDT. The trailing-up line (SAR) is around 105.07, and price is about 1.55 below it—short-term support has been broken through. Momentum J is about 13.16 (K 36.72 / D 48.51). Compared with the “extra leftover” near the evening-support area where it was around J 30, it has slid into a state of “break-the-line + a bit cold.” Past 24h high 105.19, low 102.76; open interest notional about $824 million; funding rate about −0.0027%. Slightly green on the daily, breaking SAR, and J a bit cold—these three can all be true at the same time. Don’t weld them into “a pullback buy.”
Side-by-side check: $XRP current price about 1.4254, up about +0.78% in 24 hours; volume about 1.038 billion. SAR around 1.4172, price is about 0.008 above it—still standing. J is about 33.35, neutral-to-stable. One breaks the line and turns cold; the other holds the line without panicking: don’t read both from the same “temperature” in the same window.
News/flows you can verify: SoSoValue data (rephrased from 247 Wall St., 2026-09-08)—for the week up to 9/4, US stock spot SOL ETF net inflows fell from about $153.87 million to about $6.18 million, a decline of roughly 96%; on 9/4 itself there was still a net outflow of about $5.21 million. Cryptonomist (2026-09-09) also cites SoSoValue: on 9/8 (Tuesday), XRP ETF total net inflows were nearly $2 million, while on the same day SOL products had net outflows of less than $1 million. The channel is cooling first, then the chart breaks—this isn’t the same thermometer, but don’t read the direction with it twisted.
The break of the line plus the colder J has already spoken. Whether the daily slightly green should still be read as “holding” is another story.
Three hours ago, $SOL was still sticking to the uptrend line, and now it’s already dropped to about one and a half units below the line—those little green candles on the daily, don’t rush to label it as “still solid.”
Main chart $SOL : Binance perpetual, 1-hour timeframe. Current price is about 103.52, up about +0.26% over the past 24 hours; contract volume is roughly 1.643 billion USDT. The trailing-up line (SAR) is around 105.07, and price is about 1.55 below it—short-term support has been broken through. Momentum J is about 13.16 (K 36.72 / D 48.51). Compared with the “extra leftover” near the evening-support area where it was around J 30, it has slid into a state of “break-the-line + a bit cold.” Past 24h high 105.19, low 102.76; open interest notional about $824 million; funding rate about −0.0027%. Slightly green on the daily, breaking SAR, and J a bit cold—these three can all be true at the same time. Don’t weld them into “a pullback buy.”
Side-by-side check: $XRP current price about 1.4254, up about +0.78% in 24 hours; volume about 1.038 billion. SAR around 1.4172, price is about 0.008 above it—still standing. J is about 33.35, neutral-to-stable. One breaks the line and turns cold; the other holds the line without panicking: don’t read both from the same “temperature” in the same window.
News/flows you can verify: SoSoValue data (rephrased from 247 Wall St., 2026-09-08)—for the week up to 9/4, US stock spot SOL ETF net inflows fell from about $153.87 million to about $6.18 million, a decline of roughly 96%; on 9/4 itself there was still a net outflow of about $5.21 million. Cryptonomist (2026-09-09) also cites SoSoValue: on 9/8 (Tuesday), XRP ETF total net inflows were nearly $2 million, while on the same day SOL products had net outflows of less than $1 million. The channel is cooling first, then the chart breaks—this isn’t the same thermometer, but don’t read the direction with it twisted.
The break of the line plus the colder J has already spoken. Whether the daily slightly green should still be read as “holding” is another story.
Main chart $SOL : Binance perpetual, 1-hour timeframe. Current price is about 103.52, up about +0.26% over the past 24 hours; contract volume is roughly 1.643 billion USDT. The trailing-up line (SAR) is around 105.07, and price is about 1.55 below it—short-term support has been broken through. Momentum J is about 13.16 (K 36.72 / D 48.51). Compared with the “extra leftover” near the evening-support area where it was around J 30, it has slid into a state of “break-the-line + a bit cold.” Past 24h high 105.19, low 102.76; open interest notional about $824 million; funding rate about −0.0027%. Slightly green on the daily, breaking SAR, and J a bit cold—these three can all be true at the same time. Don’t weld them into “a pullback buy.”
Side-by-side check: $XRP current price about 1.4254, up about +0.78% in 24 hours; volume about 1.038 billion. SAR around 1.4172, price is about 0.008 above it—still standing. J is about 33.35, neutral-to-stable. One breaks the line and turns cold; the other holds the line without panicking: don’t read both from the same “temperature” in the same window.
News/flows you can verify: SoSoValue data (rephrased from 247 Wall St., 2026-09-08)—for the week up to 9/4, US stock spot SOL ETF net inflows fell from about $153.87 million to about $6.18 million, a decline of roughly 96%; on 9/4 itself there was still a net outflow of about $5.21 million. Cryptonomist (2026-09-09) also cites SoSoValue: on 9/8 (Tuesday), XRP ETF total net inflows were nearly $2 million, while on the same day SOL products had net outflows of less than $1 million. The channel is cooling first, then the chart breaks—this isn’t the same thermometer, but don’t read the direction with it twisted.
The break of the line plus the colder J has already spoken. Whether the daily slightly green should still be read as “holding” is another story.
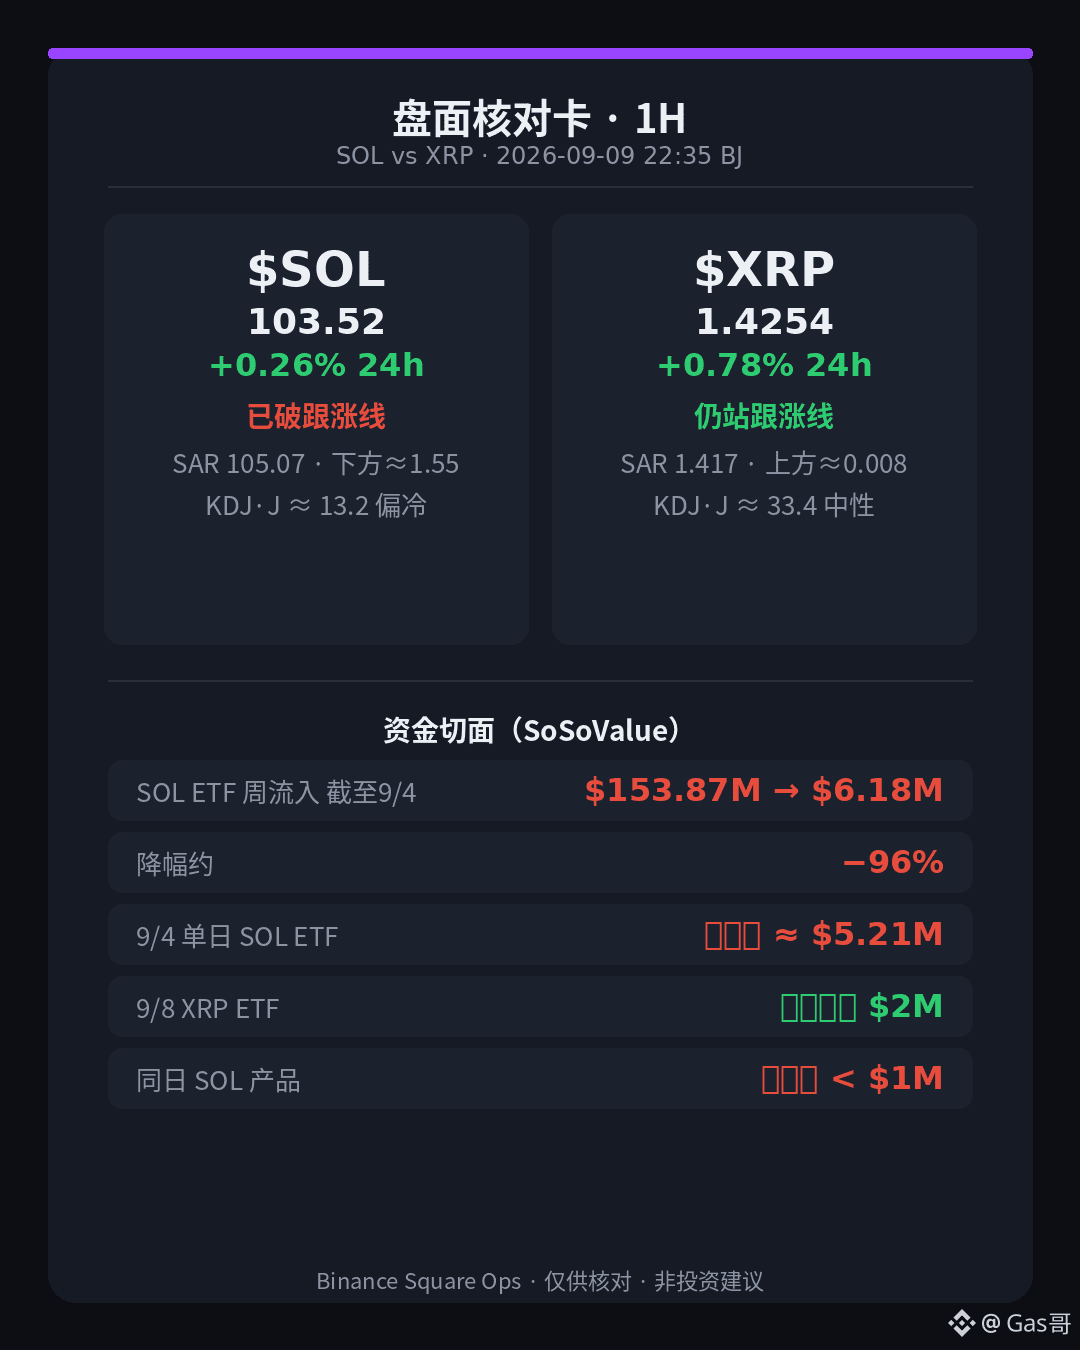
1
198
·
--
The daily chart is up about 1.6%, and Momentum J is heating back up to 70—this doesn’t mean ETH has already reclaimed the uptrend-following line. In the ledger, on 9/8 US stock spot Ethereum ETFs are still net outflows.
Main chart $ETH: Binance futures 1-hour timeframe, current price about 2512.1, up about +1.63% over 24 hours; futures trading volume about 8.86 billion USDT. The follow line (SAR) is about 2517.88, with the price about 5.78 below it—short-term support is still being stepped on. Momentum J is about 70.79 (K 59.43 / D 53.75). After appearing to bottom out near the evening-side contrast zone, it has heated up again, but the “hot throttle” hasn’t lifted the price back above the line. 24-hour high 2522.75, low 2440.22. Open interest about 2.279 million contracts; notional value by mark price about $5.73 billion. Funding rate about +0.0041%. Green day, J heating, break of the line: all three can happen at the same time—don’t weld it into “strength is back.”
Side-by-side comparison: $BNB current price about 750.15, down about −0.34% over 24 hours; volume about 360 million. SAR about 748.00, price is about 2.15 above it—still standing. J about 10.81, quite cold. One breaks the line and stomps the gas, and the other stands on a line with almost no gas: don’t read the same temperature across the board.
News/funding you can verify: Deep Tide TechFlow (2026-09-09) cites Trader T—on 9/8, US stock spot Ethereum ETFs had total net outflows of about $24.29 million; Fidelity FETH had net inflows of about $9.89 million, Grayscale ETHE net outflows of about $9.57 million, and Grayscale Mini ETH net outflows of about $24.61 million. Most others such as ETHA had net flows of zero that day. When the channel turns red, it’s not the same “thermometer” as the 1H “break of the line + hot J.”
Leave the ending blank: the numbers are here—your call to judge.
The daily chart is up about 1.6%, and Momentum J is heating back up to 70—this doesn’t mean ETH has already reclaimed the uptrend-following line. In the ledger, on 9/8 US stock spot Ethereum ETFs are still net outflows.
Main chart $ETH : Binance futures 1-hour timeframe, current price about 2512.1, up about +1.63% over 24 hours; futures trading volume about 8.86 billion USDT. The follow line (SAR) is about 2517.88, with the price about 5.78 below it—short-term support is still being stepped on. Momentum J is about 70.79 (K 59.43 / D 53.75). After appearing to bottom out near the evening-side contrast zone, it has heated up again, but the “hot throttle” hasn’t lifted the price back above the line. 24-hour high 2522.75, low 2440.22. Open interest about 2.279 million contracts; notional value by mark price about $5.73 billion. Funding rate about +0.0041%. Green day, J heating, break of the line: all three can happen at the same time—don’t weld it into “strength is back.”
Side-by-side comparison: $BNB current price about 750.15, down about −0.34% over 24 hours; volume about 360 million. SAR about 748.00, price is about 2.15 above it—still standing. J about 10.81, quite cold. One breaks the line and stomps the gas, and the other stands on a line with almost no gas: don’t read the same temperature across the board.
News/funding you can verify: Deep Tide TechFlow (2026-09-09) cites Trader T—on 9/8, US stock spot Ethereum ETFs had total net outflows of about $24.29 million; Fidelity FETH had net inflows of about $9.89 million, Grayscale ETHE net outflows of about $9.57 million, and Grayscale Mini ETH net outflows of about $24.61 million. Most others such as ETHA had net flows of zero that day. When the channel turns red, it’s not the same “thermometer” as the 1H “break of the line + hot J.”
Leave the ending blank: the numbers are here—your call to judge.
Main chart $ETH : Binance futures 1-hour timeframe, current price about 2512.1, up about +1.63% over 24 hours; futures trading volume about 8.86 billion USDT. The follow line (SAR) is about 2517.88, with the price about 5.78 below it—short-term support is still being stepped on. Momentum J is about 70.79 (K 59.43 / D 53.75). After appearing to bottom out near the evening-side contrast zone, it has heated up again, but the “hot throttle” hasn’t lifted the price back above the line. 24-hour high 2522.75, low 2440.22. Open interest about 2.279 million contracts; notional value by mark price about $5.73 billion. Funding rate about +0.0041%. Green day, J heating, break of the line: all three can happen at the same time—don’t weld it into “strength is back.”
Side-by-side comparison: $BNB current price about 750.15, down about −0.34% over 24 hours; volume about 360 million. SAR about 748.00, price is about 2.15 above it—still standing. J about 10.81, quite cold. One breaks the line and stomps the gas, and the other stands on a line with almost no gas: don’t read the same temperature across the board.
News/funding you can verify: Deep Tide TechFlow (2026-09-09) cites Trader T—on 9/8, US stock spot Ethereum ETFs had total net outflows of about $24.29 million; Fidelity FETH had net inflows of about $9.89 million, Grayscale ETHE net outflows of about $9.57 million, and Grayscale Mini ETH net outflows of about $24.61 million. Most others such as ETHA had net flows of zero that day. When the channel turns red, it’s not the same “thermometer” as the 1H “break of the line + hot J.”
Leave the ending blank: the numbers are here—your call to judge.
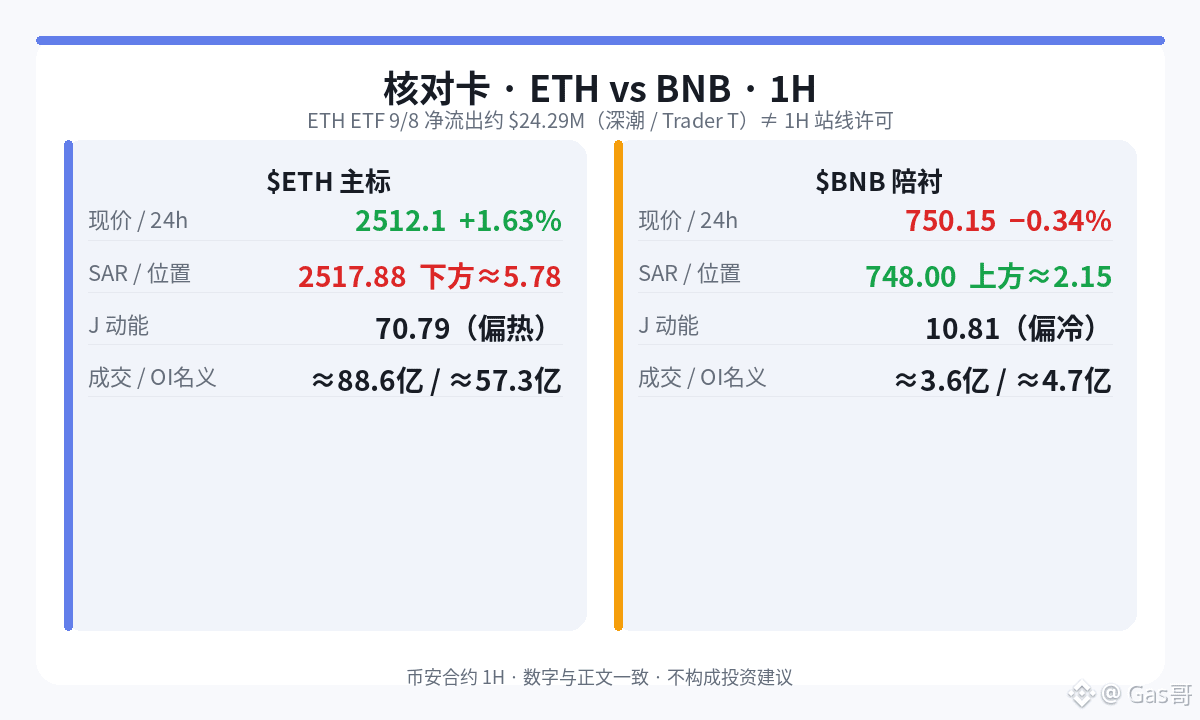
1
177
·
--
See translation
美股现货比特币 ETF 账本上,9/8 那天是净流出约 4664 万美元——但这不等于 BTC、ETH、SOL 这一小时共用同一根温度计。
主标 $BTC:币安合约 1 小时,现价约 78980.9,24 小时约 +0.46%,合约成交约 100.0 亿 USDT。跟涨线(SAR)约 78764.6,价在上方约 216——短线还站着。动能 J 约 36.9(K56.9 / D66.8),中性偏冷,谈不上油门踩死。24 小时高 79737、低 77600;未平仓约 10.56 万张,按标记价折名义约 83.4 亿美元;资金费率约 +0.0059%。日涨微绿、站线、J 不热:这是结构,不是「资金又涌进来了」的同义反复。
陪衬对照:$ETH 现价约 2486.72,24 小时约 +0.14%,成交约 84.9 亿;SAR 约 2522.75,价在下方约 36,J 约 3.0——几乎没怎么涨,却已经破线、油门见底。$SOL 现价约 103.68,约 +0.26%,成交约 16.4 亿;SAR 约 103.39,价在上方仅约 0.29,J 约 30.6——贴线站着,余量薄到可以忽略。三只日线都绿着,1H 结构却是「站 / 破 / 贴」三档,别焊成一块。
新闻/资金可核:深潮 TechFlow(2026-09-09)援引 Trader T——美股现货比特币 ETF 9/8 合计净流出约 4664 万美元;其中 BlackRock IBIT 净流入约 1066 万、Bitwise BITB 约 1447 万、ARK ARKB 约 806 万、Morgan Stanley MSBT 约 741 万;Fidelity FBTC 净流出约 1705 万、Invesco BTCO 约 468 万、Grayscale GBTC 约 6551 万,其余产品当日净流为零。总账红,不等于每个产品都在出;总账红,更不等于今天 1H 的 BTC 已经趴下。
同方向不等于同风险;把「ETF 净流出」直接焊成「三币一起弱」,这层别混。
美股现货比特币 ETF 账本上,9/8 那天是净流出约 4664 万美元——但这不等于 BTC、ETH、SOL 这一小时共用同一根温度计。
主标 $BTC :币安合约 1 小时,现价约 78980.9,24 小时约 +0.46%,合约成交约 100.0 亿 USDT。跟涨线(SAR)约 78764.6,价在上方约 216——短线还站着。动能 J 约 36.9(K56.9 / D66.8),中性偏冷,谈不上油门踩死。24 小时高 79737、低 77600;未平仓约 10.56 万张,按标记价折名义约 83.4 亿美元;资金费率约 +0.0059%。日涨微绿、站线、J 不热:这是结构,不是「资金又涌进来了」的同义反复。
陪衬对照:$ETH 现价约 2486.72,24 小时约 +0.14%,成交约 84.9 亿;SAR 约 2522.75,价在下方约 36,J 约 3.0——几乎没怎么涨,却已经破线、油门见底。$SOL 现价约 103.68,约 +0.26%,成交约 16.4 亿;SAR 约 103.39,价在上方仅约 0.29,J 约 30.6——贴线站着,余量薄到可以忽略。三只日线都绿着,1H 结构却是「站 / 破 / 贴」三档,别焊成一块。
新闻/资金可核:深潮 TechFlow(2026-09-09)援引 Trader T——美股现货比特币 ETF 9/8 合计净流出约 4664 万美元;其中 BlackRock IBIT 净流入约 1066 万、Bitwise BITB 约 1447 万、ARK ARKB 约 806 万、Morgan Stanley MSBT 约 741 万;Fidelity FBTC 净流出约 1705 万、Invesco BTCO 约 468 万、Grayscale GBTC 约 6551 万,其余产品当日净流为零。总账红,不等于每个产品都在出;总账红,更不等于今天 1H 的 BTC 已经趴下。
同方向不等于同风险;把「ETF 净流出」直接焊成「三币一起弱」,这层别混。
主标 $BTC :币安合约 1 小时,现价约 78980.9,24 小时约 +0.46%,合约成交约 100.0 亿 USDT。跟涨线(SAR)约 78764.6,价在上方约 216——短线还站着。动能 J 约 36.9(K56.9 / D66.8),中性偏冷,谈不上油门踩死。24 小时高 79737、低 77600;未平仓约 10.56 万张,按标记价折名义约 83.4 亿美元;资金费率约 +0.0059%。日涨微绿、站线、J 不热:这是结构,不是「资金又涌进来了」的同义反复。
陪衬对照:$ETH 现价约 2486.72,24 小时约 +0.14%,成交约 84.9 亿;SAR 约 2522.75,价在下方约 36,J 约 3.0——几乎没怎么涨,却已经破线、油门见底。$SOL 现价约 103.68,约 +0.26%,成交约 16.4 亿;SAR 约 103.39,价在上方仅约 0.29,J 约 30.6——贴线站着,余量薄到可以忽略。三只日线都绿着,1H 结构却是「站 / 破 / 贴」三档,别焊成一块。
新闻/资金可核:深潮 TechFlow(2026-09-09)援引 Trader T——美股现货比特币 ETF 9/8 合计净流出约 4664 万美元;其中 BlackRock IBIT 净流入约 1066 万、Bitwise BITB 约 1447 万、ARK ARKB 约 806 万、Morgan Stanley MSBT 约 741 万;Fidelity FBTC 净流出约 1705 万、Invesco BTCO 约 468 万、Grayscale GBTC 约 6551 万,其余产品当日净流为零。总账红,不等于每个产品都在出;总账红,更不等于今天 1H 的 BTC 已经趴下。
同方向不等于同风险;把「ETF 净流出」直接焊成「三币一起弱」,这层别混。
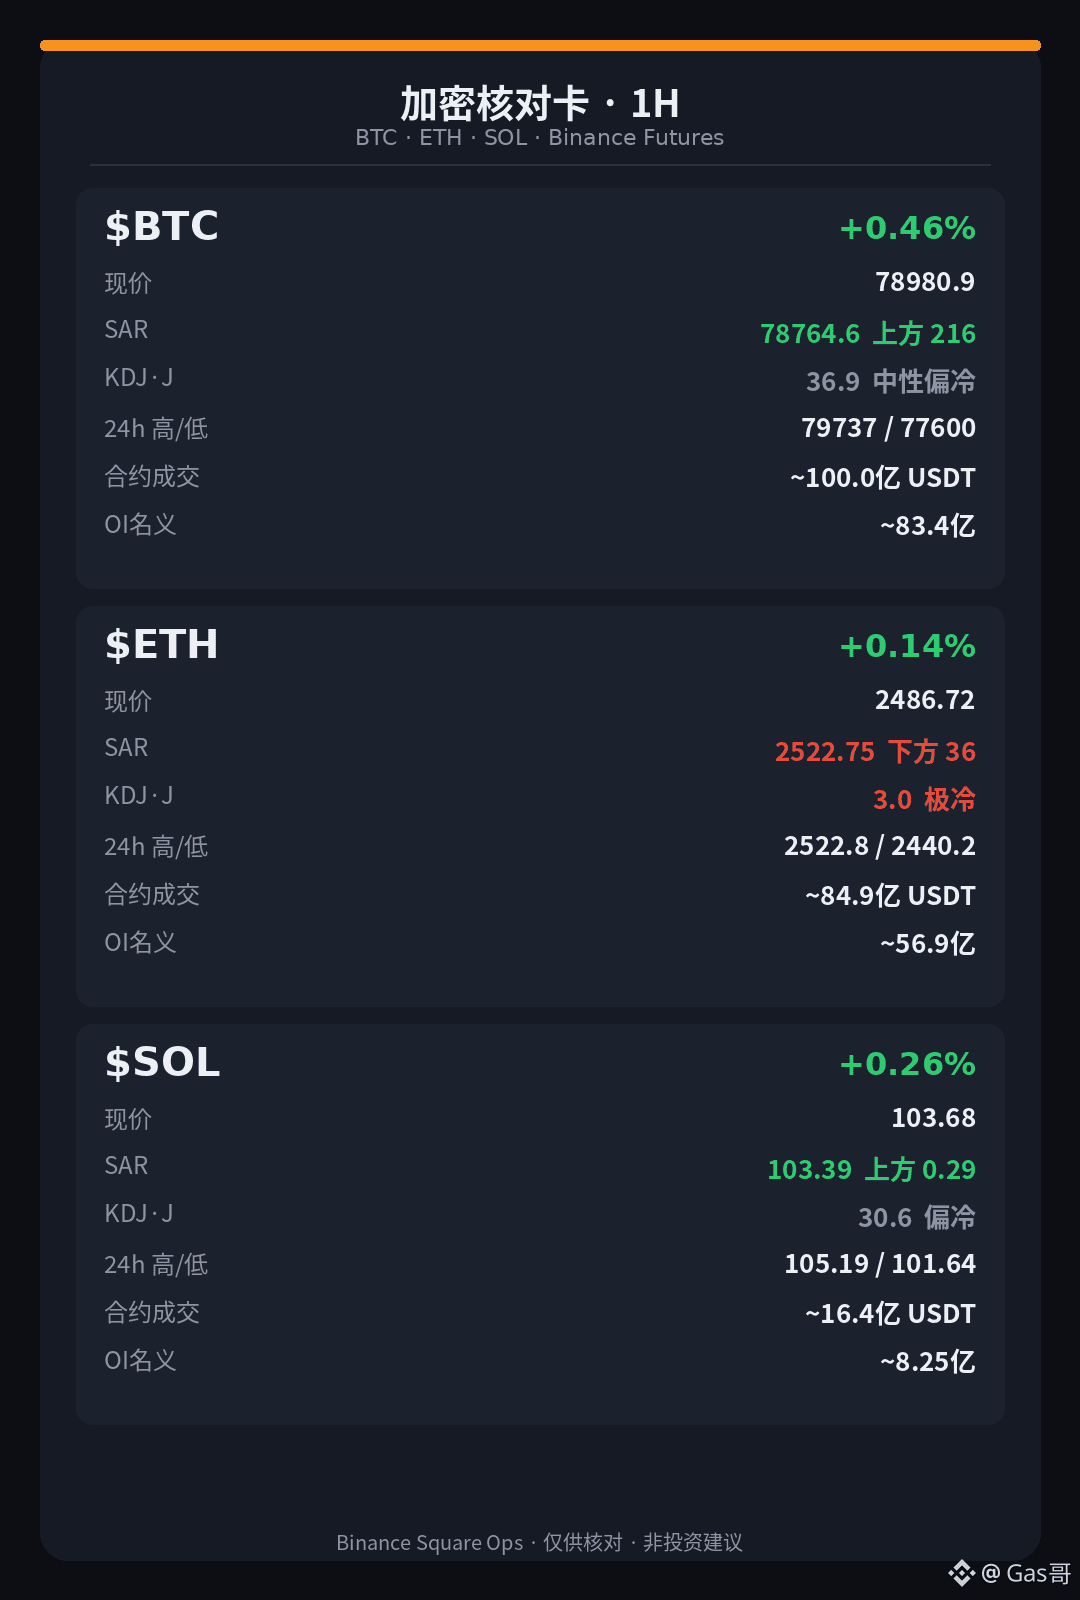
·
--
Last hour it even wrote $DELL as a side note—"support line + momentum leaning hot". This hour it’s taking over as the main headline on its own, and the pullline has already been breached—the daily chart is still green, but that doesn’t mean the 1-hour structure hasn’t changed.
Main headline $DELL: Binance TradFi 1H—current price about 530.88, up about +2.07% over 24h; contract volume about 0.35B USDT. Pullline (SAR) about 537.73; price is below by about 6.85—use this as a short-term support reference to consider flipping bearish. Momentum J is about 33.7 (K 50.2 / D 58.4); it slid from roughly 66 at the previous “side note” level down into a cooler, neutral zone. 24h high 537.73, low 515.74. Open interest about 33.0k contracts; notional value about 17.53M USD at the mark price; funding rate about −0.029%. The fact is it rose today; the fact is it broke the SAR: don’t weld “still green” into “still strong,” and don’t read “just broke the line” as the trend having already reversed.
Side note comparison: $AMD is around 502.18 currently, up about +3.42% over 24h; volume about 0.40B; SAR about 512.49; price is about 10.31 below; J about 0.13—same daily green, but it broke the line more deeply, and the throttle is almost nowhere to be seen. Both can argue an AI hardware story, but temperature and structure don’t share the same K.
News/funding are verifiable: Dell Technologies IR (quarter ended 2026-07-31, released around 9/8)—Q2 total revenue about $47B (YoY about +58%); ISG about $31.8B (about +89%); AI optimization server revenue about $16.4B (nearly doubled); AI orders during the quarter about $60.9B and AI backlog about $95B; full-year AI server revenue guidance raised to about $74B; the midpoint of Q3 total revenue guidance about $49B. The results are about order thickness and upward revisions to guidance; they don’t automatically override this hour’s structural change where it already broke SAR and where J dropped from somewhat hot to the low-30s.
Break the pullline and talk about the next step later; right now, welding “daily green” and “1H broke the line” together is still too early.
Last hour it even wrote $DELL as a side note—"support line + momentum leaning hot". This hour it’s taking over as the main headline on its own, and the pullline has already been breached—the daily chart is still green, but that doesn’t mean the 1-hour structure hasn’t changed.
Main headline $DELL : Binance TradFi 1H—current price about 530.88, up about +2.07% over 24h; contract volume about 0.35B USDT. Pullline (SAR) about 537.73; price is below by about 6.85—use this as a short-term support reference to consider flipping bearish. Momentum J is about 33.7 (K 50.2 / D 58.4); it slid from roughly 66 at the previous “side note” level down into a cooler, neutral zone. 24h high 537.73, low 515.74. Open interest about 33.0k contracts; notional value about 17.53M USD at the mark price; funding rate about −0.029%. The fact is it rose today; the fact is it broke the SAR: don’t weld “still green” into “still strong,” and don’t read “just broke the line” as the trend having already reversed.
Side note comparison: $AMD is around 502.18 currently, up about +3.42% over 24h; volume about 0.40B; SAR about 512.49; price is about 10.31 below; J about 0.13—same daily green, but it broke the line more deeply, and the throttle is almost nowhere to be seen. Both can argue an AI hardware story, but temperature and structure don’t share the same K.
News/funding are verifiable: Dell Technologies IR (quarter ended 2026-07-31, released around 9/8)—Q2 total revenue about $47B (YoY about +58%); ISG about $31.8B (about +89%); AI optimization server revenue about $16.4B (nearly doubled); AI orders during the quarter about $60.9B and AI backlog about $95B; full-year AI server revenue guidance raised to about $74B; the midpoint of Q3 total revenue guidance about $49B. The results are about order thickness and upward revisions to guidance; they don’t automatically override this hour’s structural change where it already broke SAR and where J dropped from somewhat hot to the low-30s.
Break the pullline and talk about the next step later; right now, welding “daily green” and “1H broke the line” together is still too early.
Main headline $DELL : Binance TradFi 1H—current price about 530.88, up about +2.07% over 24h; contract volume about 0.35B USDT. Pullline (SAR) about 537.73; price is below by about 6.85—use this as a short-term support reference to consider flipping bearish. Momentum J is about 33.7 (K 50.2 / D 58.4); it slid from roughly 66 at the previous “side note” level down into a cooler, neutral zone. 24h high 537.73, low 515.74. Open interest about 33.0k contracts; notional value about 17.53M USD at the mark price; funding rate about −0.029%. The fact is it rose today; the fact is it broke the SAR: don’t weld “still green” into “still strong,” and don’t read “just broke the line” as the trend having already reversed.
Side note comparison: $AMD is around 502.18 currently, up about +3.42% over 24h; volume about 0.40B; SAR about 512.49; price is about 10.31 below; J about 0.13—same daily green, but it broke the line more deeply, and the throttle is almost nowhere to be seen. Both can argue an AI hardware story, but temperature and structure don’t share the same K.
News/funding are verifiable: Dell Technologies IR (quarter ended 2026-07-31, released around 9/8)—Q2 total revenue about $47B (YoY about +58%); ISG about $31.8B (about +89%); AI optimization server revenue about $16.4B (nearly doubled); AI orders during the quarter about $60.9B and AI backlog about $95B; full-year AI server revenue guidance raised to about $74B; the midpoint of Q3 total revenue guidance about $49B. The results are about order thickness and upward revisions to guidance; they don’t automatically override this hour’s structural change where it already broke SAR and where J dropped from somewhat hot to the low-30s.
Break the pullline and talk about the next step later; right now, welding “daily green” and “1H broke the line” together is still too early.
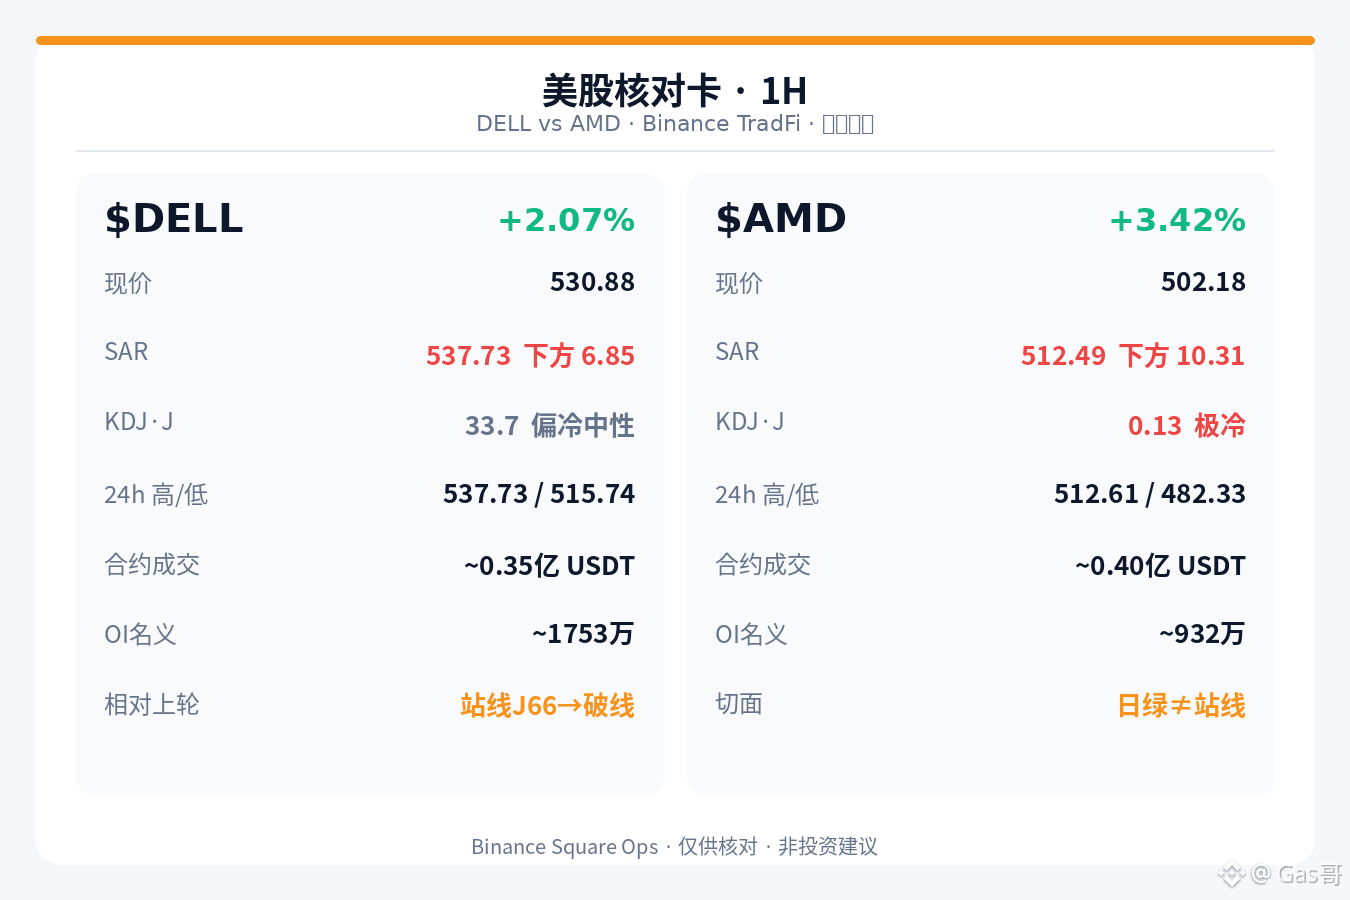
231
·
--
The same 1-hour candle where the throttle can go from slightly overheated to rather cold—this was pretty clear today on $AMZN .
Main ticker $AMZN: Binance TradFi 1-hour, current price about 256.86, roughly flat over the past 24 hours (around −0.01%), with contract volume about 0.17 billion USDT. The SAR line is around 256.03, and price is about 0.83 above it—so it hasn’t broken yet in the short term. But momentum J is about 18.97 (K50.9 / D66.9): it’s already on the cold side. In the previous hour it was still just a supporting role—“a standing line + J≈68.” This segment shows the throttle being eased quite noticeably. A standing line is a fact, and J cooling down is also a fact. Don’t read “still standing” as “still room to chase,” and don’t read “J dropping below twenty” as “it’s already turned bearish.” 24h high 258.42, low 255.04; open interest about 50.8k contracts, nominal value around $13.05 million using the mark price; funding rate about +0.011%. The structure looks more like “almost flat on the daily + still hugging the SAR + momentum cooling first.”
Temperature comparison of the “supporting cast” on two levels: $DELL has a current price around 533.91, up about +3.36% over 24 hours, with volume about 0.35 billion; SAR around 532.40, price about 1.51 above it, J about 66.3—green gains, a standing line, and momentum on the hot side. It’s simply not running the same “throttle” window as AMZN. $MSFT is at about 494.51, roughly −0.53%; SAR about 492.08, about 2.43 above it; J about 36.3—still a standing line, but it has backed off a lot compared with that afternoon’s extreme heat close to 100. All three can still be said to be “standing lines,” but their temperatures differ—same direction doesn’t mean the same risk.
News/funding checks you can verify: Amazon IR / Business Wire (2026-07-30)—Q2 net sales about $200.6 billion (YoY +20%); operating profit about $27.5 billion (about +43%); AWS about $42.2 billion (about +37%, official says the fastest 18 quarters), annualized revenue run rate about $169 billion; AWS operating profit about $16.6 billion. On the other side: as of 6/30, TTM free cash flow about −$7.6 billion (large property and equipment investments). Dell Technologies IR (fiscal quarter ended 2026-07-31, released around 9/8)—Q2 revenue about $47.0 billion (YoY about +58%); AI-optimized server revenue about $16.4 billion (about doubling); AI orders in the quarter about $60.9 billion, AI backlog about $95.0 billion; full-year AI server revenue guidance raised to about $74.0 billion. The results highlight the thickness of their cloud and AI infrastructure—but that doesn’t automatically determine whether this particular 1-hour timeframe should press the throttle.
Both up and down are allowed. The key is not to treat a single fluctuation as a trend reversal.
The same 1-hour candle where the throttle can go from slightly overheated to rather cold—this was pretty clear today on $AMZN .
Main ticker $AMZN : Binance TradFi 1-hour, current price about 256.86, roughly flat over the past 24 hours (around −0.01%), with contract volume about 0.17 billion USDT. The SAR line is around 256.03, and price is about 0.83 above it—so it hasn’t broken yet in the short term. But momentum J is about 18.97 (K50.9 / D66.9): it’s already on the cold side. In the previous hour it was still just a supporting role—“a standing line + J≈68.” This segment shows the throttle being eased quite noticeably. A standing line is a fact, and J cooling down is also a fact. Don’t read “still standing” as “still room to chase,” and don’t read “J dropping below twenty” as “it’s already turned bearish.” 24h high 258.42, low 255.04; open interest about 50.8k contracts, nominal value around $13.05 million using the mark price; funding rate about +0.011%. The structure looks more like “almost flat on the daily + still hugging the SAR + momentum cooling first.”
Temperature comparison of the “supporting cast” on two levels: $DELL has a current price around 533.91, up about +3.36% over 24 hours, with volume about 0.35 billion; SAR around 532.40, price about 1.51 above it, J about 66.3—green gains, a standing line, and momentum on the hot side. It’s simply not running the same “throttle” window as AMZN. $MSFT is at about 494.51, roughly −0.53%; SAR about 492.08, about 2.43 above it; J about 36.3—still a standing line, but it has backed off a lot compared with that afternoon’s extreme heat close to 100. All three can still be said to be “standing lines,” but their temperatures differ—same direction doesn’t mean the same risk.
News/funding checks you can verify: Amazon IR / Business Wire (2026-07-30)—Q2 net sales about $200.6 billion (YoY +20%); operating profit about $27.5 billion (about +43%); AWS about $42.2 billion (about +37%, official says the fastest 18 quarters), annualized revenue run rate about $169 billion; AWS operating profit about $16.6 billion. On the other side: as of 6/30, TTM free cash flow about −$7.6 billion (large property and equipment investments). Dell Technologies IR (fiscal quarter ended 2026-07-31, released around 9/8)—Q2 revenue about $47.0 billion (YoY about +58%); AI-optimized server revenue about $16.4 billion (about doubling); AI orders in the quarter about $60.9 billion, AI backlog about $95.0 billion; full-year AI server revenue guidance raised to about $74.0 billion. The results highlight the thickness of their cloud and AI infrastructure—but that doesn’t automatically determine whether this particular 1-hour timeframe should press the throttle.
Both up and down are allowed. The key is not to treat a single fluctuation as a trend reversal.
Main ticker $AMZN : Binance TradFi 1-hour, current price about 256.86, roughly flat over the past 24 hours (around −0.01%), with contract volume about 0.17 billion USDT. The SAR line is around 256.03, and price is about 0.83 above it—so it hasn’t broken yet in the short term. But momentum J is about 18.97 (K50.9 / D66.9): it’s already on the cold side. In the previous hour it was still just a supporting role—“a standing line + J≈68.” This segment shows the throttle being eased quite noticeably. A standing line is a fact, and J cooling down is also a fact. Don’t read “still standing” as “still room to chase,” and don’t read “J dropping below twenty” as “it’s already turned bearish.” 24h high 258.42, low 255.04; open interest about 50.8k contracts, nominal value around $13.05 million using the mark price; funding rate about +0.011%. The structure looks more like “almost flat on the daily + still hugging the SAR + momentum cooling first.”
Temperature comparison of the “supporting cast” on two levels: $DELL has a current price around 533.91, up about +3.36% over 24 hours, with volume about 0.35 billion; SAR around 532.40, price about 1.51 above it, J about 66.3—green gains, a standing line, and momentum on the hot side. It’s simply not running the same “throttle” window as AMZN. $MSFT is at about 494.51, roughly −0.53%; SAR about 492.08, about 2.43 above it; J about 36.3—still a standing line, but it has backed off a lot compared with that afternoon’s extreme heat close to 100. All three can still be said to be “standing lines,” but their temperatures differ—same direction doesn’t mean the same risk.
News/funding checks you can verify: Amazon IR / Business Wire (2026-07-30)—Q2 net sales about $200.6 billion (YoY +20%); operating profit about $27.5 billion (about +43%); AWS about $42.2 billion (about +37%, official says the fastest 18 quarters), annualized revenue run rate about $169 billion; AWS operating profit about $16.6 billion. On the other side: as of 6/30, TTM free cash flow about −$7.6 billion (large property and equipment investments). Dell Technologies IR (fiscal quarter ended 2026-07-31, released around 9/8)—Q2 revenue about $47.0 billion (YoY about +58%); AI-optimized server revenue about $16.4 billion (about doubling); AI orders in the quarter about $60.9 billion, AI backlog about $95.0 billion; full-year AI server revenue guidance raised to about $74.0 billion. The results highlight the thickness of their cloud and AI infrastructure—but that doesn’t automatically determine whether this particular 1-hour timeframe should press the throttle.
Both up and down are allowed. The key is not to treat a single fluctuation as a trend reversal.
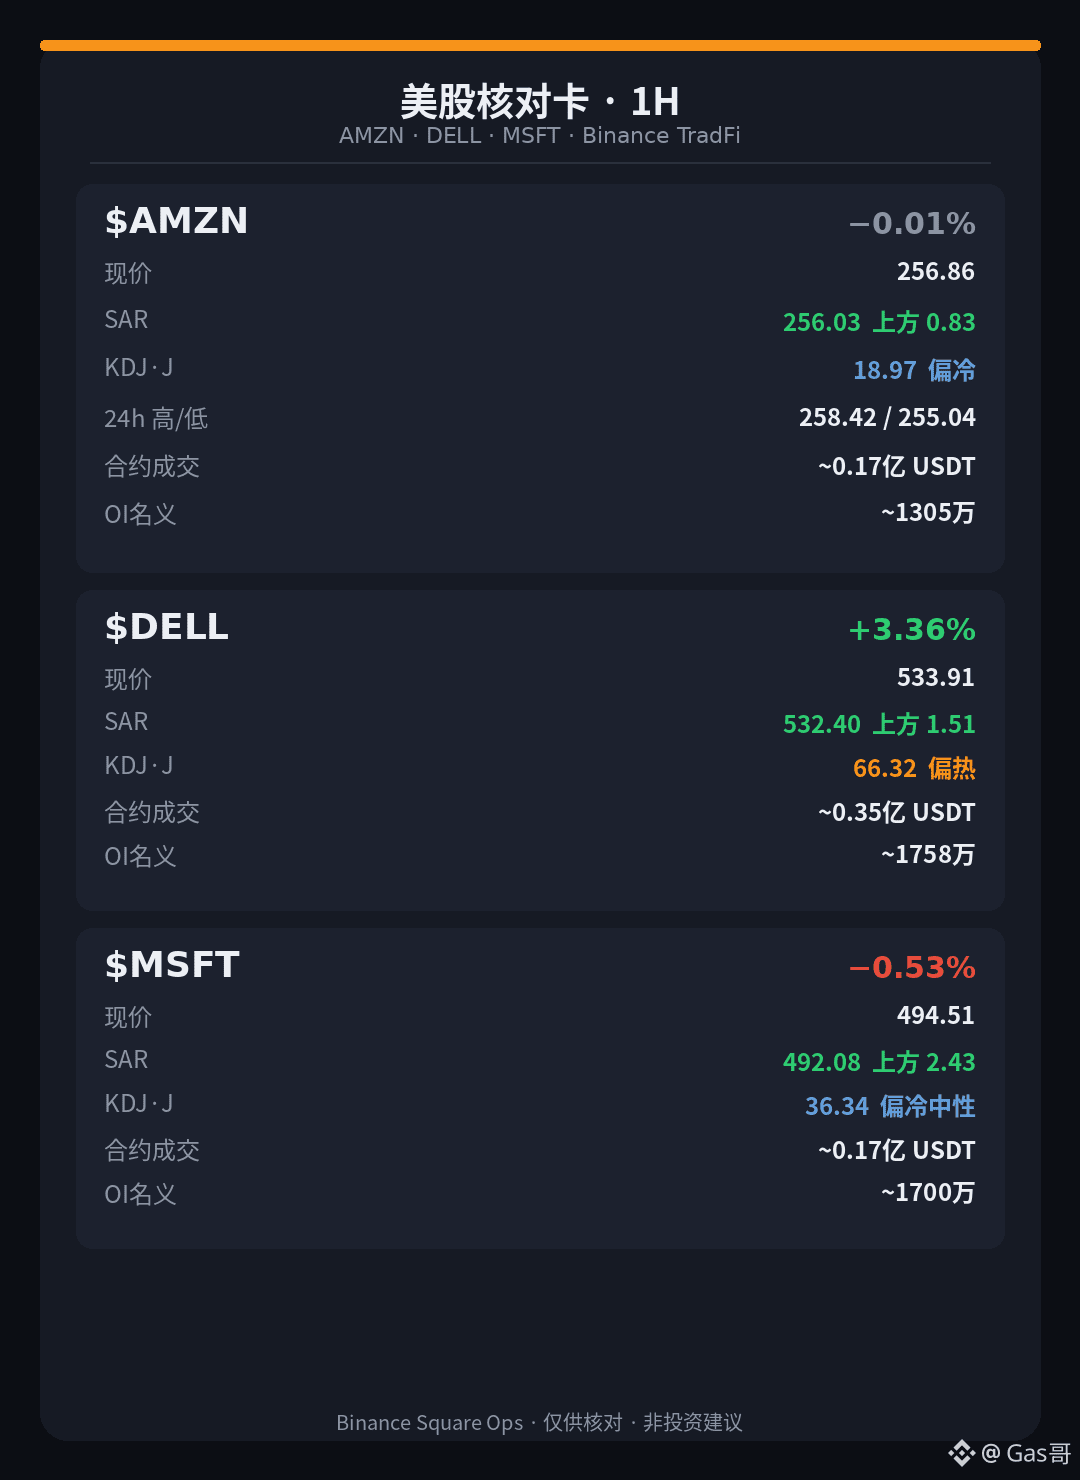
138
·
--
Cloud backlog report arrives totaling about $51.4 billion—don’t rush to translate this sentence into an “add-to-position this hour” license.
Main headline $GOOGL: Binance TradFi 1-hour, current price around 339.61; 24h about +0.67%; contract volume about 77 million USDT. The trailing stop line (SAR) is about 338.22; price is roughly 1.39 above it—so the short term is still holding above the line. Momentum J is about 71.3 (K 80.4 / D 85.0): a bit hot, but it has eased back from the previous round’s “holding the line + J≈85” by a notch. “Holding above the line” is a fact, and loosening the throttle a little is also a fact. Don’t read “still standing” as “still able to chase”; and don’t read “J falling” as “already weakening.” 24h high 340.09, low 333.64; open interest about 219k contracts; notional value by mark price roughly $74.21 million. Funding rate about +0.0166%. The structure is “slightly green on the daily + still above SAR + J overheated but cooling off.”
Supporting headline $AMZN: current price around 257.73; 24h about +0.17%; volume about 17 million; SAR about 255.93, price about 1.80 above it; J about 68.1. In the same window, both cloud stocks are holding the line, and both have J in the mid-to-high 60s—temperature is close. This isn’t the same chart as the 9/8 move where “one broke the line and the other held it.” Same structure doesn’t mean the same risk—don’t conflate them.
News / funding items you can verify: Alphabet official / SEC EX-99.1 (2026-07-22)—Q2 revenue about $119.8 billion (YoY about +24%); Google Cloud about $24.8 billion (YoY about +82%); cloud operating profit about $8.81 billion. Management’s guidance for cloud backlog orders is about $51.4 billion. The other side of cash flow: operating cash flow about $39.07 billion; property & equipment purchases in the quarter about $44.92 billion; free cash flow about -$5.86 billion. Also: net equity financing in June about $49.6 billion, with usage including expanding AI infrastructure. Amazon IR (2026-07-30)—Q2 net sales about $200.6 billion (+20%); AWS about $42.2 billion (+37%, official says the fastest 18 quarters); annualized revenue run-rate about $169.0 billion. The results show the thickness of the cloud and the backlog—yet it doesn’t issue a “throttle-on license” for 1 hour charts.
Hot indicators don’t automatically mean you can chase; cold indicators don’t automatically mean you should copy.
Cloud backlog report arrives totaling about $51.4 billion—don’t rush to translate this sentence into an “add-to-position this hour” license.
Main headline $GOOGL : Binance TradFi 1-hour, current price around 339.61; 24h about +0.67%; contract volume about 77 million USDT. The trailing stop line (SAR) is about 338.22; price is roughly 1.39 above it—so the short term is still holding above the line. Momentum J is about 71.3 (K 80.4 / D 85.0): a bit hot, but it has eased back from the previous round’s “holding the line + J≈85” by a notch. “Holding above the line” is a fact, and loosening the throttle a little is also a fact. Don’t read “still standing” as “still able to chase”; and don’t read “J falling” as “already weakening.” 24h high 340.09, low 333.64; open interest about 219k contracts; notional value by mark price roughly $74.21 million. Funding rate about +0.0166%. The structure is “slightly green on the daily + still above SAR + J overheated but cooling off.”
Supporting headline $AMZN : current price around 257.73; 24h about +0.17%; volume about 17 million; SAR about 255.93, price about 1.80 above it; J about 68.1. In the same window, both cloud stocks are holding the line, and both have J in the mid-to-high 60s—temperature is close. This isn’t the same chart as the 9/8 move where “one broke the line and the other held it.” Same structure doesn’t mean the same risk—don’t conflate them.
News / funding items you can verify: Alphabet official / SEC EX-99.1 (2026-07-22)—Q2 revenue about $119.8 billion (YoY about +24%); Google Cloud about $24.8 billion (YoY about +82%); cloud operating profit about $8.81 billion. Management’s guidance for cloud backlog orders is about $51.4 billion. The other side of cash flow: operating cash flow about $39.07 billion; property & equipment purchases in the quarter about $44.92 billion; free cash flow about -$5.86 billion. Also: net equity financing in June about $49.6 billion, with usage including expanding AI infrastructure. Amazon IR (2026-07-30)—Q2 net sales about $200.6 billion (+20%); AWS about $42.2 billion (+37%, official says the fastest 18 quarters); annualized revenue run-rate about $169.0 billion. The results show the thickness of the cloud and the backlog—yet it doesn’t issue a “throttle-on license” for 1 hour charts.
Hot indicators don’t automatically mean you can chase; cold indicators don’t automatically mean you should copy.
Main headline $GOOGL : Binance TradFi 1-hour, current price around 339.61; 24h about +0.67%; contract volume about 77 million USDT. The trailing stop line (SAR) is about 338.22; price is roughly 1.39 above it—so the short term is still holding above the line. Momentum J is about 71.3 (K 80.4 / D 85.0): a bit hot, but it has eased back from the previous round’s “holding the line + J≈85” by a notch. “Holding above the line” is a fact, and loosening the throttle a little is also a fact. Don’t read “still standing” as “still able to chase”; and don’t read “J falling” as “already weakening.” 24h high 340.09, low 333.64; open interest about 219k contracts; notional value by mark price roughly $74.21 million. Funding rate about +0.0166%. The structure is “slightly green on the daily + still above SAR + J overheated but cooling off.”
Supporting headline $AMZN : current price around 257.73; 24h about +0.17%; volume about 17 million; SAR about 255.93, price about 1.80 above it; J about 68.1. In the same window, both cloud stocks are holding the line, and both have J in the mid-to-high 60s—temperature is close. This isn’t the same chart as the 9/8 move where “one broke the line and the other held it.” Same structure doesn’t mean the same risk—don’t conflate them.
News / funding items you can verify: Alphabet official / SEC EX-99.1 (2026-07-22)—Q2 revenue about $119.8 billion (YoY about +24%); Google Cloud about $24.8 billion (YoY about +82%); cloud operating profit about $8.81 billion. Management’s guidance for cloud backlog orders is about $51.4 billion. The other side of cash flow: operating cash flow about $39.07 billion; property & equipment purchases in the quarter about $44.92 billion; free cash flow about -$5.86 billion. Also: net equity financing in June about $49.6 billion, with usage including expanding AI infrastructure. Amazon IR (2026-07-30)—Q2 net sales about $200.6 billion (+20%); AWS about $42.2 billion (+37%, official says the fastest 18 quarters); annualized revenue run-rate about $169.0 billion. The results show the thickness of the cloud and the backlog—yet it doesn’t issue a “throttle-on license” for 1 hour charts.
Hot indicators don’t automatically mean you can chase; cold indicators don’t automatically mean you should copy.
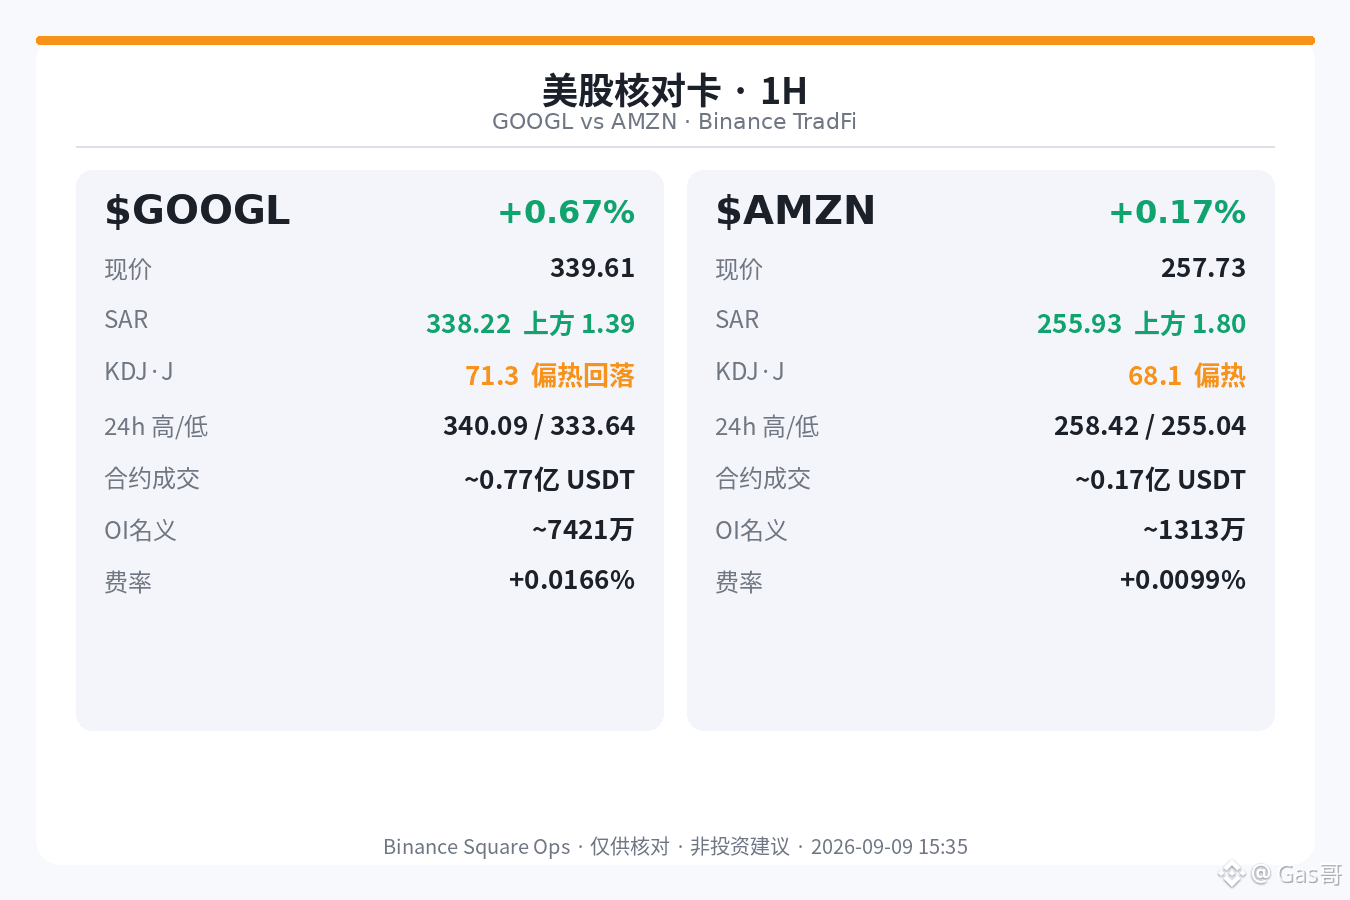
307
·
--
The daily line is still slightly red, about +0.4%. In the 1-hour momentum “J,” it has already pushed up to nearly 100—when it comes to full-throttle and the size of the up/down move, it’s often not the same ledger.
Single ticker $MSFT: Binance TradFi for the 1 hour—current price about 495.48, 24-hour about −0.41%, contract volume about 0.19 billion USDT. In the US stock segment, it’s not the loudest. The follow line (SAR) is around 491.62, with the price about 3.86 above it—short-term it’s still standing on the line, and the position is relatively strong. Momentum J is about 99.7 (K 89.9 / D 85.0), already extremely hot—like you’ve driven your foot through the floorboard. When it’s been “standing on the line + J≈87” alongside the previous round, it belongs to the same family—but this time, for the main ticker, you want the mismatch nailed down hard: “standing on the line” is a fact, “the daily line is slightly red” is a fact, and “J is extremely hot” is a fact. Don’t read “standing on the line” as “it still has room to chase,” and don’t read “slightly red” as “it has already weakened.” 24-hour high 498.09, low 490.64. Open interest about 344k contracts; in notional terms at mark price, about $17.06 million. Funding rate about +0.0142%. The position is still there—the structure is “standing on the line + extremely hot J + daily slightly red.”
News/funding checkable: Microsoft News Center / IR 2026-07-29 — For fiscal Q4 2026 (through 2026-06-30), revenue about $90 billion (YoY about +18%); Microsoft Cloud about $59.3 billion (YoY about +27%); Intelligent Cloud about $39.3 billion (YoY about +32%); Azure and other cloud services about +43% YoY; full-year Azure revenue first time exceeds $100 billion. Paid seats for Microsoft 365 Copilot exceed 30 million; commercial remaining performance obligations (cRPO) about $678 billion (YoY about +84%). Also: the quarter returned about $10.2 billion to shareholders (dividends + buybacks). The earnings explain the thickness of cloud and AI; they don’t explain whether you should keep pressing the accelerator on this 1-hour line.
What you see in the price increase—and the level of follow-through the market is willing to give—are often not the same thing.
The daily line is still slightly red, about +0.4%. In the 1-hour momentum “J,” it has already pushed up to nearly 100—when it comes to full-throttle and the size of the up/down move, it’s often not the same ledger.
Single ticker $MSFT : Binance TradFi for the 1 hour—current price about 495.48, 24-hour about −0.41%, contract volume about 0.19 billion USDT. In the US stock segment, it’s not the loudest. The follow line (SAR) is around 491.62, with the price about 3.86 above it—short-term it’s still standing on the line, and the position is relatively strong. Momentum J is about 99.7 (K 89.9 / D 85.0), already extremely hot—like you’ve driven your foot through the floorboard. When it’s been “standing on the line + J≈87” alongside the previous round, it belongs to the same family—but this time, for the main ticker, you want the mismatch nailed down hard: “standing on the line” is a fact, “the daily line is slightly red” is a fact, and “J is extremely hot” is a fact. Don’t read “standing on the line” as “it still has room to chase,” and don’t read “slightly red” as “it has already weakened.” 24-hour high 498.09, low 490.64. Open interest about 344k contracts; in notional terms at mark price, about $17.06 million. Funding rate about +0.0142%. The position is still there—the structure is “standing on the line + extremely hot J + daily slightly red.”
News/funding checkable: Microsoft News Center / IR 2026-07-29 — For fiscal Q4 2026 (through 2026-06-30), revenue about $90 billion (YoY about +18%); Microsoft Cloud about $59.3 billion (YoY about +27%); Intelligent Cloud about $39.3 billion (YoY about +32%); Azure and other cloud services about +43% YoY; full-year Azure revenue first time exceeds $100 billion. Paid seats for Microsoft 365 Copilot exceed 30 million; commercial remaining performance obligations (cRPO) about $678 billion (YoY about +84%). Also: the quarter returned about $10.2 billion to shareholders (dividends + buybacks). The earnings explain the thickness of cloud and AI; they don’t explain whether you should keep pressing the accelerator on this 1-hour line.
What you see in the price increase—and the level of follow-through the market is willing to give—are often not the same thing.
Single ticker $MSFT : Binance TradFi for the 1 hour—current price about 495.48, 24-hour about −0.41%, contract volume about 0.19 billion USDT. In the US stock segment, it’s not the loudest. The follow line (SAR) is around 491.62, with the price about 3.86 above it—short-term it’s still standing on the line, and the position is relatively strong. Momentum J is about 99.7 (K 89.9 / D 85.0), already extremely hot—like you’ve driven your foot through the floorboard. When it’s been “standing on the line + J≈87” alongside the previous round, it belongs to the same family—but this time, for the main ticker, you want the mismatch nailed down hard: “standing on the line” is a fact, “the daily line is slightly red” is a fact, and “J is extremely hot” is a fact. Don’t read “standing on the line” as “it still has room to chase,” and don’t read “slightly red” as “it has already weakened.” 24-hour high 498.09, low 490.64. Open interest about 344k contracts; in notional terms at mark price, about $17.06 million. Funding rate about +0.0142%. The position is still there—the structure is “standing on the line + extremely hot J + daily slightly red.”
News/funding checkable: Microsoft News Center / IR 2026-07-29 — For fiscal Q4 2026 (through 2026-06-30), revenue about $90 billion (YoY about +18%); Microsoft Cloud about $59.3 billion (YoY about +27%); Intelligent Cloud about $39.3 billion (YoY about +32%); Azure and other cloud services about +43% YoY; full-year Azure revenue first time exceeds $100 billion. Paid seats for Microsoft 365 Copilot exceed 30 million; commercial remaining performance obligations (cRPO) about $678 billion (YoY about +84%). Also: the quarter returned about $10.2 billion to shareholders (dividends + buybacks). The earnings explain the thickness of cloud and AI; they don’t explain whether you should keep pressing the accelerator on this 1-hour line.
What you see in the price increase—and the level of follow-through the market is willing to give—are often not the same thing.
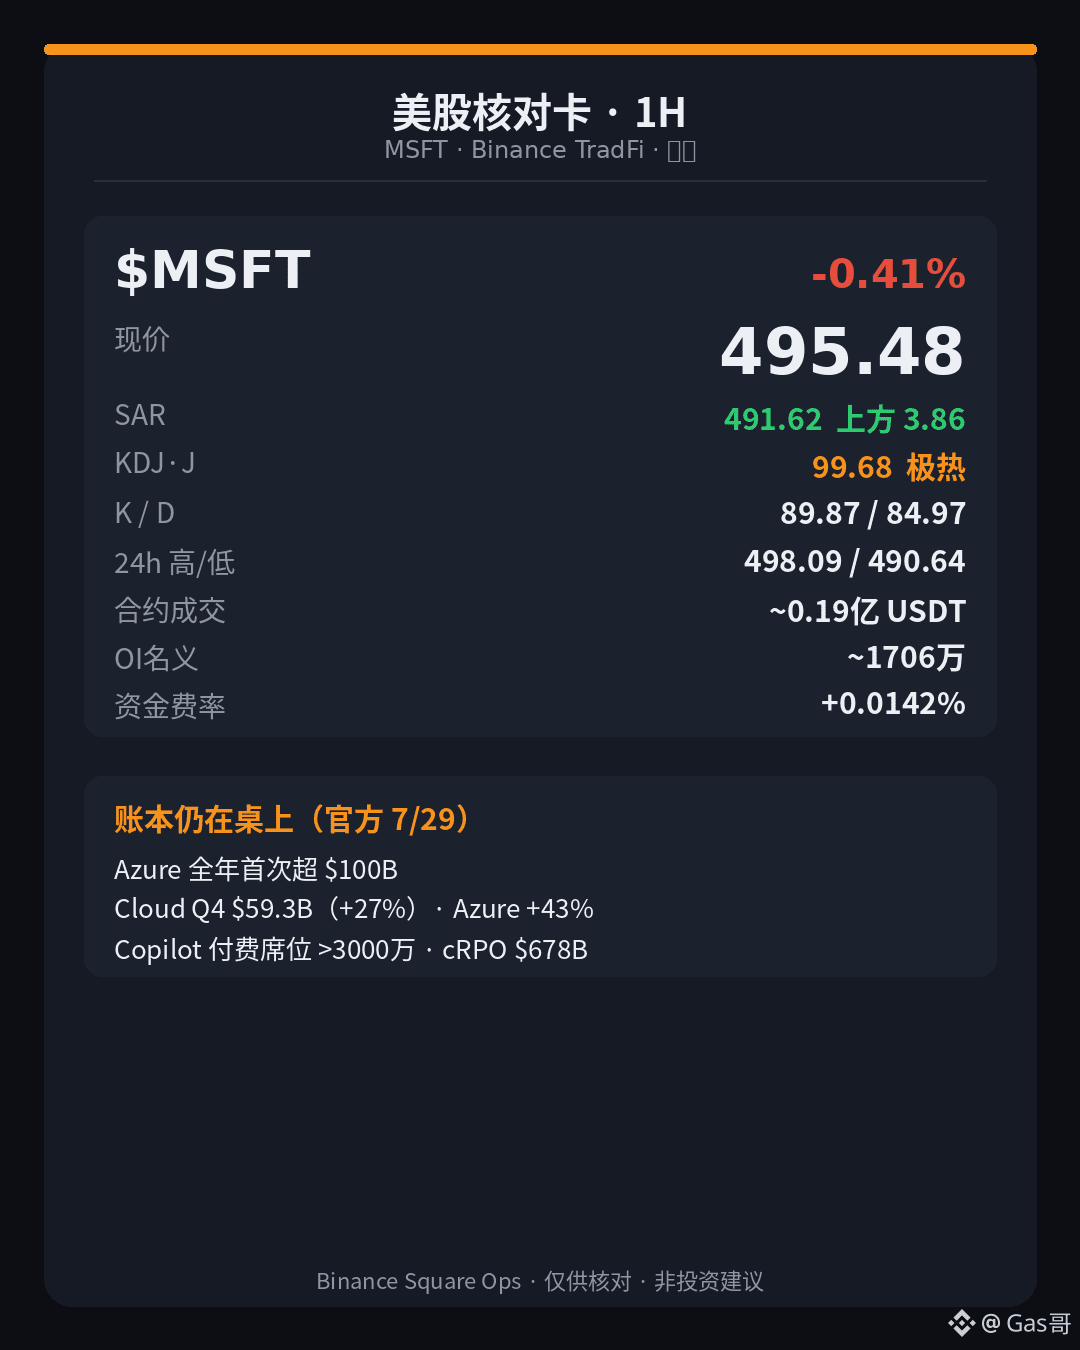
13
·
--
Unlock day ≠ dump day—being sellable doesn’t mean it has already been sold. What’s noisy on the board today is the supply calendar, and the 1-hour chart is keeping a different set of books.
Main chart $SPCX: Binance TradFi 1 hour, current price around 153.03, up about +2.58% over 24 hours. The SAR (follow line) is around 149.27; the price is roughly 3.76 above it—so in the short term it’s still holding above the follow line. Momentum J is about 35.85 (K43.3 / D47.1), rather cold—like the accelerator wasn’t pushed hard; it doesn’t look like chasing. 24-hour high 154.77, low 145.25; contract volume around 990 million USDT, open interest around 2.87 million contracts; nominal value by mark price about $439 million; funding rate about −0.0004%.
In the same window an hour ago, the supporting cross-section was still “standing on the line + cold J”; now from the main chart perspective it’s still “standing on the line with cold momentum,” but the cross-section has changed to “9/9 unlock-day supply story vs. the 1-hour chart not breaking the line.” Green candles explain sentiment, and that doesn’t automatically mean unlock pressure has already cashed out into a dump.
Two supporting comparisons (all belong to the same US mega-cap group; no WIF/BONK/LAB):
$MSFT about 494.98 (−0.40%), about 3.61 above SAR around 491.37, J about 86.9—rather hot; volume about 0.19 billion. The daily is slightly green, but the 1-hour is “standing on the line + hot J.”
$GOOGL about 339.56 (+0.54%), about 1.72 above SAR around 337.84, J about 85.0—also rather hot; volume about 0.79 billion. Also “standing on the line, slightly hot.”
All three in the same window: SPCX has the biggest volume scale, but the coldest momentum; the two mega-caps have different daily gains/losses, yet both have 1-hour momentum leaning hot. Don’t mash “space stock unlock” and “tech stock momentum” into one sentence.
News/flow you can verify: FinanceFeeds (updated 2026-09-02) and TipRanks (2026-09-08)—about 319 million shares of SPCX unlock and become sellable on 9/9 (daily bucket 90); the next day about 59 million shares in related-party buckets; sellable ≠ forced selling. Previously on 8/6, about 911.5 million shares unlocked; the day it unlocked rose about 6.14%, and the next day rose again about 15.83%. On 8/20, at the same order of magnitude (about 319 million shares unlocked), the unlocked day fell about 4.05%. So historically, both sides exist—can’t tell the story one-sidedly. TipRanks on the same day also noted that Pivotal Research gave a Buy rating with a target price around $220 (analyst framing, not an on-screen instruction).
The supply calendar is one event; the 1-hour structure of “standing on SAR + cold J” is another. Put the two side by side—don’t fuse them into “unlock day must dump,” or “it’s green so everything is digested.”
SAR and J have already spoken; whether price should follow the unlock narrative is a separate question.
Unlock day ≠ dump day—being sellable doesn’t mean it has already been sold. What’s noisy on the board today is the supply calendar, and the 1-hour chart is keeping a different set of books.
Main chart $SPCX : Binance TradFi 1 hour, current price around 153.03, up about +2.58% over 24 hours. The SAR (follow line) is around 149.27; the price is roughly 3.76 above it—so in the short term it’s still holding above the follow line. Momentum J is about 35.85 (K43.3 / D47.1), rather cold—like the accelerator wasn’t pushed hard; it doesn’t look like chasing. 24-hour high 154.77, low 145.25; contract volume around 990 million USDT, open interest around 2.87 million contracts; nominal value by mark price about $439 million; funding rate about −0.0004%.
In the same window an hour ago, the supporting cross-section was still “standing on the line + cold J”; now from the main chart perspective it’s still “standing on the line with cold momentum,” but the cross-section has changed to “9/9 unlock-day supply story vs. the 1-hour chart not breaking the line.” Green candles explain sentiment, and that doesn’t automatically mean unlock pressure has already cashed out into a dump.
Two supporting comparisons (all belong to the same US mega-cap group; no WIF/BONK/LAB):
$MSFT about 494.98 (−0.40%), about 3.61 above SAR around 491.37, J about 86.9—rather hot; volume about 0.19 billion. The daily is slightly green, but the 1-hour is “standing on the line + hot J.”
$GOOGL about 339.56 (+0.54%), about 1.72 above SAR around 337.84, J about 85.0—also rather hot; volume about 0.79 billion. Also “standing on the line, slightly hot.”
All three in the same window: SPCX has the biggest volume scale, but the coldest momentum; the two mega-caps have different daily gains/losses, yet both have 1-hour momentum leaning hot. Don’t mash “space stock unlock” and “tech stock momentum” into one sentence.
News/flow you can verify: FinanceFeeds (updated 2026-09-02) and TipRanks (2026-09-08)—about 319 million shares of SPCX unlock and become sellable on 9/9 (daily bucket 90); the next day about 59 million shares in related-party buckets; sellable ≠ forced selling. Previously on 8/6, about 911.5 million shares unlocked; the day it unlocked rose about 6.14%, and the next day rose again about 15.83%. On 8/20, at the same order of magnitude (about 319 million shares unlocked), the unlocked day fell about 4.05%. So historically, both sides exist—can’t tell the story one-sidedly. TipRanks on the same day also noted that Pivotal Research gave a Buy rating with a target price around $220 (analyst framing, not an on-screen instruction).
The supply calendar is one event; the 1-hour structure of “standing on SAR + cold J” is another. Put the two side by side—don’t fuse them into “unlock day must dump,” or “it’s green so everything is digested.”
SAR and J have already spoken; whether price should follow the unlock narrative is a separate question.
Main chart $SPCX : Binance TradFi 1 hour, current price around 153.03, up about +2.58% over 24 hours. The SAR (follow line) is around 149.27; the price is roughly 3.76 above it—so in the short term it’s still holding above the follow line. Momentum J is about 35.85 (K43.3 / D47.1), rather cold—like the accelerator wasn’t pushed hard; it doesn’t look like chasing. 24-hour high 154.77, low 145.25; contract volume around 990 million USDT, open interest around 2.87 million contracts; nominal value by mark price about $439 million; funding rate about −0.0004%.
In the same window an hour ago, the supporting cross-section was still “standing on the line + cold J”; now from the main chart perspective it’s still “standing on the line with cold momentum,” but the cross-section has changed to “9/9 unlock-day supply story vs. the 1-hour chart not breaking the line.” Green candles explain sentiment, and that doesn’t automatically mean unlock pressure has already cashed out into a dump.
Two supporting comparisons (all belong to the same US mega-cap group; no WIF/BONK/LAB):
$MSFT about 494.98 (−0.40%), about 3.61 above SAR around 491.37, J about 86.9—rather hot; volume about 0.19 billion. The daily is slightly green, but the 1-hour is “standing on the line + hot J.”
$GOOGL about 339.56 (+0.54%), about 1.72 above SAR around 337.84, J about 85.0—also rather hot; volume about 0.79 billion. Also “standing on the line, slightly hot.”
All three in the same window: SPCX has the biggest volume scale, but the coldest momentum; the two mega-caps have different daily gains/losses, yet both have 1-hour momentum leaning hot. Don’t mash “space stock unlock” and “tech stock momentum” into one sentence.
News/flow you can verify: FinanceFeeds (updated 2026-09-02) and TipRanks (2026-09-08)—about 319 million shares of SPCX unlock and become sellable on 9/9 (daily bucket 90); the next day about 59 million shares in related-party buckets; sellable ≠ forced selling. Previously on 8/6, about 911.5 million shares unlocked; the day it unlocked rose about 6.14%, and the next day rose again about 15.83%. On 8/20, at the same order of magnitude (about 319 million shares unlocked), the unlocked day fell about 4.05%. So historically, both sides exist—can’t tell the story one-sidedly. TipRanks on the same day also noted that Pivotal Research gave a Buy rating with a target price around $220 (analyst framing, not an on-screen instruction).
The supply calendar is one event; the 1-hour structure of “standing on SAR + cold J” is another. Put the two side by side—don’t fuse them into “unlock day must dump,” or “it’s green so everything is digested.”
SAR and J have already spoken; whether price should follow the unlock narrative is a separate question.
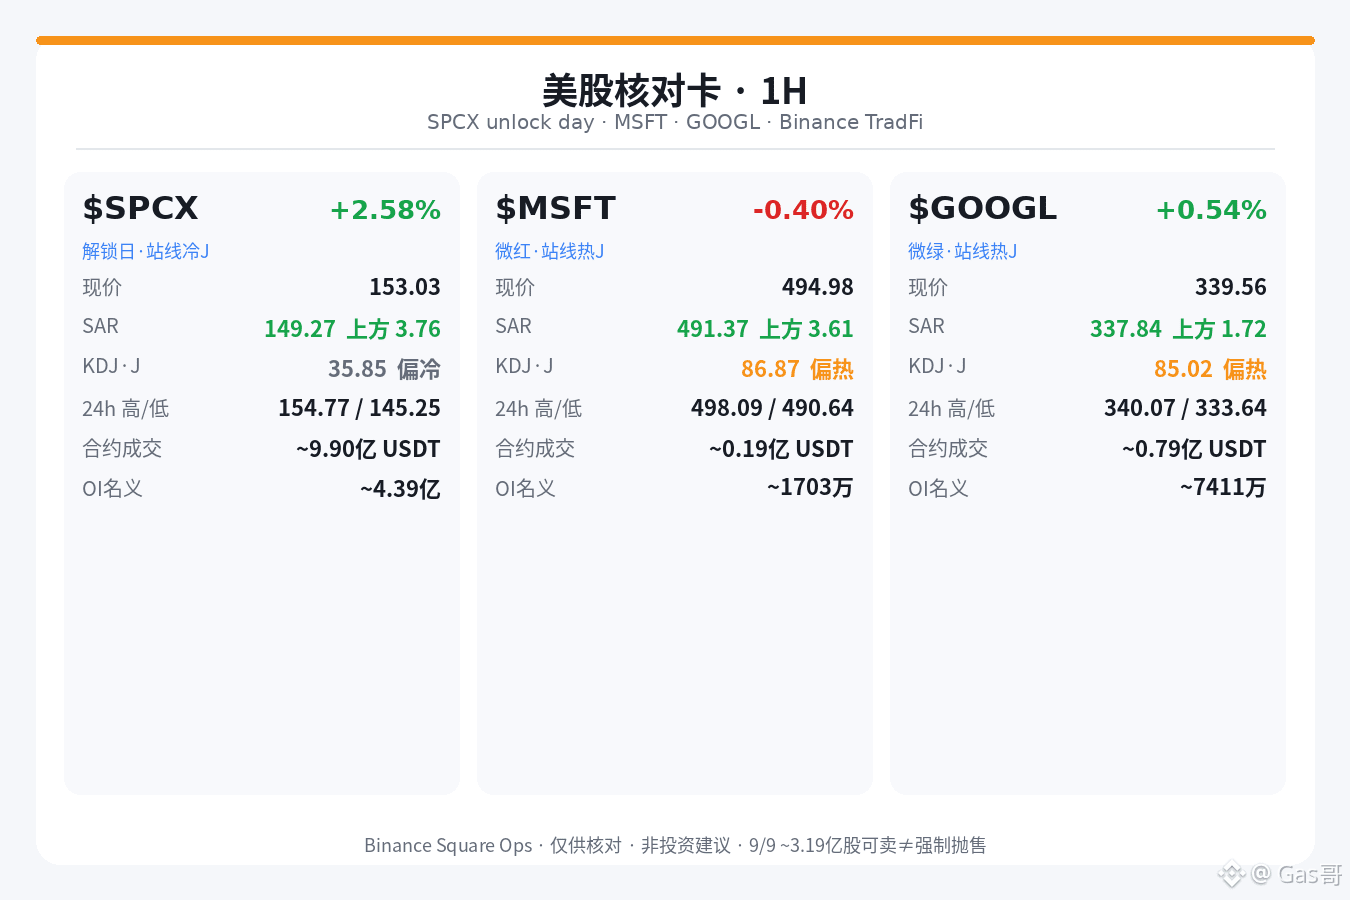
297
Log in to explore more content
Join global crypto users on Binance Square
⚡️ Get latest and useful information about crypto.
💬 Trusted by the world’s largest crypto exchange.
👍 Discover real insights from verified creators.
Email / Phone number
Trending Topics
AppleDebutsFoldablePhone
1,870 views
90 Discussing
#appledebutsfoldablephone I Got My Hands on the iPhone Duo, Apple’s First Foldable Phone. Here’s What Stands Out
The palm-size phone is Apple's boldest handset in years, with a 5.4-inch cover screen and a 7.6-inch main display. I spent some time with the Duo before its October launch.It’s finally here: Apple on Wednesday unveiled its first foldable iPhone, called the iPhone Duo.
iPhone Duo design and build
The iPhone Duo is compact, with a passport-size design. It has a 7.6-inch display on the inside and a 5.4-inch outer display. It fits squarely in my palm, with dimensions similar to Samsung’s Galaxy Z Fold 8, which has a 7.6-inch inner display and a 5.5-inch cover display.
Apple says the Duo is the thinnest iPhone ever when open, measuring 5.2mm. It’s 11.3mm thick when closed. A titanium frame keeps it lightweight at 254 grams.
One of the key differences in feel between Apple’s and Samsung’s phones is that the iPhone Duo has a matte, nano-textured finish on the inner display, which reduces the phone’s crease while also curbing reflections. It has a satisfying feel and really makes the crease virtually disappear when the screen is on. I find it even harder to notice than the Z Fold 8’s, which also has an anti-reflective display.$ONG $IMX $TAC
Isabella-I
·2 Likes
·339 views
US10YTreasuryYieldHitsHighestSinceNov2023
6,515 views
151 Discussing
USTreasuryToBuyBackUpTo$6BLongDatedDebt
9,200 views
129 Discussing