
云享掌门观澜
322 Posts

云享掌门观澜
Report
Block User
100K Following
10.8K+ Followers
1.1K+ Liked
Posts
All
Quotes
Live
·
--
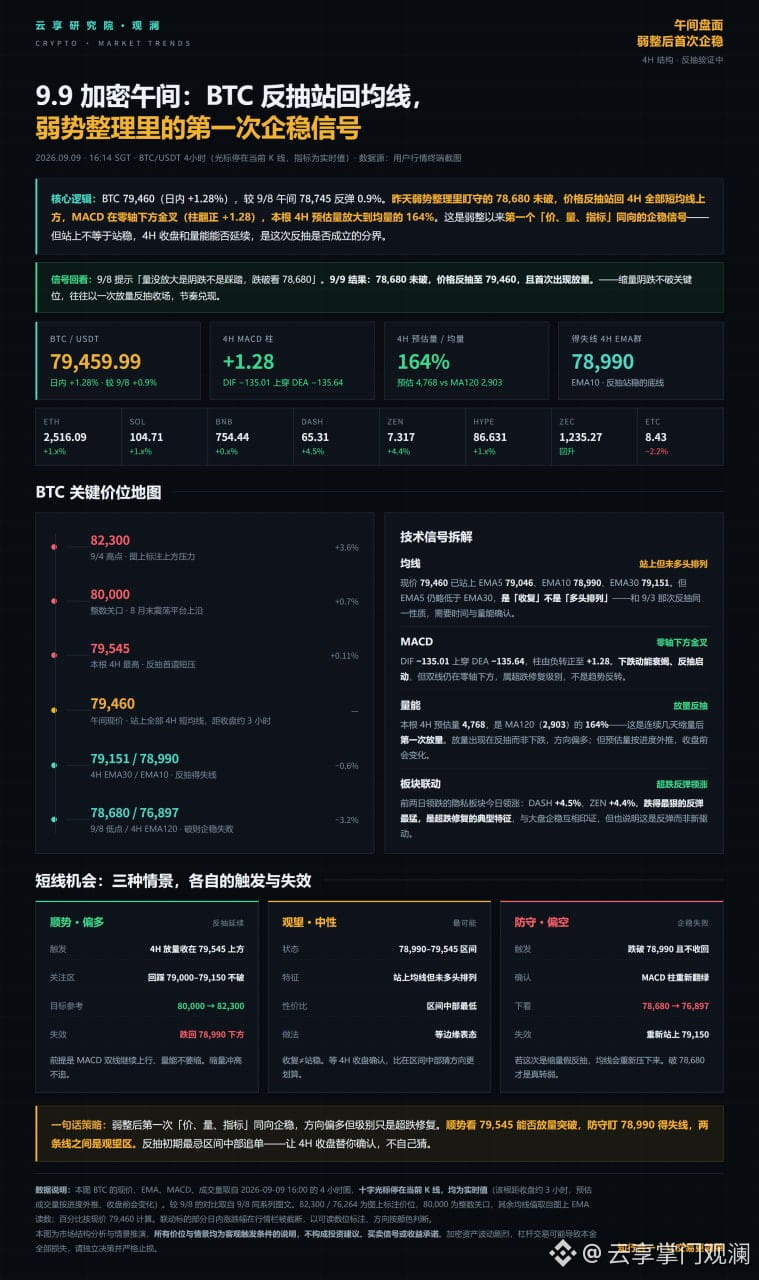
BTC 79,460(+1.28%)— the first stabilization signal after a weak consolidation.
On 9/8, I said “break below 78,680 to watch.” Today it didn’t break; instead, it pulled back with increased volume and reclaimed the moving average.
· MACD forms a golden cross below the zero line; the histogram flips positive +1.28
· 4H projected volume is 164% of average volume; after consecutive volume contraction, this is the first time volume expands
· DASH/ZEN, which led the decline in the previous two days, is today leading the gain at +4.5%/+4.4%
Follow the trend and watch whether 79,545 can break out on increased volume. For defense, keep an eye on 78,990. The middle zone is a wait-and-see area.
$BTC
BTC 79,460(+1.28%)— the first stabilization signal after a weak consolidation.
On 9/8, I said “break below 78,680 to watch.” Today it didn’t break; instead, it pulled back with increased volume and reclaimed the moving average.
· MACD forms a golden cross below the zero line; the histogram flips positive +1.28
· 4H projected volume is 164% of average volume; after consecutive volume contraction, this is the first time volume expands
· DASH/ZEN, which led the decline in the previous two days, is today leading the gain at +4.5%/+4.4%
Follow the trend and watch whether 79,545 can break out on increased volume. For defense, keep an eye on 78,990. The middle zone is a wait-and-see area.
$BTC
On 9/8, I said “break below 78,680 to watch.” Today it didn’t break; instead, it pulled back with increased volume and reclaimed the moving average.
· MACD forms a golden cross below the zero line; the histogram flips positive +1.28
· 4H projected volume is 164% of average volume; after consecutive volume contraction, this is the first time volume expands
· DASH/ZEN, which led the decline in the previous two days, is today leading the gain at +4.5%/+4.4%
Follow the trend and watch whether 79,545 can break out on increased volume. For defense, keep an eye on 78,990. The middle zone is a wait-and-see area.
$BTC
1
209
·
--
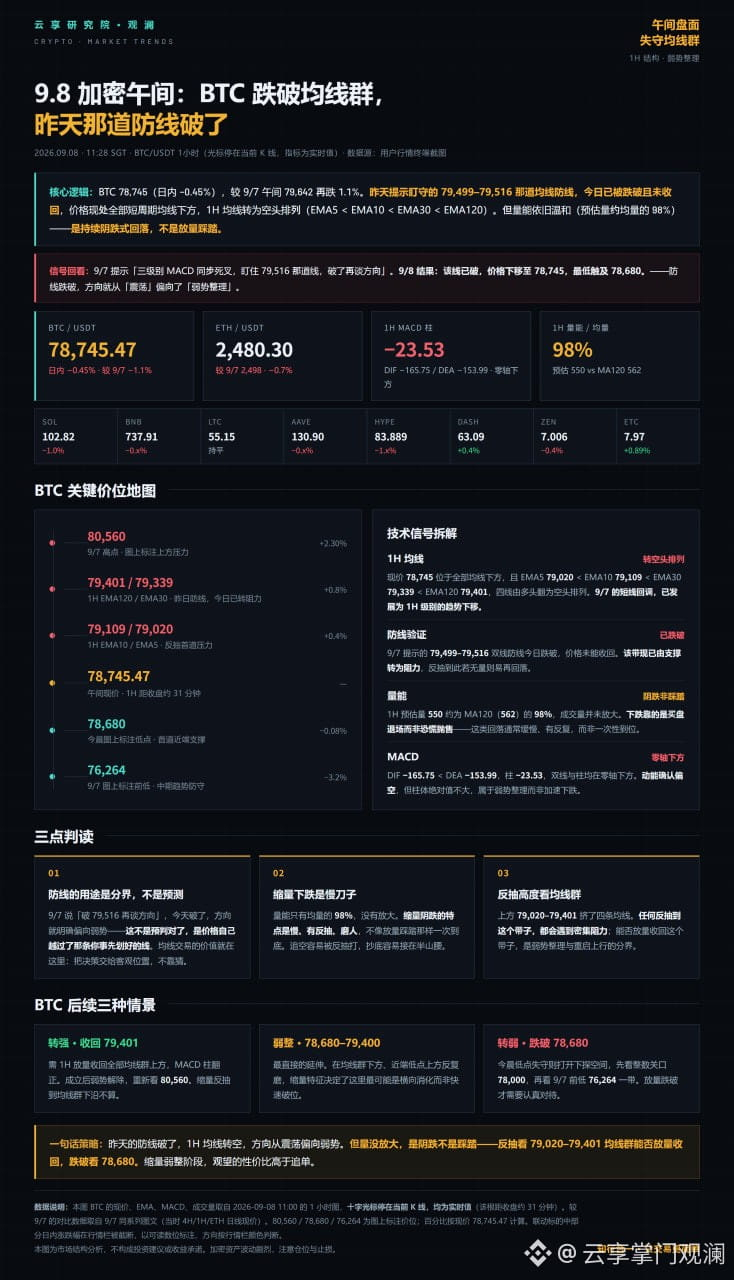
BTC 78,745, the defensive line from yesterday has broken.
On 9/7, I said to watch 79,516—the moving average defense line. Only after it breaks would we talk about the direction. Today it broke below and has not been reclaimed.
Right now on the 1H chart, all four moving averages are aligned bearishly, with price below them.
But volume is only 98% of the average volume, not amplified—this is a slow bleed, not a stampede.
For a rebound, watch whether the 79,020–79,401 moving-average cluster can reclaim with increased volume. If it breaks down again, look at 78,680.
$BTC
BTC 78,745, the defensive line from yesterday has broken.
On 9/7, I said to watch 79,516—the moving average defense line. Only after it breaks would we talk about the direction. Today it broke below and has not been reclaimed.
Right now on the 1H chart, all four moving averages are aligned bearishly, with price below them.
But volume is only 98% of the average volume, not amplified—this is a slow bleed, not a stampede.
For a rebound, watch whether the 79,020–79,401 moving-average cluster can reclaim with increased volume. If it breaks down again, look at 78,680.
$BTC
On 9/7, I said to watch 79,516—the moving average defense line. Only after it breaks would we talk about the direction. Today it broke below and has not been reclaimed.
Right now on the 1H chart, all four moving averages are aligned bearishly, with price below them.
But volume is only 98% of the average volume, not amplified—this is a slow bleed, not a stampede.
For a rebound, watch whether the 79,020–79,401 moving-average cluster can reclaim with increased volume. If it breaks down again, look at 78,680.
$BTC
1
261
·
--
Friday’s CPI: how to read it matters more than what it reads.
A lot of people watch the headline number, but what really drives crypto is never CPI itself — it’s the gap between the data and market expectations.
Right now, prices are built on the assumption of “imminent easing.” So:
· Below expectations → reinforces rate-cut bets, risk assets move with it — but part of that upside has already been priced in, so the follow-through may not be huge
· In line with expectations → keeps the suspense for 9/16 FOMC, with a high chance of range-bound trading and lower volume while waiting for the other shoe to drop
· Above expectations → the most painful outcome; positions that front-ran the move will also front-run the exit, with high-beta altcoins hit first
Among the three scenarios, the market is least prepared for the third — because the past two months of gains were, in essence, a bet that it wouldn’t happen.
So before CPI, instead of guessing the number, ask yourself this first: if it’s the third scenario, can your position hold up?
The data is only the trigger; your position is the only thing you can decide in advance.
For market observation only, not investment advice.
#CPI #FederalReserve #BTC #Crypto
Friday’s CPI: how to read it matters more than what it reads.
A lot of people watch the headline number, but what really drives crypto is never CPI itself — it’s the gap between the data and market expectations.
Right now, prices are built on the assumption of “imminent easing.” So:
· Below expectations → reinforces rate-cut bets, risk assets move with it — but part of that upside has already been priced in, so the follow-through may not be huge
· In line with expectations → keeps the suspense for 9/16 FOMC, with a high chance of range-bound trading and lower volume while waiting for the other shoe to drop
· Above expectations → the most painful outcome; positions that front-ran the move will also front-run the exit, with high-beta altcoins hit first
Among the three scenarios, the market is least prepared for the third — because the past two months of gains were, in essence, a bet that it wouldn’t happen.
So before CPI, instead of guessing the number, ask yourself this first: if it’s the third scenario, can your position hold up?
The data is only the trigger; your position is the only thing you can decide in advance.
For market observation only, not investment advice.
#CPI #FederalReserve #BTC #Crypto
A lot of people watch the headline number, but what really drives crypto is never CPI itself — it’s the gap between the data and market expectations.
Right now, prices are built on the assumption of “imminent easing.” So:
· Below expectations → reinforces rate-cut bets, risk assets move with it — but part of that upside has already been priced in, so the follow-through may not be huge
· In line with expectations → keeps the suspense for 9/16 FOMC, with a high chance of range-bound trading and lower volume while waiting for the other shoe to drop
· Above expectations → the most painful outcome; positions that front-ran the move will also front-run the exit, with high-beta altcoins hit first
Among the three scenarios, the market is least prepared for the third — because the past two months of gains were, in essence, a bet that it wouldn’t happen.
So before CPI, instead of guessing the number, ask yourself this first: if it’s the third scenario, can your position hold up?
The data is only the trigger; your position is the only thing you can decide in advance.
For market observation only, not investment advice.
#CPI #FederalReserve #BTC #Crypto
181
·
--
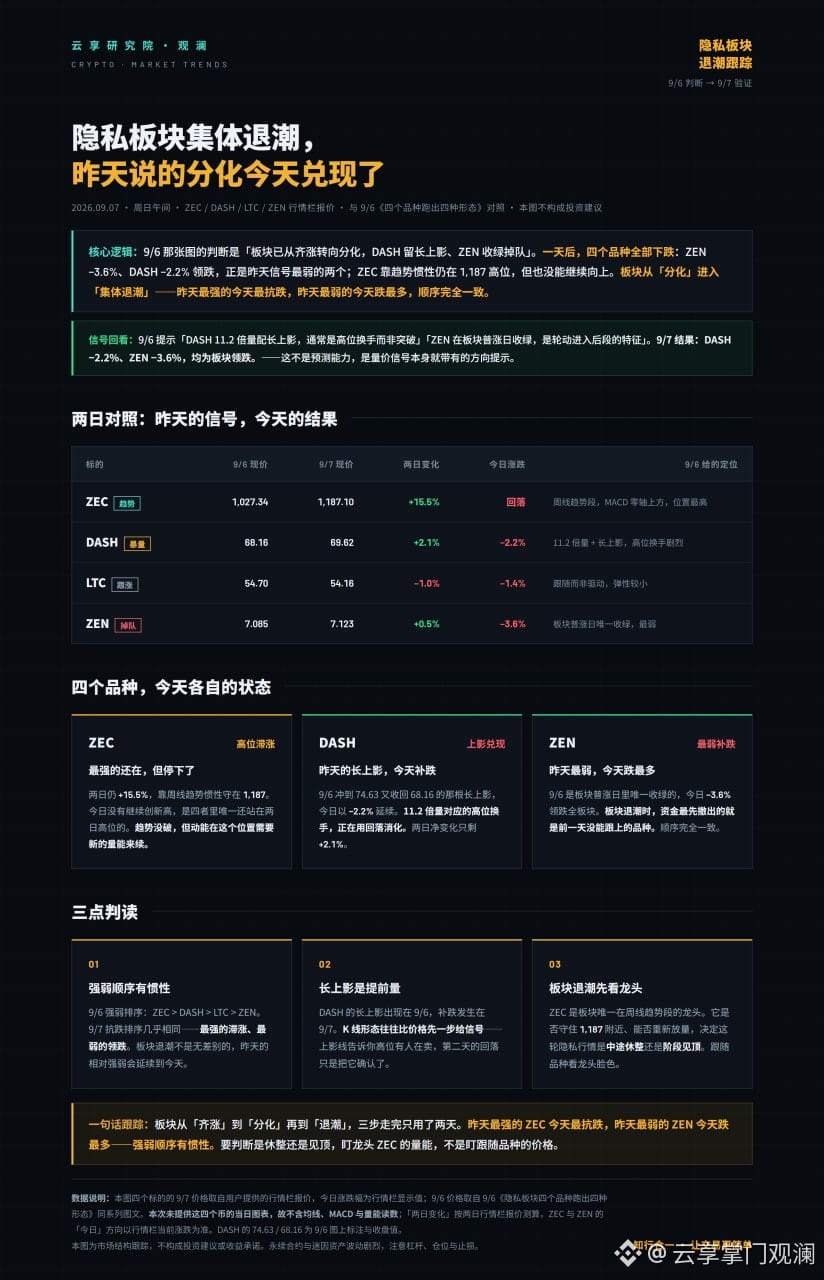
ZEC is the only leader in this sector that is still in the weekly trend phase. Whether it can hold near 1,187 and whether it can regain volume will determine whether this wave of privacy-sector action is merely a mid-cycle pause or has already peaked. The follow-on names (DASH / LTC / ZEN) are taking their cues from the leader, not moving independently.
In one sentence: the sector went from "rising together" to "diverging" and then to "fading," and it took only two days to go through all three stages. To judge the next move, watch the trading volume of the leader ZEC, not the prices of the follow-on names.
The above is market-structure tracking and does not constitute investment advice or a promise of returns. Perpetual contracts and meme assets are highly volatile; pay attention to leverage, position sizing, and stop-losses.
#ZEC #DASH #隐私币 #技术分析 $ZEC $DASH
ZEC is the only leader in this sector that is still in the weekly trend phase. Whether it can hold near 1,187 and whether it can regain volume will determine whether this wave of privacy-sector action is merely a mid-cycle pause or has already peaked. The follow-on names (DASH / LTC / ZEN) are taking their cues from the leader, not moving independently.
In one sentence: the sector went from "rising together" to "diverging" and then to "fading," and it took only two days to go through all three stages. To judge the next move, watch the trading volume of the leader ZEC, not the prices of the follow-on names.
The above is market-structure tracking and does not constitute investment advice or a promise of returns. Perpetual contracts and meme assets are highly volatile; pay attention to leverage, position sizing, and stop-losses.
#ZEC #DASH #隐私币 #技术分析 $ZEC $DASH
In one sentence: the sector went from "rising together" to "diverging" and then to "fading," and it took only two days to go through all three stages. To judge the next move, watch the trading volume of the leader ZEC, not the prices of the follow-on names.
The above is market-structure tracking and does not constitute investment advice or a promise of returns. Perpetual contracts and meme assets are highly volatile; pay attention to leverage, position sizing, and stop-losses.
#ZEC #DASH #隐私币 #技术分析 $ZEC $DASH
1
696
·
--
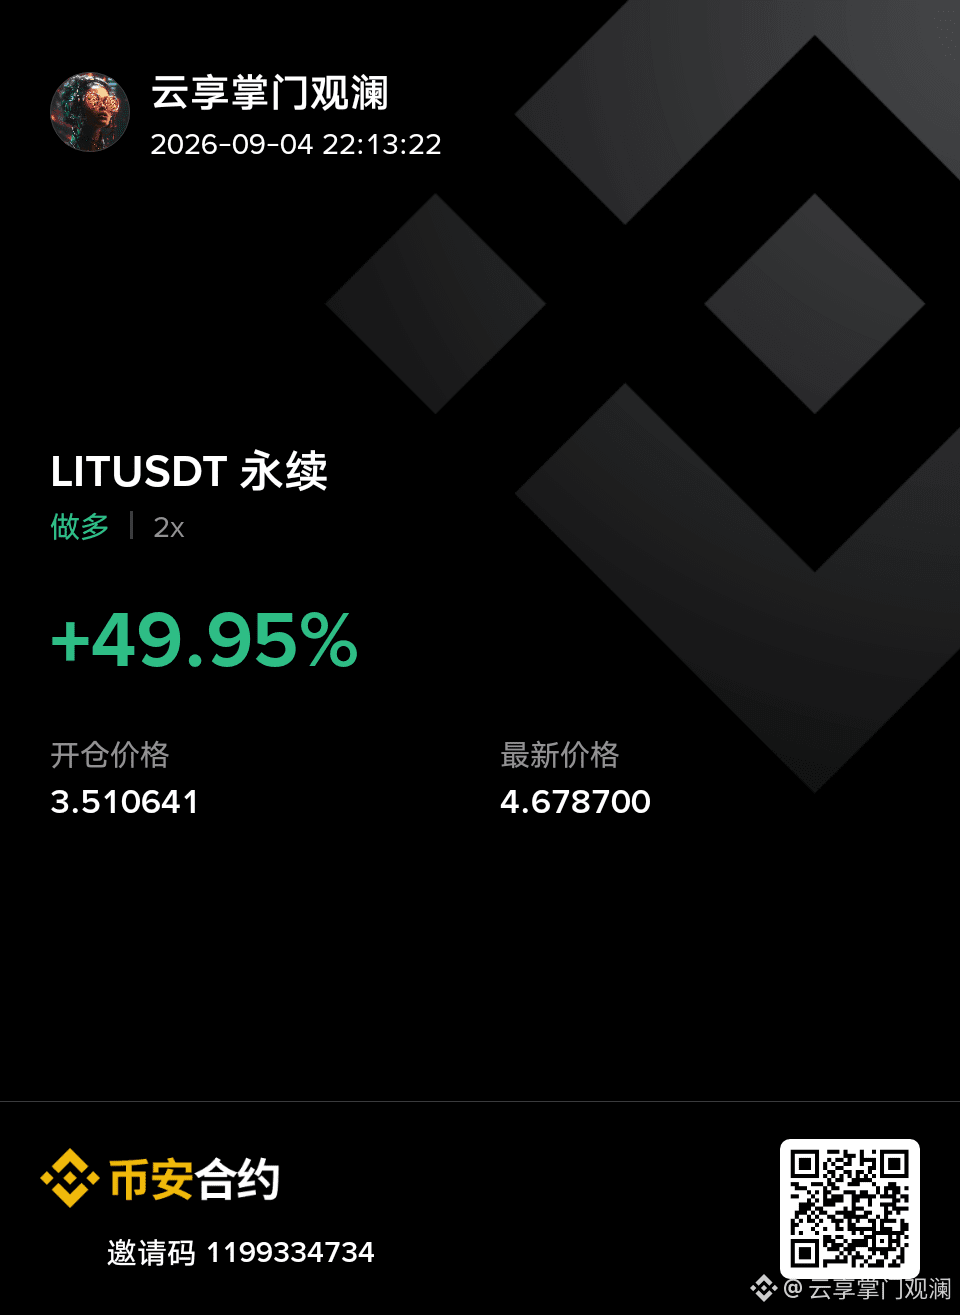
Counterfeits are suitable for opening at 2x, the main thing is stability. $LIT
{future}(LITUSDT)
Counterfeits are suitable for opening at 2x, the main thing is stability. $LIT
604
·
--
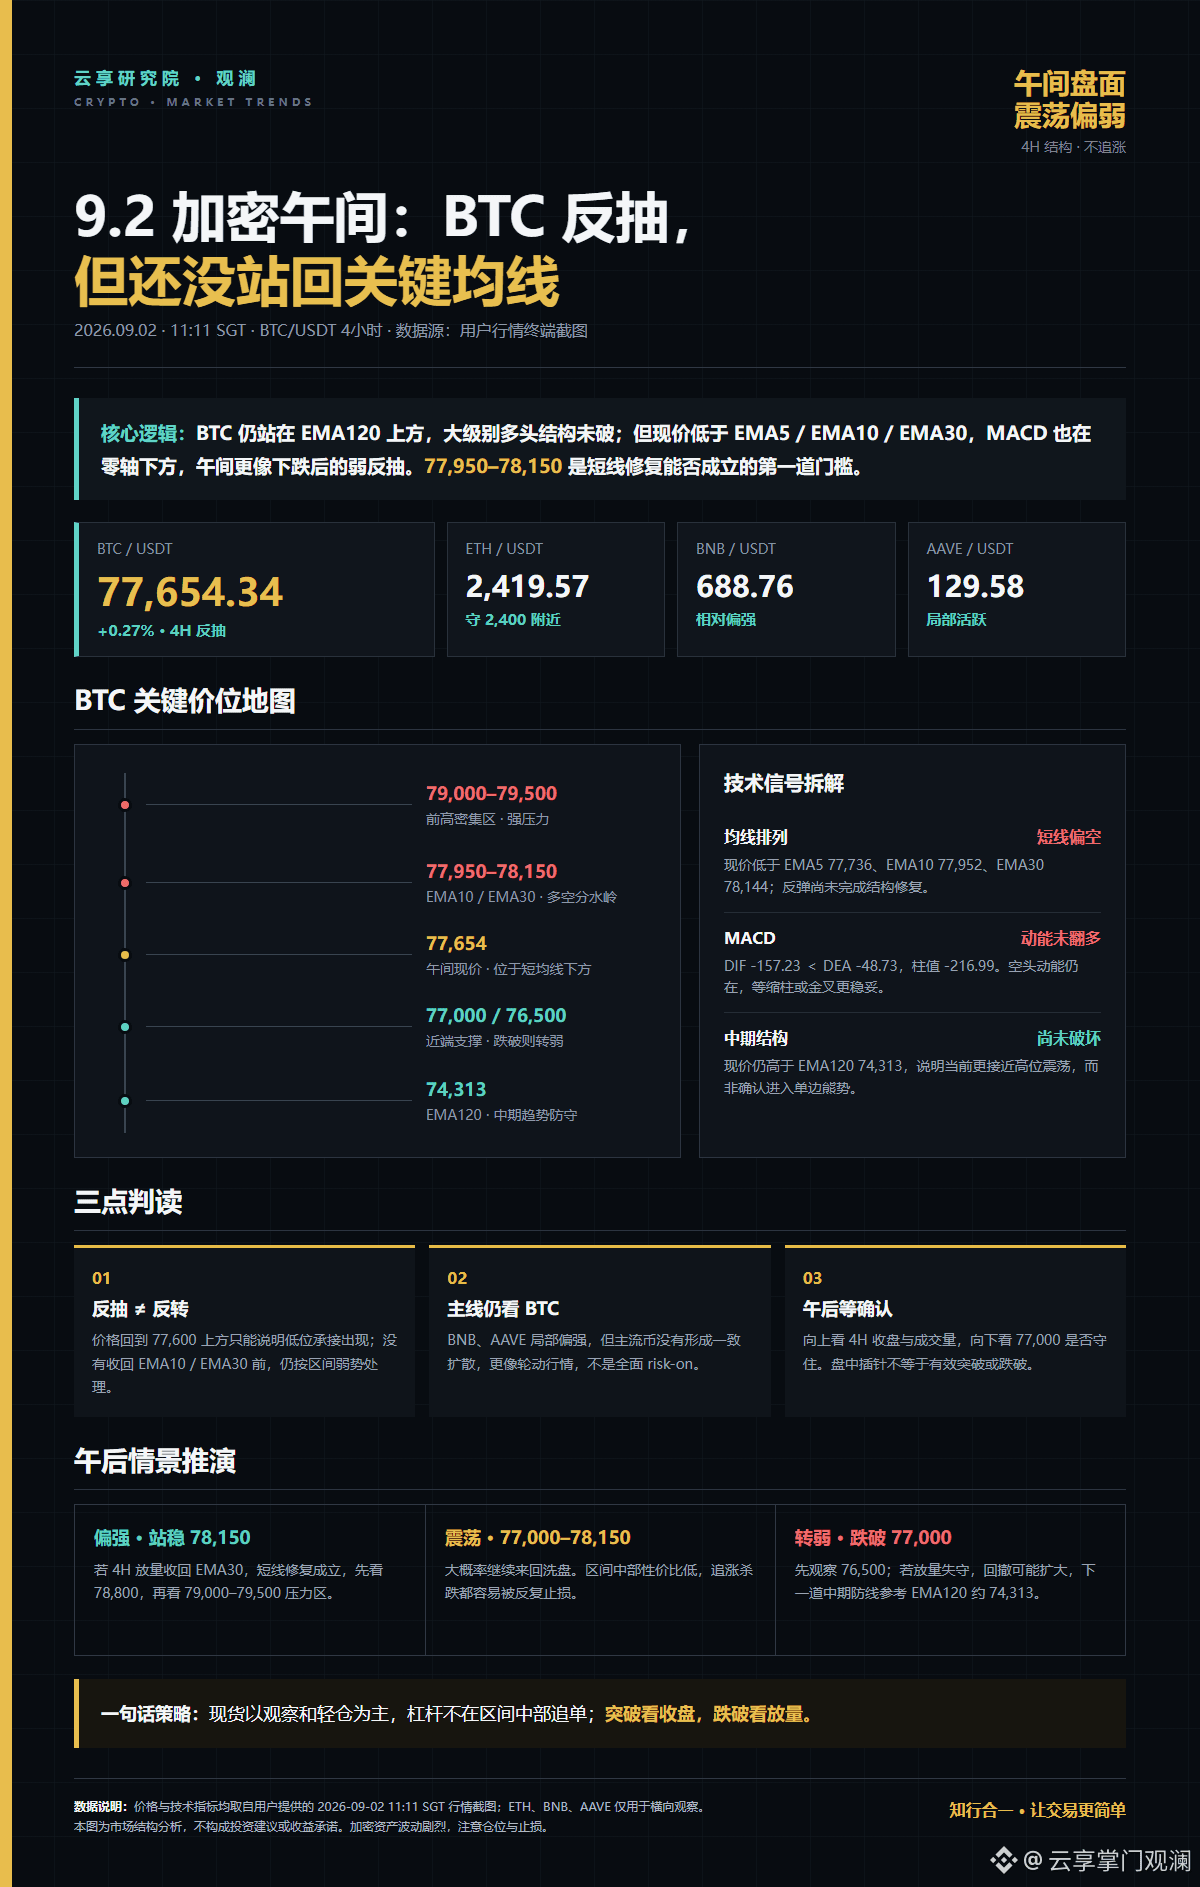
9.2 Encryption Lunchtime: BTC rebound, but it hasn’t reclaimed the key moving averages yet. Current price is about 77,654, still below the EMA5/10/30, and MACD bearish momentum hasn’t turned bullish; however, price remains above the EMA120, so the intermediate structure hasn’t been broken yet. Key for the afternoon: • Hold above 78,150: look for 78,800—79,500 • Break below 77,000: look for 76,500 • Medium-term support: 74,313. A rebound ≠ a reversal; confirm with the close for breakouts, and for breakdowns watch for increased volume. For market observation only, not investment advice. #BTC #Bitcoin
9.2 Encryption Lunchtime: BTC rebound, but it hasn’t reclaimed the key moving averages yet. Current price is about 77,654, still below the EMA5/10/30, and MACD bearish momentum hasn’t turned bullish; however, price remains above the EMA120, so the intermediate structure hasn’t been broken yet. Key for the afternoon: • Hold above 78,150: look for 78,800—79,500 • Break below 77,000: look for 76,500 • Medium-term support: 74,313. A rebound ≠ a reversal; confirm with the close for breakouts, and for breakdowns watch for increased volume. For market observation only, not investment advice. #BTC #Bitcoin
365
·
--
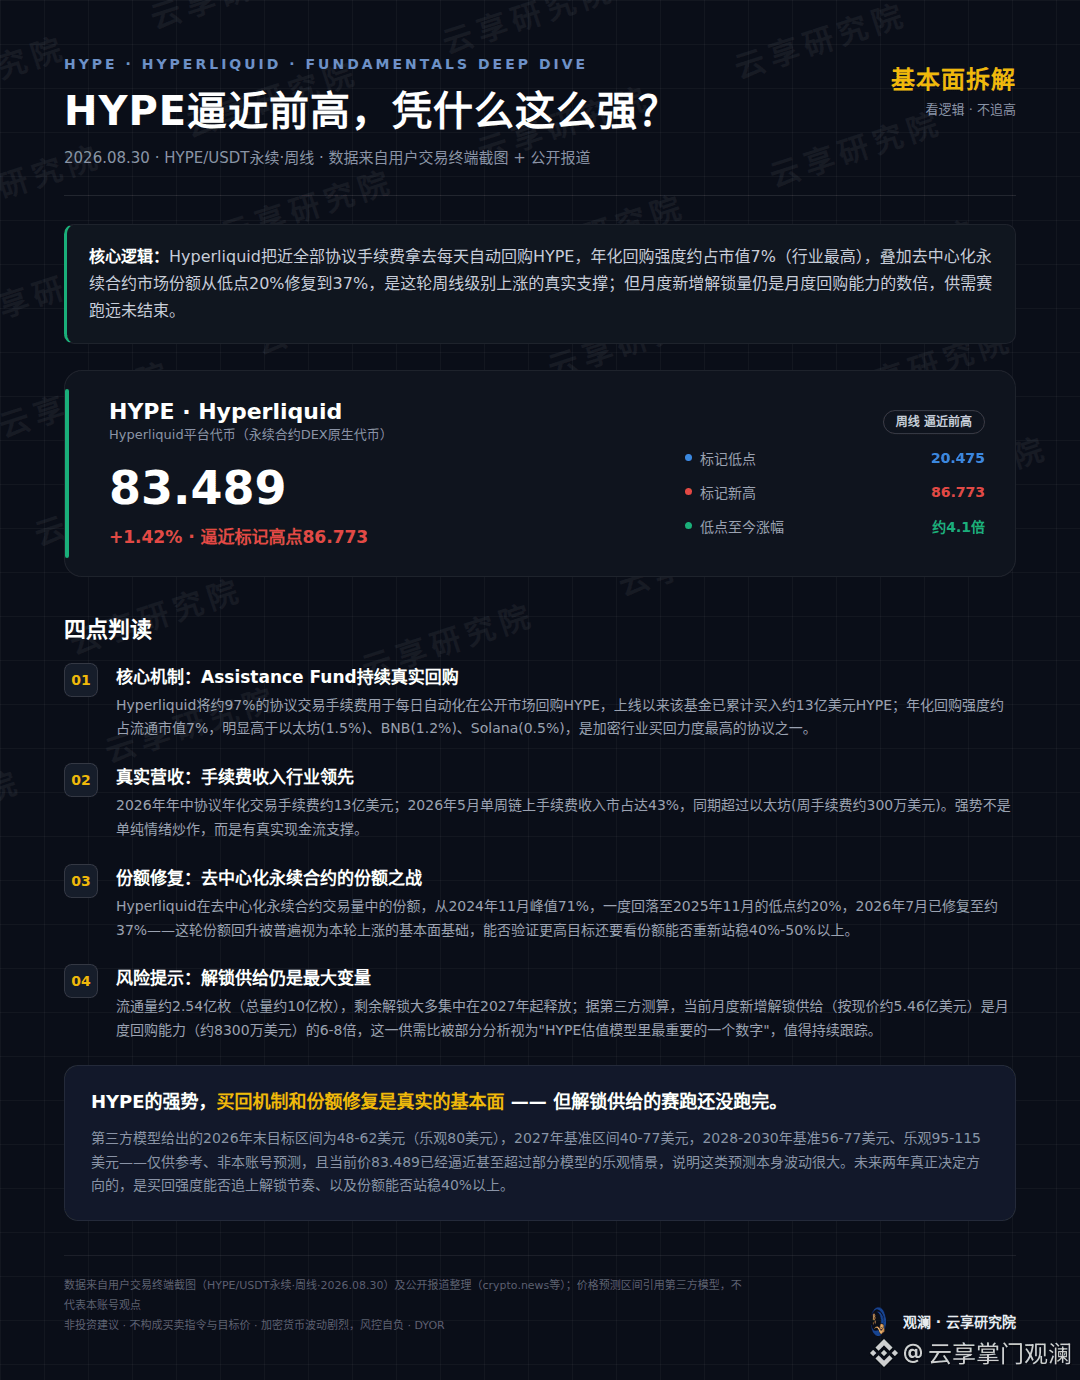
#HYPE Weekly chart nearing the previous high at 86.7—this isn’t just a pure emotion-led pump. Assistance Fund has put nearly 97% of the agreed protocol fees into daily automated buybacks; the annualized buyback intensity is about 7% of market cap, the highest in the industry. The share of DEX perpetual futures has also been repaired from the 20% low to 37%. But the monthly unlock volume is still 6–8 times the monthly buyback capacity—this supply-demand race has only just begun. Do you think the shares can hold above 40%?
#HYPE Weekly chart nearing the previous high at 86.7—this isn’t just a pure emotion-led pump. Assistance Fund has put nearly 97% of the agreed protocol fees into daily automated buybacks; the annualized buyback intensity is about 7% of market cap, the highest in the industry. The share of DEX perpetual futures has also been repaired from the 20% low to 37%. But the monthly unlock volume is still 6–8 times the monthly buyback capacity—this supply-demand race has only just begun. Do you think the shares can hold above 40%?
216
·
--
Bullish
Verified
UNI surges 16% in its weekly cycle, edging toward the $5.5 mark. This isn’t pure speculation—tokenized stock trading volume jumped by $325 million week-over-week, and within two months, Robinhood Chain routed over $20 billion through Uniswap. This is real institutional-grade adoption.
Layered on top is the fee-burn mechanism that was already implemented last year, confirming the long-term scarcity thesis. But long liquidations around the $4 area are also stacking up—before chasing higher, how would you choose?
UNI surges 16% in its weekly cycle, edging toward the $5.5 mark. This isn’t pure speculation—tokenized stock trading volume jumped by $325 million week-over-week, and within two months, Robinhood Chain routed over $20 billion through Uniswap. This is real institutional-grade adoption.
Layered on top is the fee-burn mechanism that was already implemented last year, confirming the long-term scarcity thesis. But long liquidations around the $4 area are also stacking up—before chasing higher, how would you choose?
Layered on top is the fee-burn mechanism that was already implemented last year, confirming the long-term scarcity thesis. But long liquidations around the $4 area are also stacking up—before chasing higher, how would you choose?

1
931
·
--
Bullish
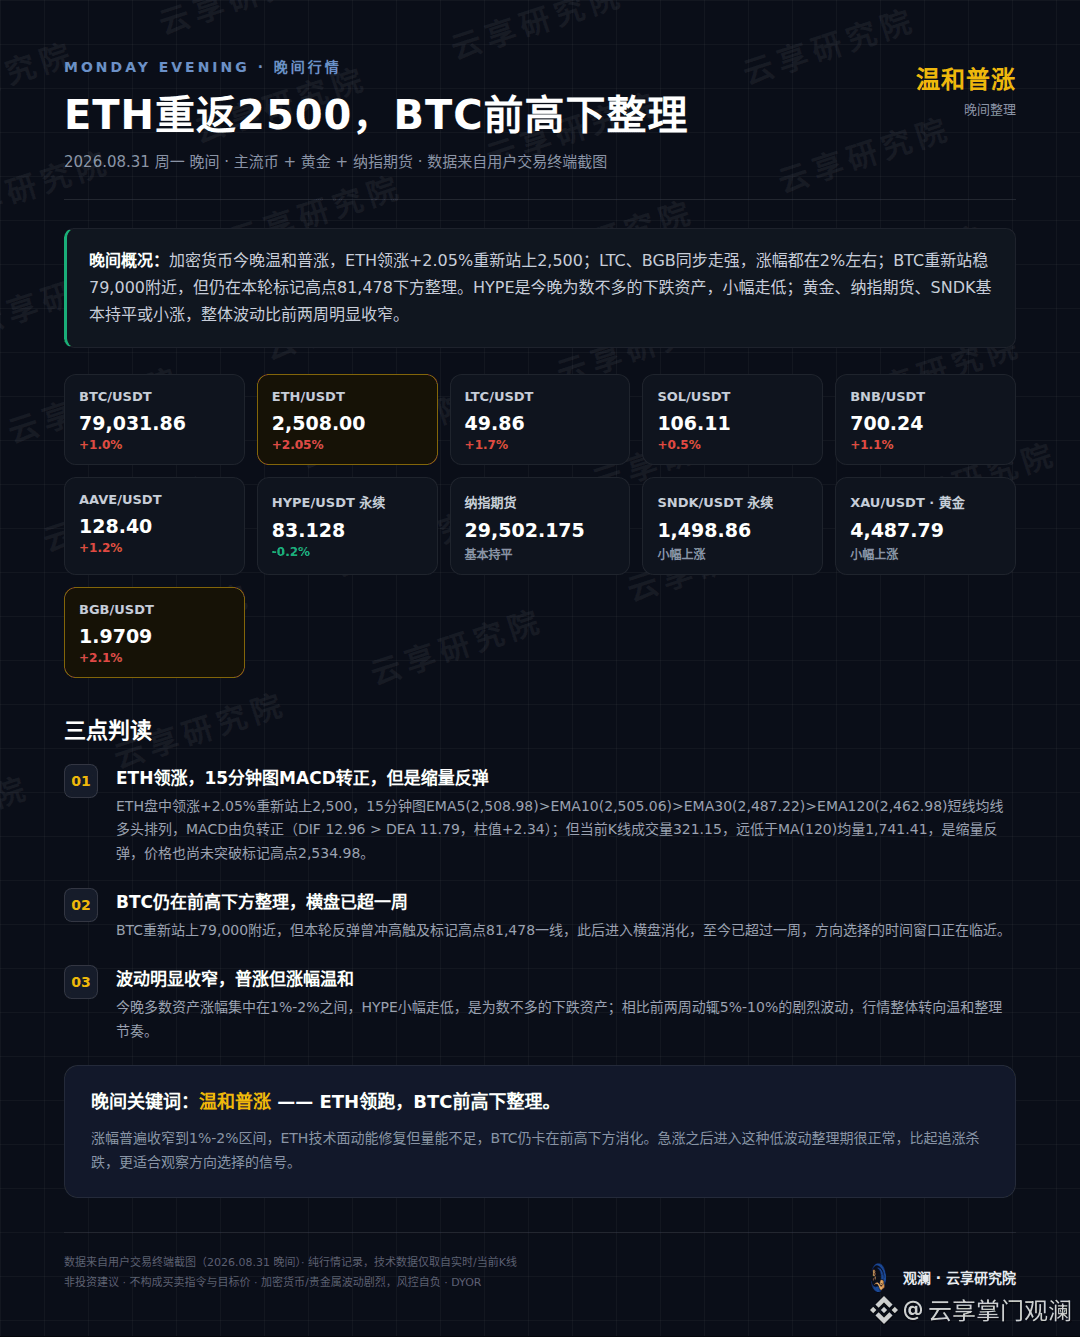
Crypto sees a mild broad-based rally tonight: ETH leads up about +2.05%, reclaiming the 2,500 level. LTC and BGB move higher in sync, with gains around 2% each. BTC is back above the 79,000 area, but it is still consolidating below this round’s marked high of 81,478. HYPE is one of the few decliners tonight, edging slightly lower. Gold, Nasdaq futures, and SNDK are mostly flat or slightly up; overall volatility has clearly narrowed compared with the past two weeks.
Most assets tonight are gaining in the 1%–2% range. Compared with the dramatic swings of 5%–10% seen in the prior two weeks, the market has shifted into a calmer consolidation rhythm.
【Evening Key Words】Mild broad-based rally—ETH leads, while BTC consolidates near the prior high. ETH’s technical momentum is repaired but volume is insufficient, while BTC is still digesting below the prior high. After a sharp rise, it’s very normal to enter this low-volatility consolidation phase; compared with chasing or panic-selling, it’s better to observe signals for directional selection.
—— Guanlan @ Cloud Enjoy Research Institute
Not investment advice. The market carries risk; make independent judgments. Manage your position sizing and leverage yourself.
Crypto sees a mild broad-based rally tonight: ETH leads up about +2.05%, reclaiming the 2,500 level. LTC and BGB move higher in sync, with gains around 2% each. BTC is back above the 79,000 area, but it is still consolidating below this round’s marked high of 81,478. HYPE is one of the few decliners tonight, edging slightly lower. Gold, Nasdaq futures, and SNDK are mostly flat or slightly up; overall volatility has clearly narrowed compared with the past two weeks.
Most assets tonight are gaining in the 1%–2% range. Compared with the dramatic swings of 5%–10% seen in the prior two weeks, the market has shifted into a calmer consolidation rhythm.
【Evening Key Words】Mild broad-based rally—ETH leads, while BTC consolidates near the prior high. ETH’s technical momentum is repaired but volume is insufficient, while BTC is still digesting below the prior high. After a sharp rise, it’s very normal to enter this low-volatility consolidation phase; compared with chasing or panic-selling, it’s better to observe signals for directional selection.
—— Guanlan @ Cloud Enjoy Research Institute
Not investment advice. The market carries risk; make independent judgments. Manage your position sizing and leverage yourself.
Most assets tonight are gaining in the 1%–2% range. Compared with the dramatic swings of 5%–10% seen in the prior two weeks, the market has shifted into a calmer consolidation rhythm.
【Evening Key Words】Mild broad-based rally—ETH leads, while BTC consolidates near the prior high. ETH’s technical momentum is repaired but volume is insufficient, while BTC is still digesting below the prior high. After a sharp rise, it’s very normal to enter this low-volatility consolidation phase; compared with chasing or panic-selling, it’s better to observe signals for directional selection.
—— Guanlan @ Cloud Enjoy Research Institute
Not investment advice. The market carries risk; make independent judgments. Manage your position sizing and leverage yourself.
479
·
--
Big Cousin says the big pancake can surpass gold #比特币大会
Big Cousin says the big pancake can surpass gold #比特币大会

357
·
--
Bullish
BTC stabilizes at 78,823; ETH consolidates on lower volume; gold is nearing its previous high—everyone is waiting for answers.
Tonight, the first variable will be the PCE data plus the Nvidia earnings report. At the Hong Kong Bitcoin Conference, CZ will make the closing appearance, but the agenda is more narrative in nature, without any hard news like ETF approvals—more like a sentiment catalyst rather than a fundamental positive.
Do you think tonight’s data will break the consolidation, or will it continue grinding?
BTC stabilizes at 78,823; ETH consolidates on lower volume; gold is nearing its previous high—everyone is waiting for answers.
Tonight, the first variable will be the PCE data plus the Nvidia earnings report. At the Hong Kong Bitcoin Conference, CZ will make the closing appearance, but the agenda is more narrative in nature, without any hard news like ETF approvals—more like a sentiment catalyst rather than a fundamental positive.
Do you think tonight’s data will break the consolidation, or will it continue grinding?
Tonight, the first variable will be the PCE data plus the Nvidia earnings report. At the Hong Kong Bitcoin Conference, CZ will make the closing appearance, but the agenda is more narrative in nature, without any hard news like ETF approvals—more like a sentiment catalyst rather than a fundamental positive.
Do you think tonight’s data will break the consolidation, or will it continue grinding?

3
1
1.6k
·
--
🌙 Evening Recap · August 22
First, the conclusion from this noon spike: it cleaned out the leveraged long positions that were chasing; spot holders basically didn’t feel much.
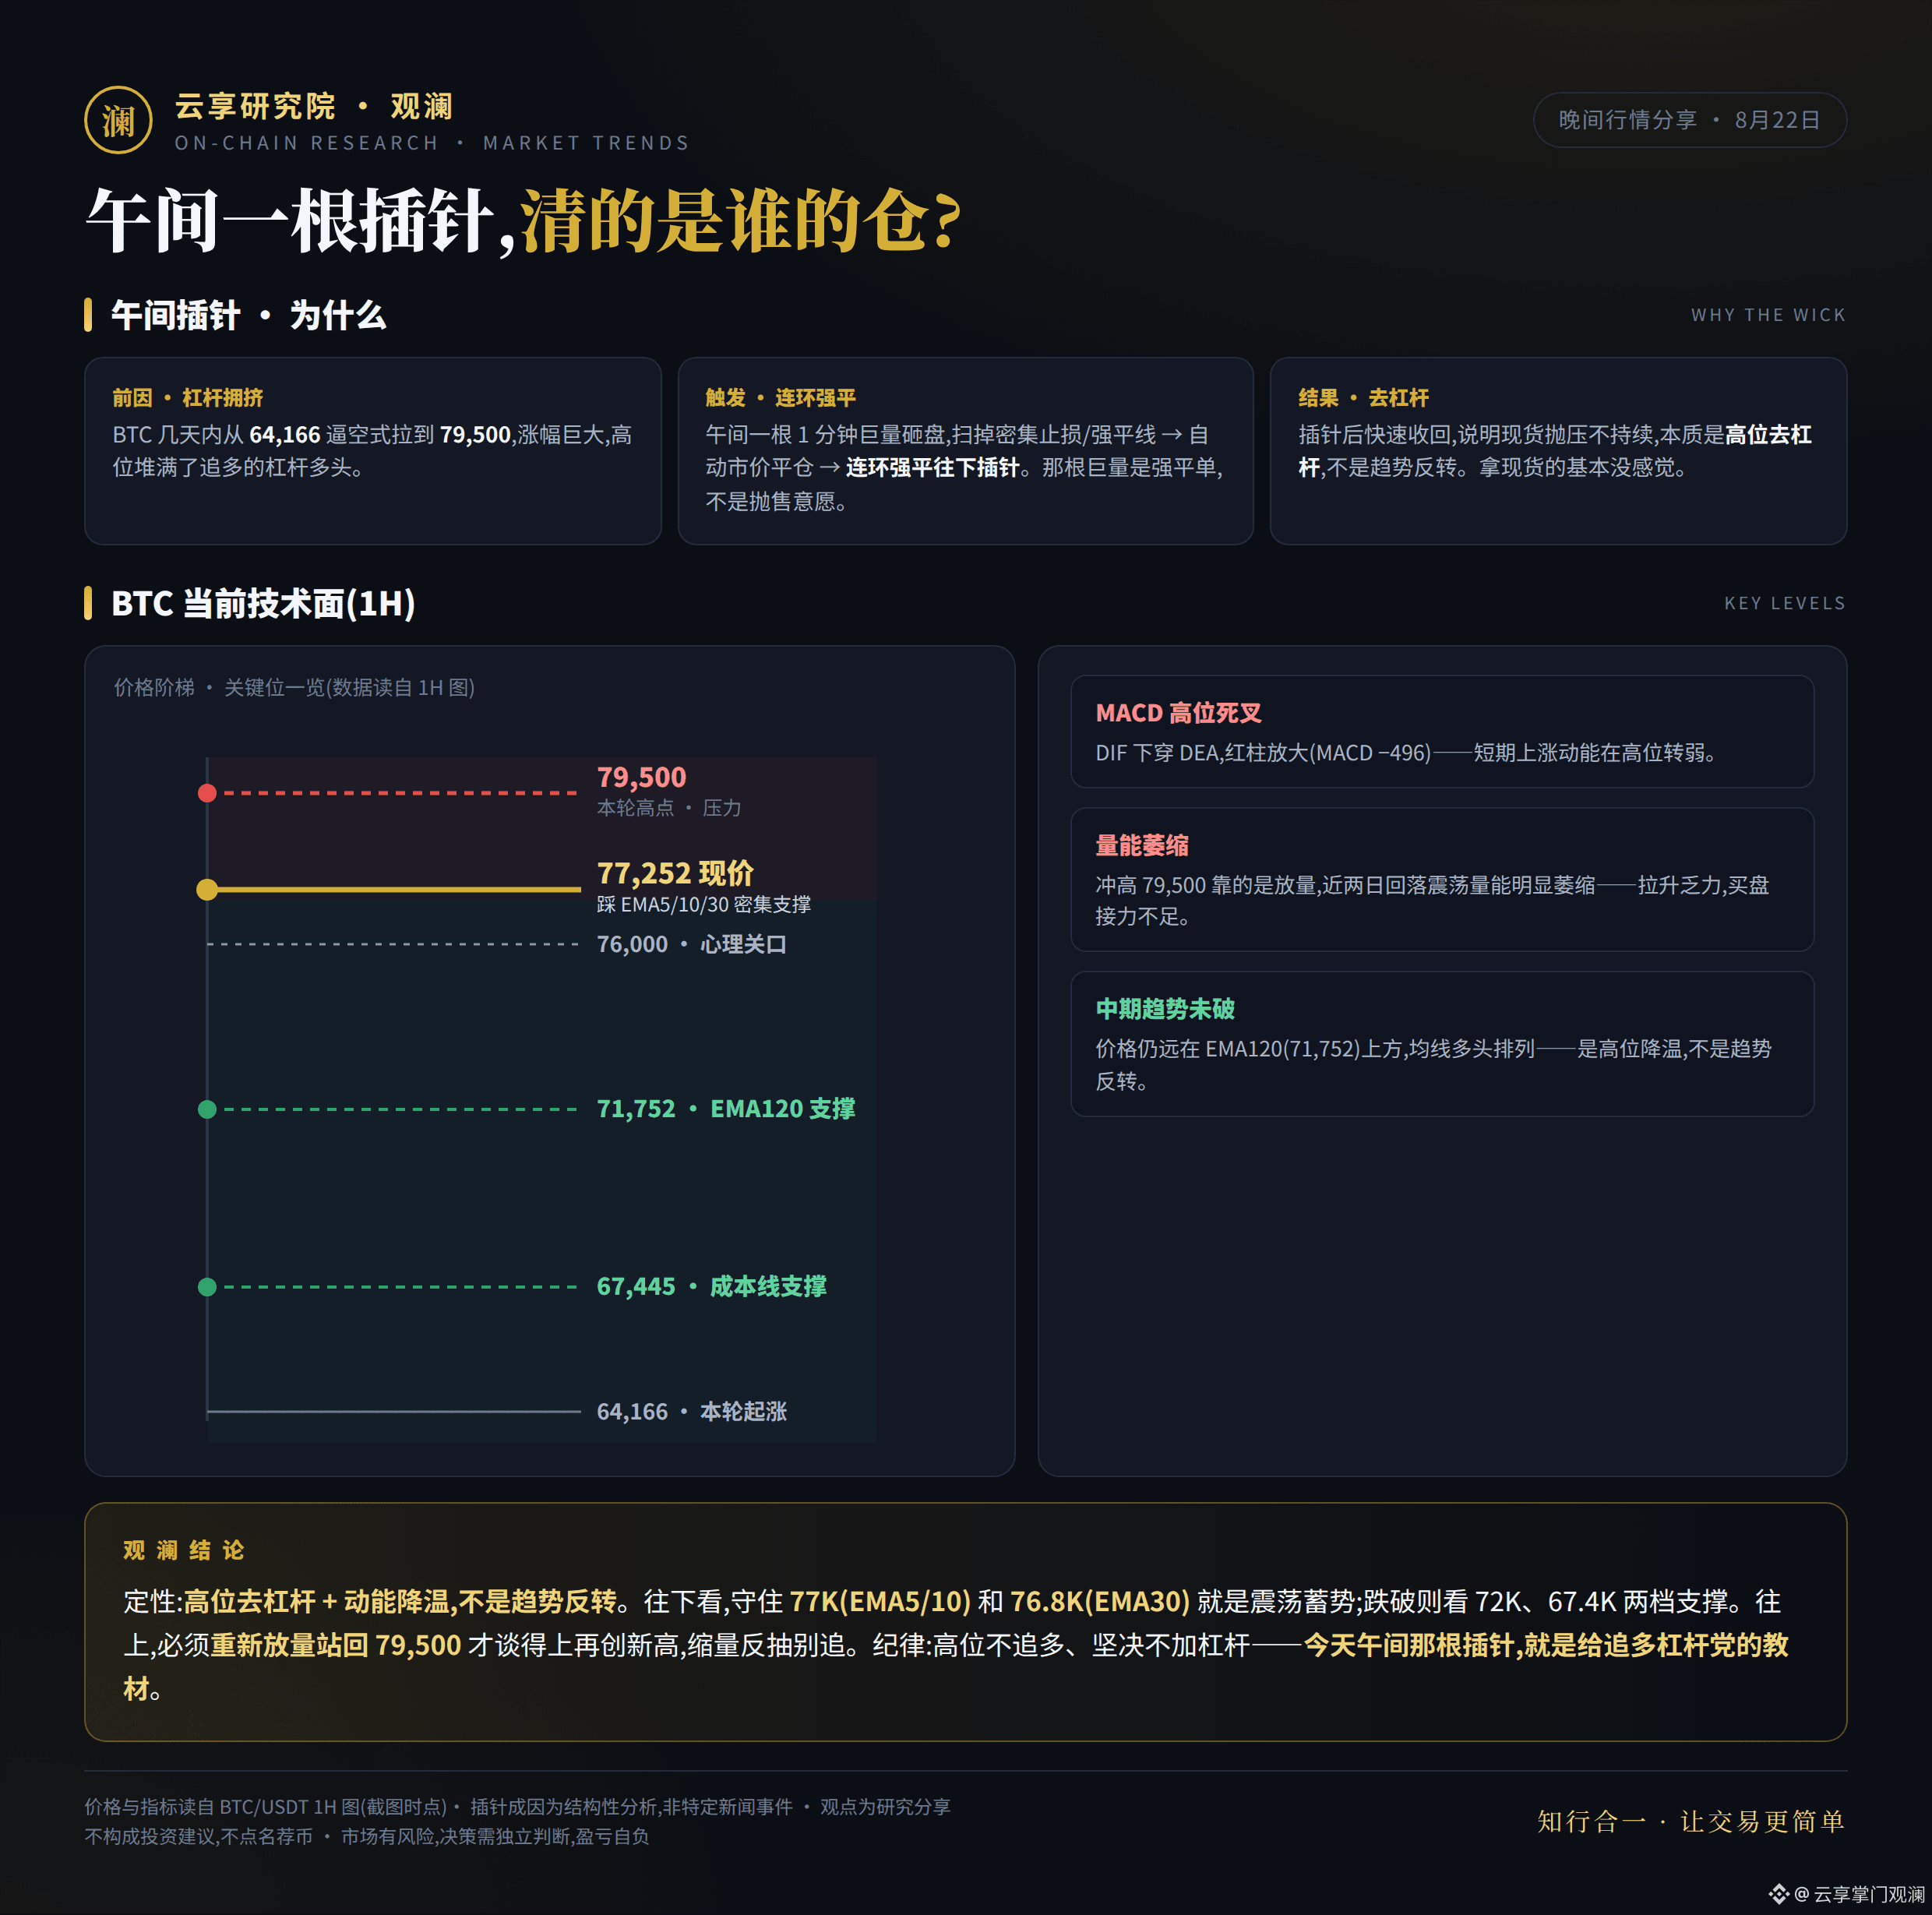
Why did it spike? Three steps to understand: BTC within a few days was squeezed from 64,166 up to 79,500—an enormous rally that piled up leveraged long longs chasing at the highs. Then at noon, a single 1-minute candle dumped huge volume, sweeping through dense stop-loss and liquidation levels, triggering a chain reaction of liquidations and automatic market selling—so the price was instantly “stabbed” downward. After the liquidation sell orders were exhausted, there was no sustained spot selling pressure, and the price quickly snapped back. That massive candle was forced-liquidation selling, not people truly dumping—so in essence it was de-leveraging at high levels, not a trend reversal.
Where is BTC now? The current price is 77,252, sitting on the dense support zone formed by EMA5/10/30. Above, 79,500 is the local high and key resistance. Below, 76,000 is the psychological level, while 72,000 (EMA120) and 67,445 (cost line) are three tiers of support. On technical signals: MACD is showing a dead cross at high levels, the red histogram is expanding, and volume is clearly shrinking—short-term momentum is cooling. But the price is still far above EMA120 and the moving averages remain in a bullish arrangement—so this is “cooling off at high levels,” not a “trend reversal.”
What to watch next? On the downside, holding 77K / 76.8K means consolidating and building momentum; if it breaks, then look at 72K and 67.4K. On the upside, you need to see a renewed volume expansion and reclaim 79,500 before discussing making new highs—don’t chase a weak pullback rally on low volume.
In one sentence: at high levels, don’t chase longs and don’t add leverage. That noon needle was a lesson for the leveraged-long chasers. People who can truly get through the market aren’t guessing where the next “needle” will go—they’re making sure they’re never positioned where that needle can reach.
The above is research commentary; data is read from the 1H chart and does not constitute investment advice. The market has risks—make independent decisions. #Bitcoin #BTC #MarketAnalysis
🌙 Evening Recap · August 22
First, the conclusion from this noon spike: it cleaned out the leveraged long positions that were chasing; spot holders basically didn’t feel much.
Why did it spike? Three steps to understand: BTC within a few days was squeezed from 64,166 up to 79,500—an enormous rally that piled up leveraged long longs chasing at the highs. Then at noon, a single 1-minute candle dumped huge volume, sweeping through dense stop-loss and liquidation levels, triggering a chain reaction of liquidations and automatic market selling—so the price was instantly “stabbed” downward. After the liquidation sell orders were exhausted, there was no sustained spot selling pressure, and the price quickly snapped back. That massive candle was forced-liquidation selling, not people truly dumping—so in essence it was de-leveraging at high levels, not a trend reversal.
Where is BTC now? The current price is 77,252, sitting on the dense support zone formed by EMA5/10/30. Above, 79,500 is the local high and key resistance. Below, 76,000 is the psychological level, while 72,000 (EMA120) and 67,445 (cost line) are three tiers of support. On technical signals: MACD is showing a dead cross at high levels, the red histogram is expanding, and volume is clearly shrinking—short-term momentum is cooling. But the price is still far above EMA120 and the moving averages remain in a bullish arrangement—so this is “cooling off at high levels,” not a “trend reversal.”
What to watch next? On the downside, holding 77K / 76.8K means consolidating and building momentum; if it breaks, then look at 72K and 67.4K. On the upside, you need to see a renewed volume expansion and reclaim 79,500 before discussing making new highs—don’t chase a weak pullback rally on low volume.
In one sentence: at high levels, don’t chase longs and don’t add leverage. That noon needle was a lesson for the leveraged-long chasers. People who can truly get through the market aren’t guessing where the next “needle” will go—they’re making sure they’re never positioned where that needle can reach.
The above is research commentary; data is read from the 1H chart and does not constitute investment advice. The market has risks—make independent decisions. #Bitcoin #BTC #MarketAnalysis
First, the conclusion from this noon spike: it cleaned out the leveraged long positions that were chasing; spot holders basically didn’t feel much.
Why did it spike? Three steps to understand: BTC within a few days was squeezed from 64,166 up to 79,500—an enormous rally that piled up leveraged long longs chasing at the highs. Then at noon, a single 1-minute candle dumped huge volume, sweeping through dense stop-loss and liquidation levels, triggering a chain reaction of liquidations and automatic market selling—so the price was instantly “stabbed” downward. After the liquidation sell orders were exhausted, there was no sustained spot selling pressure, and the price quickly snapped back. That massive candle was forced-liquidation selling, not people truly dumping—so in essence it was de-leveraging at high levels, not a trend reversal.
Where is BTC now? The current price is 77,252, sitting on the dense support zone formed by EMA5/10/30. Above, 79,500 is the local high and key resistance. Below, 76,000 is the psychological level, while 72,000 (EMA120) and 67,445 (cost line) are three tiers of support. On technical signals: MACD is showing a dead cross at high levels, the red histogram is expanding, and volume is clearly shrinking—short-term momentum is cooling. But the price is still far above EMA120 and the moving averages remain in a bullish arrangement—so this is “cooling off at high levels,” not a “trend reversal.”
What to watch next? On the downside, holding 77K / 76.8K means consolidating and building momentum; if it breaks, then look at 72K and 67.4K. On the upside, you need to see a renewed volume expansion and reclaim 79,500 before discussing making new highs—don’t chase a weak pullback rally on low volume.
In one sentence: at high levels, don’t chase longs and don’t add leverage. That noon needle was a lesson for the leveraged-long chasers. People who can truly get through the market aren’t guessing where the next “needle” will go—they’re making sure they’re never positioned where that needle can reach.
The above is research commentary; data is read from the 1H chart and does not constitute investment advice. The market has risks—make independent decisions. #Bitcoin #BTC #MarketAnalysis
1
1
1.6k
·
--
$3.5 billion liquidation— the 7th largest liquidation event in crypto history, with over $3 billion of short positions buried.
But what truly sparked this latest surge wasn’t ETF buying— it was the Ministry of the Treasury doubling the Treasury repo scale to $4 billion.
Trump also met with crypto executives at the same time; expectations for the CLARITY Act are heating up. However, the vote on September 15 was merely a procedural motion—far from real legislation.
On-chain data: the cost basis line for short-term holders is $68,500, which has already shifted from a pressure level to a support level below.
Both bulls and bears have real data backing them— which side are you on?
$3.5 billion liquidation— the 7th largest liquidation event in crypto history, with over $3 billion of short positions buried.
But what truly sparked this latest surge wasn’t ETF buying— it was the Ministry of the Treasury doubling the Treasury repo scale to $4 billion.
Trump also met with crypto executives at the same time; expectations for the CLARITY Act are heating up. However, the vote on September 15 was merely a procedural motion—far from real legislation.
On-chain data: the cost basis line for short-term holders is $68,500, which has already shifted from a pressure level to a support level below.
Both bulls and bears have real data backing them— which side are you on?
But what truly sparked this latest surge wasn’t ETF buying— it was the Ministry of the Treasury doubling the Treasury repo scale to $4 billion.
Trump also met with crypto executives at the same time; expectations for the CLARITY Act are heating up. However, the vote on September 15 was merely a procedural motion—far from real legislation.
On-chain data: the cost basis line for short-term holders is $68,500, which has already shifted from a pressure level to a support level below.
Both bulls and bears have real data backing them— which side are you on?

3
11
2.1k
·
--
[Morning News] Countdown to Woshe’s debut; money has already rushed ahead
Overnight price action continues the strength seen since Friday: BTC rose from 77,288 to 78,150, gaining another 1.12% overnight. This rebound has accelerated for three straight trading days, with a weekly cumulative increase of over 19%. AAVE remains the most aggressive asset in this rally—up another 12.78% overnight, and adding Friday’s full-day +11.59%, the two-day gain is close to 25%. ETH, LTC, and BGB also moved higher in sync. Nasdaq futures and gold were basically flat, suggesting this upswing is driven more by capital within the crypto market rather than a broad lift in overall risk appetite.
Institutional flows are also shifting: Bitcoin ETFs saw a net inflow of $517 million in a single day (8.19), one of the rare large one-day inflows this year. Ethereum ETFs recorded a net inflow of $189 million, the largest single-day inflow since October 2025. This shift in positioning happened after prices had already rebounded, which looks more like institutional confirmation than pre-positioning. Still, it indicates that large capital has not pulled out at elevated levels.
What’s truly worth watching is next week’s dense catalyst window: on August 26, there will be July PCE inflation data and Nvidia’s earnings release (the market expects revenue of roughly $91 billion). From August 27–29, it’s the Jackson Hole Global Central Bank Symposium. The newly appointed U.S. Federal Reserve chair, Woshe (who took over from Powell in May), will deliver his first Jackson Hole speech since taking office on August 28. The market widely views it as a key window to gauge the tone of the new policy.
[Morning News Key Words] Rushing ahead—before the catalysts are even delivered, the money has already moved. What looks like a calm broad-based rally this weekend is, in reality, early pricing ahead of the major macro catalysts landing next Wednesday. Historical experience suggests that “rushing ahead” volatility before the shoe drops tends to amplify—whether you’re bullish or bearish now, it’s advisable to leave room in your position sizing and leverage to handle next week.
—— Guanlan @ CloudEnjoy Research Institute
Not investment advice. Markets involve risk; make independent judgments when deciding.
[Morning News] Countdown to Woshe’s debut; money has already rushed ahead
Overnight price action continues the strength seen since Friday: BTC rose from 77,288 to 78,150, gaining another 1.12% overnight. This rebound has accelerated for three straight trading days, with a weekly cumulative increase of over 19%. AAVE remains the most aggressive asset in this rally—up another 12.78% overnight, and adding Friday’s full-day +11.59%, the two-day gain is close to 25%. ETH, LTC, and BGB also moved higher in sync. Nasdaq futures and gold were basically flat, suggesting this upswing is driven more by capital within the crypto market rather than a broad lift in overall risk appetite.
Institutional flows are also shifting: Bitcoin ETFs saw a net inflow of $517 million in a single day (8.19), one of the rare large one-day inflows this year. Ethereum ETFs recorded a net inflow of $189 million, the largest single-day inflow since October 2025. This shift in positioning happened after prices had already rebounded, which looks more like institutional confirmation than pre-positioning. Still, it indicates that large capital has not pulled out at elevated levels.
What’s truly worth watching is next week’s dense catalyst window: on August 26, there will be July PCE inflation data and Nvidia’s earnings release (the market expects revenue of roughly $91 billion). From August 27–29, it’s the Jackson Hole Global Central Bank Symposium. The newly appointed U.S. Federal Reserve chair, Woshe (who took over from Powell in May), will deliver his first Jackson Hole speech since taking office on August 28. The market widely views it as a key window to gauge the tone of the new policy.
[Morning News Key Words] Rushing ahead—before the catalysts are even delivered, the money has already moved. What looks like a calm broad-based rally this weekend is, in reality, early pricing ahead of the major macro catalysts landing next Wednesday. Historical experience suggests that “rushing ahead” volatility before the shoe drops tends to amplify—whether you’re bullish or bearish now, it’s advisable to leave room in your position sizing and leverage to handle next week.
—— Guanlan @ CloudEnjoy Research Institute
Not investment advice. Markets involve risk; make independent judgments when deciding.
Overnight price action continues the strength seen since Friday: BTC rose from 77,288 to 78,150, gaining another 1.12% overnight. This rebound has accelerated for three straight trading days, with a weekly cumulative increase of over 19%. AAVE remains the most aggressive asset in this rally—up another 12.78% overnight, and adding Friday’s full-day +11.59%, the two-day gain is close to 25%. ETH, LTC, and BGB also moved higher in sync. Nasdaq futures and gold were basically flat, suggesting this upswing is driven more by capital within the crypto market rather than a broad lift in overall risk appetite.
Institutional flows are also shifting: Bitcoin ETFs saw a net inflow of $517 million in a single day (8.19), one of the rare large one-day inflows this year. Ethereum ETFs recorded a net inflow of $189 million, the largest single-day inflow since October 2025. This shift in positioning happened after prices had already rebounded, which looks more like institutional confirmation than pre-positioning. Still, it indicates that large capital has not pulled out at elevated levels.
What’s truly worth watching is next week’s dense catalyst window: on August 26, there will be July PCE inflation data and Nvidia’s earnings release (the market expects revenue of roughly $91 billion). From August 27–29, it’s the Jackson Hole Global Central Bank Symposium. The newly appointed U.S. Federal Reserve chair, Woshe (who took over from Powell in May), will deliver his first Jackson Hole speech since taking office on August 28. The market widely views it as a key window to gauge the tone of the new policy.
[Morning News Key Words] Rushing ahead—before the catalysts are even delivered, the money has already moved. What looks like a calm broad-based rally this weekend is, in reality, early pricing ahead of the major macro catalysts landing next Wednesday. Historical experience suggests that “rushing ahead” volatility before the shoe drops tends to amplify—whether you’re bullish or bearish now, it’s advisable to leave room in your position sizing and leverage to handle next week.
—— Guanlan @ CloudEnjoy Research Institute
Not investment advice. Markets involve risk; make independent judgments when deciding.

1
1
651
·
--
[Evening Market] BTC Breaks 77,000; AAVE Jumps More Than 11% in a Single Day
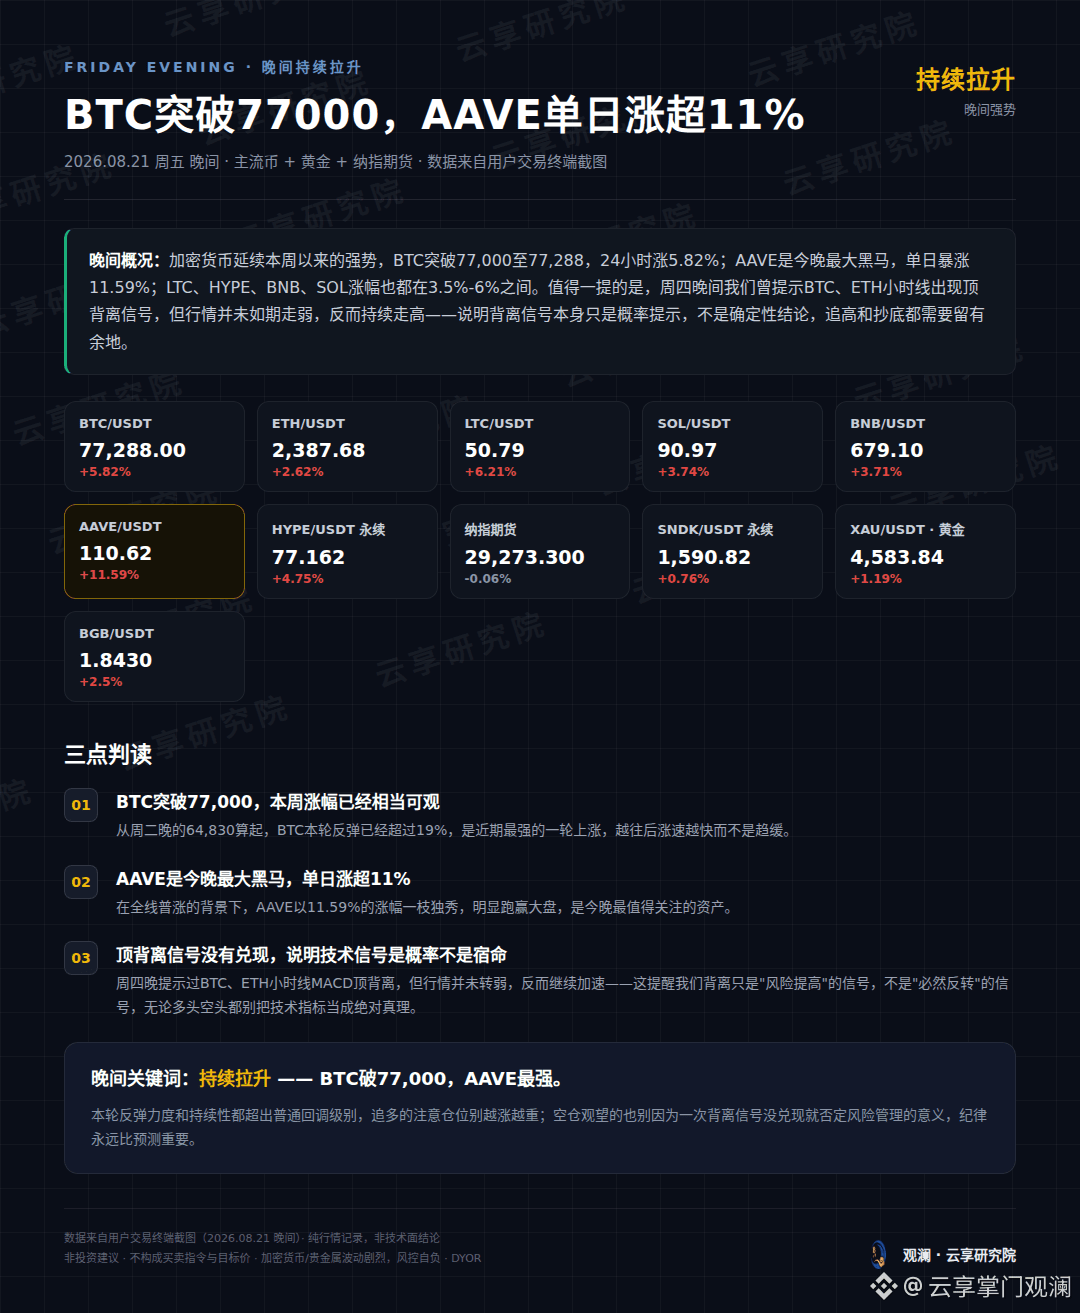
Cryptocurrencies continue their strength this week. BTC has broken through the 77,000 level, with the latest price at 77,288, up 5.82% over the past 24 hours. Measured from the low of 64,830 on Tuesday night, this rebound has now gained more than 19%, making it the strongest up-move in recent times.
{future}(AAVEUSDT)
Tonight’s biggest standout is AAVE, which surged 11.59% in a single day and clearly outperformed the broader market. LTC, HYPE, BNB, and SOL are also clustered in gains of roughly 3.5%–6%, showing a clear pattern of broad-based rallies. By contrast, Nasdaq futures are basically flat (-0.06%), while gold is up moderately by 1.19%.
One point worth revisiting: late Thursday night, we flagged a potential top divergence risk signal based on MACD data from the BTC and ETH hourly charts. However, the market didn’t weaken as expected—it instead continued to accelerate upward. This suggests that technical divergence signals are only probability warnings of “higher risk,” not certain conclusions of an “inevitable reversal.” Whether you’re bullish or bearish, you shouldn’t treat a single technical indicator as absolute truth.$BTC
{future}(BTCUSDT)
[Evening Key Words] Continuous Strengthening — BTC breaks 77,000, with AAVE the strongest. The rebound’s momentum and staying power both exceed what you’d typically see in an ordinary pullback. If you’re chasing longs, be careful not to keep increasing position size. If you’re currently in cash and waiting, don’t dismiss risk management just because one divergence signal didn’t play out—discipline always matters more than prediction.
— Guanlan @ Yunyuan Research Institute
Not investment advice. The market carries risks; decisions should be made independently.
[Evening Market] BTC Breaks 77,000; AAVE Jumps More Than 11% in a Single Day
Cryptocurrencies continue their strength this week. BTC has broken through the 77,000 level, with the latest price at 77,288, up 5.82% over the past 24 hours. Measured from the low of 64,830 on Tuesday night, this rebound has now gained more than 19%, making it the strongest up-move in recent times.
Tonight’s biggest standout is AAVE, which surged 11.59% in a single day and clearly outperformed the broader market. LTC, HYPE, BNB, and SOL are also clustered in gains of roughly 3.5%–6%, showing a clear pattern of broad-based rallies. By contrast, Nasdaq futures are basically flat (-0.06%), while gold is up moderately by 1.19%.
One point worth revisiting: late Thursday night, we flagged a potential top divergence risk signal based on MACD data from the BTC and ETH hourly charts. However, the market didn’t weaken as expected—it instead continued to accelerate upward. This suggests that technical divergence signals are only probability warnings of “higher risk,” not certain conclusions of an “inevitable reversal.” Whether you’re bullish or bearish, you shouldn’t treat a single technical indicator as absolute truth.$BTC
[Evening Key Words] Continuous Strengthening — BTC breaks 77,000, with AAVE the strongest. The rebound’s momentum and staying power both exceed what you’d typically see in an ordinary pullback. If you’re chasing longs, be careful not to keep increasing position size. If you’re currently in cash and waiting, don’t dismiss risk management just because one divergence signal didn’t play out—discipline always matters more than prediction.
— Guanlan @ Yunyuan Research Institute
Not investment advice. The market carries risks; decisions should be made independently.
Cryptocurrencies continue their strength this week. BTC has broken through the 77,000 level, with the latest price at 77,288, up 5.82% over the past 24 hours. Measured from the low of 64,830 on Tuesday night, this rebound has now gained more than 19%, making it the strongest up-move in recent times.
Tonight’s biggest standout is AAVE, which surged 11.59% in a single day and clearly outperformed the broader market. LTC, HYPE, BNB, and SOL are also clustered in gains of roughly 3.5%–6%, showing a clear pattern of broad-based rallies. By contrast, Nasdaq futures are basically flat (-0.06%), while gold is up moderately by 1.19%.
One point worth revisiting: late Thursday night, we flagged a potential top divergence risk signal based on MACD data from the BTC and ETH hourly charts. However, the market didn’t weaken as expected—it instead continued to accelerate upward. This suggests that technical divergence signals are only probability warnings of “higher risk,” not certain conclusions of an “inevitable reversal.” Whether you’re bullish or bearish, you shouldn’t treat a single technical indicator as absolute truth.$BTC
[Evening Key Words] Continuous Strengthening — BTC breaks 77,000, with AAVE the strongest. The rebound’s momentum and staying power both exceed what you’d typically see in an ordinary pullback. If you’re chasing longs, be careful not to keep increasing position size. If you’re currently in cash and waiting, don’t dismiss risk management just because one divergence signal didn’t play out—discipline always matters more than prediction.
— Guanlan @ Yunyuan Research Institute
Not investment advice. The market carries risks; decisions should be made independently.
616
·
--
☀️ Good morning, Friday, August 21.
Overnight: BTC held steady at 73.6K and stayed at the high level after that squeeze; ETH and SOL, BNB rose across the board, but the magnitude of the gains clearly narrowed. AAVE and HYPE edged slightly lower. Nasdaq futures ticked up 0.2%. Gold at 4516 made a small adjustment near the highs. In one sentence—after the squeeze lifted prices, we’re now in high-range consolidation. Risk appetite is moderate, and the market is waiting for a direction.
What you should watch most today: the global S&P PMI initial reading (August). Don’t just look at the headline number—focus on two sub-components: employment and prices. These directly influence the trajectory of U.S. Treasury yields, which then filter through to crypto and U.S. stocks. Also take a quick look at Japan’s July CPI, the UK retail data, and Eurozone consumer confidence.
Guankan’s view: Last night’s big bullish candle was fun, but today is the “inspection day.” If the data delivers (PMI holds steady, prices remain under control), there’s reason for support in high-range consolidation. If the data turns weaker, then you should see how much of the excess from the squeeze needs to unwind—back to where it should be. Don’t let yesterday’s emotions drag you into chasing; let today’s data do the deciding.
Data tells the story; sentiment is just noise. Today—let the data speak.
The above is for research and does not constitute investment advice. #Bitcoin #USStocks #PMI
☀️ Good morning, Friday, August 21.
Overnight: BTC held steady at 73.6K and stayed at the high level after that squeeze; ETH and SOL, BNB rose across the board, but the magnitude of the gains clearly narrowed. AAVE and HYPE edged slightly lower. Nasdaq futures ticked up 0.2%. Gold at 4516 made a small adjustment near the highs. In one sentence—after the squeeze lifted prices, we’re now in high-range consolidation. Risk appetite is moderate, and the market is waiting for a direction.
What you should watch most today: the global S&P PMI initial reading (August). Don’t just look at the headline number—focus on two sub-components: employment and prices. These directly influence the trajectory of U.S. Treasury yields, which then filter through to crypto and U.S. stocks. Also take a quick look at Japan’s July CPI, the UK retail data, and Eurozone consumer confidence.
Guankan’s view: Last night’s big bullish candle was fun, but today is the “inspection day.” If the data delivers (PMI holds steady, prices remain under control), there’s reason for support in high-range consolidation. If the data turns weaker, then you should see how much of the excess from the squeeze needs to unwind—back to where it should be. Don’t let yesterday’s emotions drag you into chasing; let today’s data do the deciding.
Data tells the story; sentiment is just noise. Today—let the data speak.
The above is for research and does not constitute investment advice. #Bitcoin #USStocks #PMI
Overnight: BTC held steady at 73.6K and stayed at the high level after that squeeze; ETH and SOL, BNB rose across the board, but the magnitude of the gains clearly narrowed. AAVE and HYPE edged slightly lower. Nasdaq futures ticked up 0.2%. Gold at 4516 made a small adjustment near the highs. In one sentence—after the squeeze lifted prices, we’re now in high-range consolidation. Risk appetite is moderate, and the market is waiting for a direction.
What you should watch most today: the global S&P PMI initial reading (August). Don’t just look at the headline number—focus on two sub-components: employment and prices. These directly influence the trajectory of U.S. Treasury yields, which then filter through to crypto and U.S. stocks. Also take a quick look at Japan’s July CPI, the UK retail data, and Eurozone consumer confidence.
Guankan’s view: Last night’s big bullish candle was fun, but today is the “inspection day.” If the data delivers (PMI holds steady, prices remain under control), there’s reason for support in high-range consolidation. If the data turns weaker, then you should see how much of the excess from the squeeze needs to unwind—back to where it should be. Don’t let yesterday’s emotions drag you into chasing; let today’s data do the deciding.
Data tells the story; sentiment is just noise. Today—let the data speak.
The above is for research and does not constitute investment advice. #Bitcoin #USStocks #PMI

784
·
--
BTC squeezes overnight to 70,000 and 100,000; 110,000 liquidations—but tonight, the pros aren’t watching the price.
Price is the result; the money flow is the cause. The three numbers you truly need to watch are:
① ETF net inflows—real money or leverage;
② Stablecoin supply—are there still rounds of ammunition left off-exchange;
③ Exchange BTC inventory—are the chips settling in, or ready to be dumped.
If all three hold, 70,000 has meaning; if they don’t, a squeeze is just a one-day show.
Not investment advice. #Bitcoin #BTC走势分析
BTC squeezes overnight to 70,000 and 100,000; 110,000 liquidations—but tonight, the pros aren’t watching the price.
Price is the result; the money flow is the cause. The three numbers you truly need to watch are:
① ETF net inflows—real money or leverage;
② Stablecoin supply—are there still rounds of ammunition left off-exchange;
③ Exchange BTC inventory—are the chips settling in, or ready to be dumped.
If all three hold, 70,000 has meaning; if they don’t, a squeeze is just a one-day show.
Not investment advice. #Bitcoin #BTC走势分析
Price is the result; the money flow is the cause. The three numbers you truly need to watch are:
① ETF net inflows—real money or leverage;
② Stablecoin supply—are there still rounds of ammunition left off-exchange;
③ Exchange BTC inventory—are the chips settling in, or ready to be dumped.
If all three hold, 70,000 has meaning; if they don’t, a squeeze is just a one-day show.
Not investment advice. #Bitcoin #BTC走势分析

2
1.5k
·
--
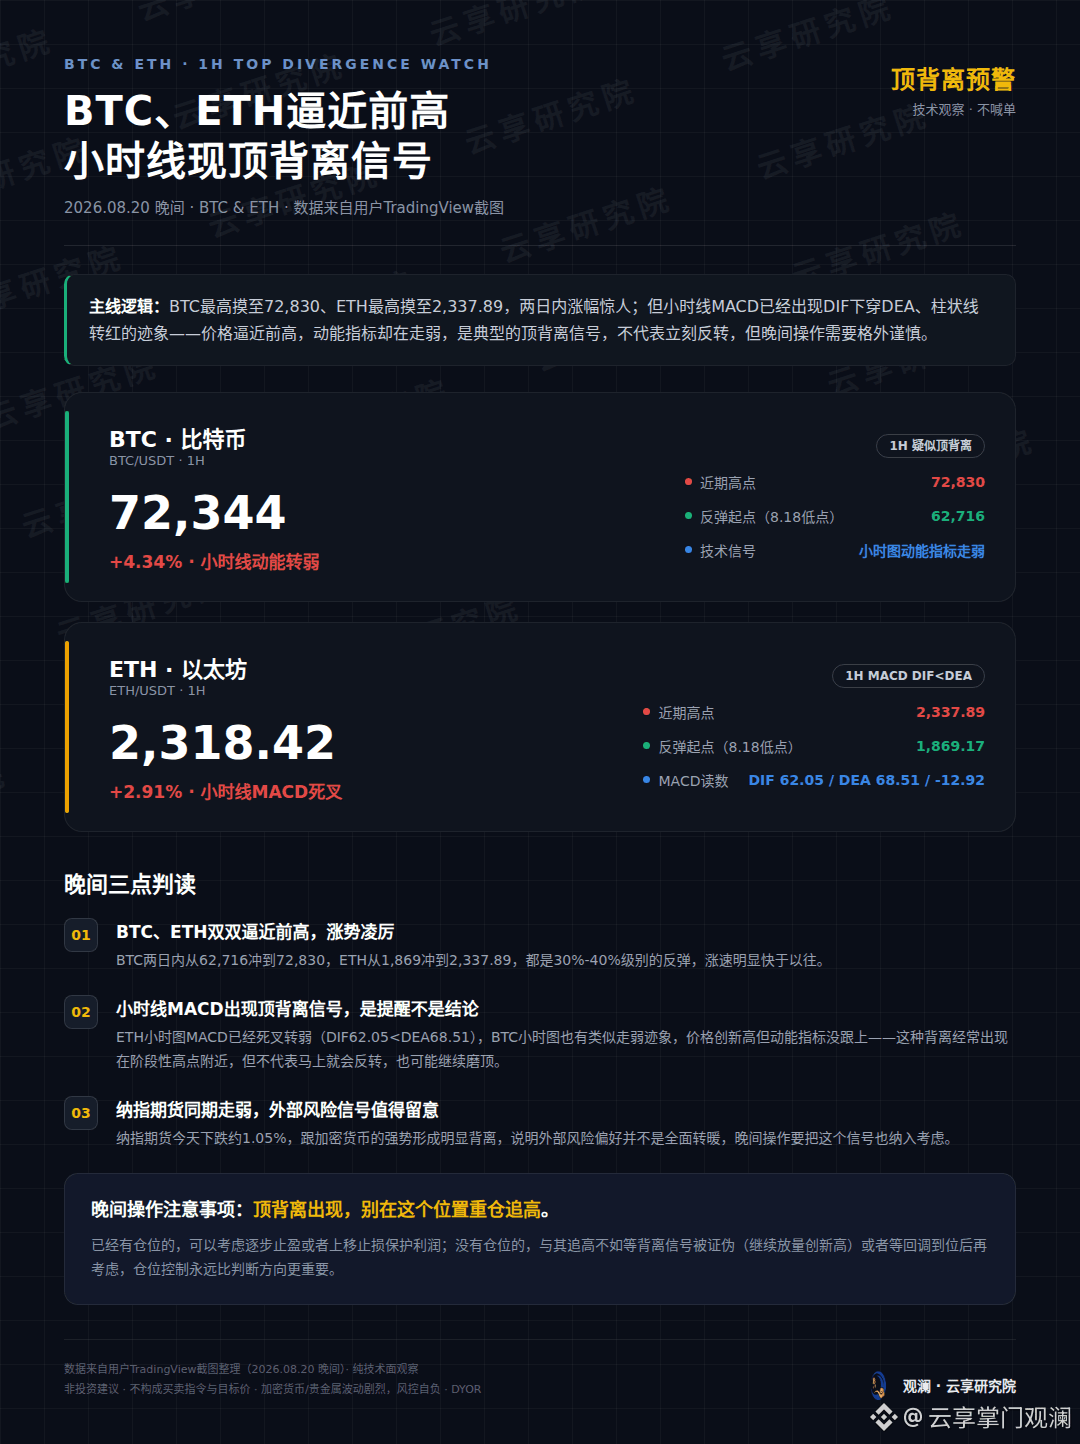
【Yunxiang Research Institute · Evening Technical Watch】BTC、ETH are approaching their previous highs, and the hourly chart shows a top divergence signal
BTC peaked at 72,830 and ETH at 2,337.89—both surged dramatically within two days; however, the hourly MACD has already shown signs of DIF crossing below DEA and the histogram turning red. As price approaches the previous high while momentum indicators are weakening, this is a typical top divergence signal. It does not mean an immediate reversal, but you should be extra cautious with evening trading.
$BTC
{future}(BTCUSDT)
: Current price is 72,344, +4.34%. The recent high is 72,830. The rebound starting point (the 8.18 low) is 62,716. The hourly chart momentum indicators are weakening.
$ETH
{future}(ETHUSDT)
: Current price is 2,318.42, +2.91%. The recent high is 2,337.89. The rebound starting point (the 8.18 low) is 1,869.17. The hourly chart MACD has formed a dead cross. DIF is 62.05, DEA is 68.51, and MACD is -12.92.
Three-point reading:
01 BTC and ETH are both nearing their previous highs—the rally is fierce. BTC surged from 62,716 to 72,830 within two days, and ETH from 1,869 to 2,337.89. These are rebound gains in the 30%-40% range, with a noticeably faster pace than before.
02 The hourly MACD showing a top divergence is a warning, not a conclusion. ETH’s hourly MACD has already dead-crossed and weakened, and BTC’s hourly chart shows similar weakening. Price makes new highs, but momentum indicators do not follow. This kind of divergence often appears near intermediate peak zones, but it does not necessarily mean an immediate reversal—it could also keep grinding at the top.
03 Nasdaq futures are also weakening at the same time—external risk signals are worth paying attention to. Nasdaq futures are down about 1.05% today, showing a clear divergence from the strength in crypto. This suggests that overall risk appetite has not broadly turned warmer. For evening trading, factor this signal in as well.
Evening trading notes: When a top divergence appears, don’t chase the upside with heavy positions at this level. If you already have positions, you may consider gradually taking profit or moving stop-losses up to protect gains. If you have no position, rather than chasing, it may be better to wait for the divergence signal to be invalidated (e.g., continued volume and new highs) or to consider entry after the pullback is properly in place. Position control is always more important than calling direction.
The above is only a personal technical observation and does not constitute any investment advice. The market involves risk; make decisions independently.
—— Looking further @ Yunxiang Research Institute
【Yunxiang Research Institute · Evening Technical Watch】BTC、ETH are approaching their previous highs, and the hourly chart shows a top divergence signal
BTC peaked at 72,830 and ETH at 2,337.89—both surged dramatically within two days; however, the hourly MACD has already shown signs of DIF crossing below DEA and the histogram turning red. As price approaches the previous high while momentum indicators are weakening, this is a typical top divergence signal. It does not mean an immediate reversal, but you should be extra cautious with evening trading.
$BTC
: Current price is 72,344, +4.34%. The recent high is 72,830. The rebound starting point (the 8.18 low) is 62,716. The hourly chart momentum indicators are weakening.
$ETH
: Current price is 2,318.42, +2.91%. The recent high is 2,337.89. The rebound starting point (the 8.18 low) is 1,869.17. The hourly chart MACD has formed a dead cross. DIF is 62.05, DEA is 68.51, and MACD is -12.92.
Three-point reading:
01 BTC and ETH are both nearing their previous highs—the rally is fierce. BTC surged from 62,716 to 72,830 within two days, and ETH from 1,869 to 2,337.89. These are rebound gains in the 30%-40% range, with a noticeably faster pace than before.
02 The hourly MACD showing a top divergence is a warning, not a conclusion. ETH’s hourly MACD has already dead-crossed and weakened, and BTC’s hourly chart shows similar weakening. Price makes new highs, but momentum indicators do not follow. This kind of divergence often appears near intermediate peak zones, but it does not necessarily mean an immediate reversal—it could also keep grinding at the top.
03 Nasdaq futures are also weakening at the same time—external risk signals are worth paying attention to. Nasdaq futures are down about 1.05% today, showing a clear divergence from the strength in crypto. This suggests that overall risk appetite has not broadly turned warmer. For evening trading, factor this signal in as well.
Evening trading notes: When a top divergence appears, don’t chase the upside with heavy positions at this level. If you already have positions, you may consider gradually taking profit or moving stop-losses up to protect gains. If you have no position, rather than chasing, it may be better to wait for the divergence signal to be invalidated (e.g., continued volume and new highs) or to consider entry after the pullback is properly in place. Position control is always more important than calling direction.
The above is only a personal technical observation and does not constitute any investment advice. The market involves risk; make decisions independently.
—— Looking further @ Yunxiang Research Institute
BTC peaked at 72,830 and ETH at 2,337.89—both surged dramatically within two days; however, the hourly MACD has already shown signs of DIF crossing below DEA and the histogram turning red. As price approaches the previous high while momentum indicators are weakening, this is a typical top divergence signal. It does not mean an immediate reversal, but you should be extra cautious with evening trading.
$BTC
: Current price is 72,344, +4.34%. The recent high is 72,830. The rebound starting point (the 8.18 low) is 62,716. The hourly chart momentum indicators are weakening.
$ETH
: Current price is 2,318.42, +2.91%. The recent high is 2,337.89. The rebound starting point (the 8.18 low) is 1,869.17. The hourly chart MACD has formed a dead cross. DIF is 62.05, DEA is 68.51, and MACD is -12.92.
Three-point reading:
01 BTC and ETH are both nearing their previous highs—the rally is fierce. BTC surged from 62,716 to 72,830 within two days, and ETH from 1,869 to 2,337.89. These are rebound gains in the 30%-40% range, with a noticeably faster pace than before.
02 The hourly MACD showing a top divergence is a warning, not a conclusion. ETH’s hourly MACD has already dead-crossed and weakened, and BTC’s hourly chart shows similar weakening. Price makes new highs, but momentum indicators do not follow. This kind of divergence often appears near intermediate peak zones, but it does not necessarily mean an immediate reversal—it could also keep grinding at the top.
03 Nasdaq futures are also weakening at the same time—external risk signals are worth paying attention to. Nasdaq futures are down about 1.05% today, showing a clear divergence from the strength in crypto. This suggests that overall risk appetite has not broadly turned warmer. For evening trading, factor this signal in as well.
Evening trading notes: When a top divergence appears, don’t chase the upside with heavy positions at this level. If you already have positions, you may consider gradually taking profit or moving stop-losses up to protect gains. If you have no position, rather than chasing, it may be better to wait for the divergence signal to be invalidated (e.g., continued volume and new highs) or to consider entry after the pullback is properly in place. Position control is always more important than calling direction.
The above is only a personal technical observation and does not constitute any investment advice. The market involves risk; make decisions independently.
—— Looking further @ Yunxiang Research Institute
333
·
--
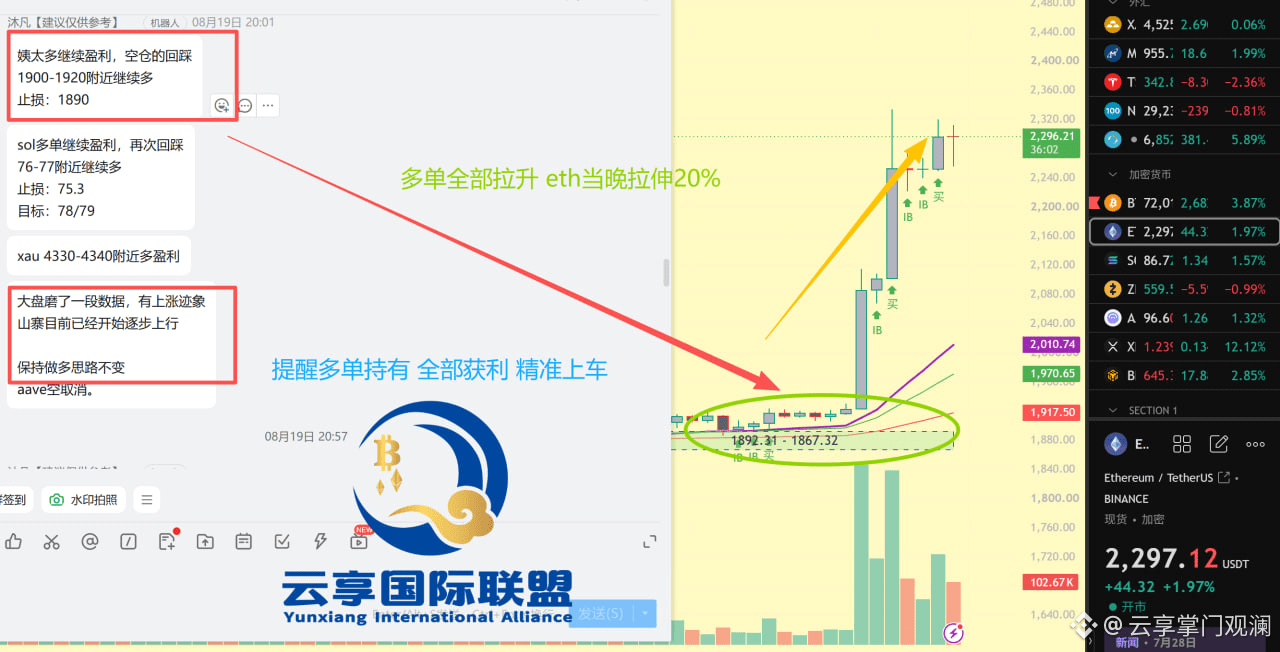
【Review】On the evening of August 19, regarding this wave of bulls—what I want to talk about isn’t “full profits,” but the unified logic behind it.
At 20:01 that night, the core judgment of the community strategy was only this sentence: “The broader market has been grinding for a while; there are signs of an upward move—keep the long-bias unchanged.”
Based on this judgment, each instrument was taken to long on the pullbacks to support—
ETH: 1900–1920 pull back and continue long, stop-loss at 1890. That same night, ETH surged by about 20%, breaking above 2290.
SOL: 76–77 pull back and continue long, stop-loss at 75.3, target 78/79.
XAU: 4330–4340 long positions synchronized to take profit.
But what I really want you to notice is that there was also an action taken that night: the short position on Aave was canceled.
That’s the key to this move—once “going long” becomes the main-line judgment, you decisively cut the short position you’re holding that conflicts with the trend, instead of fighting against it. Many people lose money not because they can’t see the long setup, but because while they’re bullish, they still keep the short they can’t bear to cut—then they get hit from both sides.
So the profits of that night weren’t “luckily getting a few coins right.” It was a system running: first set the main-line thinking (go long) → then enter in line with the trend at each instrument’s pullback to support → set stop-losses for every trade (1890/75.3) → promptly close the counter-trend positions that conflict with the main line. When all four things—direction judgment + entry location + stop-loss + consistency—are right, profit is just the result.
When you look at performance, don’t only look at how many points it rallied; look at whether there’s a logic behind it that can be replicated.
The above is an internal community strategy sharing and a replay/review for teaching purposes. It is for reference only and does not constitute investment advice. It does not promise returns. The market is risky—when entering, be sure to set a stop-loss, and profits and losses are your own.
—— Yunxiang Research Institute · Guanlan | Data · Logic · Unity of Knowing and Acting
【Review】On the evening of August 19, regarding this wave of bulls—what I want to talk about isn’t “full profits,” but the unified logic behind it.
At 20:01 that night, the core judgment of the community strategy was only this sentence: “The broader market has been grinding for a while; there are signs of an upward move—keep the long-bias unchanged.”
Based on this judgment, each instrument was taken to long on the pullbacks to support—
ETH: 1900–1920 pull back and continue long, stop-loss at 1890. That same night, ETH surged by about 20%, breaking above 2290.
SOL: 76–77 pull back and continue long, stop-loss at 75.3, target 78/79.
XAU: 4330–4340 long positions synchronized to take profit.
But what I really want you to notice is that there was also an action taken that night: the short position on Aave was canceled.
That’s the key to this move—once “going long” becomes the main-line judgment, you decisively cut the short position you’re holding that conflicts with the trend, instead of fighting against it. Many people lose money not because they can’t see the long setup, but because while they’re bullish, they still keep the short they can’t bear to cut—then they get hit from both sides.
So the profits of that night weren’t “luckily getting a few coins right.” It was a system running: first set the main-line thinking (go long) → then enter in line with the trend at each instrument’s pullback to support → set stop-losses for every trade (1890/75.3) → promptly close the counter-trend positions that conflict with the main line. When all four things—direction judgment + entry location + stop-loss + consistency—are right, profit is just the result.
When you look at performance, don’t only look at how many points it rallied; look at whether there’s a logic behind it that can be replicated.
The above is an internal community strategy sharing and a replay/review for teaching purposes. It is for reference only and does not constitute investment advice. It does not promise returns. The market is risky—when entering, be sure to set a stop-loss, and profits and losses are your own.
—— Yunxiang Research Institute · Guanlan | Data · Logic · Unity of Knowing and Acting
At 20:01 that night, the core judgment of the community strategy was only this sentence: “The broader market has been grinding for a while; there are signs of an upward move—keep the long-bias unchanged.”
Based on this judgment, each instrument was taken to long on the pullbacks to support—
ETH: 1900–1920 pull back and continue long, stop-loss at 1890. That same night, ETH surged by about 20%, breaking above 2290.
SOL: 76–77 pull back and continue long, stop-loss at 75.3, target 78/79.
XAU: 4330–4340 long positions synchronized to take profit.
But what I really want you to notice is that there was also an action taken that night: the short position on Aave was canceled.
That’s the key to this move—once “going long” becomes the main-line judgment, you decisively cut the short position you’re holding that conflicts with the trend, instead of fighting against it. Many people lose money not because they can’t see the long setup, but because while they’re bullish, they still keep the short they can’t bear to cut—then they get hit from both sides.
So the profits of that night weren’t “luckily getting a few coins right.” It was a system running: first set the main-line thinking (go long) → then enter in line with the trend at each instrument’s pullback to support → set stop-losses for every trade (1890/75.3) → promptly close the counter-trend positions that conflict with the main line. When all four things—direction judgment + entry location + stop-loss + consistency—are right, profit is just the result.
When you look at performance, don’t only look at how many points it rallied; look at whether there’s a logic behind it that can be replicated.
The above is an internal community strategy sharing and a replay/review for teaching purposes. It is for reference only and does not constitute investment advice. It does not promise returns. The market is risky—when entering, be sure to set a stop-loss, and profits and losses are your own.
—— Yunxiang Research Institute · Guanlan | Data · Logic · Unity of Knowing and Acting
590
·
--
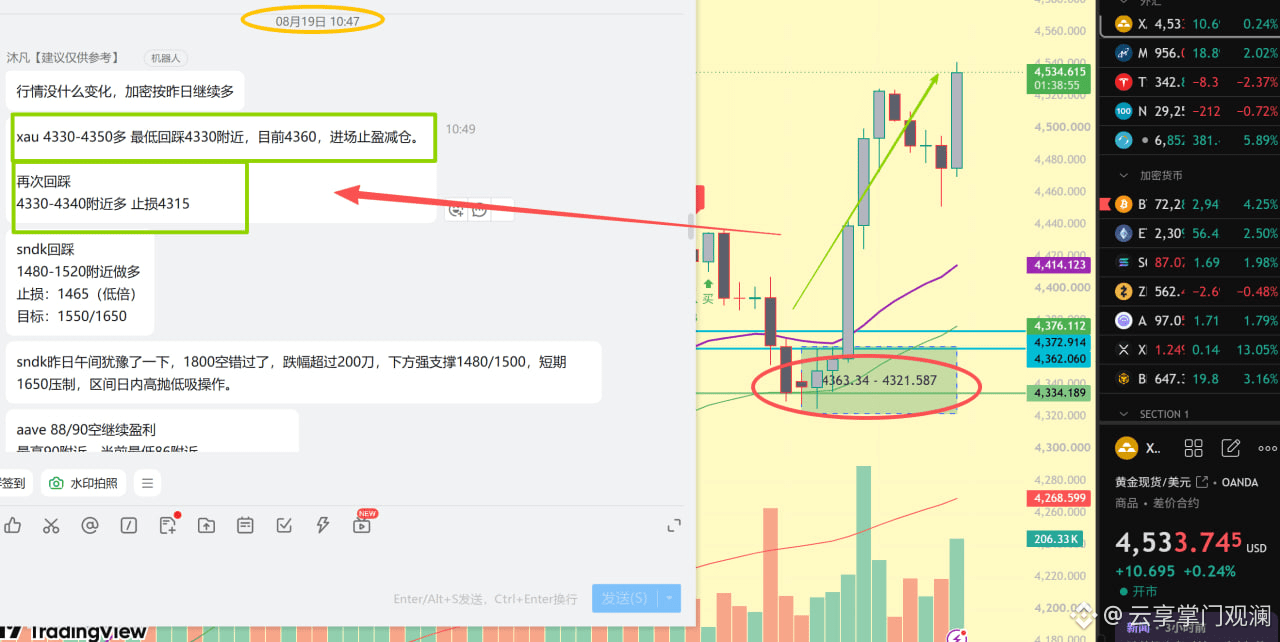
Review】Yesterday’s gold long position. What I want to talk about isn’t “how much profit,” but “why I was confident to enter at that level.” $XAU
{future}(XAUUSDT)
At 10:49 on Aug 19, the community strategy was: go long XAU in the 4330–4350 range, with a stop loss at 4315. After that, the price kept rising and moved above 4530. Looking purely at potential upside, it was about $180–$200.
But what’s really valuable isn’t that number—it’s the logic and odds at the moment of entry:
1) Follow the trend, don’t guess the top. Back then, the judgment was: “If the pullback doesn’t break a strong support, it’s a long opportunity.” In the 4330–4350 support zone, we went long with the trend—rather than chasing at a high level, or trying to call the bottom during the drop.
2) Stop loss first. Long at 4330, stop at 4315—risk was locked to $15; while the target upside was 100+ dollars. That means even if this call was wrong, you’d lose only a small amount—the risk-reward ratio is already there. This is the key to surviving long-term, not “getting it right this time.”
3) Take profit and scale out. The plan at entry was “take profit and reduce position.” As price rose, you exited in batches—rather than fantasizing about taking the very top in one shot.
Many people only look at performance to see “how many points they made,” but what you should learn is this: in a good trade, the odds are already winning within that one second of entry. Everyone can get direction wrong. What helps you get through the cycles is setting stop losses properly and calculating the risk-reward ratio for every single trade.
The above is a community internal strategy sharing and teaching review. Suggestions are for reference only and do not constitute investment advice. No specific trade recommendations are named, and no returns are promised. The market is risky—when entering, you must set a stop loss; profit and loss are your responsibility.
—— Yunxiang Research Institute · Guanlan | Data · Logic · Unity of Knowing and Acting
Review】Yesterday’s gold long position. What I want to talk about isn’t “how much profit,” but “why I was confident to enter at that level.” $XAU
At 10:49 on Aug 19, the community strategy was: go long XAU in the 4330–4350 range, with a stop loss at 4315. After that, the price kept rising and moved above 4530. Looking purely at potential upside, it was about $180–$200.
But what’s really valuable isn’t that number—it’s the logic and odds at the moment of entry:
1) Follow the trend, don’t guess the top. Back then, the judgment was: “If the pullback doesn’t break a strong support, it’s a long opportunity.” In the 4330–4350 support zone, we went long with the trend—rather than chasing at a high level, or trying to call the bottom during the drop.
2) Stop loss first. Long at 4330, stop at 4315—risk was locked to $15; while the target upside was 100+ dollars. That means even if this call was wrong, you’d lose only a small amount—the risk-reward ratio is already there. This is the key to surviving long-term, not “getting it right this time.”
3) Take profit and scale out. The plan at entry was “take profit and reduce position.” As price rose, you exited in batches—rather than fantasizing about taking the very top in one shot.
Many people only look at performance to see “how many points they made,” but what you should learn is this: in a good trade, the odds are already winning within that one second of entry. Everyone can get direction wrong. What helps you get through the cycles is setting stop losses properly and calculating the risk-reward ratio for every single trade.
The above is a community internal strategy sharing and teaching review. Suggestions are for reference only and do not constitute investment advice. No specific trade recommendations are named, and no returns are promised. The market is risky—when entering, you must set a stop loss; profit and loss are your responsibility.
—— Yunxiang Research Institute · Guanlan | Data · Logic · Unity of Knowing and Acting
At 10:49 on Aug 19, the community strategy was: go long XAU in the 4330–4350 range, with a stop loss at 4315. After that, the price kept rising and moved above 4530. Looking purely at potential upside, it was about $180–$200.
But what’s really valuable isn’t that number—it’s the logic and odds at the moment of entry:
1) Follow the trend, don’t guess the top. Back then, the judgment was: “If the pullback doesn’t break a strong support, it’s a long opportunity.” In the 4330–4350 support zone, we went long with the trend—rather than chasing at a high level, or trying to call the bottom during the drop.
2) Stop loss first. Long at 4330, stop at 4315—risk was locked to $15; while the target upside was 100+ dollars. That means even if this call was wrong, you’d lose only a small amount—the risk-reward ratio is already there. This is the key to surviving long-term, not “getting it right this time.”
3) Take profit and scale out. The plan at entry was “take profit and reduce position.” As price rose, you exited in batches—rather than fantasizing about taking the very top in one shot.
Many people only look at performance to see “how many points they made,” but what you should learn is this: in a good trade, the odds are already winning within that one second of entry. Everyone can get direction wrong. What helps you get through the cycles is setting stop losses properly and calculating the risk-reward ratio for every single trade.
The above is a community internal strategy sharing and teaching review. Suggestions are for reference only and do not constitute investment advice. No specific trade recommendations are named, and no returns are promised. The market is risky—when entering, you must set a stop loss; profit and loss are your responsibility.
—— Yunxiang Research Institute · Guanlan | Data · Logic · Unity of Knowing and Acting
476
Log in to explore more content
Join global crypto users on Binance Square
⚡️ Get latest and useful information about crypto.
💬 Trusted by the world’s largest crypto exchange.
👍 Discover real insights from verified creators.
Email / Phone number
Trending Topics
AppleDebutsFoldablePhone
37,043 views
772 Discussing
Apple just dropped the foldable iPhone — and the market is paying attention. This isn't just another product cycle; it's a new product category, a new CEO on stage, and a $1,999 price tag that pushes $AAPL further into ultra-premium territory. Foldables are the narrative, and Apple is now the headline.
#appledebutsfoldablephone #EUExtendsCentralContactPointToCASPs #US10YTreasuryYieldHitsHighestSinceNov2023 #BrentCrudeTops$100 #USTreasuryToBuyBackUpTo$6BLongDatedDebt
KimHotbae
·2 Likes
·2.9k views
TSMCAugustRevenueUp53.3%YoY
6,235 views
209 Discussing
IranSaysReadyToEscalateWarWithUS
9,727 views
232 Discussing