

币圈女菩萨
970 Posts

币圈女菩萨
 Square Verified
Report
Block User
我瞎说我的,您随意看

Macro KOL
22 Following
501 Followers
480 Liked
1 Badges
Posts
·
--
Is a 12% gain in CEG enough reason to chase the stock?
It’s certainly encouraging that Google has signed a long-term power purchase agreement, but over the next two or three trading sessions, I think CEG may pull back first. It surged 12% in one day yesterday, then slipped back to around $290 in premarket trading tonight. The first batch of additional capacity is expected to come online in 2028, and I’m concerned the stock has already priced in too much of the future benefit.
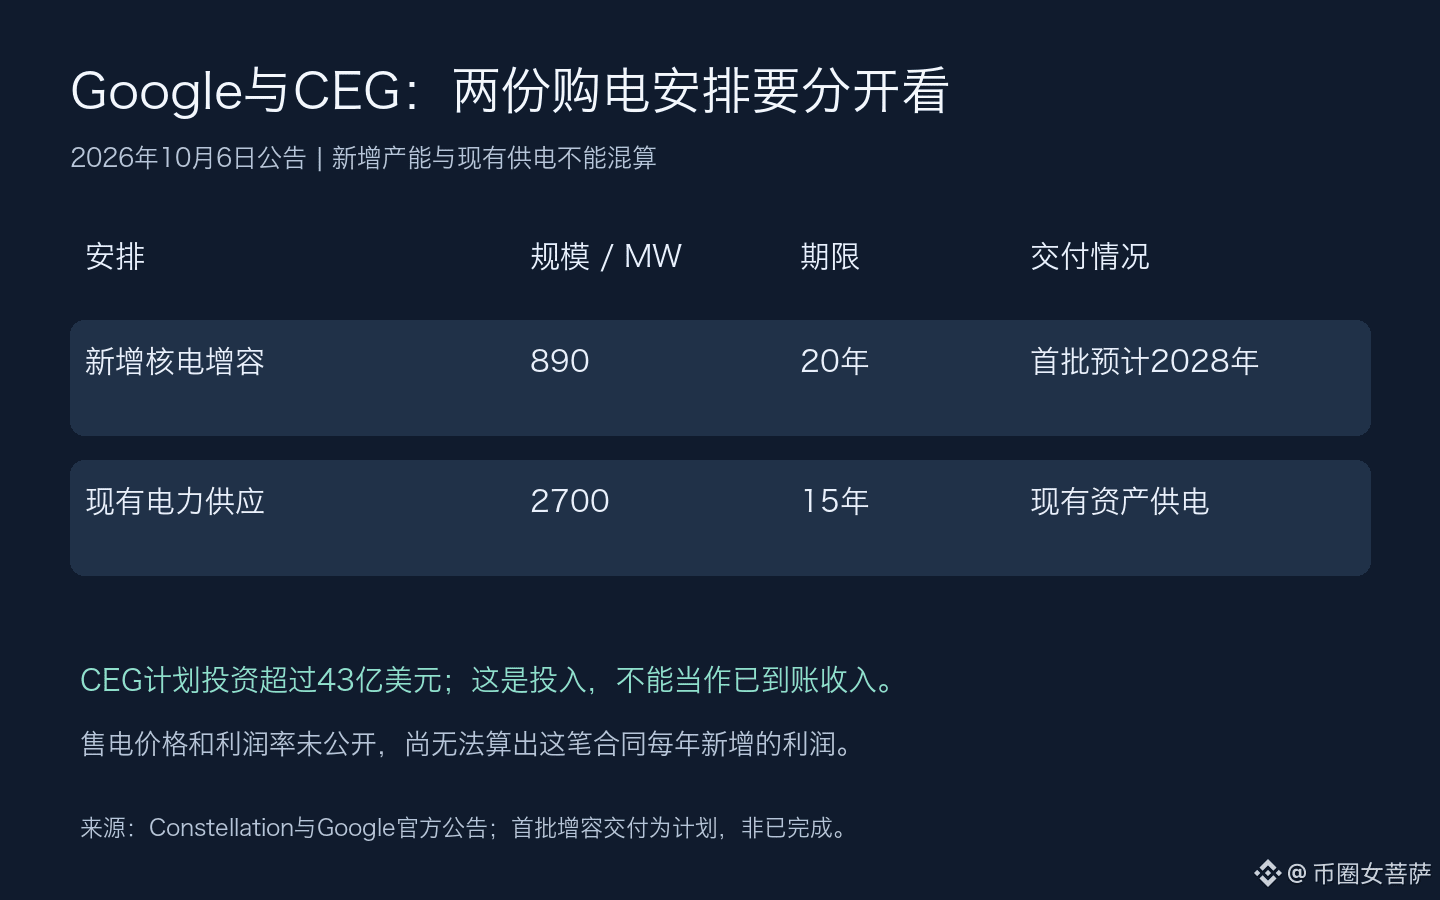
Google’s willingness to buy power for 20 years gives CEG more confidence to spend money upgrading its existing nuclear plants. This will add 890 MW of generating capacity. The two companies also have a separate agreement for 2,700 MW of existing power supply over 15 years; that should not be counted as additional capacity. Having a major customer commit to buying power in advance is good for the company.
That said, CEG still needs to invest more than $4.3 billion, and the first capacity expansion is expected to come online in 2028. The $4.3 billion is money CEG will invest, not revenue Google has already paid it. The electricity prices and profit margins haven’t been disclosed, so there’s no way to calculate yet how much more this deal will earn the company each year.
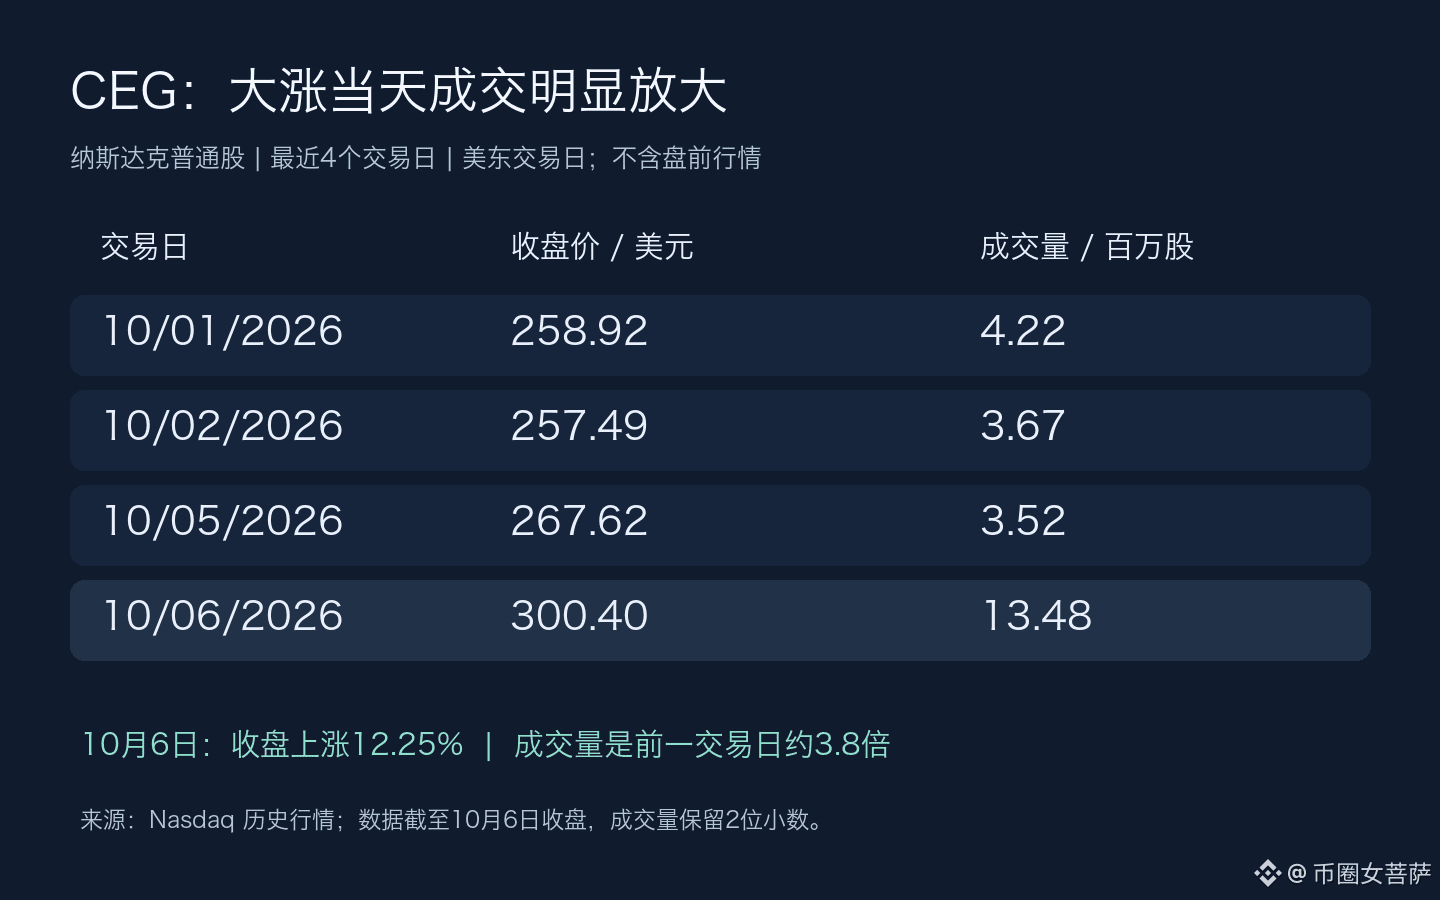
Yesterday, CEG rose 12.25% to close at $300.40, on volume about 3.8 times the previous day’s level. Buyers were clearly active. But after reaching $309.80 intraday, the stock pulled back, and it’s also giving up some of yesterday’s gains in premarket trading today. Premarket trading is limited, so this pullback doesn’t prove the stock will fall after the open. That’s one reason I’m leaving some room for uncertainty in my short-term outlook.
In August, the company gave full-year adjusted EPS guidance of $11.50 to $12.50. Using the midpoint of $12, yesterday’s closing price implies about 25 times earnings on that basis. A 25x multiple alone doesn’t prove the stock is expensive; we’d also need to consider how much more it could earn in the future. I think it’s a little premature to calculate a new price target without knowing the contract price.
The Federal Reserve’s meeting minutes are also due at 2 a.m. Beijing time tomorrow. The results aren’t out yet. If the market reads them as pointing to a stronger inclination to raise rates, investors may be less willing to pay a high price for profits several years down the road. If the stock can climb back to around $300 tonight and hold there, I’d be more inclined to think this rally can continue. If it keeps falling after the open, I’d rather wait for a pullback.
This big deal has made me a little more optimistic about the nuclear power business, but chasing the stock right after a 12% surge still doesn’t appeal to me—for now.
#美股 #核电 #AI Power
Is a 12% gain in CEG enough reason to chase the stock?
It’s certainly encouraging that Google has signed a long-term power purchase agreement, but over the next two or three trading sessions, I think CEG may pull back first. It surged 12% in one day yesterday, then slipped back to around $290 in premarket trading tonight. The first batch of additional capacity is expected to come online in 2028, and I’m concerned the stock has already priced in too much of the future benefit.
Google’s willingness to buy power for 20 years gives CEG more confidence to spend money upgrading its existing nuclear plants. This will add 890 MW of generating capacity. The two companies also have a separate agreement for 2,700 MW of existing power supply over 15 years; that should not be counted as additional capacity. Having a major customer commit to buying power in advance is good for the company.
That said, CEG still needs to invest more than $4.3 billion, and the first capacity expansion is expected to come online in 2028. The $4.3 billion is money CEG will invest, not revenue Google has already paid it. The electricity prices and profit margins haven’t been disclosed, so there’s no way to calculate yet how much more this deal will earn the company each year.
Yesterday, CEG rose 12.25% to close at $300.40, on volume about 3.8 times the previous day’s level. Buyers were clearly active. But after reaching $309.80 intraday, the stock pulled back, and it’s also giving up some of yesterday’s gains in premarket trading today. Premarket trading is limited, so this pullback doesn’t prove the stock will fall after the open. That’s one reason I’m leaving some room for uncertainty in my short-term outlook.
In August, the company gave full-year adjusted EPS guidance of $11.50 to $12.50. Using the midpoint of $12, yesterday’s closing price implies about 25 times earnings on that basis. A 25x multiple alone doesn’t prove the stock is expensive; we’d also need to consider how much more it could earn in the future. I think it’s a little premature to calculate a new price target without knowing the contract price.
The Federal Reserve’s meeting minutes are also due at 2 a.m. Beijing time tomorrow. The results aren’t out yet. If the market reads them as pointing to a stronger inclination to raise rates, investors may be less willing to pay a high price for profits several years down the road. If the stock can climb back to around $300 tonight and hold there, I’d be more inclined to think this rally can continue. If it keeps falling after the open, I’d rather wait for a pullback.
This big deal has made me a little more optimistic about the nuclear power business, but chasing the stock right after a 12% surge still doesn’t appeal to me—for now.
#美股 #核电 #AI Power
It’s certainly encouraging that Google has signed a long-term power purchase agreement, but over the next two or three trading sessions, I think CEG may pull back first. It surged 12% in one day yesterday, then slipped back to around $290 in premarket trading tonight. The first batch of additional capacity is expected to come online in 2028, and I’m concerned the stock has already priced in too much of the future benefit.
Google’s willingness to buy power for 20 years gives CEG more confidence to spend money upgrading its existing nuclear plants. This will add 890 MW of generating capacity. The two companies also have a separate agreement for 2,700 MW of existing power supply over 15 years; that should not be counted as additional capacity. Having a major customer commit to buying power in advance is good for the company.
That said, CEG still needs to invest more than $4.3 billion, and the first capacity expansion is expected to come online in 2028. The $4.3 billion is money CEG will invest, not revenue Google has already paid it. The electricity prices and profit margins haven’t been disclosed, so there’s no way to calculate yet how much more this deal will earn the company each year.
Yesterday, CEG rose 12.25% to close at $300.40, on volume about 3.8 times the previous day’s level. Buyers were clearly active. But after reaching $309.80 intraday, the stock pulled back, and it’s also giving up some of yesterday’s gains in premarket trading today. Premarket trading is limited, so this pullback doesn’t prove the stock will fall after the open. That’s one reason I’m leaving some room for uncertainty in my short-term outlook.
In August, the company gave full-year adjusted EPS guidance of $11.50 to $12.50. Using the midpoint of $12, yesterday’s closing price implies about 25 times earnings on that basis. A 25x multiple alone doesn’t prove the stock is expensive; we’d also need to consider how much more it could earn in the future. I think it’s a little premature to calculate a new price target without knowing the contract price.
The Federal Reserve’s meeting minutes are also due at 2 a.m. Beijing time tomorrow. The results aren’t out yet. If the market reads them as pointing to a stronger inclination to raise rates, investors may be less willing to pay a high price for profits several years down the road. If the stock can climb back to around $300 tonight and hold there, I’d be more inclined to think this rally can continue. If it keeps falling after the open, I’d rather wait for a pullback.
This big deal has made me a little more optimistic about the nuclear power business, but chasing the stock right after a 12% surge still doesn’t appeal to me—for now.
#美股 #核电 #AI Power
116
·
--
AMD rises to $649, while Lisa Su is still working to secure capacity
This week, I’m more inclined to see AMD continue moving higher. Lisa Su said yesterday that the company plans to significantly increase chip supply next year and is still working with supply-chain partners to coordinate capacity. That makes me somewhat optimistic, as it suggests the company remains confident in future demand. This is about AMD stock on the Nasdaq.
According to Reuters, Su’s trip to Taiwan is aimed at coordinating CPU and GPU production, and she is also seeking supplies from memory makers. AMD has already increased supply this year and wants to expand further next year. If demand holds up, shipping more products could bring in more revenue. But this plan has not yet translated into next year’s sales.
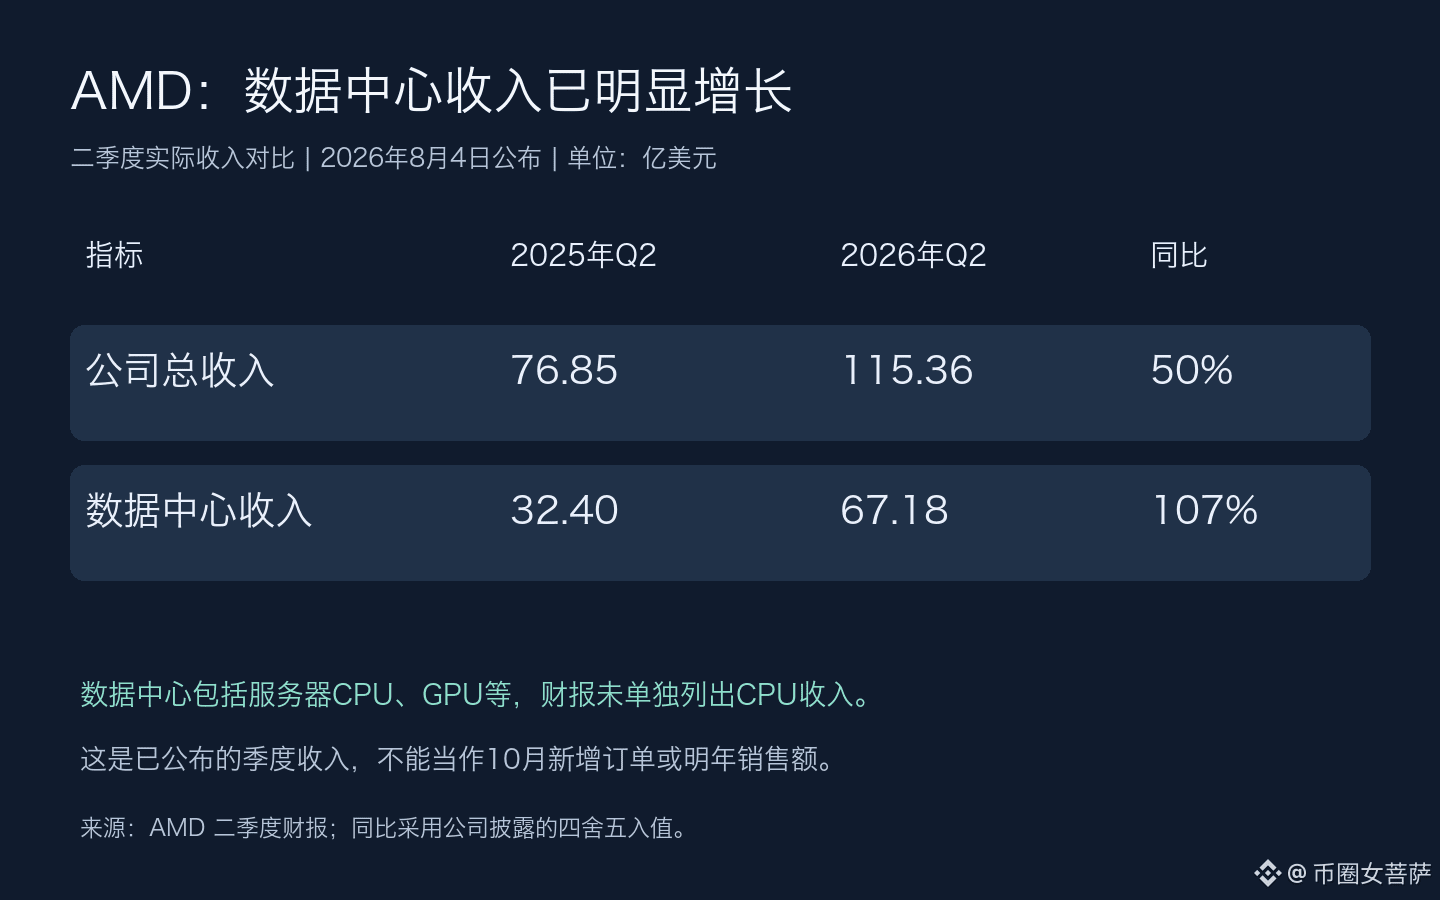
In its second-quarter results announced in August, data-center revenue came to $6.718 billion, up 107% year over year. AMD said demand was strong for both EPYC server CPUs and Instinct GPUs. That growth is already reflected in revenue, and next I want to see whether expanded capacity can sustain it. Those older results help explain why the company wants to expand capacity, but they shouldn’t be treated as evidence that it landed new orders yesterday.
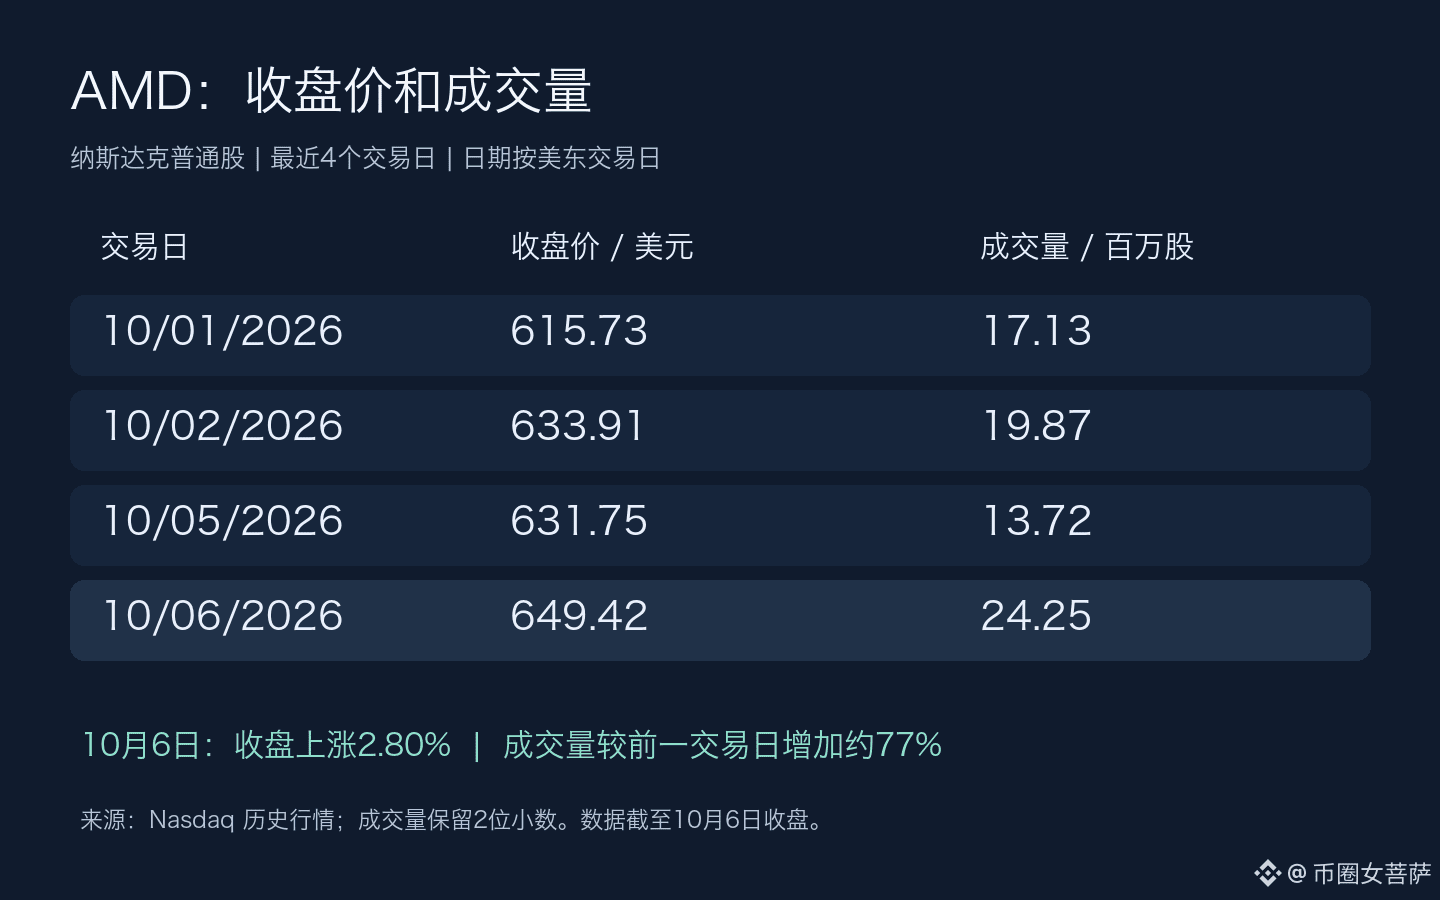
AMD rose 2.80% yesterday to close at $649.42, with volume markedly higher than in the previous session. The closing price also moved above last Friday’s intraday high. The rise was backed by trading volume, and the stock held onto its gains by the close—another reason I think it could keep strengthening. It was around $647 in premarket trading today, a modest pullback for now.
StreetInsider reported yesterday that Mizuho analyst Vijay Rakesh raised his price target from $580 to $705 and maintained an Outperform rating. $705 certainly looks appealing, but that is an analyst’s estimate, not a price AMD is guaranteed to reach this week. Whether deliveries keep pace and costs rise will both affect how much the company ultimately earns.
One thing keeping me cautious is the Federal Reserve meeting minutes, due at 2 a.m. Beijing time tomorrow. If the market interprets them as signaling a stronger inclination to raise rates, investors may be willing to pay less for future growth. If AMD falls back toward $630 and continues to weaken, I’ll focus on the pullback. That area is close to yesterday’s low and the previous session’s close; if the stock falls that far, its price action after the rally will be less convincing.
When AMD reports earnings again on November 3, what I’ll most want to know is how much of this demand has already translated into revenue. Capacity expansion gives me reason to be optimistic, but deliveries and profits still need to follow through.
#AMD #美股 #AI chip
AMD rises to $649, while Lisa Su is still working to secure capacity
This week, I’m more inclined to see AMD continue moving higher. Lisa Su said yesterday that the company plans to significantly increase chip supply next year and is still working with supply-chain partners to coordinate capacity. That makes me somewhat optimistic, as it suggests the company remains confident in future demand. This is about AMD stock on the Nasdaq.
According to Reuters, Su’s trip to Taiwan is aimed at coordinating CPU and GPU production, and she is also seeking supplies from memory makers. AMD has already increased supply this year and wants to expand further next year. If demand holds up, shipping more products could bring in more revenue. But this plan has not yet translated into next year’s sales.
In its second-quarter results announced in August, data-center revenue came to $6.718 billion, up 107% year over year. AMD said demand was strong for both EPYC server CPUs and Instinct GPUs. That growth is already reflected in revenue, and next I want to see whether expanded capacity can sustain it. Those older results help explain why the company wants to expand capacity, but they shouldn’t be treated as evidence that it landed new orders yesterday.
AMD rose 2.80% yesterday to close at $649.42, with volume markedly higher than in the previous session. The closing price also moved above last Friday’s intraday high. The rise was backed by trading volume, and the stock held onto its gains by the close—another reason I think it could keep strengthening. It was around $647 in premarket trading today, a modest pullback for now.
StreetInsider reported yesterday that Mizuho analyst Vijay Rakesh raised his price target from $580 to $705 and maintained an Outperform rating. $705 certainly looks appealing, but that is an analyst’s estimate, not a price AMD is guaranteed to reach this week. Whether deliveries keep pace and costs rise will both affect how much the company ultimately earns.
One thing keeping me cautious is the Federal Reserve meeting minutes, due at 2 a.m. Beijing time tomorrow. If the market interprets them as signaling a stronger inclination to raise rates, investors may be willing to pay less for future growth. If AMD falls back toward $630 and continues to weaken, I’ll focus on the pullback. That area is close to yesterday’s low and the previous session’s close; if the stock falls that far, its price action after the rally will be less convincing.
When AMD reports earnings again on November 3, what I’ll most want to know is how much of this demand has already translated into revenue. Capacity expansion gives me reason to be optimistic, but deliveries and profits still need to follow through.
#AMD #美股 #AI chip
This week, I’m more inclined to see AMD continue moving higher. Lisa Su said yesterday that the company plans to significantly increase chip supply next year and is still working with supply-chain partners to coordinate capacity. That makes me somewhat optimistic, as it suggests the company remains confident in future demand. This is about AMD stock on the Nasdaq.
According to Reuters, Su’s trip to Taiwan is aimed at coordinating CPU and GPU production, and she is also seeking supplies from memory makers. AMD has already increased supply this year and wants to expand further next year. If demand holds up, shipping more products could bring in more revenue. But this plan has not yet translated into next year’s sales.
In its second-quarter results announced in August, data-center revenue came to $6.718 billion, up 107% year over year. AMD said demand was strong for both EPYC server CPUs and Instinct GPUs. That growth is already reflected in revenue, and next I want to see whether expanded capacity can sustain it. Those older results help explain why the company wants to expand capacity, but they shouldn’t be treated as evidence that it landed new orders yesterday.
AMD rose 2.80% yesterday to close at $649.42, with volume markedly higher than in the previous session. The closing price also moved above last Friday’s intraday high. The rise was backed by trading volume, and the stock held onto its gains by the close—another reason I think it could keep strengthening. It was around $647 in premarket trading today, a modest pullback for now.
StreetInsider reported yesterday that Mizuho analyst Vijay Rakesh raised his price target from $580 to $705 and maintained an Outperform rating. $705 certainly looks appealing, but that is an analyst’s estimate, not a price AMD is guaranteed to reach this week. Whether deliveries keep pace and costs rise will both affect how much the company ultimately earns.
One thing keeping me cautious is the Federal Reserve meeting minutes, due at 2 a.m. Beijing time tomorrow. If the market interprets them as signaling a stronger inclination to raise rates, investors may be willing to pay less for future growth. If AMD falls back toward $630 and continues to weaken, I’ll focus on the pullback. That area is close to yesterday’s low and the previous session’s close; if the stock falls that far, its price action after the rally will be less convincing.
When AMD reports earnings again on November 3, what I’ll most want to know is how much of this demand has already translated into revenue. Capacity expansion gives me reason to be optimistic, but deliveries and profits still need to follow through.
#AMD #美股 #AI chip
1
128
·
--
NMR is up more than 30%, but that long upper wick is a bit of a buzzkill
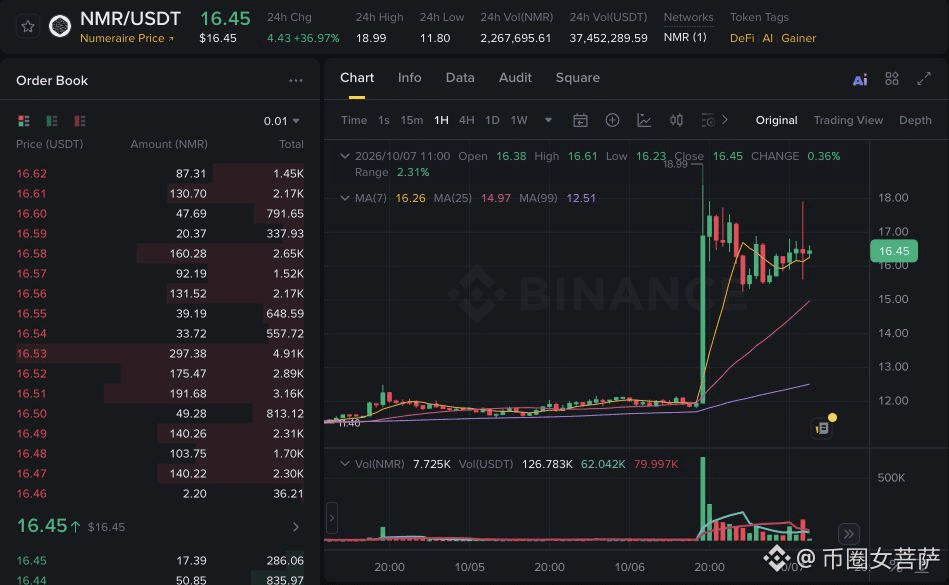
I think $NMR is more likely to spike and then pull back over the next couple of days. It’s up more than 30% in the past 24 hours, which looks pretty exciting, but this morning’s surge was pushed back down. It may not be so easy for it to keep climbing.
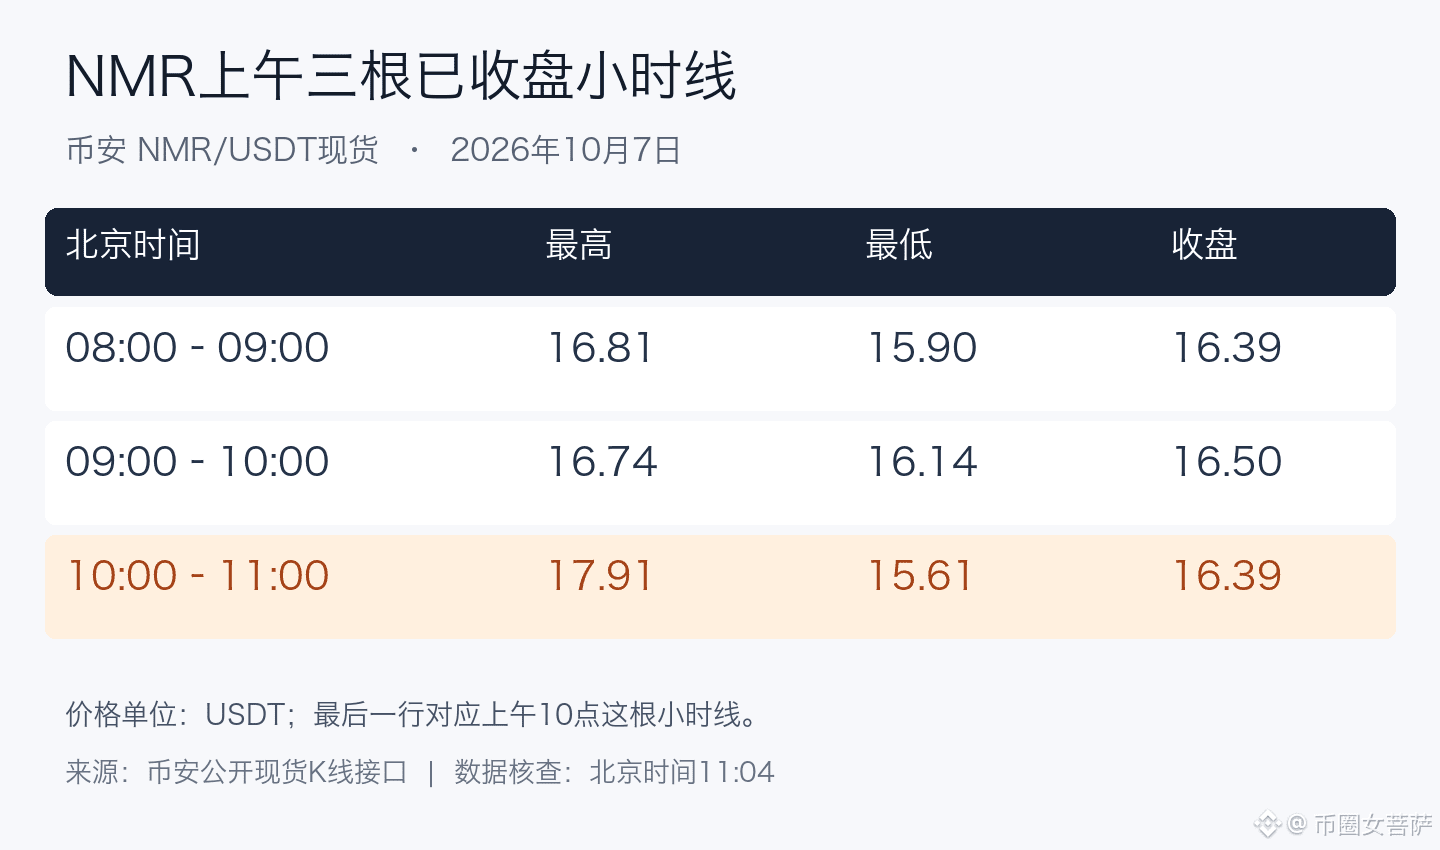
This morning, the hourly candle that opened at 10 a.m. reached a high near 17.9, but closed at only around 16.4. It also dipped to around 15.6 at one point. It rose fast and fell fast within an hour, and after all that, it closed slightly below its opening price. The second chart shows the highs, lows, and closing prices over these past few hours. The final candle’s range was noticeably larger.
What worries me is that after spiking and pulling back yesterday, it was pushed down again today from an even lower level. On both occasions, it failed to hold its price near the highs. That said, it’s still well above the area around 12 where it started rising yesterday, so I see this as a short-term pullback—not the end of the entire rally.
On the next rebound, I’d like to see it reach around 17.9 and then hold steady, rather than dropping again as soon as it gets there. If it falls back to around 15.6 and can’t hold, I think this pullback still has further to go. A bounce during the session doesn’t count as a renewed uptrend if the hourly candle hasn’t closed yet.
It’s certainly tempting when it stands out so much on the gainers list. I’d rather wait until buyers step in after a pullback, then see whether it has another leg up.
#NMR #CryptoMarket
NMR is up more than 30%, but that long upper wick is a bit of a buzzkill
I think $NMR is more likely to spike and then pull back over the next couple of days. It’s up more than 30% in the past 24 hours, which looks pretty exciting, but this morning’s surge was pushed back down. It may not be so easy for it to keep climbing.
This morning, the hourly candle that opened at 10 a.m. reached a high near 17.9, but closed at only around 16.4. It also dipped to around 15.6 at one point. It rose fast and fell fast within an hour, and after all that, it closed slightly below its opening price. The second chart shows the highs, lows, and closing prices over these past few hours. The final candle’s range was noticeably larger.
What worries me is that after spiking and pulling back yesterday, it was pushed down again today from an even lower level. On both occasions, it failed to hold its price near the highs. That said, it’s still well above the area around 12 where it started rising yesterday, so I see this as a short-term pullback—not the end of the entire rally.
On the next rebound, I’d like to see it reach around 17.9 and then hold steady, rather than dropping again as soon as it gets there. If it falls back to around 15.6 and can’t hold, I think this pullback still has further to go. A bounce during the session doesn’t count as a renewed uptrend if the hourly candle hasn’t closed yet.
It’s certainly tempting when it stands out so much on the gainers list. I’d rather wait until buyers step in after a pullback, then see whether it has another leg up.
#NMR #CryptoMarket
I think $NMR is more likely to spike and then pull back over the next couple of days. It’s up more than 30% in the past 24 hours, which looks pretty exciting, but this morning’s surge was pushed back down. It may not be so easy for it to keep climbing.
This morning, the hourly candle that opened at 10 a.m. reached a high near 17.9, but closed at only around 16.4. It also dipped to around 15.6 at one point. It rose fast and fell fast within an hour, and after all that, it closed slightly below its opening price. The second chart shows the highs, lows, and closing prices over these past few hours. The final candle’s range was noticeably larger.
What worries me is that after spiking and pulling back yesterday, it was pushed down again today from an even lower level. On both occasions, it failed to hold its price near the highs. That said, it’s still well above the area around 12 where it started rising yesterday, so I see this as a short-term pullback—not the end of the entire rally.
On the next rebound, I’d like to see it reach around 17.9 and then hold steady, rather than dropping again as soon as it gets there. If it falls back to around 15.6 and can’t hold, I think this pullback still has further to go. A bounce during the session doesn’t count as a renewed uptrend if the hourly candle hasn’t closed yet.
It’s certainly tempting when it stands out so much on the gainers list. I’d rather wait until buyers step in after a pullback, then see whether it has another leg up.
#NMR #CryptoMarket
3
724
·
--
Partly True
Oil prices are pulling back, so XOM may find it harder to rise this week
Oil prices are heading lower again, and I think XOM is more likely to fluctuate and pull back this week too. Expectations for oil-selling profits have lost some support, and OPEC+ maintaining its production plan cannot be treated as fresh bullish news from a production cut. This is about ExxonMobil stock listed on the NYSE.
Between 19:58 and 19:59 Beijing time, NYMEX Brent crude futures were around $97.84 a barrel, down about 2.5% from the previous session’s close. WTI was around $87.23, with a similar decline. At 20:05, XOM was quoted at $162.80 in premarket trading, about 0.7% below yesterday’s close. That premarket drop is nothing major, and certainly doesn’t mean the stock has already fallen by the close tonight.
On October 4, seven OPEC+ countries decided to maintain November production at the level called for in September. Not increasing production doesn’t mean they’ve made another cut, and this arrangement doesn’t prove that actual exports have fallen. Reuters reported today that Middle East exports remain resilient and supply concerns have eased somewhat. I’m more focused on the fact that oil prices are already falling; maintaining production alone isn’t enough to make me bullish on XOM.
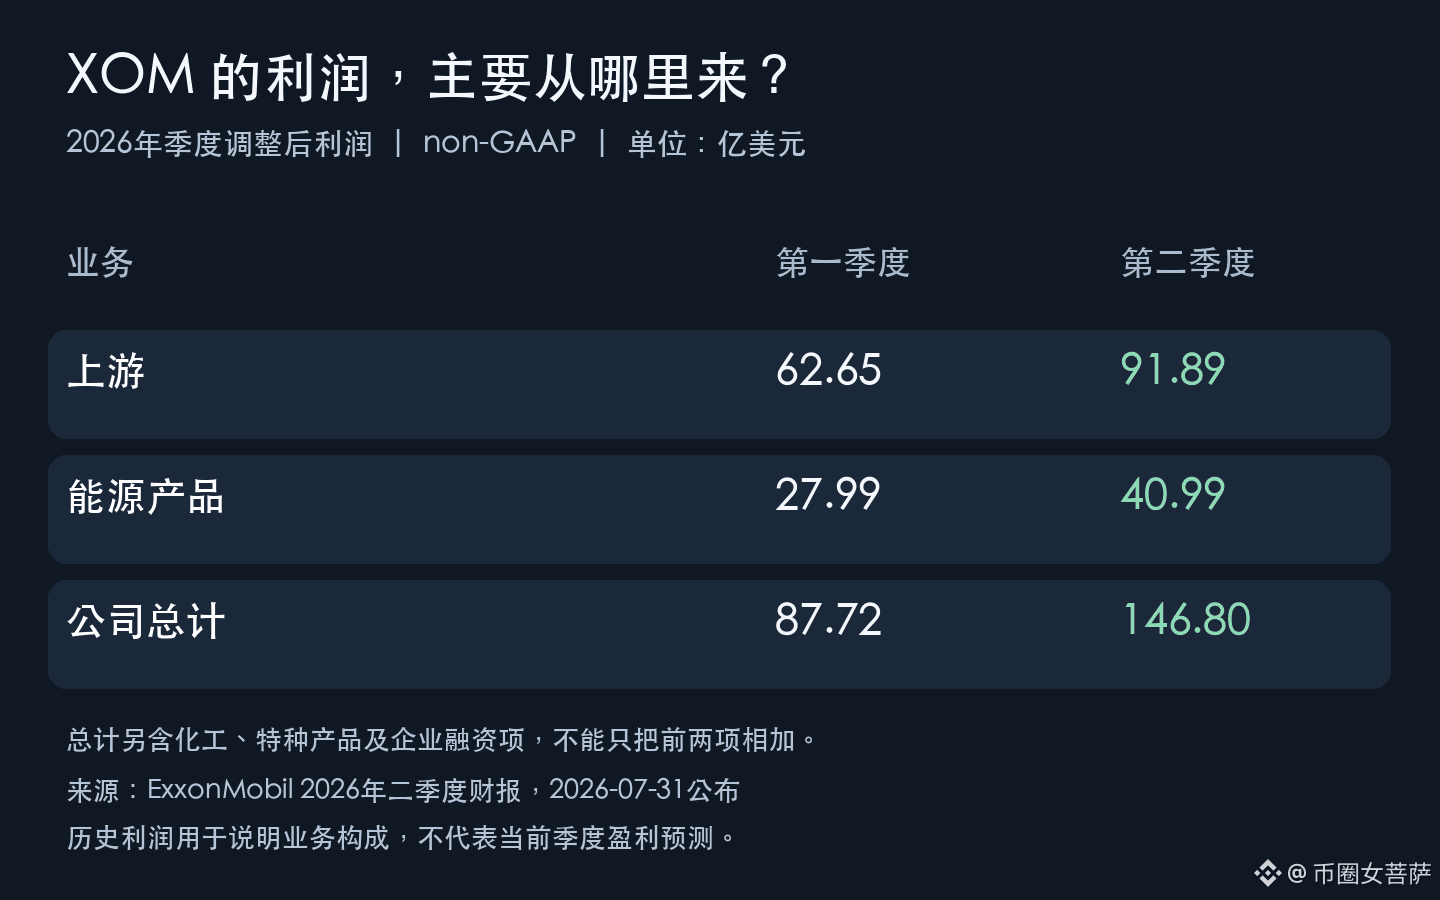
In its latest second-quarter results, XOM reported adjusted total earnings of $14.680 billion, with $9.189 billion coming from upstream operations—about 60%. Drilling for and selling oil remain its main sources of profit. If oil prices keep falling, then, with production, costs, and other conditions broadly unchanged, the amount earned per barrel will decline, and market expectations for future profits are more likely to be revised downward. That’s the main reason I expect the stock to pull back this week. There’s no way to calculate how much the share price should fall just from a 2.5% drop in oil prices.
The refining business can provide a cushion, but cheaper crude doesn’t necessarily mean refining will become more profitable. It also depends on whether gasoline and diesel prices fall along with crude, and how much of a spread remains over raw material costs. We can’t assume that all the upstream earnings lost will be made up elsewhere.
Supply risks remain the biggest variable. Reuters quoted Tim Waterer, an analyst at KCM Trade, as saying that oil prices will remain supported without a diplomatic breakthrough or further improvements in export efficiency. I agree that this is a valid counterargument. If renewed export disruptions are confirmed and oil prices recover the losses of the past two days, I’ll turn bullish on XOM again.
Second-quarter earnings were indeed impressive, but that money has already been earned. Oil prices are falling now, so we shouldn’t rely on the last earnings report to expect the stock to keep rising this week.
#XOM #美股 #CrudeOil
Oil prices are pulling back, so XOM may find it harder to rise this week
Oil prices are heading lower again, and I think XOM is more likely to fluctuate and pull back this week too. Expectations for oil-selling profits have lost some support, and OPEC+ maintaining its production plan cannot be treated as fresh bullish news from a production cut. This is about ExxonMobil stock listed on the NYSE.
Between 19:58 and 19:59 Beijing time, NYMEX Brent crude futures were around $97.84 a barrel, down about 2.5% from the previous session’s close. WTI was around $87.23, with a similar decline. At 20:05, XOM was quoted at $162.80 in premarket trading, about 0.7% below yesterday’s close. That premarket drop is nothing major, and certainly doesn’t mean the stock has already fallen by the close tonight.
On October 4, seven OPEC+ countries decided to maintain November production at the level called for in September. Not increasing production doesn’t mean they’ve made another cut, and this arrangement doesn’t prove that actual exports have fallen. Reuters reported today that Middle East exports remain resilient and supply concerns have eased somewhat. I’m more focused on the fact that oil prices are already falling; maintaining production alone isn’t enough to make me bullish on XOM.
In its latest second-quarter results, XOM reported adjusted total earnings of $14.680 billion, with $9.189 billion coming from upstream operations—about 60%. Drilling for and selling oil remain its main sources of profit. If oil prices keep falling, then, with production, costs, and other conditions broadly unchanged, the amount earned per barrel will decline, and market expectations for future profits are more likely to be revised downward. That’s the main reason I expect the stock to pull back this week. There’s no way to calculate how much the share price should fall just from a 2.5% drop in oil prices.
The refining business can provide a cushion, but cheaper crude doesn’t necessarily mean refining will become more profitable. It also depends on whether gasoline and diesel prices fall along with crude, and how much of a spread remains over raw material costs. We can’t assume that all the upstream earnings lost will be made up elsewhere.
Supply risks remain the biggest variable. Reuters quoted Tim Waterer, an analyst at KCM Trade, as saying that oil prices will remain supported without a diplomatic breakthrough or further improvements in export efficiency. I agree that this is a valid counterargument. If renewed export disruptions are confirmed and oil prices recover the losses of the past two days, I’ll turn bullish on XOM again.
Second-quarter earnings were indeed impressive, but that money has already been earned. Oil prices are falling now, so we shouldn’t rely on the last earnings report to expect the stock to keep rising this week.
#XOM #美股 #CrudeOil
Oil prices are heading lower again, and I think XOM is more likely to fluctuate and pull back this week too. Expectations for oil-selling profits have lost some support, and OPEC+ maintaining its production plan cannot be treated as fresh bullish news from a production cut. This is about ExxonMobil stock listed on the NYSE.
Between 19:58 and 19:59 Beijing time, NYMEX Brent crude futures were around $97.84 a barrel, down about 2.5% from the previous session’s close. WTI was around $87.23, with a similar decline. At 20:05, XOM was quoted at $162.80 in premarket trading, about 0.7% below yesterday’s close. That premarket drop is nothing major, and certainly doesn’t mean the stock has already fallen by the close tonight.
On October 4, seven OPEC+ countries decided to maintain November production at the level called for in September. Not increasing production doesn’t mean they’ve made another cut, and this arrangement doesn’t prove that actual exports have fallen. Reuters reported today that Middle East exports remain resilient and supply concerns have eased somewhat. I’m more focused on the fact that oil prices are already falling; maintaining production alone isn’t enough to make me bullish on XOM.
In its latest second-quarter results, XOM reported adjusted total earnings of $14.680 billion, with $9.189 billion coming from upstream operations—about 60%. Drilling for and selling oil remain its main sources of profit. If oil prices keep falling, then, with production, costs, and other conditions broadly unchanged, the amount earned per barrel will decline, and market expectations for future profits are more likely to be revised downward. That’s the main reason I expect the stock to pull back this week. There’s no way to calculate how much the share price should fall just from a 2.5% drop in oil prices.
The refining business can provide a cushion, but cheaper crude doesn’t necessarily mean refining will become more profitable. It also depends on whether gasoline and diesel prices fall along with crude, and how much of a spread remains over raw material costs. We can’t assume that all the upstream earnings lost will be made up elsewhere.
Supply risks remain the biggest variable. Reuters quoted Tim Waterer, an analyst at KCM Trade, as saying that oil prices will remain supported without a diplomatic breakthrough or further improvements in export efficiency. I agree that this is a valid counterargument. If renewed export disruptions are confirmed and oil prices recover the losses of the past two days, I’ll turn bullish on XOM again.
Second-quarter earnings were indeed impressive, but that money has already been earned. Oil prices are falling now, so we shouldn’t rely on the last earnings report to expect the stock to keep rising this week.
#XOM #美股 #CrudeOil
2
862
·
--
Verified
FIL has climbed back to around 1.20. How much will the end of vesting help?
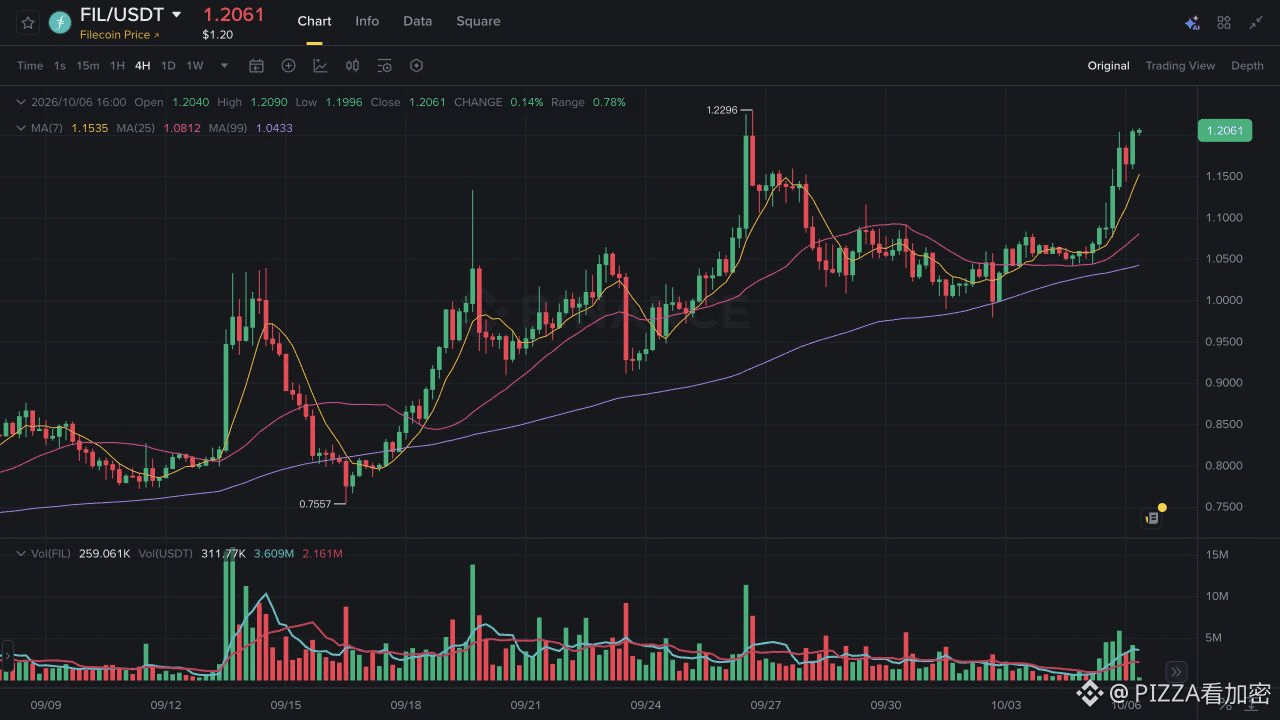
After pulling back today, FIL has climbed back to around 1.20. I’m more inclined to think the rebound still has room to run over the next few days. $FIL broke out of its weekend trading range yesterday, and today it hasn’t given back those gains. An early allocation originally scheduled to vest over six years is also nearing completion. With fewer new coins entering circulation going forward, that could help the rebound continue.
As of 16:05 Beijing time, FIL/USDT spot on Binance was trading at around 1.2013 USDT, up about 12.5% over the rolling 24 hours. On the UTC daily chart, it reached a high of 1.2046 yesterday, then pulled back to 1.1443 earlier today before climbing again. It’s now back near yesterday’s high, but the daily candle hasn’t closed yet, so it’s still unclear whether it can hold there.
Filecoin’s mainnet launched in October 2020. The initial allocations of 300 million tokens to Protocol Labs and 100 million to the Filecoin Foundation were scheduled to vest gradually over six years. The network strategy announced in February this year also noted that the final tranche of network vesting would be completed this year. This means the original schedule is nearing its end; it would be inaccurate to say the project has just announced the destruction of 400 million tokens.
Once vesting ends, fewer new tokens will enter circulation. If buying demand doesn’t fall along with it, there will be slightly less supply pressure as the price continues to rise. But it’s impossible to tell from the chart alone how much of the rise over the past two days reflects traders pricing in this expectation ahead of time.
Tokens that have already vested can still be sold, and miner rewards haven’t stopped either. The current rebound could still be interrupted by profit-taking. If FIL falls back into the weekend range of around 1.03 to 1.08, this breakout will lose its edge. I’d then expect it to continue consolidating, rather than stay bullish just because vesting is nearing its end.
For now, I still expect the rebound to continue over the next few days, but whether it can recover over the long term is a separate question. A smaller increase in supply could help, but whether customers will keep paying for storage and how much the network can earn are separate matters.
#FIL #Filecoin #TokenVesting
FIL has climbed back to around 1.20. How much will the end of vesting help?
After pulling back today, FIL has climbed back to around 1.20. I’m more inclined to think the rebound still has room to run over the next few days. $FIL broke out of its weekend trading range yesterday, and today it hasn’t given back those gains. An early allocation originally scheduled to vest over six years is also nearing completion. With fewer new coins entering circulation going forward, that could help the rebound continue.
As of 16:05 Beijing time, FIL/USDT spot on Binance was trading at around 1.2013 USDT, up about 12.5% over the rolling 24 hours. On the UTC daily chart, it reached a high of 1.2046 yesterday, then pulled back to 1.1443 earlier today before climbing again. It’s now back near yesterday’s high, but the daily candle hasn’t closed yet, so it’s still unclear whether it can hold there.
Filecoin’s mainnet launched in October 2020. The initial allocations of 300 million tokens to Protocol Labs and 100 million to the Filecoin Foundation were scheduled to vest gradually over six years. The network strategy announced in February this year also noted that the final tranche of network vesting would be completed this year. This means the original schedule is nearing its end; it would be inaccurate to say the project has just announced the destruction of 400 million tokens.
Once vesting ends, fewer new tokens will enter circulation. If buying demand doesn’t fall along with it, there will be slightly less supply pressure as the price continues to rise. But it’s impossible to tell from the chart alone how much of the rise over the past two days reflects traders pricing in this expectation ahead of time.
Tokens that have already vested can still be sold, and miner rewards haven’t stopped either. The current rebound could still be interrupted by profit-taking. If FIL falls back into the weekend range of around 1.03 to 1.08, this breakout will lose its edge. I’d then expect it to continue consolidating, rather than stay bullish just because vesting is nearing its end.
For now, I still expect the rebound to continue over the next few days, but whether it can recover over the long term is a separate question. A smaller increase in supply could help, but whether customers will keep paying for storage and how much the network can earn are separate matters.
#FIL #Filecoin #TokenVesting
After pulling back today, FIL has climbed back to around 1.20. I’m more inclined to think the rebound still has room to run over the next few days. $FIL broke out of its weekend trading range yesterday, and today it hasn’t given back those gains. An early allocation originally scheduled to vest over six years is also nearing completion. With fewer new coins entering circulation going forward, that could help the rebound continue.
As of 16:05 Beijing time, FIL/USDT spot on Binance was trading at around 1.2013 USDT, up about 12.5% over the rolling 24 hours. On the UTC daily chart, it reached a high of 1.2046 yesterday, then pulled back to 1.1443 earlier today before climbing again. It’s now back near yesterday’s high, but the daily candle hasn’t closed yet, so it’s still unclear whether it can hold there.
Filecoin’s mainnet launched in October 2020. The initial allocations of 300 million tokens to Protocol Labs and 100 million to the Filecoin Foundation were scheduled to vest gradually over six years. The network strategy announced in February this year also noted that the final tranche of network vesting would be completed this year. This means the original schedule is nearing its end; it would be inaccurate to say the project has just announced the destruction of 400 million tokens.
Once vesting ends, fewer new tokens will enter circulation. If buying demand doesn’t fall along with it, there will be slightly less supply pressure as the price continues to rise. But it’s impossible to tell from the chart alone how much of the rise over the past two days reflects traders pricing in this expectation ahead of time.
Tokens that have already vested can still be sold, and miner rewards haven’t stopped either. The current rebound could still be interrupted by profit-taking. If FIL falls back into the weekend range of around 1.03 to 1.08, this breakout will lose its edge. I’d then expect it to continue consolidating, rather than stay bullish just because vesting is nearing its end.
For now, I still expect the rebound to continue over the next few days, but whether it can recover over the long term is a separate question. A smaller increase in supply could help, but whether customers will keep paying for storage and how much the network can earn are separate matters.
#FIL #Filecoin #TokenVesting
4
2.8k
·
--
Verified
BTC’s rebound didn’t hold, and U.S. businesses’ costs are still rising
I expect $BTC to remain prone to bouncing and then falling back over the next day or two. Last night’s ISM report did little to strengthen the case for rate cuts. Businesses’ purchasing costs are still rising, and BTC failed to hold the highs it reached after the weekend rebound.
The services PMI released last night fell from 55.4 to 54.9, signaling slower growth, though the sector is still expanding overall. The prices component actually rose from 72.6 to 74, while the employment component rebounded from 47.8 to 50.1. Services-sector growth slowed a little, but purchasing costs haven’t eased, and hiring hasn’t continued to deteriorate.
I think it’s too big a leap to see the headline index fall and expect interest rates to come down right away. The Fed only raised rates by 25 basis points on September 16 and is still emphasizing that inflation is elevated. These cost figures make it harder for the Fed to cut rates in a hurry. If rates stay high, borrowing to buy BTC won’t get any cheaper, and buyers may not be willing to take on more leverage.
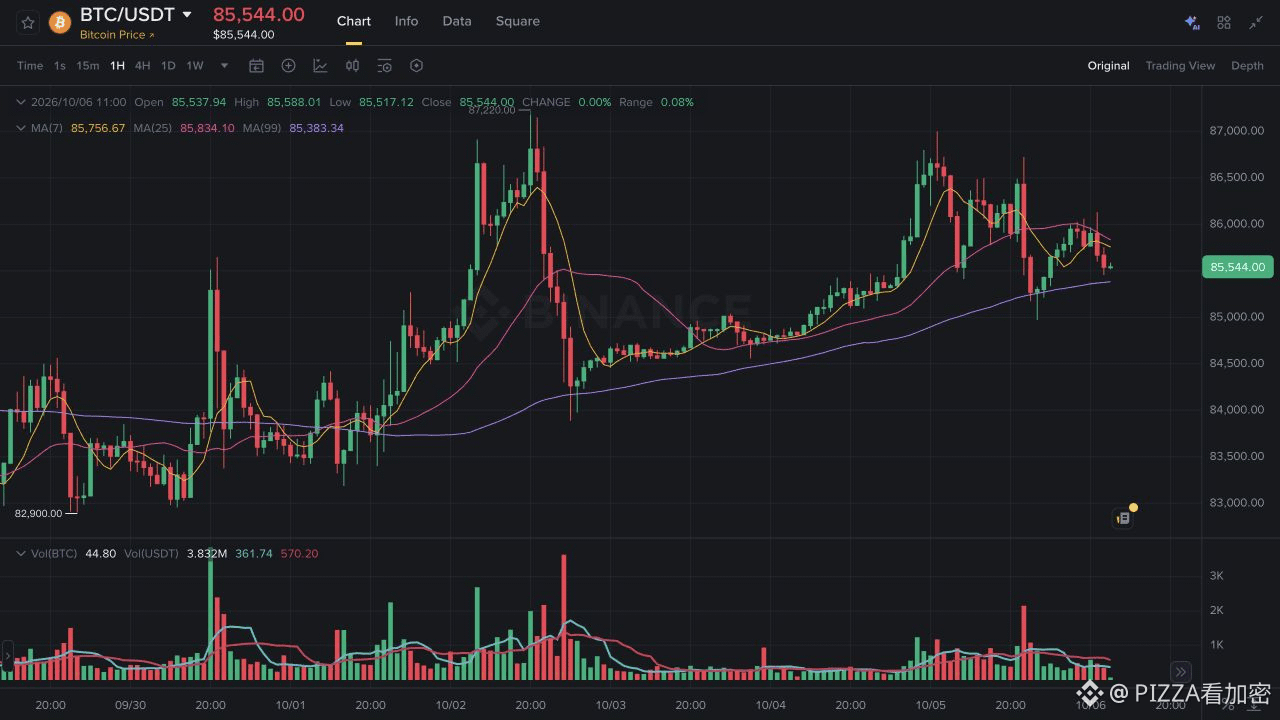
As of 11:09 Beijing time, BTC/USDT spot on Binance was around 85,545 USDT. On the UTC daily chart, Monday’s high came close to 86,999, but it closed at just 85,767, already below Sunday’s close. BTC did briefly rise after last night’s report, so this pullback can’t be blamed entirely on the ISM data.
If BTC climbs back above the area around 87,000, where Monday’s high was, and holds there, that would mark a change from the pattern of pulling back after the last two rallies, and I’d shift to expecting the rebound to continue. If the price can climb back up, I’ll have to admit that buying pressure this time was stronger than I expected.
There’s also a positive side to the services sector still expanding: the economy hasn’t collapsed, and investors may still be willing to take risks. I’m only looking at the next day or two here; I’m not using one purchasing survey to predict next week’s CPI. Businesses may absorb higher purchasing costs themselves, or pass them on through higher prices. We’ll need actual data to see what happens to inflation next.
#BTC #ISM #美联储
BTC’s rebound didn’t hold, and U.S. businesses’ costs are still rising
I expect $BTC to remain prone to bouncing and then falling back over the next day or two. Last night’s ISM report did little to strengthen the case for rate cuts. Businesses’ purchasing costs are still rising, and BTC failed to hold the highs it reached after the weekend rebound.
The services PMI released last night fell from 55.4 to 54.9, signaling slower growth, though the sector is still expanding overall. The prices component actually rose from 72.6 to 74, while the employment component rebounded from 47.8 to 50.1. Services-sector growth slowed a little, but purchasing costs haven’t eased, and hiring hasn’t continued to deteriorate.
I think it’s too big a leap to see the headline index fall and expect interest rates to come down right away. The Fed only raised rates by 25 basis points on September 16 and is still emphasizing that inflation is elevated. These cost figures make it harder for the Fed to cut rates in a hurry. If rates stay high, borrowing to buy BTC won’t get any cheaper, and buyers may not be willing to take on more leverage.
As of 11:09 Beijing time, BTC/USDT spot on Binance was around 85,545 USDT. On the UTC daily chart, Monday’s high came close to 86,999, but it closed at just 85,767, already below Sunday’s close. BTC did briefly rise after last night’s report, so this pullback can’t be blamed entirely on the ISM data.
If BTC climbs back above the area around 87,000, where Monday’s high was, and holds there, that would mark a change from the pattern of pulling back after the last two rallies, and I’d shift to expecting the rebound to continue. If the price can climb back up, I’ll have to admit that buying pressure this time was stronger than I expected.
There’s also a positive side to the services sector still expanding: the economy hasn’t collapsed, and investors may still be willing to take risks. I’m only looking at the next day or two here; I’m not using one purchasing survey to predict next week’s CPI. Businesses may absorb higher purchasing costs themselves, or pass them on through higher prices. We’ll need actual data to see what happens to inflation next.
#BTC #ISM #美联储
I expect $BTC to remain prone to bouncing and then falling back over the next day or two. Last night’s ISM report did little to strengthen the case for rate cuts. Businesses’ purchasing costs are still rising, and BTC failed to hold the highs it reached after the weekend rebound.
The services PMI released last night fell from 55.4 to 54.9, signaling slower growth, though the sector is still expanding overall. The prices component actually rose from 72.6 to 74, while the employment component rebounded from 47.8 to 50.1. Services-sector growth slowed a little, but purchasing costs haven’t eased, and hiring hasn’t continued to deteriorate.
I think it’s too big a leap to see the headline index fall and expect interest rates to come down right away. The Fed only raised rates by 25 basis points on September 16 and is still emphasizing that inflation is elevated. These cost figures make it harder for the Fed to cut rates in a hurry. If rates stay high, borrowing to buy BTC won’t get any cheaper, and buyers may not be willing to take on more leverage.
As of 11:09 Beijing time, BTC/USDT spot on Binance was around 85,545 USDT. On the UTC daily chart, Monday’s high came close to 86,999, but it closed at just 85,767, already below Sunday’s close. BTC did briefly rise after last night’s report, so this pullback can’t be blamed entirely on the ISM data.
If BTC climbs back above the area around 87,000, where Monday’s high was, and holds there, that would mark a change from the pattern of pulling back after the last two rallies, and I’d shift to expecting the rebound to continue. If the price can climb back up, I’ll have to admit that buying pressure this time was stronger than I expected.
There’s also a positive side to the services sector still expanding: the economy hasn’t collapsed, and investors may still be willing to take risks. I’m only looking at the next day or two here; I’m not using one purchasing survey to predict next week’s CPI. Businesses may absorb higher purchasing costs themselves, or pass them on through higher prices. We’ll need actual data to see what happens to inflation next.
#BTC #ISM #美联储
691
·
--
NVDA’s chips that have already been sold can keep getting faster
This week, I’m more inclined to think NVDA will keep climbing. Closing prices were moving higher in the second half of last week, and OpenAI is continuing to optimize Blackwell, giving customers one more reason to stick with NVIDIA.
In a blog post on October 1, NVIDIA said GPT-6 Astra Ultrafast runs on Blackwell, and that OpenAI is still using its models to optimize GPU inference software. Machines already deployed can continue to improve their response speeds, and the same equipment can be reused for both training and inference. Customers who have already paid for the machines can keep benefiting from software improvements; when switching suppliers, they would also have to account for software and migration costs.
Even if a competitor’s chips are somewhat cheaper, customers may not be willing to immediately abandon software they’re already comfortable using. But OpenAI hasn’t chosen NVIDIA exclusively. AMD disclosed in July that OpenAI expects to begin bringing Helios online in the fourth quarter of this year. This is still a partnership plan, not something that can be treated as fully deployed. Blackwell getting faster hasn’t taken away AMD’s opportunity to win customers.
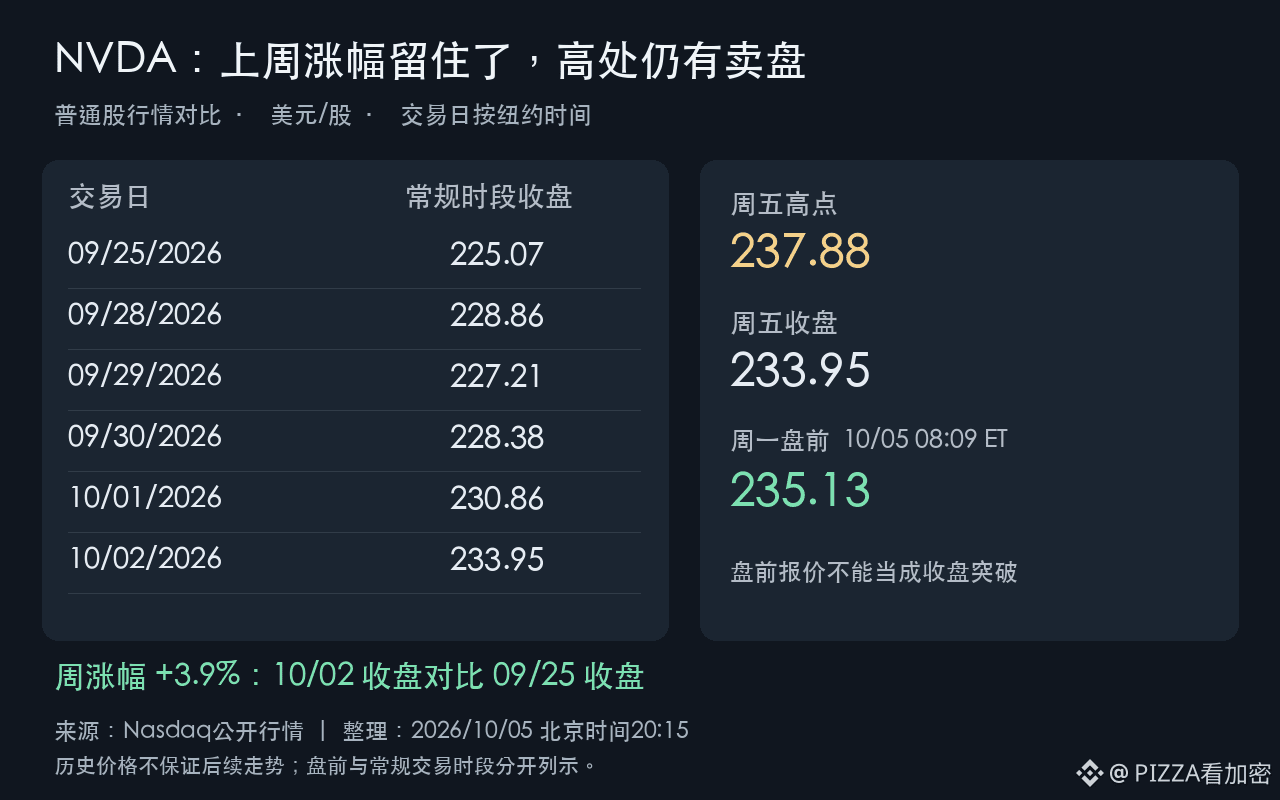
As for the stock, it closed at $233.95 last Friday, about 3.9% higher than the Friday before last. However, it reached $237.88 intraday on Friday before falling back to near that day’s low by the close. The premarket quote at 20:09 Beijing time today was $235.13, still below Friday’s high. This modest premarket gain doesn’t amount to a breakout, and Friday’s pullback also shows that there was selling at higher levels.
If the stock can move above the area around $237.88 and hold onto its gains through the close, there will be stronger grounds for expecting it to keep moving higher this week. If it fails to hold onto gains after several attempts to move higher, then falls back to last week’s early closing range of about $227 to $229, the stock is more likely to consolidate for a few days first, and there’s no need to expect the rally to continue uninterrupted for now.
ISM services data is also due at 10 p.m. tonight. If the price component adds to inflation concerns and pushes rate expectations higher, investors may mark down their valuations of future profits, which would also affect NVDA. The results aren’t out yet, so we can’t count the data as a positive in advance.
Software optimization may make customers more inclined to keep using NVIDIA, but it could also mean they need to buy fewer GPUs for the same workload. Whether NVIDIA ultimately sells more chips will depend on how quickly new demand grows. Making GPUs easier to use is a good thing, but how much more NVDA can earn from it is a separate question.
#NVDA #美股 #AI
NVDA’s chips that have already been sold can keep getting faster
This week, I’m more inclined to think NVDA will keep climbing. Closing prices were moving higher in the second half of last week, and OpenAI is continuing to optimize Blackwell, giving customers one more reason to stick with NVIDIA.
In a blog post on October 1, NVIDIA said GPT-6 Astra Ultrafast runs on Blackwell, and that OpenAI is still using its models to optimize GPU inference software. Machines already deployed can continue to improve their response speeds, and the same equipment can be reused for both training and inference. Customers who have already paid for the machines can keep benefiting from software improvements; when switching suppliers, they would also have to account for software and migration costs.
Even if a competitor’s chips are somewhat cheaper, customers may not be willing to immediately abandon software they’re already comfortable using. But OpenAI hasn’t chosen NVIDIA exclusively. AMD disclosed in July that OpenAI expects to begin bringing Helios online in the fourth quarter of this year. This is still a partnership plan, not something that can be treated as fully deployed. Blackwell getting faster hasn’t taken away AMD’s opportunity to win customers.
As for the stock, it closed at $233.95 last Friday, about 3.9% higher than the Friday before last. However, it reached $237.88 intraday on Friday before falling back to near that day’s low by the close. The premarket quote at 20:09 Beijing time today was $235.13, still below Friday’s high. This modest premarket gain doesn’t amount to a breakout, and Friday’s pullback also shows that there was selling at higher levels.
If the stock can move above the area around $237.88 and hold onto its gains through the close, there will be stronger grounds for expecting it to keep moving higher this week. If it fails to hold onto gains after several attempts to move higher, then falls back to last week’s early closing range of about $227 to $229, the stock is more likely to consolidate for a few days first, and there’s no need to expect the rally to continue uninterrupted for now.
ISM services data is also due at 10 p.m. tonight. If the price component adds to inflation concerns and pushes rate expectations higher, investors may mark down their valuations of future profits, which would also affect NVDA. The results aren’t out yet, so we can’t count the data as a positive in advance.
Software optimization may make customers more inclined to keep using NVIDIA, but it could also mean they need to buy fewer GPUs for the same workload. Whether NVIDIA ultimately sells more chips will depend on how quickly new demand grows. Making GPUs easier to use is a good thing, but how much more NVDA can earn from it is a separate question.
#NVDA #美股 #AI
This week, I’m more inclined to think NVDA will keep climbing. Closing prices were moving higher in the second half of last week, and OpenAI is continuing to optimize Blackwell, giving customers one more reason to stick with NVIDIA.
In a blog post on October 1, NVIDIA said GPT-6 Astra Ultrafast runs on Blackwell, and that OpenAI is still using its models to optimize GPU inference software. Machines already deployed can continue to improve their response speeds, and the same equipment can be reused for both training and inference. Customers who have already paid for the machines can keep benefiting from software improvements; when switching suppliers, they would also have to account for software and migration costs.
Even if a competitor’s chips are somewhat cheaper, customers may not be willing to immediately abandon software they’re already comfortable using. But OpenAI hasn’t chosen NVIDIA exclusively. AMD disclosed in July that OpenAI expects to begin bringing Helios online in the fourth quarter of this year. This is still a partnership plan, not something that can be treated as fully deployed. Blackwell getting faster hasn’t taken away AMD’s opportunity to win customers.
As for the stock, it closed at $233.95 last Friday, about 3.9% higher than the Friday before last. However, it reached $237.88 intraday on Friday before falling back to near that day’s low by the close. The premarket quote at 20:09 Beijing time today was $235.13, still below Friday’s high. This modest premarket gain doesn’t amount to a breakout, and Friday’s pullback also shows that there was selling at higher levels.
If the stock can move above the area around $237.88 and hold onto its gains through the close, there will be stronger grounds for expecting it to keep moving higher this week. If it fails to hold onto gains after several attempts to move higher, then falls back to last week’s early closing range of about $227 to $229, the stock is more likely to consolidate for a few days first, and there’s no need to expect the rally to continue uninterrupted for now.
ISM services data is also due at 10 p.m. tonight. If the price component adds to inflation concerns and pushes rate expectations higher, investors may mark down their valuations of future profits, which would also affect NVDA. The results aren’t out yet, so we can’t count the data as a positive in advance.
Software optimization may make customers more inclined to keep using NVIDIA, but it could also mean they need to buy fewer GPUs for the same workload. Whether NVIDIA ultimately sells more chips will depend on how quickly new demand grows. Making GPUs easier to use is a good thing, but how much more NVDA can earn from it is a separate question.
#NVDA #美股 #AI
1
126
·
--
PEPE has moved first; the ETF is still going through the process
I think $PEPE could keep pushing higher over the next couple of days. The weekend lows have been rising, and today it moved above the weekend high. The rebound also has more momentum than yesterday. That said, my bullish view is based on price action over the past few days; ETF-related money shouldn’t be counted in advance.
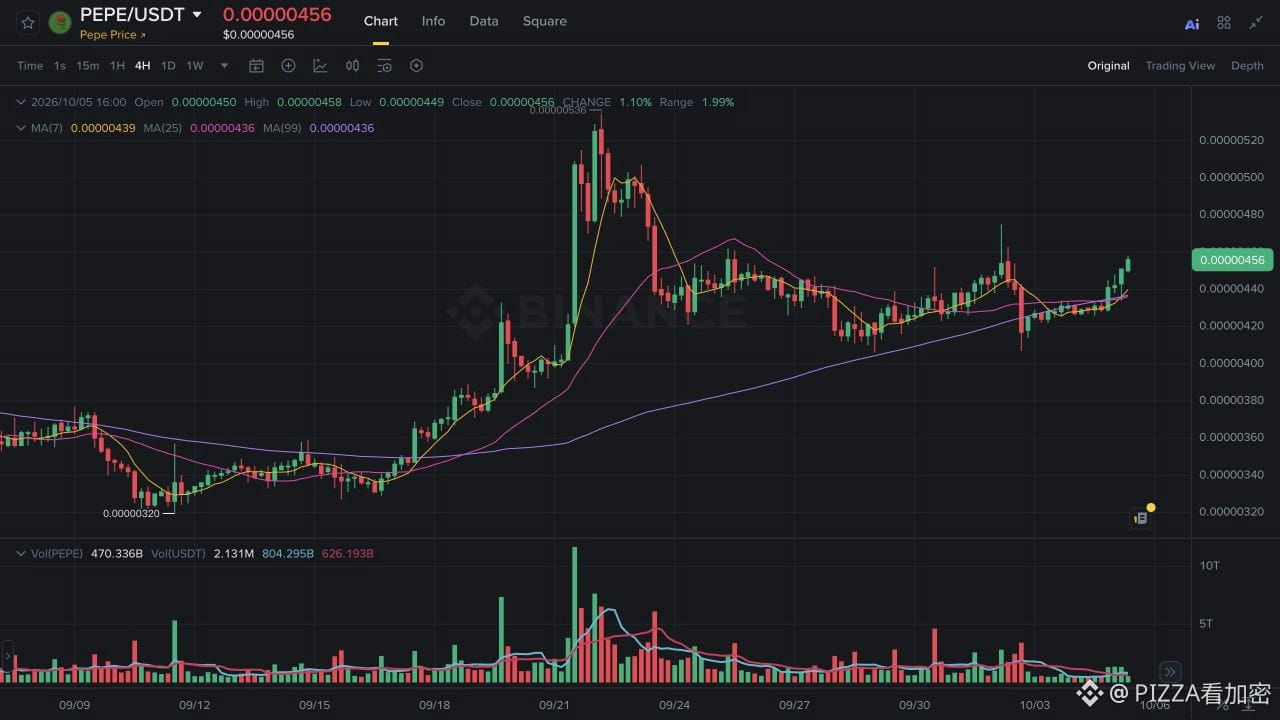
At 16:30 Beijing time, PEPE/USDT on Binance was around 0.00000455, up about 6.1% over the rolling 24 hours. On the UTC daily chart, Saturday’s low was 0.00000422, Sunday’s was 0.00000426, and today’s low so far was 0.00000434. The lows have been moving higher on pullbacks, and today’s price has also moved above Sunday’s high of 0.00000445.
Friday’s high of 0.00000475 is still overhead. If buyers step in around 0.00000445 on the next pullback, I’d be more inclined to think the rebound can continue. If it drops back toward today’s low, that short-term edge will weaken. Today’s daily candle hasn’t closed yet, so it could still retreat after breaking above that level intraday.
Canary submitted an amended S-1/A on October 2; the initial S-1 was filed back on April 8. The amendment still says these shares cannot be sold before the registration statement becomes effective, and it doesn’t specify the quantity or amount of PEPE purchased by seed investors. This filing alone isn’t enough to work out how much PEPE the ETF has bought.
Once it launches and sees net inflows, the fund would need to receive PEPE or buy it with cash, which could add to demand. But the market can also price in expectations ahead of time; it doesn’t have to wait for every step of the process to be completed before rising. FET and ADA are also up today, and the candlestick chart alone can’t tell us how much of PEPE’s rebound is driven by ETF hopes.
As for whether the ETF will let more people buy PEPE through brokerage accounts, we’ll have to wait until the application reaches the actual launch stage.
#PEPE #ETF #Meme
PEPE has moved first; the ETF is still going through the process
I think $PEPE could keep pushing higher over the next couple of days. The weekend lows have been rising, and today it moved above the weekend high. The rebound also has more momentum than yesterday. That said, my bullish view is based on price action over the past few days; ETF-related money shouldn’t be counted in advance.
At 16:30 Beijing time, PEPE/USDT on Binance was around 0.00000455, up about 6.1% over the rolling 24 hours. On the UTC daily chart, Saturday’s low was 0.00000422, Sunday’s was 0.00000426, and today’s low so far was 0.00000434. The lows have been moving higher on pullbacks, and today’s price has also moved above Sunday’s high of 0.00000445.
Friday’s high of 0.00000475 is still overhead. If buyers step in around 0.00000445 on the next pullback, I’d be more inclined to think the rebound can continue. If it drops back toward today’s low, that short-term edge will weaken. Today’s daily candle hasn’t closed yet, so it could still retreat after breaking above that level intraday.
Canary submitted an amended S-1/A on October 2; the initial S-1 was filed back on April 8. The amendment still says these shares cannot be sold before the registration statement becomes effective, and it doesn’t specify the quantity or amount of PEPE purchased by seed investors. This filing alone isn’t enough to work out how much PEPE the ETF has bought.
Once it launches and sees net inflows, the fund would need to receive PEPE or buy it with cash, which could add to demand. But the market can also price in expectations ahead of time; it doesn’t have to wait for every step of the process to be completed before rising. FET and ADA are also up today, and the candlestick chart alone can’t tell us how much of PEPE’s rebound is driven by ETF hopes.
As for whether the ETF will let more people buy PEPE through brokerage accounts, we’ll have to wait until the application reaches the actual launch stage.
#PEPE #ETF #Meme
I think $PEPE could keep pushing higher over the next couple of days. The weekend lows have been rising, and today it moved above the weekend high. The rebound also has more momentum than yesterday. That said, my bullish view is based on price action over the past few days; ETF-related money shouldn’t be counted in advance.
At 16:30 Beijing time, PEPE/USDT on Binance was around 0.00000455, up about 6.1% over the rolling 24 hours. On the UTC daily chart, Saturday’s low was 0.00000422, Sunday’s was 0.00000426, and today’s low so far was 0.00000434. The lows have been moving higher on pullbacks, and today’s price has also moved above Sunday’s high of 0.00000445.
Friday’s high of 0.00000475 is still overhead. If buyers step in around 0.00000445 on the next pullback, I’d be more inclined to think the rebound can continue. If it drops back toward today’s low, that short-term edge will weaken. Today’s daily candle hasn’t closed yet, so it could still retreat after breaking above that level intraday.
Canary submitted an amended S-1/A on October 2; the initial S-1 was filed back on April 8. The amendment still says these shares cannot be sold before the registration statement becomes effective, and it doesn’t specify the quantity or amount of PEPE purchased by seed investors. This filing alone isn’t enough to work out how much PEPE the ETF has bought.
Once it launches and sees net inflows, the fund would need to receive PEPE or buy it with cash, which could add to demand. But the market can also price in expectations ahead of time; it doesn’t have to wait for every step of the process to be completed before rising. FET and ADA are also up today, and the candlestick chart alone can’t tell us how much of PEPE’s rebound is driven by ETF hopes.
As for whether the ETF will let more people buy PEPE through brokerage accounts, we’ll have to wait until the application reaches the actual launch stage.
#PEPE #ETF #Meme
475
·
--
ZEC rebounded—can NU7 keep this momentum going?
For this round of the $ZEC rebound, I expect it to spike and then pull back again over the next one or two days. NU7 aims to make transfers faster, but the newly mined coins per day haven’t decreased as a result, and the price hasn’t escaped the downtrend from the past few days.
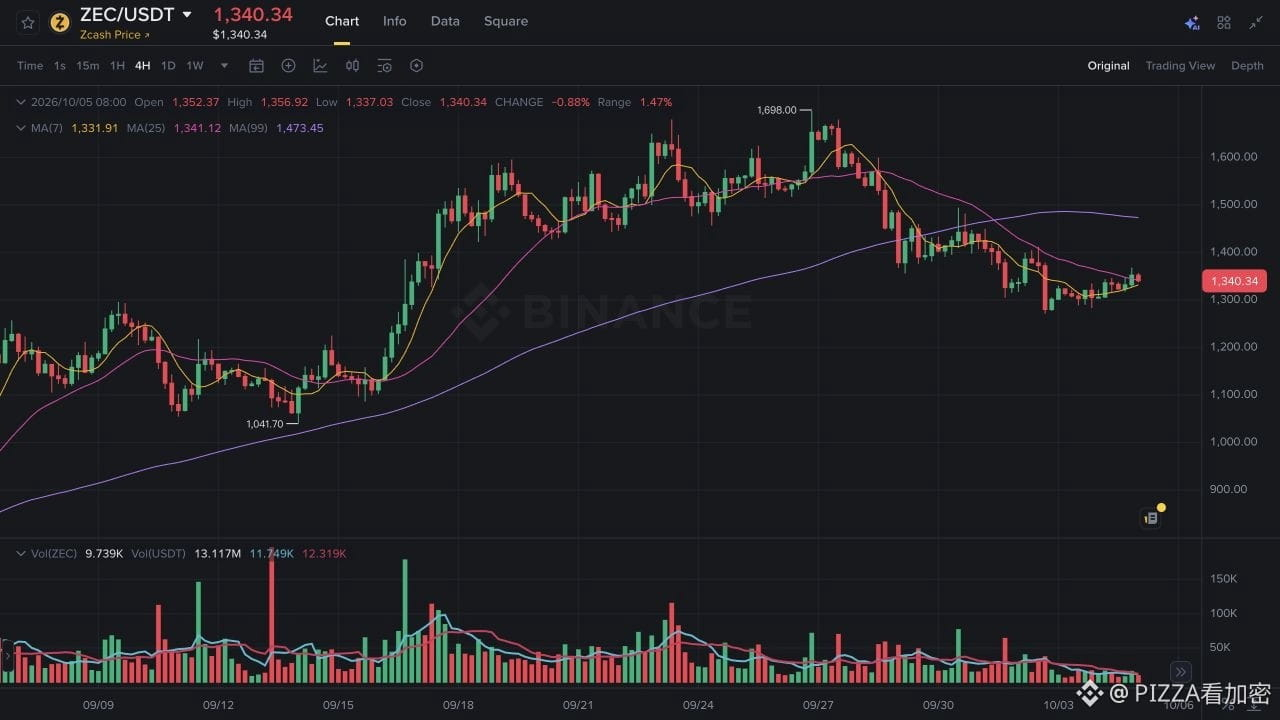
According to Binance’s UTC daily chart, from October 1 to 2, ZEC fell cumulatively by about 9.5%, while it recovered by roughly 3.9% over the weekend. The Sunday high of 1368 USDT is still below the Friday high of 1412 USDT. The weekend low did indeed rise, and that’s one reason the rebound could continue. But since the previous highs are still not being broken through, I’m more inclined to treat this as a rebound after a drop.
The NU7 proposal released by the foundation on October 2 shortens the target block interval from 75 seconds to 25 seconds, and at the same time adjusts the per-block reward to keep the daily issuance unchanged. Faster confirmation means payments and transfers will be more convenient. However, for it to affect the price, there would need to be someone willing to hold more ZEC because of it—and just looking at block speed doesn’t prove that.
Transaction fees also need to be examined carefully. The proposal directs 60% of fees into a reserve first, and then gradually uses it for block rewards later rather than having it disappear forever. How large the reserve becomes depends on actual trading activity and fee levels; you can’t just see the 60% and expect a large amount of immediate “burn.”
Continued upgrade-related headlines drawing in capital is the biggest variable in this assessment. If it breaks higher than yesterday’s high near 1368 on increased volume, and then a pullback is met with buyers again, I’d be more confident about further upside. Right now, it hasn’t reached that stage—so a move up that then falls back is still the path I’m more worried about.
According to ZIP 259 I read earlier today, the mainnet activation height will be left to be determined again on October 20. Testnet progress is definitely a good sign, but the mainnet hasn’t yet reached the point where you can directly treat it as already upgraded.
#ZEC #Zcash #NU7
ZEC rebounded—can NU7 keep this momentum going?
For this round of the $ZEC rebound, I expect it to spike and then pull back again over the next one or two days. NU7 aims to make transfers faster, but the newly mined coins per day haven’t decreased as a result, and the price hasn’t escaped the downtrend from the past few days.
According to Binance’s UTC daily chart, from October 1 to 2, ZEC fell cumulatively by about 9.5%, while it recovered by roughly 3.9% over the weekend. The Sunday high of 1368 USDT is still below the Friday high of 1412 USDT. The weekend low did indeed rise, and that’s one reason the rebound could continue. But since the previous highs are still not being broken through, I’m more inclined to treat this as a rebound after a drop.
The NU7 proposal released by the foundation on October 2 shortens the target block interval from 75 seconds to 25 seconds, and at the same time adjusts the per-block reward to keep the daily issuance unchanged. Faster confirmation means payments and transfers will be more convenient. However, for it to affect the price, there would need to be someone willing to hold more ZEC because of it—and just looking at block speed doesn’t prove that.
Transaction fees also need to be examined carefully. The proposal directs 60% of fees into a reserve first, and then gradually uses it for block rewards later rather than having it disappear forever. How large the reserve becomes depends on actual trading activity and fee levels; you can’t just see the 60% and expect a large amount of immediate “burn.”
Continued upgrade-related headlines drawing in capital is the biggest variable in this assessment. If it breaks higher than yesterday’s high near 1368 on increased volume, and then a pullback is met with buyers again, I’d be more confident about further upside. Right now, it hasn’t reached that stage—so a move up that then falls back is still the path I’m more worried about.
According to ZIP 259 I read earlier today, the mainnet activation height will be left to be determined again on October 20. Testnet progress is definitely a good sign, but the mainnet hasn’t yet reached the point where you can directly treat it as already upgraded.
#ZEC #Zcash #NU7
For this round of the $ZEC rebound, I expect it to spike and then pull back again over the next one or two days. NU7 aims to make transfers faster, but the newly mined coins per day haven’t decreased as a result, and the price hasn’t escaped the downtrend from the past few days.
According to Binance’s UTC daily chart, from October 1 to 2, ZEC fell cumulatively by about 9.5%, while it recovered by roughly 3.9% over the weekend. The Sunday high of 1368 USDT is still below the Friday high of 1412 USDT. The weekend low did indeed rise, and that’s one reason the rebound could continue. But since the previous highs are still not being broken through, I’m more inclined to treat this as a rebound after a drop.
The NU7 proposal released by the foundation on October 2 shortens the target block interval from 75 seconds to 25 seconds, and at the same time adjusts the per-block reward to keep the daily issuance unchanged. Faster confirmation means payments and transfers will be more convenient. However, for it to affect the price, there would need to be someone willing to hold more ZEC because of it—and just looking at block speed doesn’t prove that.
Transaction fees also need to be examined carefully. The proposal directs 60% of fees into a reserve first, and then gradually uses it for block rewards later rather than having it disappear forever. How large the reserve becomes depends on actual trading activity and fee levels; you can’t just see the 60% and expect a large amount of immediate “burn.”
Continued upgrade-related headlines drawing in capital is the biggest variable in this assessment. If it breaks higher than yesterday’s high near 1368 on increased volume, and then a pullback is met with buyers again, I’d be more confident about further upside. Right now, it hasn’t reached that stage—so a move up that then falls back is still the path I’m more worried about.
According to ZIP 259 I read earlier today, the mainnet activation height will be left to be determined again on October 20. Testnet progress is definitely a good sign, but the mainnet hasn’t yet reached the point where you can directly treat it as already upgraded.
#ZEC #Zcash #NU7
376
·
--
Verified
How long can TSLA’s delivery surprise stay positive?
Next week I’m leaning more bullish on TSLA. After auto deliveries came in better than expected, most of Friday’s rally held through to the close. Even the energy storage miss versus expectations didn’t drag the stock back down. I think this optimistic momentum could last for a few more days, but I’m not assuming sales have already resumed growing.
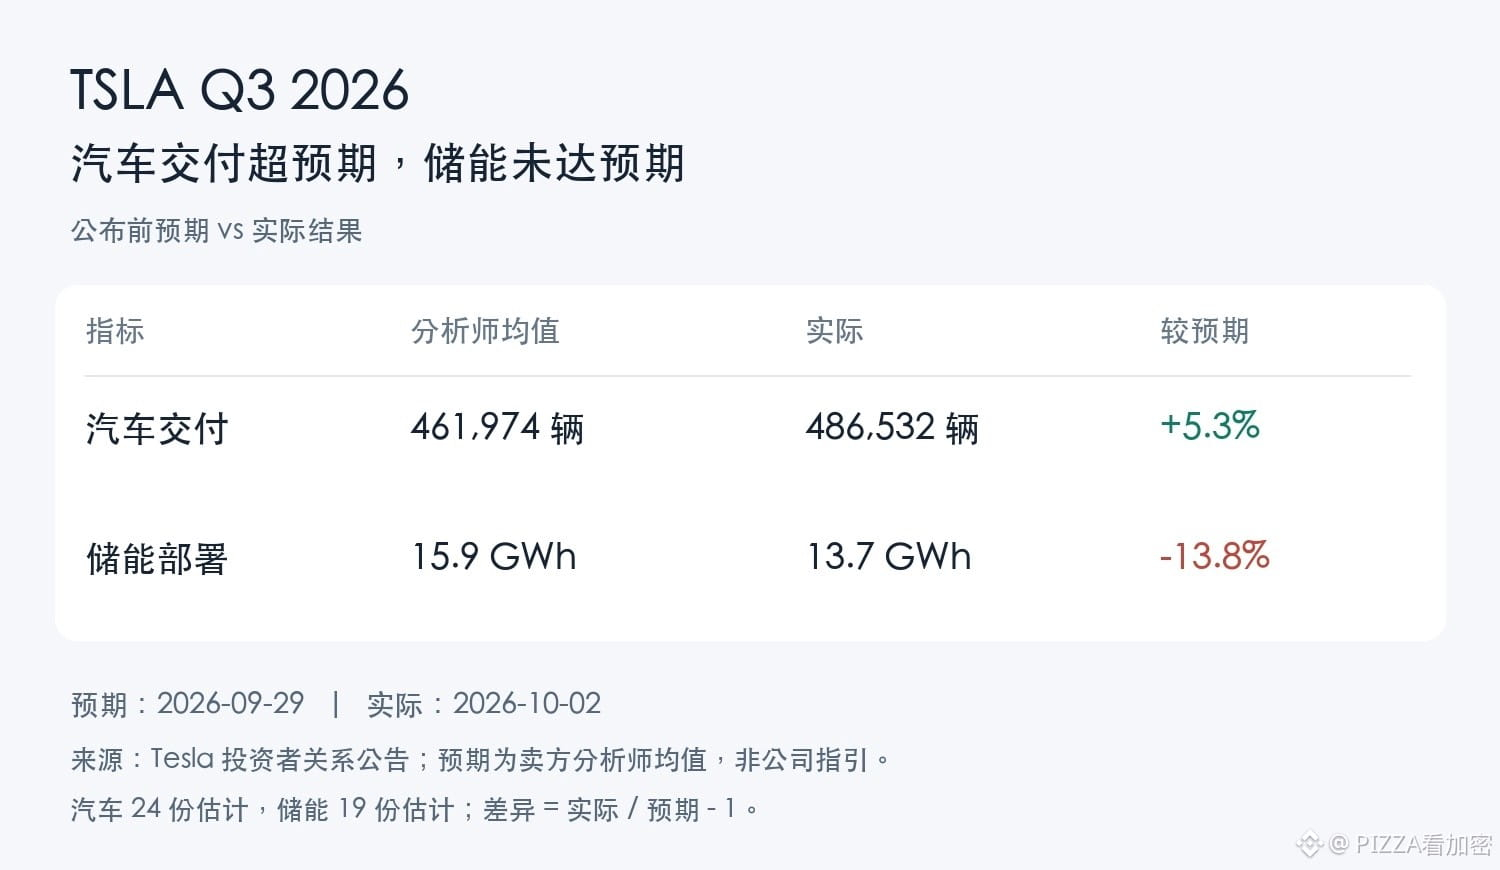
The analyst expectations compiled by Tesla as of September 29 were for 461,974 deliveries; the actual figure released on October 2 was 486,532, up 5.3%. For people who were previously worried that cars might not be selling, this result really is better than expected. But deliveries in the same period last year were 497,099—this year is still 2.1% lower. Whether auto sales are better than expected is one thing; whether they’re higher than last year is another.
The energy storage side looks less impressive. Expectations were 15.9 GWh; actual was 13.7 GWh, down 13.8%. If you only focus on the auto numbers and say that TSLA is broadly ahead of expectations, you’d miss this part entirely.
What matters most to me is that, despite these two sets of data pointing in opposite directions, TSLA still closed up 4.65% on Friday at $370.59—close to that day’s high of $374.60. At least for this day, the shortfall in energy storage didn’t offset the optimism from auto deliveries. That’s why I’d rather see momentum continue into next week, and worry less about the gains being given back immediately.
Since Friday already ran up, going bullish again does come with a cost: some of the good news has already been digested. How much profit the extra cars actually bring is still unknown—third-quarter earnings won’t be released until after the U.S. market close on October 21. Stronger-than-expected volumes could also come with bigger price concessions, so you can’t simply assume profits will rise in tandem with sales.
My preference is confined to the next trading week. If the daily close falls back below $354.11 before the news is reported, I’ll withdraw the bullish view. That was Thursday’s closing price—falling back there would suggest the rally after this news has been erased. As for whether TSLA can stay bullish after October 21, we’ll have to wait for the profit figures to answer.
#TSLA #美股 #汽车交付
How long can TSLA’s delivery surprise stay positive?
Next week I’m leaning more bullish on TSLA. After auto deliveries came in better than expected, most of Friday’s rally held through to the close. Even the energy storage miss versus expectations didn’t drag the stock back down. I think this optimistic momentum could last for a few more days, but I’m not assuming sales have already resumed growing.
The analyst expectations compiled by Tesla as of September 29 were for 461,974 deliveries; the actual figure released on October 2 was 486,532, up 5.3%. For people who were previously worried that cars might not be selling, this result really is better than expected. But deliveries in the same period last year were 497,099—this year is still 2.1% lower. Whether auto sales are better than expected is one thing; whether they’re higher than last year is another.
The energy storage side looks less impressive. Expectations were 15.9 GWh; actual was 13.7 GWh, down 13.8%. If you only focus on the auto numbers and say that TSLA is broadly ahead of expectations, you’d miss this part entirely.
What matters most to me is that, despite these two sets of data pointing in opposite directions, TSLA still closed up 4.65% on Friday at $370.59—close to that day’s high of $374.60. At least for this day, the shortfall in energy storage didn’t offset the optimism from auto deliveries. That’s why I’d rather see momentum continue into next week, and worry less about the gains being given back immediately.
Since Friday already ran up, going bullish again does come with a cost: some of the good news has already been digested. How much profit the extra cars actually bring is still unknown—third-quarter earnings won’t be released until after the U.S. market close on October 21. Stronger-than-expected volumes could also come with bigger price concessions, so you can’t simply assume profits will rise in tandem with sales.
My preference is confined to the next trading week. If the daily close falls back below $354.11 before the news is reported, I’ll withdraw the bullish view. That was Thursday’s closing price—falling back there would suggest the rally after this news has been erased. As for whether TSLA can stay bullish after October 21, we’ll have to wait for the profit figures to answer.
#TSLA #美股 #汽车交付
Next week I’m leaning more bullish on TSLA. After auto deliveries came in better than expected, most of Friday’s rally held through to the close. Even the energy storage miss versus expectations didn’t drag the stock back down. I think this optimistic momentum could last for a few more days, but I’m not assuming sales have already resumed growing.
The analyst expectations compiled by Tesla as of September 29 were for 461,974 deliveries; the actual figure released on October 2 was 486,532, up 5.3%. For people who were previously worried that cars might not be selling, this result really is better than expected. But deliveries in the same period last year were 497,099—this year is still 2.1% lower. Whether auto sales are better than expected is one thing; whether they’re higher than last year is another.
The energy storage side looks less impressive. Expectations were 15.9 GWh; actual was 13.7 GWh, down 13.8%. If you only focus on the auto numbers and say that TSLA is broadly ahead of expectations, you’d miss this part entirely.
What matters most to me is that, despite these two sets of data pointing in opposite directions, TSLA still closed up 4.65% on Friday at $370.59—close to that day’s high of $374.60. At least for this day, the shortfall in energy storage didn’t offset the optimism from auto deliveries. That’s why I’d rather see momentum continue into next week, and worry less about the gains being given back immediately.
Since Friday already ran up, going bullish again does come with a cost: some of the good news has already been digested. How much profit the extra cars actually bring is still unknown—third-quarter earnings won’t be released until after the U.S. market close on October 21. Stronger-than-expected volumes could also come with bigger price concessions, so you can’t simply assume profits will rise in tandem with sales.
My preference is confined to the next trading week. If the daily close falls back below $354.11 before the news is reported, I’ll withdraw the bullish view. That was Thursday’s closing price—falling back there would suggest the rally after this news has been erased. As for whether TSLA can stay bullish after October 21, we’ll have to wait for the profit figures to answer.
#TSLA #美股 #汽车交付
1
155
·
--
Verified
2Z is down nearly 19%, and I’m still bearish on the coming week
Over the next 3 to 7 days, I’m bearish on $2Z. In October, we enter the first-year unlock window that was originally disclosed. The amount of potential sellable supply increases, but the price is still stuck near the lows after the sharp selloff. What I’m more worried about is that any rebound may run into sell orders and then get pushed back down again.
I care more about how much the supply is actually going to increase. In the monthly circulation plan published by Upbit, at the end of September there are about 3.47 billion tokens, and at the end of October about 5.11 billion—an increase of roughly 47%. This is the month-end arrangement from the original disclosure; it may be adjusted, and it can’t be used to prove how many tokens are entering exchanges today or how many are being sold. But as restrictions are lifted, holders who previously couldn’t sell can now choose to sell as well. That means we’ll need more buy-side demand to absorb the selling.
The price also hasn’t given me confidence to catch a bottom. Using Binance UTC daily candles: on October 2, the drop from open to close was about 18.8%. As of today at 16:05 Beijing time, 2Z/USDT is around 0.04585, still near the low of that down day’s daily candle. The decline isn’t small—but how cheap it is versus how much selling pressure has been digested are two different things.
The bullish side has one reason worth taking seriously: the unlock schedule was disclosed long ago, so this selloff may have already priced in the concern in advance—and it may not drop again in another leg. I agree with that: you shouldn’t assume it will keep falling just because there’s an unlock. The issue now is that the rebound hasn’t yet reclaimed the range that was lost during the drop. For that reason, I’m more inclined to think the selling pressure is still being digested, and a short-term rebound is likely to be pushed back down again.
I’ll be watching the 0.055 to 0.057 USDT area—close to the low and the closing price around October 1. If the price returns to that zone and then continues with two consecutive UTC daily candles closing above 0.057, I’ll withdraw my bearish view for this week. Until then, just moving sideways near the lows isn’t enough for me to treat it as a reversal.
#2Z #代币解锁 #cryptocurrency
2Z is down nearly 19%, and I’m still bearish on the coming week
Over the next 3 to 7 days, I’m bearish on $2Z. In October, we enter the first-year unlock window that was originally disclosed. The amount of potential sellable supply increases, but the price is still stuck near the lows after the sharp selloff. What I’m more worried about is that any rebound may run into sell orders and then get pushed back down again.
I care more about how much the supply is actually going to increase. In the monthly circulation plan published by Upbit, at the end of September there are about 3.47 billion tokens, and at the end of October about 5.11 billion—an increase of roughly 47%. This is the month-end arrangement from the original disclosure; it may be adjusted, and it can’t be used to prove how many tokens are entering exchanges today or how many are being sold. But as restrictions are lifted, holders who previously couldn’t sell can now choose to sell as well. That means we’ll need more buy-side demand to absorb the selling.
The price also hasn’t given me confidence to catch a bottom. Using Binance UTC daily candles: on October 2, the drop from open to close was about 18.8%. As of today at 16:05 Beijing time, 2Z/USDT is around 0.04585, still near the low of that down day’s daily candle. The decline isn’t small—but how cheap it is versus how much selling pressure has been digested are two different things.
The bullish side has one reason worth taking seriously: the unlock schedule was disclosed long ago, so this selloff may have already priced in the concern in advance—and it may not drop again in another leg. I agree with that: you shouldn’t assume it will keep falling just because there’s an unlock. The issue now is that the rebound hasn’t yet reclaimed the range that was lost during the drop. For that reason, I’m more inclined to think the selling pressure is still being digested, and a short-term rebound is likely to be pushed back down again.
I’ll be watching the 0.055 to 0.057 USDT area—close to the low and the closing price around October 1. If the price returns to that zone and then continues with two consecutive UTC daily candles closing above 0.057, I’ll withdraw my bearish view for this week. Until then, just moving sideways near the lows isn’t enough for me to treat it as a reversal.
#2Z #代币解锁 #cryptocurrency
Over the next 3 to 7 days, I’m bearish on $2Z. In October, we enter the first-year unlock window that was originally disclosed. The amount of potential sellable supply increases, but the price is still stuck near the lows after the sharp selloff. What I’m more worried about is that any rebound may run into sell orders and then get pushed back down again.
I care more about how much the supply is actually going to increase. In the monthly circulation plan published by Upbit, at the end of September there are about 3.47 billion tokens, and at the end of October about 5.11 billion—an increase of roughly 47%. This is the month-end arrangement from the original disclosure; it may be adjusted, and it can’t be used to prove how many tokens are entering exchanges today or how many are being sold. But as restrictions are lifted, holders who previously couldn’t sell can now choose to sell as well. That means we’ll need more buy-side demand to absorb the selling.
The price also hasn’t given me confidence to catch a bottom. Using Binance UTC daily candles: on October 2, the drop from open to close was about 18.8%. As of today at 16:05 Beijing time, 2Z/USDT is around 0.04585, still near the low of that down day’s daily candle. The decline isn’t small—but how cheap it is versus how much selling pressure has been digested are two different things.
The bullish side has one reason worth taking seriously: the unlock schedule was disclosed long ago, so this selloff may have already priced in the concern in advance—and it may not drop again in another leg. I agree with that: you shouldn’t assume it will keep falling just because there’s an unlock. The issue now is that the rebound hasn’t yet reclaimed the range that was lost during the drop. For that reason, I’m more inclined to think the selling pressure is still being digested, and a short-term rebound is likely to be pushed back down again.
I’ll be watching the 0.055 to 0.057 USDT area—close to the low and the closing price around October 1. If the price returns to that zone and then continues with two consecutive UTC daily candles closing above 0.057, I’ll withdraw my bearish view for this week. Until then, just moving sideways near the lows isn’t enough for me to treat it as a reversal.
#2Z #代币解锁 #cryptocurrency
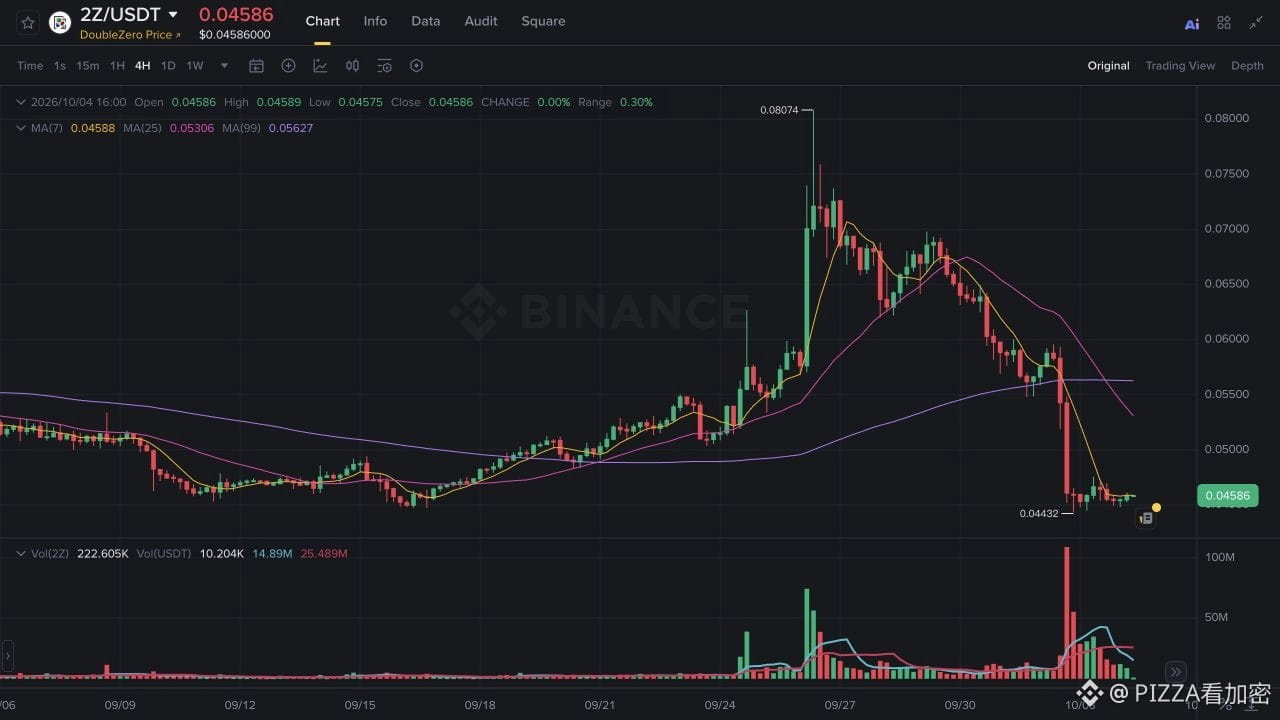
608
·
--
Verified
BTC to watch ISM tomorrow night. I’m bearish on this rebound.
Over the next two days, I’m bearish on $BTC . This weekend’s rebound hasn’t yet recovered to the position it was before Friday’s drop. Tomorrow night, the U.S. services sector data will answer another question: has the wage/price pressure from firms easing or not? If price pressure is still worsening, I think this rebound is more likely to come under pressure again.
At 22:00 Beijing time on October 5, ISM will release its September services report. I’ll first look at the price components. In the previous August report, the employment index was only 47.8, yet the prices index rose from 70.3 to 72.6. When hiring weakness and rising procurement costs happen at the same time, relying on employment weakening to expect rate cuts isn’t a sufficient rationale.
The Federal Reserve just raised rates by 25 basis points in September, and its statement also clearly said inflation is still too high. If service businesses continue to face price pressure, it will be even harder for the Fed to ease. It would also be more difficult for BTC to attract buy-side demand just through rate cuts. This is my main reason for being bearish.
The coin price hasn’t given me enough bullish reasons either. On October 4 at 11:06, Binance BTC/USDT spot was around 84.8k; the four-hour candle that closed before 20:00 Beijing time on Friday was around 86.4k. This drawdown hasn’t been fully recovered yet—I take it as evidence that the rebound is weak. As for what exactly is behind the sell-off, you can’t tell from the candlesticks alone.
Tomorrow night could also give bulls an opportunity. If the price components clearly decline, and new orders don’t show obvious deterioration, then there would be grounds to believe cost pressures are easing, and the market would have more reason to expect rates to move lower. If I only see employment continuing to weaken, I’ll remain bearish. But if price pressure does truly ease, and BTC recovers and holds around 86.4k, then I will retract this call.
#BTC #加密货币 #ISM
BTC to watch ISM tomorrow night. I’m bearish on this rebound.
Over the next two days, I’m bearish on $BTC . This weekend’s rebound hasn’t yet recovered to the position it was before Friday’s drop. Tomorrow night, the U.S. services sector data will answer another question: has the wage/price pressure from firms easing or not? If price pressure is still worsening, I think this rebound is more likely to come under pressure again.
At 22:00 Beijing time on October 5, ISM will release its September services report. I’ll first look at the price components. In the previous August report, the employment index was only 47.8, yet the prices index rose from 70.3 to 72.6. When hiring weakness and rising procurement costs happen at the same time, relying on employment weakening to expect rate cuts isn’t a sufficient rationale.
The Federal Reserve just raised rates by 25 basis points in September, and its statement also clearly said inflation is still too high. If service businesses continue to face price pressure, it will be even harder for the Fed to ease. It would also be more difficult for BTC to attract buy-side demand just through rate cuts. This is my main reason for being bearish.
The coin price hasn’t given me enough bullish reasons either. On October 4 at 11:06, Binance BTC/USDT spot was around 84.8k; the four-hour candle that closed before 20:00 Beijing time on Friday was around 86.4k. This drawdown hasn’t been fully recovered yet—I take it as evidence that the rebound is weak. As for what exactly is behind the sell-off, you can’t tell from the candlesticks alone.
Tomorrow night could also give bulls an opportunity. If the price components clearly decline, and new orders don’t show obvious deterioration, then there would be grounds to believe cost pressures are easing, and the market would have more reason to expect rates to move lower. If I only see employment continuing to weaken, I’ll remain bearish. But if price pressure does truly ease, and BTC recovers and holds around 86.4k, then I will retract this call.
#BTC #加密货币 #ISM
Over the next two days, I’m bearish on $BTC . This weekend’s rebound hasn’t yet recovered to the position it was before Friday’s drop. Tomorrow night, the U.S. services sector data will answer another question: has the wage/price pressure from firms easing or not? If price pressure is still worsening, I think this rebound is more likely to come under pressure again.
At 22:00 Beijing time on October 5, ISM will release its September services report. I’ll first look at the price components. In the previous August report, the employment index was only 47.8, yet the prices index rose from 70.3 to 72.6. When hiring weakness and rising procurement costs happen at the same time, relying on employment weakening to expect rate cuts isn’t a sufficient rationale.
The Federal Reserve just raised rates by 25 basis points in September, and its statement also clearly said inflation is still too high. If service businesses continue to face price pressure, it will be even harder for the Fed to ease. It would also be more difficult for BTC to attract buy-side demand just through rate cuts. This is my main reason for being bearish.
The coin price hasn’t given me enough bullish reasons either. On October 4 at 11:06, Binance BTC/USDT spot was around 84.8k; the four-hour candle that closed before 20:00 Beijing time on Friday was around 86.4k. This drawdown hasn’t been fully recovered yet—I take it as evidence that the rebound is weak. As for what exactly is behind the sell-off, you can’t tell from the candlesticks alone.
Tomorrow night could also give bulls an opportunity. If the price components clearly decline, and new orders don’t show obvious deterioration, then there would be grounds to believe cost pressures are easing, and the market would have more reason to expect rates to move lower. If I only see employment continuing to weaken, I’ll remain bearish. But if price pressure does truly ease, and BTC recovers and holds around 86.4k, then I will retract this call.
#BTC #加密货币 #ISM
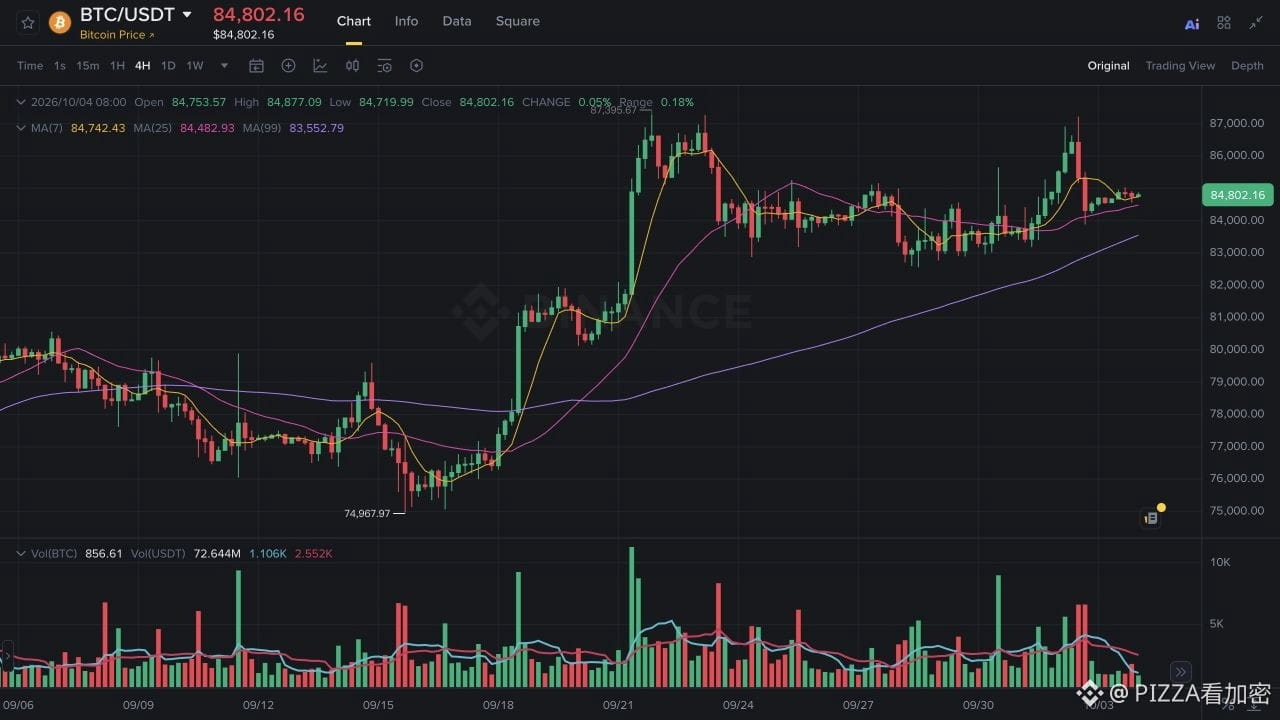
1.9k
·
--
Verified
The jobs report is weak, and I'm not in a hurry to go long QQQ yet.
The September jobs report was on the weak side, so I remain cautious about QQQ continuing to rise next week. If employment slows, the Fed may have one fewer rate hike to consider—but if consumption and orders also weaken, then we’d have to reassess how much companies can actually earn.
In the 9/ employment report released on October 2, September added only 29,000 jobs. July and August were also revised downward by a combined 60,000. Such job growth could provide slightly less justification for the Fed to keep hiking rates. However, the Fed only raised rates by 0.25 percentage points in September. Skipping one hike is still far from starting rate cuts.
In the U.S. Treasury’s reference yields on October 2, the 2-year was 4.83% and the 10-year was 5.28%—up by 5 and 4 basis points respectively versus the previous day. There isn’t much change, so you can’t conclude that QQQ is going to fall. But there’s also no clear support for the idea that rate pressure has eased.
If employment continues to weaken, consumption and corporate orders may also be affected. Companies in QQQ could then earn less than originally expected. Employment that’s just a bit weak may ease rate-hike pressure, but if it’s too weak, the stock market may become worried.
If U.S. Treasury yields can pull back, companies’ expectations for future business won’t get worse, and I’d be more willing to look favorably on QQQ. Based on this jobs report alone, I’m still not ready to change my view.
#QQQ #美股 #JobsReport
The jobs report is weak, and I'm not in a hurry to go long QQQ yet.
The September jobs report was on the weak side, so I remain cautious about QQQ continuing to rise next week. If employment slows, the Fed may have one fewer rate hike to consider—but if consumption and orders also weaken, then we’d have to reassess how much companies can actually earn.
In the 9/ employment report released on October 2, September added only 29,000 jobs. July and August were also revised downward by a combined 60,000. Such job growth could provide slightly less justification for the Fed to keep hiking rates. However, the Fed only raised rates by 0.25 percentage points in September. Skipping one hike is still far from starting rate cuts.
In the U.S. Treasury’s reference yields on October 2, the 2-year was 4.83% and the 10-year was 5.28%—up by 5 and 4 basis points respectively versus the previous day. There isn’t much change, so you can’t conclude that QQQ is going to fall. But there’s also no clear support for the idea that rate pressure has eased.
If employment continues to weaken, consumption and corporate orders may also be affected. Companies in QQQ could then earn less than originally expected. Employment that’s just a bit weak may ease rate-hike pressure, but if it’s too weak, the stock market may become worried.
If U.S. Treasury yields can pull back, companies’ expectations for future business won’t get worse, and I’d be more willing to look favorably on QQQ. Based on this jobs report alone, I’m still not ready to change my view.
#QQQ #美股 #JobsReport
The September jobs report was on the weak side, so I remain cautious about QQQ continuing to rise next week. If employment slows, the Fed may have one fewer rate hike to consider—but if consumption and orders also weaken, then we’d have to reassess how much companies can actually earn.
In the 9/ employment report released on October 2, September added only 29,000 jobs. July and August were also revised downward by a combined 60,000. Such job growth could provide slightly less justification for the Fed to keep hiking rates. However, the Fed only raised rates by 0.25 percentage points in September. Skipping one hike is still far from starting rate cuts.
In the U.S. Treasury’s reference yields on October 2, the 2-year was 4.83% and the 10-year was 5.28%—up by 5 and 4 basis points respectively versus the previous day. There isn’t much change, so you can’t conclude that QQQ is going to fall. But there’s also no clear support for the idea that rate pressure has eased.
If employment continues to weaken, consumption and corporate orders may also be affected. Companies in QQQ could then earn less than originally expected. Employment that’s just a bit weak may ease rate-hike pressure, but if it’s too weak, the stock market may become worried.
If U.S. Treasury yields can pull back, companies’ expectations for future business won’t get worse, and I’d be more willing to look favorably on QQQ. Based on this jobs report alone, I’m still not ready to change my view.
#QQQ #美股 #JobsReport
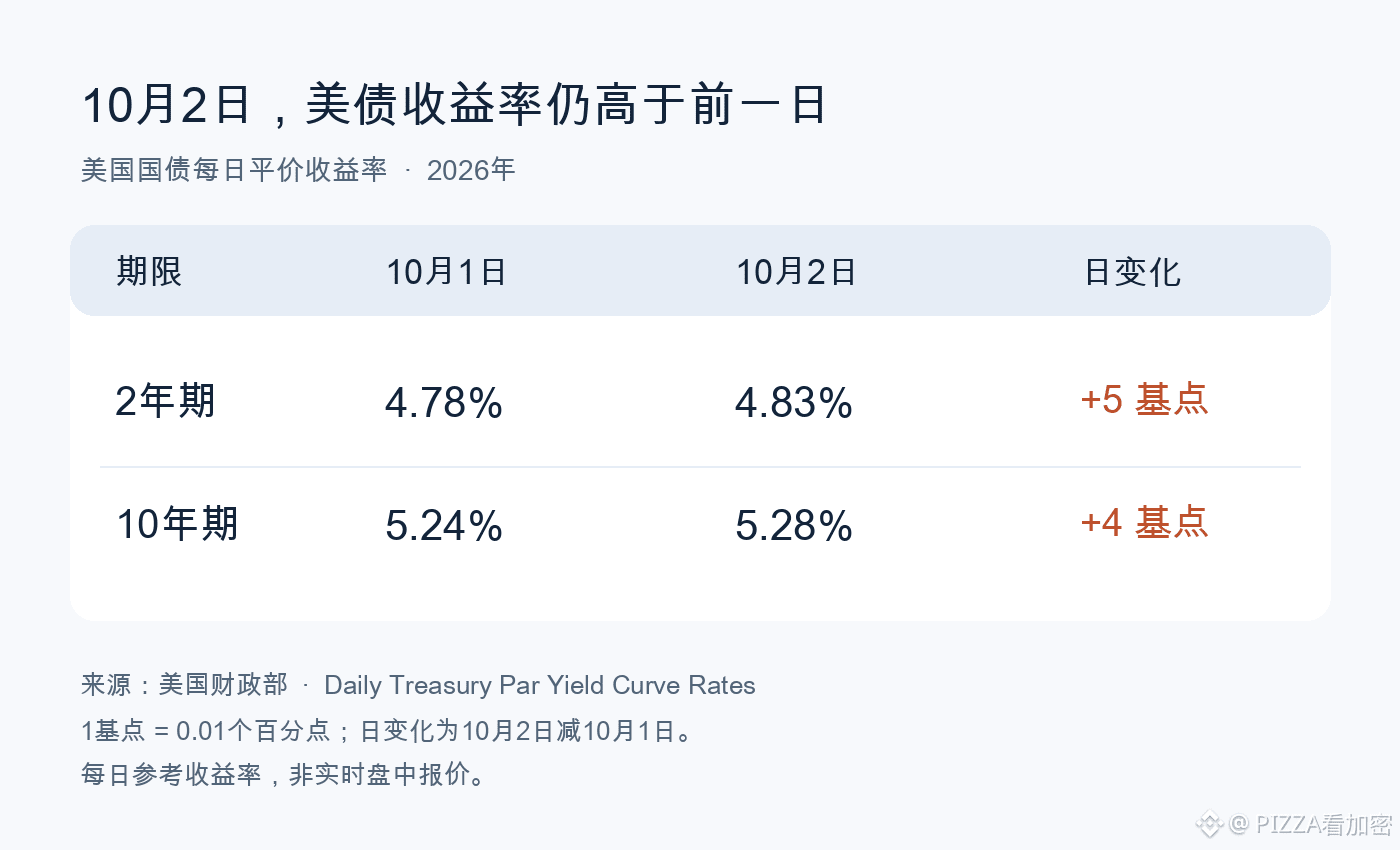
1
1.7k
·
--
Verified
BTC surged to 87,000 again and then fell back. This non-farm report still can’t sustain a continued rally
In the next 24 to 48 hours, I’m more inclined to believe $BTC will keep chopping lower under pressure. The non-farm employment data is relatively weak and may ease concerns about further rate hikes, but Bitcoin has already given back the gains after the data release. BTC hasn’t reclaimed the pre-release price. This weekend, I’m expecting it to move higher steadily—but for now, I don’t agree with that.
On the evening of October 2 at 20:30, the US September non-farm payrolls added 290,000 jobs, below Reuters’ survey expectation of 90,000. The combined figures for July and August were also revised down by 60,000, indicating that job growth in the first two months was even lower than originally seen. Private non-farm average hourly earnings rose only 0.1% month over month, and the unemployment rate was 4.2%. This set of data provides slightly less justification for continued rate hikes.
Weaker employment could lead the Fed to hike less times, reducing one layer of interest-rate pressure on BTC. If the cost of capital doesn’t keep rising, investors may also be more willing to tolerate the volatility of holding BTC. Whether this buying interest will actually show up remains to be seen in the subsequent market.
The Fed only raised rates by 25 bps on September 16, lifting the target range for the federal funds rate to 3.75%–4.00%. The statement still says inflation is too high. This non-farm report can support the view that there may be one fewer hike, but it’s still too early to treat rate cuts as already certain.
BTC did surge briefly, then pulled back again. Binance BTC/USDT spot was around 86,616 USDT before the release, and within the first 15 minutes after the release it hit a high of 87,220. After that, it failed to hold. As of 11:02 Beijing time on October 3, it was quoted at 84,614—about 2.31% lower than the level before the release. Here, we compare before vs. after the release, not the 24-hour move.
Price can’t tell us who is selling, but this time the upside push wasn’t sustained. Even if the non-farm report gives a reason for fewer hikes, the current data still isn’t enough to interpret this weekend’s rebound as a sustained rally.
The bullish case is still there. Wage growth is slow, and the prior two months were revised down again—so employment data could indeed make the Fed more cautious about continuing rate hikes. An unemployment rate of 4.2% also isn’t enough on its own to prove that the US has already entered a recession. Writing weak non-farm data as “BTC must fall” is equally over the top.
For now, I’ll use the area around 86,600 USDT to test the rebound. This is the actual price before the release, used to compare the走势 before and after the news. If BTC reclaims this zone and holds it, I’ll withdraw my view that the weekend is relatively weak; if it only bounces briefly and then falls back again, the explanation that it remains under pressure to consolidate will have more support. You can open the BTC chart to cross-check this condition.
#BTC #非农 #Federal Reserve
BTC surged to 87,000 again and then fell back. This non-farm report still can’t sustain a continued rally
In the next 24 to 48 hours, I’m more inclined to believe $BTC will keep chopping lower under pressure. The non-farm employment data is relatively weak and may ease concerns about further rate hikes, but Bitcoin has already given back the gains after the data release. BTC hasn’t reclaimed the pre-release price. This weekend, I’m expecting it to move higher steadily—but for now, I don’t agree with that.
On the evening of October 2 at 20:30, the US September non-farm payrolls added 290,000 jobs, below Reuters’ survey expectation of 90,000. The combined figures for July and August were also revised down by 60,000, indicating that job growth in the first two months was even lower than originally seen. Private non-farm average hourly earnings rose only 0.1% month over month, and the unemployment rate was 4.2%. This set of data provides slightly less justification for continued rate hikes.
Weaker employment could lead the Fed to hike less times, reducing one layer of interest-rate pressure on BTC. If the cost of capital doesn’t keep rising, investors may also be more willing to tolerate the volatility of holding BTC. Whether this buying interest will actually show up remains to be seen in the subsequent market.
The Fed only raised rates by 25 bps on September 16, lifting the target range for the federal funds rate to 3.75%–4.00%. The statement still says inflation is too high. This non-farm report can support the view that there may be one fewer hike, but it’s still too early to treat rate cuts as already certain.
BTC did surge briefly, then pulled back again. Binance BTC/USDT spot was around 86,616 USDT before the release, and within the first 15 minutes after the release it hit a high of 87,220. After that, it failed to hold. As of 11:02 Beijing time on October 3, it was quoted at 84,614—about 2.31% lower than the level before the release. Here, we compare before vs. after the release, not the 24-hour move.
Price can’t tell us who is selling, but this time the upside push wasn’t sustained. Even if the non-farm report gives a reason for fewer hikes, the current data still isn’t enough to interpret this weekend’s rebound as a sustained rally.
The bullish case is still there. Wage growth is slow, and the prior two months were revised down again—so employment data could indeed make the Fed more cautious about continuing rate hikes. An unemployment rate of 4.2% also isn’t enough on its own to prove that the US has already entered a recession. Writing weak non-farm data as “BTC must fall” is equally over the top.
For now, I’ll use the area around 86,600 USDT to test the rebound. This is the actual price before the release, used to compare the走势 before and after the news. If BTC reclaims this zone and holds it, I’ll withdraw my view that the weekend is relatively weak; if it only bounces briefly and then falls back again, the explanation that it remains under pressure to consolidate will have more support. You can open the BTC chart to cross-check this condition.
#BTC #非农 #Federal Reserve
In the next 24 to 48 hours, I’m more inclined to believe $BTC will keep chopping lower under pressure. The non-farm employment data is relatively weak and may ease concerns about further rate hikes, but Bitcoin has already given back the gains after the data release. BTC hasn’t reclaimed the pre-release price. This weekend, I’m expecting it to move higher steadily—but for now, I don’t agree with that.
On the evening of October 2 at 20:30, the US September non-farm payrolls added 290,000 jobs, below Reuters’ survey expectation of 90,000. The combined figures for July and August were also revised down by 60,000, indicating that job growth in the first two months was even lower than originally seen. Private non-farm average hourly earnings rose only 0.1% month over month, and the unemployment rate was 4.2%. This set of data provides slightly less justification for continued rate hikes.
Weaker employment could lead the Fed to hike less times, reducing one layer of interest-rate pressure on BTC. If the cost of capital doesn’t keep rising, investors may also be more willing to tolerate the volatility of holding BTC. Whether this buying interest will actually show up remains to be seen in the subsequent market.
The Fed only raised rates by 25 bps on September 16, lifting the target range for the federal funds rate to 3.75%–4.00%. The statement still says inflation is too high. This non-farm report can support the view that there may be one fewer hike, but it’s still too early to treat rate cuts as already certain.
BTC did surge briefly, then pulled back again. Binance BTC/USDT spot was around 86,616 USDT before the release, and within the first 15 minutes after the release it hit a high of 87,220. After that, it failed to hold. As of 11:02 Beijing time on October 3, it was quoted at 84,614—about 2.31% lower than the level before the release. Here, we compare before vs. after the release, not the 24-hour move.
Price can’t tell us who is selling, but this time the upside push wasn’t sustained. Even if the non-farm report gives a reason for fewer hikes, the current data still isn’t enough to interpret this weekend’s rebound as a sustained rally.
The bullish case is still there. Wage growth is slow, and the prior two months were revised down again—so employment data could indeed make the Fed more cautious about continuing rate hikes. An unemployment rate of 4.2% also isn’t enough on its own to prove that the US has already entered a recession. Writing weak non-farm data as “BTC must fall” is equally over the top.
For now, I’ll use the area around 86,600 USDT to test the rebound. This is the actual price before the release, used to compare the走势 before and after the news. If BTC reclaims this zone and holds it, I’ll withdraw my view that the weekend is relatively weak; if it only bounces briefly and then falls back again, the explanation that it remains under pressure to consolidate will have more support. You can open the BTC chart to cross-check this condition.
#BTC #非农 #Federal Reserve
1
1.7k
·
--
Verified
Nike wants to save $2.5 billion—so why is the stock still under pressure?
After this earnings report from Nike, I’m more inclined to think the stock price will remain under pressure for the next two to four weeks. The company expects to earn less this fiscal year than analysts currently estimate, and its $2.5 billion cost-cutting plan will keep accumulating into fiscal 2031. To reverse the stock price in the short term, evidence that sales are recovering matters more than the scale of the money saved. This discussion is about NYSE-listed shares of NKE.
In the first quarter of fiscal 2027, announced on October 1, Nike earned $0.48 per share, beating the $0.43 quarterly consensus expectation listed by Nasdaq. The quarter alone looks fine, but full-year guidance is only $1.15 to $1.35. Nasdaq’s current full-year consensus is $1.61.
The company’s midpoint of $1.25 is about 22% below that expectation, and it has already excluded roughly $0.15 per share in restructuring costs. Even if you temporarily ignore the costs from restructuring, Nike still expects to fall short of analysts’ earnings estimates. A better single quarter isn’t enough to support a judgment that the full-year outlook has already turned positive.
If investors are willing to pay the same price for each dollar of profit, then with lower expected profits the stock price will be pressured as well. But that 22% gap in profit expectations can’t simply be translated into the stock falling 22%.
The stock has already dropped ahead of this. Nasdaq’s premarket quote at 8:13 a.m. ET on October 2 was about $32.50, down 7.54% from the prior session’s close. This earnings report has already caused some of the worries to be reflected in the price. Whether the stock keeps falling next will depend on how earnings forecasts and valuation change. This quote is a premarket snapshot, and it could rebound later.
The benefit from Nike’s cost savings can be seen in the numbers, but the recovery in sales hasn’t caught up. This quarter’s revenue fell 4% year over year, direct-to-consumer revenue declined 8%, and online business fell 13%. Gross margin moved from 42.2% back to 42.8%, mainly driven by lower warehousing and logistics costs. The company can keep a bit more per dollar of sales, but total sales are down—so the gross profit for the whole quarter is still $145 million less than last year.
The $2.5 billion in the Pace plan also takes time. The company says the accumulated savings through fiscal 2031 haven’t yet deducted approximately $1 billion in pre-tax restructuring costs, nor the subsequent reinvestments. For fiscal 2027, it expects about $300 million in related costs to be recognized. You can’t treat the $2.5 billion as profit earned in a single fiscal year.
There are also reasons to be bullish: North America revenue is up 2% year over year, and gross margin has already rebounded. If North America continues to grow and the declines in direct-to-consumer sales narrow, cost savings and selling more product could work together to improve profits—and the market may even be willing to pay ahead for the next phase of recovery.
For now, I’m not treating this earnings report as the starting point for a rise. If over the next two to four weeks the stock price recovers the decline after the report and continues to strengthen, then the view that it will face short-term pressure should be withdrawn. Subsequent disclosures—if they can show that sales are recovering and that profit guidance has room to be raised—would also change my view on how quickly this company is on track to recover.
#耐克 #美股 #Earnings report
Nike wants to save $2.5 billion—so why is the stock still under pressure?
After this earnings report from Nike, I’m more inclined to think the stock price will remain under pressure for the next two to four weeks. The company expects to earn less this fiscal year than analysts currently estimate, and its $2.5 billion cost-cutting plan will keep accumulating into fiscal 2031. To reverse the stock price in the short term, evidence that sales are recovering matters more than the scale of the money saved. This discussion is about NYSE-listed shares of NKE.
In the first quarter of fiscal 2027, announced on October 1, Nike earned $0.48 per share, beating the $0.43 quarterly consensus expectation listed by Nasdaq. The quarter alone looks fine, but full-year guidance is only $1.15 to $1.35. Nasdaq’s current full-year consensus is $1.61.
The company’s midpoint of $1.25 is about 22% below that expectation, and it has already excluded roughly $0.15 per share in restructuring costs. Even if you temporarily ignore the costs from restructuring, Nike still expects to fall short of analysts’ earnings estimates. A better single quarter isn’t enough to support a judgment that the full-year outlook has already turned positive.
If investors are willing to pay the same price for each dollar of profit, then with lower expected profits the stock price will be pressured as well. But that 22% gap in profit expectations can’t simply be translated into the stock falling 22%.
The stock has already dropped ahead of this. Nasdaq’s premarket quote at 8:13 a.m. ET on October 2 was about $32.50, down 7.54% from the prior session’s close. This earnings report has already caused some of the worries to be reflected in the price. Whether the stock keeps falling next will depend on how earnings forecasts and valuation change. This quote is a premarket snapshot, and it could rebound later.
The benefit from Nike’s cost savings can be seen in the numbers, but the recovery in sales hasn’t caught up. This quarter’s revenue fell 4% year over year, direct-to-consumer revenue declined 8%, and online business fell 13%. Gross margin moved from 42.2% back to 42.8%, mainly driven by lower warehousing and logistics costs. The company can keep a bit more per dollar of sales, but total sales are down—so the gross profit for the whole quarter is still $145 million less than last year.
The $2.5 billion in the Pace plan also takes time. The company says the accumulated savings through fiscal 2031 haven’t yet deducted approximately $1 billion in pre-tax restructuring costs, nor the subsequent reinvestments. For fiscal 2027, it expects about $300 million in related costs to be recognized. You can’t treat the $2.5 billion as profit earned in a single fiscal year.
There are also reasons to be bullish: North America revenue is up 2% year over year, and gross margin has already rebounded. If North America continues to grow and the declines in direct-to-consumer sales narrow, cost savings and selling more product could work together to improve profits—and the market may even be willing to pay ahead for the next phase of recovery.
For now, I’m not treating this earnings report as the starting point for a rise. If over the next two to four weeks the stock price recovers the decline after the report and continues to strengthen, then the view that it will face short-term pressure should be withdrawn. Subsequent disclosures—if they can show that sales are recovering and that profit guidance has room to be raised—would also change my view on how quickly this company is on track to recover.
#耐克 #美股 #Earnings report
After this earnings report from Nike, I’m more inclined to think the stock price will remain under pressure for the next two to four weeks. The company expects to earn less this fiscal year than analysts currently estimate, and its $2.5 billion cost-cutting plan will keep accumulating into fiscal 2031. To reverse the stock price in the short term, evidence that sales are recovering matters more than the scale of the money saved. This discussion is about NYSE-listed shares of NKE.
In the first quarter of fiscal 2027, announced on October 1, Nike earned $0.48 per share, beating the $0.43 quarterly consensus expectation listed by Nasdaq. The quarter alone looks fine, but full-year guidance is only $1.15 to $1.35. Nasdaq’s current full-year consensus is $1.61.
The company’s midpoint of $1.25 is about 22% below that expectation, and it has already excluded roughly $0.15 per share in restructuring costs. Even if you temporarily ignore the costs from restructuring, Nike still expects to fall short of analysts’ earnings estimates. A better single quarter isn’t enough to support a judgment that the full-year outlook has already turned positive.
If investors are willing to pay the same price for each dollar of profit, then with lower expected profits the stock price will be pressured as well. But that 22% gap in profit expectations can’t simply be translated into the stock falling 22%.
The stock has already dropped ahead of this. Nasdaq’s premarket quote at 8:13 a.m. ET on October 2 was about $32.50, down 7.54% from the prior session’s close. This earnings report has already caused some of the worries to be reflected in the price. Whether the stock keeps falling next will depend on how earnings forecasts and valuation change. This quote is a premarket snapshot, and it could rebound later.
The benefit from Nike’s cost savings can be seen in the numbers, but the recovery in sales hasn’t caught up. This quarter’s revenue fell 4% year over year, direct-to-consumer revenue declined 8%, and online business fell 13%. Gross margin moved from 42.2% back to 42.8%, mainly driven by lower warehousing and logistics costs. The company can keep a bit more per dollar of sales, but total sales are down—so the gross profit for the whole quarter is still $145 million less than last year.
The $2.5 billion in the Pace plan also takes time. The company says the accumulated savings through fiscal 2031 haven’t yet deducted approximately $1 billion in pre-tax restructuring costs, nor the subsequent reinvestments. For fiscal 2027, it expects about $300 million in related costs to be recognized. You can’t treat the $2.5 billion as profit earned in a single fiscal year.
There are also reasons to be bullish: North America revenue is up 2% year over year, and gross margin has already rebounded. If North America continues to grow and the declines in direct-to-consumer sales narrow, cost savings and selling more product could work together to improve profits—and the market may even be willing to pay ahead for the next phase of recovery.
For now, I’m not treating this earnings report as the starting point for a rise. If over the next two to four weeks the stock price recovers the decline after the report and continues to strengthen, then the view that it will face short-term pressure should be withdrawn. Subsequent disclosures—if they can show that sales are recovering and that profit guidance has room to be raised—would also change my view on how quickly this company is on track to recover.
#耐克 #美股 #Earnings report
231
·
--
Verified
Merchants can integrate stablecoin payments reliably and continue accepting fiat as usual.
Citi and Coinbase’s disclosed payment setup allows merchants that don’t want to hold coins to also accept stablecoin payments. Stablecoins are automatically converted into fiat before settlement, eliminating the merchants’ work of directly managing the coins. Whether merchants actually use this service depends on how many orders truly pay with stablecoins; whether merchants choose to keep the coins can be assessed separately.
On September 28, both parties disclosed an expanded cooperation. Under the merchants’ payment arrangement, customers pay stablecoins through Spring by Citi. Coinbase’s payment system automatically converts the stablecoins into fiat, and Citi handles settlement.
For merchants who simply want to add another payment option, this arrangement removes the need to directly manage coins. They don’t have to decide separately how to hold the coins or when to convert them for this revenue. The service provider handles the related operations, and merchants can decide independently whether to accept stablecoin payments versus holding coins long-term.
In the same announcement, Coinbase Virtual Accounts will automatically convert the received fiat into stablecoins to serve a different kind of need. The two directions of business cannot be mixed together and treated as evidence that merchants are starting to stockpile coins.
Even if, in the future, more and more payments are completed through this arrangement, you still can’t infer merchants’ stablecoin balances from payment amounts alone. Just because a merchant is willing to accept coins from customers doesn’t mean they want to keep sales revenue in coins; conversely, receiving fiat doesn’t prevent stablecoins from playing a role in that payment.
Eliminating operational steps can only explain why merchants might be willing to integrate; it still can’t prove that customers will choose it. The parties’ announcements do not disclose the actual payment volume under this cooperation, nor do they provide a complete fee schedule. Whether it’s more cost-effective than the original payment method, and whether settlement and refunds meet everyday business needs, still requires real-world usage to answer.
At present, the arrangements disclosed by both parties start in the United States, and you shouldn’t interpret it as global integration of payment options across Citi’s worldwide business scope. Only after the participating merchants continuously receive this kind of order can it be confirmed that the arrangement has been put into everyday business.
Merchants can integrate stablecoin payments reliably and continue accepting fiat as usual.
Citi and Coinbase’s disclosed payment setup allows merchants that don’t want to hold coins to also accept stablecoin payments. Stablecoins are automatically converted into fiat before settlement, eliminating the merchants’ work of directly managing the coins. Whether merchants actually use this service depends on how many orders truly pay with stablecoins; whether merchants choose to keep the coins can be assessed separately.
On September 28, both parties disclosed an expanded cooperation. Under the merchants’ payment arrangement, customers pay stablecoins through Spring by Citi. Coinbase’s payment system automatically converts the stablecoins into fiat, and Citi handles settlement.
For merchants who simply want to add another payment option, this arrangement removes the need to directly manage coins. They don’t have to decide separately how to hold the coins or when to convert them for this revenue. The service provider handles the related operations, and merchants can decide independently whether to accept stablecoin payments versus holding coins long-term.
In the same announcement, Coinbase Virtual Accounts will automatically convert the received fiat into stablecoins to serve a different kind of need. The two directions of business cannot be mixed together and treated as evidence that merchants are starting to stockpile coins.
Even if, in the future, more and more payments are completed through this arrangement, you still can’t infer merchants’ stablecoin balances from payment amounts alone. Just because a merchant is willing to accept coins from customers doesn’t mean they want to keep sales revenue in coins; conversely, receiving fiat doesn’t prevent stablecoins from playing a role in that payment.
Eliminating operational steps can only explain why merchants might be willing to integrate; it still can’t prove that customers will choose it. The parties’ announcements do not disclose the actual payment volume under this cooperation, nor do they provide a complete fee schedule. Whether it’s more cost-effective than the original payment method, and whether settlement and refunds meet everyday business needs, still requires real-world usage to answer.
At present, the arrangements disclosed by both parties start in the United States, and you shouldn’t interpret it as global integration of payment options across Citi’s worldwide business scope. Only after the participating merchants continuously receive this kind of order can it be confirmed that the arrangement has been put into everyday business.
Citi and Coinbase’s disclosed payment setup allows merchants that don’t want to hold coins to also accept stablecoin payments. Stablecoins are automatically converted into fiat before settlement, eliminating the merchants’ work of directly managing the coins. Whether merchants actually use this service depends on how many orders truly pay with stablecoins; whether merchants choose to keep the coins can be assessed separately.
On September 28, both parties disclosed an expanded cooperation. Under the merchants’ payment arrangement, customers pay stablecoins through Spring by Citi. Coinbase’s payment system automatically converts the stablecoins into fiat, and Citi handles settlement.
For merchants who simply want to add another payment option, this arrangement removes the need to directly manage coins. They don’t have to decide separately how to hold the coins or when to convert them for this revenue. The service provider handles the related operations, and merchants can decide independently whether to accept stablecoin payments versus holding coins long-term.
In the same announcement, Coinbase Virtual Accounts will automatically convert the received fiat into stablecoins to serve a different kind of need. The two directions of business cannot be mixed together and treated as evidence that merchants are starting to stockpile coins.
Even if, in the future, more and more payments are completed through this arrangement, you still can’t infer merchants’ stablecoin balances from payment amounts alone. Just because a merchant is willing to accept coins from customers doesn’t mean they want to keep sales revenue in coins; conversely, receiving fiat doesn’t prevent stablecoins from playing a role in that payment.
Eliminating operational steps can only explain why merchants might be willing to integrate; it still can’t prove that customers will choose it. The parties’ announcements do not disclose the actual payment volume under this cooperation, nor do they provide a complete fee schedule. Whether it’s more cost-effective than the original payment method, and whether settlement and refunds meet everyday business needs, still requires real-world usage to answer.
At present, the arrangements disclosed by both parties start in the United States, and you shouldn’t interpret it as global integration of payment options across Citi’s worldwide business scope. Only after the participating merchants continuously receive this kind of order can it be confirmed that the arrangement has been put into everyday business.
291
·
--
Micron can pay current-quarter investments from operating cash flows, and customer deposits must be accounted for separately
Micron’s operating cash flow for fiscal year $MU 2026 fourth quarter already covers the company’s current-quarter spending on plant and equipment. Customer deposits received additionally increase available funds, but they come with repayment conditions attached. To judge how much more Micron has for capacity expansion or share repurchases, you need to separate cash generated from operations from deposits that are temporarily available.
On September 30, Micron disclosed that for the fourth quarter ended September 3, it generated about $43.97 billion in operating cash flow, while spending $11.11 billion to construct plants and buy equipment. Subtracting the two directly leaves roughly $32.86 billion. This does not add back government subsidies or proceeds from equipment sales, so it differs from the company’s adjusted free cash flow definition.
This quarter, Micron also received $12.3 billion in cash deposits from strategic customer agreements. In the prepared remarks for the earnings call, management made it explicit that these deposits are recorded in financing activities and do not affect free cash flow. The money had not originally flowed into operating cash flow, so deducting it again would underestimate operating performance; including it as “extra money made from selling chips” would overestimate it.
When customers place deposits in advance and agree to multi-year supply arrangements, Micron can receive part of the funds earlier to plan capacity. In the previously disclosed 10-Q for the third quarter, these contract terms set binding purchase quantities, with most using fixed prices or price bands with floors and ceilings. Having purchase volumes written into the contracts provides a higher degree of certainty in arranging capacity than merely relying on forecasts based on customer demand.
This time, management explained that cash deposits under strategic customer agreements are not subject to usage restrictions. After customers meet minimum purchase requirements, they gradually get their deposits back during the latter portion of each agreement. When assessing room for repurchases, dividends, or continued capacity expansion, this obligation must be included as well.
Long-term agreements also cannot guarantee the same amount of operating cash flow every quarter. Even with a price floor, production costs still need to be controlled, deliveries must be completed as agreed, and the timing of cash collections versus accounts payable can all affect cash flow in the quarter. While deposit receipts can ease funding pressure, they cannot replace cash generated by ongoing operations.
If the current-quarter investments are supported by operating cash flow, you still need to calculate how much cash will be left in the future. After the company increases investment, whether operating cash flow remains sufficient and whether deposit repayments clash with other spending will both change the amounts available for repurchases or dividends. Ignoring the deposit repayment obligation would overestimate the funds available for shareholder returns.
Micron can pay current-quarter investments from operating cash flows, and customer deposits must be accounted for separately
Micron’s operating cash flow for fiscal year $MU 2026 fourth quarter already covers the company’s current-quarter spending on plant and equipment. Customer deposits received additionally increase available funds, but they come with repayment conditions attached. To judge how much more Micron has for capacity expansion or share repurchases, you need to separate cash generated from operations from deposits that are temporarily available.
On September 30, Micron disclosed that for the fourth quarter ended September 3, it generated about $43.97 billion in operating cash flow, while spending $11.11 billion to construct plants and buy equipment. Subtracting the two directly leaves roughly $32.86 billion. This does not add back government subsidies or proceeds from equipment sales, so it differs from the company’s adjusted free cash flow definition.
This quarter, Micron also received $12.3 billion in cash deposits from strategic customer agreements. In the prepared remarks for the earnings call, management made it explicit that these deposits are recorded in financing activities and do not affect free cash flow. The money had not originally flowed into operating cash flow, so deducting it again would underestimate operating performance; including it as “extra money made from selling chips” would overestimate it.
When customers place deposits in advance and agree to multi-year supply arrangements, Micron can receive part of the funds earlier to plan capacity. In the previously disclosed 10-Q for the third quarter, these contract terms set binding purchase quantities, with most using fixed prices or price bands with floors and ceilings. Having purchase volumes written into the contracts provides a higher degree of certainty in arranging capacity than merely relying on forecasts based on customer demand.
This time, management explained that cash deposits under strategic customer agreements are not subject to usage restrictions. After customers meet minimum purchase requirements, they gradually get their deposits back during the latter portion of each agreement. When assessing room for repurchases, dividends, or continued capacity expansion, this obligation must be included as well.
Long-term agreements also cannot guarantee the same amount of operating cash flow every quarter. Even with a price floor, production costs still need to be controlled, deliveries must be completed as agreed, and the timing of cash collections versus accounts payable can all affect cash flow in the quarter. While deposit receipts can ease funding pressure, they cannot replace cash generated by ongoing operations.
If the current-quarter investments are supported by operating cash flow, you still need to calculate how much cash will be left in the future. After the company increases investment, whether operating cash flow remains sufficient and whether deposit repayments clash with other spending will both change the amounts available for repurchases or dividends. Ignoring the deposit repayment obligation would overestimate the funds available for shareholder returns.
Micron’s operating cash flow for fiscal year $MU 2026 fourth quarter already covers the company’s current-quarter spending on plant and equipment. Customer deposits received additionally increase available funds, but they come with repayment conditions attached. To judge how much more Micron has for capacity expansion or share repurchases, you need to separate cash generated from operations from deposits that are temporarily available.
On September 30, Micron disclosed that for the fourth quarter ended September 3, it generated about $43.97 billion in operating cash flow, while spending $11.11 billion to construct plants and buy equipment. Subtracting the two directly leaves roughly $32.86 billion. This does not add back government subsidies or proceeds from equipment sales, so it differs from the company’s adjusted free cash flow definition.
This quarter, Micron also received $12.3 billion in cash deposits from strategic customer agreements. In the prepared remarks for the earnings call, management made it explicit that these deposits are recorded in financing activities and do not affect free cash flow. The money had not originally flowed into operating cash flow, so deducting it again would underestimate operating performance; including it as “extra money made from selling chips” would overestimate it.
When customers place deposits in advance and agree to multi-year supply arrangements, Micron can receive part of the funds earlier to plan capacity. In the previously disclosed 10-Q for the third quarter, these contract terms set binding purchase quantities, with most using fixed prices or price bands with floors and ceilings. Having purchase volumes written into the contracts provides a higher degree of certainty in arranging capacity than merely relying on forecasts based on customer demand.
This time, management explained that cash deposits under strategic customer agreements are not subject to usage restrictions. After customers meet minimum purchase requirements, they gradually get their deposits back during the latter portion of each agreement. When assessing room for repurchases, dividends, or continued capacity expansion, this obligation must be included as well.
Long-term agreements also cannot guarantee the same amount of operating cash flow every quarter. Even with a price floor, production costs still need to be controlled, deliveries must be completed as agreed, and the timing of cash collections versus accounts payable can all affect cash flow in the quarter. While deposit receipts can ease funding pressure, they cannot replace cash generated by ongoing operations.
If the current-quarter investments are supported by operating cash flow, you still need to calculate how much cash will be left in the future. After the company increases investment, whether operating cash flow remains sufficient and whether deposit repayments clash with other spending will both change the amounts available for repurchases or dividends. Ignoring the deposit repayment obligation would overestimate the funds available for shareholder returns.
332
·
--
This Ethereum scaling upgrade can’t be simply understood as a blanket reduction in fees
Glamsterdam’s proposal increases Ethereum’s processing capacity while also adjusting gas charges for certain newly added on-chain data operations. Whether this scaling will make a particular application cheaper depends on which operations it uses and the gas price at that time—not on a vague assumption that fees are uniformly discounted.
As of October 1, the official plan is to activate on October 6 on the Sepolia testnet. The dates for Hoodi and the mainnet have not been determined yet. This announcement has not changed the existing mainnet fee rules for $ETH .
Besides executing transactions, nodes must also store account information, contract code, and storage data. With more things allowed per block, the new data may also occupy disk space faster and slow down nodes. Simply improving execution speed doesn’t solve the ongoing problem of accumulating data.
The upgraded block access lists will list the accounts and storage locations involved in executing transactions, enabling clients to read and verify in parallel. If clients can process more work at once, that creates the conditions to increase throughput. But reading faster doesn’t mean storing less—the long-term burden of additional data still needs to be handled.
The included EIP-8037 increases gas charges for operations such as creating new accounts, writing to new storage locations, and deploying code, and measures the newly added state separately. This fee structure is intended to control the data growth rate after scaling. If an application frequently creates new data, it needs to重点算 (pay particular attention to) and estimate the extra cost of these operations. There is also another fee adjustment for accessing existing data, so you can’t simply categorize applications into “fees increase” and “fees don’t increase.”
An increase in the gas consumed by the same kind of operation doesn’t necessarily mean the ETH-denominated bill will rise. If congestion eases after scaling, the decrease in unit price may offset the increase in usage; and even if demand grows along with it, you still can’t guarantee that transaction fees will go down.
Developers also have to deal with compatibility issues. After the Ethereum Foundation replayed historical transactions, they found that most transactions can still be executed unchanged, while a small number of contracts rely on hard-coded gas assumptions. Some failures can be resolved by raising the transaction gas limit, while others require modifying the contract or how it is called. Increasing the limit only allows a transaction to use more gas—it does not automatically make every transaction spend the full amount.
Testnet fees also can’t be used to predict mainnet bills, because test traffic and the prices users are willing to pay are different. For application teams, a more useful approach is to test the new rules with their own transactions and compare the old and new usage under the same gas unit price. First determine how much more or less the business itself will consume, then observe congestion and gas prices after the upgrade goes live on mainnet. Only by combining these two parts can you tell whether this scaling upgrade will save money for your users—or cost them more.
This Ethereum scaling upgrade can’t be simply understood as a blanket reduction in fees
Glamsterdam’s proposal increases Ethereum’s processing capacity while also adjusting gas charges for certain newly added on-chain data operations. Whether this scaling will make a particular application cheaper depends on which operations it uses and the gas price at that time—not on a vague assumption that fees are uniformly discounted.
As of October 1, the official plan is to activate on October 6 on the Sepolia testnet. The dates for Hoodi and the mainnet have not been determined yet. This announcement has not changed the existing mainnet fee rules for $ETH .
Besides executing transactions, nodes must also store account information, contract code, and storage data. With more things allowed per block, the new data may also occupy disk space faster and slow down nodes. Simply improving execution speed doesn’t solve the ongoing problem of accumulating data.
The upgraded block access lists will list the accounts and storage locations involved in executing transactions, enabling clients to read and verify in parallel. If clients can process more work at once, that creates the conditions to increase throughput. But reading faster doesn’t mean storing less—the long-term burden of additional data still needs to be handled.
The included EIP-8037 increases gas charges for operations such as creating new accounts, writing to new storage locations, and deploying code, and measures the newly added state separately. This fee structure is intended to control the data growth rate after scaling. If an application frequently creates new data, it needs to重点算 (pay particular attention to) and estimate the extra cost of these operations. There is also another fee adjustment for accessing existing data, so you can’t simply categorize applications into “fees increase” and “fees don’t increase.”
An increase in the gas consumed by the same kind of operation doesn’t necessarily mean the ETH-denominated bill will rise. If congestion eases after scaling, the decrease in unit price may offset the increase in usage; and even if demand grows along with it, you still can’t guarantee that transaction fees will go down.
Developers also have to deal with compatibility issues. After the Ethereum Foundation replayed historical transactions, they found that most transactions can still be executed unchanged, while a small number of contracts rely on hard-coded gas assumptions. Some failures can be resolved by raising the transaction gas limit, while others require modifying the contract or how it is called. Increasing the limit only allows a transaction to use more gas—it does not automatically make every transaction spend the full amount.
Testnet fees also can’t be used to predict mainnet bills, because test traffic and the prices users are willing to pay are different. For application teams, a more useful approach is to test the new rules with their own transactions and compare the old and new usage under the same gas unit price. First determine how much more or less the business itself will consume, then observe congestion and gas prices after the upgrade goes live on mainnet. Only by combining these two parts can you tell whether this scaling upgrade will save money for your users—or cost them more.
Glamsterdam’s proposal increases Ethereum’s processing capacity while also adjusting gas charges for certain newly added on-chain data operations. Whether this scaling will make a particular application cheaper depends on which operations it uses and the gas price at that time—not on a vague assumption that fees are uniformly discounted.
As of October 1, the official plan is to activate on October 6 on the Sepolia testnet. The dates for Hoodi and the mainnet have not been determined yet. This announcement has not changed the existing mainnet fee rules for $ETH .
Besides executing transactions, nodes must also store account information, contract code, and storage data. With more things allowed per block, the new data may also occupy disk space faster and slow down nodes. Simply improving execution speed doesn’t solve the ongoing problem of accumulating data.
The upgraded block access lists will list the accounts and storage locations involved in executing transactions, enabling clients to read and verify in parallel. If clients can process more work at once, that creates the conditions to increase throughput. But reading faster doesn’t mean storing less—the long-term burden of additional data still needs to be handled.
The included EIP-8037 increases gas charges for operations such as creating new accounts, writing to new storage locations, and deploying code, and measures the newly added state separately. This fee structure is intended to control the data growth rate after scaling. If an application frequently creates new data, it needs to重点算 (pay particular attention to) and estimate the extra cost of these operations. There is also another fee adjustment for accessing existing data, so you can’t simply categorize applications into “fees increase” and “fees don’t increase.”
An increase in the gas consumed by the same kind of operation doesn’t necessarily mean the ETH-denominated bill will rise. If congestion eases after scaling, the decrease in unit price may offset the increase in usage; and even if demand grows along with it, you still can’t guarantee that transaction fees will go down.
Developers also have to deal with compatibility issues. After the Ethereum Foundation replayed historical transactions, they found that most transactions can still be executed unchanged, while a small number of contracts rely on hard-coded gas assumptions. Some failures can be resolved by raising the transaction gas limit, while others require modifying the contract or how it is called. Increasing the limit only allows a transaction to use more gas—it does not automatically make every transaction spend the full amount.
Testnet fees also can’t be used to predict mainnet bills, because test traffic and the prices users are willing to pay are different. For application teams, a more useful approach is to test the new rules with their own transactions and compare the old and new usage under the same gas unit price. First determine how much more or less the business itself will consume, then observe congestion and gas prices after the upgrade goes live on mainnet. Only by combining these two parts can you tell whether this scaling upgrade will save money for your users—or cost them more.
284
·
--
Investors in Europe can now buy a physically backed Zcash product on regulated exchanges, with a custodian holding the real coins. Meanwhile, another EU regulation that has already taken effect sets a timeline for licensed platforms—after the deadline, they must draw a clear line separating from this kind of asset. In the same jurisdiction, opening and clearing happen at the same time.
In the Chinese community, when people talk about an EU privacy-coin ban, it’s basically second-hand accounts, and then second-hand accounts of those accounts. Article 79 of Regulation 2024/1624 actually targets accounts: credit institutions, financial institutions, and crypto-asset service providers may not hold anonymous accounts, nor may they hold any accounts that can conceal the identity of holders, or make transactions anonymous and further obscure them. In that one sentence, the provision points to coins that enhance anonymity. The application date is stated in Article 90—July 10, 2027. Nowhere in the entire regulation does it name #Zcash, and it doesn’t name any specific token.
This kind of drafting leaves room for securitized wrappers. The law bans the form of accounts and service behavior, but does not put the assets themselves onto a list. An ETP listed in Europe is a security. The people who buy it open accounts in their own names at brokers, and the trades and settlements go through the security pipeline—no one holds a shielded address for the customer. When 21Shares launched at this point in time, the bet was that this reading would hold. The product is packaged to look like a conventional security, with an annual management fee of 2.50%—which is higher than most crypto ETPs. The issuer itself knows it’s a niche shelf. Buyers of this layer of shell get only the price exposure; they don’t get privacy itself, and Zcash’s utility is entirely on the privacy side. This mismatch ultimately determines how big the securitization channel can grow.
That the interpretation is plausible doesn’t mean the business will work. This so-called Europe’s first ZEC physical product launched with an asset size of a bit over $100,000, and the issuer’s website shows exactly that number. Around the same time, the U.S. spot ZEC ETF traded on NYSE Arca—according to the materials it filed with regulators—after it listed at the end of August, its assets exceeded $500 million within two weeks. That’s a difference of three orders of magnitude. The European product looks more like an option pre-purchased in advance: it bets that the 2027 timeline will ultimately not sweep the security shell into the prohibited category.
That $500 million in the U.S. also needs to be viewed carefully. In the same set of materials, it states that an investment vehicle under DCG took 85,705 ZEC to receive a $100 million share allocation—settling via physical transfers. DCG is the parent company of Grayscale. Its founder has publicly said that part of Bitcoin’s market value would be moved into privacy assets, and also that ZEC has room for hundreds of multiples. This is a genuine faith vote, different from the influx of unknown buy orders in the secondary market. After stripping out that related-party transfer, remaining external inflows look much more modest.
On September 23, during intraday trading the high reached $1,679.83, and by the close it fell back to $1,498.26—within a day it吐出了 everything it had pushed up. Binance perpetual positions dropped from 498,867 coins that day to the current 449,367 coins. On the day the news landed, positions were decreasing, with no new money pouring in. The spot price on $ZEC is currently $1,512.39, down 6.04% over the past 24 hours; at the start of the year it was still around $500.
Talking about ZEC alongside Monero is the most common lazy approach in this topic. Monero’s privacy is enabled by default and can’t be turned off; Zcash’s shielding is optional. On-chain, 4.91 million ZEC are currently sitting in the shield pool, accounting for 29.0% of total supply; the remaining more than 70% is still sitting in transparent addresses. Due diligence for these two kinds of assets by compliance teams is completely different. The platforms have already handled them separately as well: on Binance, XMRUSDT is in the BREAK state and has long stopped trading; ZEC and DASH are still on the shelf. Europe has precedents for enforcement—previously, a large exchange directly converted Monero balances of European users into Bitcoin at market prices and liquidated them, without leaving a grace period to sell gradually.
21Shares likely read the law correctly on the legal-text side, but is still wrong on the business side. The security wrapper can solve the hurdle for compliance entities, but it can’t solve whether European distribution channels are willing to put a controversial 2027 target onto their shelf. The asset size of this Europe product will answer that question first. If the size is still sitting in the tens of hundreds of thousands through Q4, it suggests the channel side hasn’t accepted that reading, and that timeline will keep sitting on ZEC’s valuation. If it truly starts compounding week over week, that would indicate licensed distributors have already finished their legal opinions internally, and that discount should be recovered. There’s also a third path: if a regulator in any member state—or an EBA technical standard—counts the exposure from holding shielded assets as “confusing transactions,” then the first thing that would go wrong would be that security shell, and the spot market would be unaffected.
Beyond the regulatory line, there’s another dated item on-chain. The NU7 plan activates on the mainnet on November 5. The block interval is compressed from 75 seconds to 25 seconds, and v4 trading is retired at the same time. The testnet runs first on October 6, and the final decision on what remains is set for October 20. Holders have a specific action to take: in the old Sprout pool there are still 22,430 ZEC left. After the upgrade, this portion may be permanently locked. If you have shielded addresses from earlier years, go check them yourself—faster than asking someone else.
This market narrative is already quite crowded. Many people are spreading the idea that compliance domestication and compliance expulsion are the same good thing. You can check once a week the asset size of that European ETP—how the channels interpret this regulation will show itself in that number sooner than any interpretation.
Investors in Europe can now buy a physically backed Zcash product on regulated exchanges, with a custodian holding the real coins. Meanwhile, another EU regulation that has already taken effect sets a timeline for licensed platforms—after the deadline, they must draw a clear line separating from this kind of asset. In the same jurisdiction, opening and clearing happen at the same time.
In the Chinese community, when people talk about an EU privacy-coin ban, it’s basically second-hand accounts, and then second-hand accounts of those accounts. Article 79 of Regulation 2024/1624 actually targets accounts: credit institutions, financial institutions, and crypto-asset service providers may not hold anonymous accounts, nor may they hold any accounts that can conceal the identity of holders, or make transactions anonymous and further obscure them. In that one sentence, the provision points to coins that enhance anonymity. The application date is stated in Article 90—July 10, 2027. Nowhere in the entire regulation does it name #Zcash, and it doesn’t name any specific token.
This kind of drafting leaves room for securitized wrappers. The law bans the form of accounts and service behavior, but does not put the assets themselves onto a list. An ETP listed in Europe is a security. The people who buy it open accounts in their own names at brokers, and the trades and settlements go through the security pipeline—no one holds a shielded address for the customer. When 21Shares launched at this point in time, the bet was that this reading would hold. The product is packaged to look like a conventional security, with an annual management fee of 2.50%—which is higher than most crypto ETPs. The issuer itself knows it’s a niche shelf. Buyers of this layer of shell get only the price exposure; they don’t get privacy itself, and Zcash’s utility is entirely on the privacy side. This mismatch ultimately determines how big the securitization channel can grow.
That the interpretation is plausible doesn’t mean the business will work. This so-called Europe’s first ZEC physical product launched with an asset size of a bit over $100,000, and the issuer’s website shows exactly that number. Around the same time, the U.S. spot ZEC ETF traded on NYSE Arca—according to the materials it filed with regulators—after it listed at the end of August, its assets exceeded $500 million within two weeks. That’s a difference of three orders of magnitude. The European product looks more like an option pre-purchased in advance: it bets that the 2027 timeline will ultimately not sweep the security shell into the prohibited category.
That $500 million in the U.S. also needs to be viewed carefully. In the same set of materials, it states that an investment vehicle under DCG took 85,705 ZEC to receive a $100 million share allocation—settling via physical transfers. DCG is the parent company of Grayscale. Its founder has publicly said that part of Bitcoin’s market value would be moved into privacy assets, and also that ZEC has room for hundreds of multiples. This is a genuine faith vote, different from the influx of unknown buy orders in the secondary market. After stripping out that related-party transfer, remaining external inflows look much more modest.
On September 23, during intraday trading the high reached $1,679.83, and by the close it fell back to $1,498.26—within a day it吐出了 everything it had pushed up. Binance perpetual positions dropped from 498,867 coins that day to the current 449,367 coins. On the day the news landed, positions were decreasing, with no new money pouring in. The spot price on $ZEC is currently $1,512.39, down 6.04% over the past 24 hours; at the start of the year it was still around $500.
Talking about ZEC alongside Monero is the most common lazy approach in this topic. Monero’s privacy is enabled by default and can’t be turned off; Zcash’s shielding is optional. On-chain, 4.91 million ZEC are currently sitting in the shield pool, accounting for 29.0% of total supply; the remaining more than 70% is still sitting in transparent addresses. Due diligence for these two kinds of assets by compliance teams is completely different. The platforms have already handled them separately as well: on Binance, XMRUSDT is in the BREAK state and has long stopped trading; ZEC and DASH are still on the shelf. Europe has precedents for enforcement—previously, a large exchange directly converted Monero balances of European users into Bitcoin at market prices and liquidated them, without leaving a grace period to sell gradually.
21Shares likely read the law correctly on the legal-text side, but is still wrong on the business side. The security wrapper can solve the hurdle for compliance entities, but it can’t solve whether European distribution channels are willing to put a controversial 2027 target onto their shelf. The asset size of this Europe product will answer that question first. If the size is still sitting in the tens of hundreds of thousands through Q4, it suggests the channel side hasn’t accepted that reading, and that timeline will keep sitting on ZEC’s valuation. If it truly starts compounding week over week, that would indicate licensed distributors have already finished their legal opinions internally, and that discount should be recovered. There’s also a third path: if a regulator in any member state—or an EBA technical standard—counts the exposure from holding shielded assets as “confusing transactions,” then the first thing that would go wrong would be that security shell, and the spot market would be unaffected.
Beyond the regulatory line, there’s another dated item on-chain. The NU7 plan activates on the mainnet on November 5. The block interval is compressed from 75 seconds to 25 seconds, and v4 trading is retired at the same time. The testnet runs first on October 6, and the final decision on what remains is set for October 20. Holders have a specific action to take: in the old Sprout pool there are still 22,430 ZEC left. After the upgrade, this portion may be permanently locked. If you have shielded addresses from earlier years, go check them yourself—faster than asking someone else.
This market narrative is already quite crowded. Many people are spreading the idea that compliance domestication and compliance expulsion are the same good thing. You can check once a week the asset size of that European ETP—how the channels interpret this regulation will show itself in that number sooner than any interpretation.
In the Chinese community, when people talk about an EU privacy-coin ban, it’s basically second-hand accounts, and then second-hand accounts of those accounts. Article 79 of Regulation 2024/1624 actually targets accounts: credit institutions, financial institutions, and crypto-asset service providers may not hold anonymous accounts, nor may they hold any accounts that can conceal the identity of holders, or make transactions anonymous and further obscure them. In that one sentence, the provision points to coins that enhance anonymity. The application date is stated in Article 90—July 10, 2027. Nowhere in the entire regulation does it name #Zcash, and it doesn’t name any specific token.
This kind of drafting leaves room for securitized wrappers. The law bans the form of accounts and service behavior, but does not put the assets themselves onto a list. An ETP listed in Europe is a security. The people who buy it open accounts in their own names at brokers, and the trades and settlements go through the security pipeline—no one holds a shielded address for the customer. When 21Shares launched at this point in time, the bet was that this reading would hold. The product is packaged to look like a conventional security, with an annual management fee of 2.50%—which is higher than most crypto ETPs. The issuer itself knows it’s a niche shelf. Buyers of this layer of shell get only the price exposure; they don’t get privacy itself, and Zcash’s utility is entirely on the privacy side. This mismatch ultimately determines how big the securitization channel can grow.
That the interpretation is plausible doesn’t mean the business will work. This so-called Europe’s first ZEC physical product launched with an asset size of a bit over $100,000, and the issuer’s website shows exactly that number. Around the same time, the U.S. spot ZEC ETF traded on NYSE Arca—according to the materials it filed with regulators—after it listed at the end of August, its assets exceeded $500 million within two weeks. That’s a difference of three orders of magnitude. The European product looks more like an option pre-purchased in advance: it bets that the 2027 timeline will ultimately not sweep the security shell into the prohibited category.
That $500 million in the U.S. also needs to be viewed carefully. In the same set of materials, it states that an investment vehicle under DCG took 85,705 ZEC to receive a $100 million share allocation—settling via physical transfers. DCG is the parent company of Grayscale. Its founder has publicly said that part of Bitcoin’s market value would be moved into privacy assets, and also that ZEC has room for hundreds of multiples. This is a genuine faith vote, different from the influx of unknown buy orders in the secondary market. After stripping out that related-party transfer, remaining external inflows look much more modest.
On September 23, during intraday trading the high reached $1,679.83, and by the close it fell back to $1,498.26—within a day it吐出了 everything it had pushed up. Binance perpetual positions dropped from 498,867 coins that day to the current 449,367 coins. On the day the news landed, positions were decreasing, with no new money pouring in. The spot price on $ZEC is currently $1,512.39, down 6.04% over the past 24 hours; at the start of the year it was still around $500.
Talking about ZEC alongside Monero is the most common lazy approach in this topic. Monero’s privacy is enabled by default and can’t be turned off; Zcash’s shielding is optional. On-chain, 4.91 million ZEC are currently sitting in the shield pool, accounting for 29.0% of total supply; the remaining more than 70% is still sitting in transparent addresses. Due diligence for these two kinds of assets by compliance teams is completely different. The platforms have already handled them separately as well: on Binance, XMRUSDT is in the BREAK state and has long stopped trading; ZEC and DASH are still on the shelf. Europe has precedents for enforcement—previously, a large exchange directly converted Monero balances of European users into Bitcoin at market prices and liquidated them, without leaving a grace period to sell gradually.
21Shares likely read the law correctly on the legal-text side, but is still wrong on the business side. The security wrapper can solve the hurdle for compliance entities, but it can’t solve whether European distribution channels are willing to put a controversial 2027 target onto their shelf. The asset size of this Europe product will answer that question first. If the size is still sitting in the tens of hundreds of thousands through Q4, it suggests the channel side hasn’t accepted that reading, and that timeline will keep sitting on ZEC’s valuation. If it truly starts compounding week over week, that would indicate licensed distributors have already finished their legal opinions internally, and that discount should be recovered. There’s also a third path: if a regulator in any member state—or an EBA technical standard—counts the exposure from holding shielded assets as “confusing transactions,” then the first thing that would go wrong would be that security shell, and the spot market would be unaffected.
Beyond the regulatory line, there’s another dated item on-chain. The NU7 plan activates on the mainnet on November 5. The block interval is compressed from 75 seconds to 25 seconds, and v4 trading is retired at the same time. The testnet runs first on October 6, and the final decision on what remains is set for October 20. Holders have a specific action to take: in the old Sprout pool there are still 22,430 ZEC left. After the upgrade, this portion may be permanently locked. If you have shielded addresses from earlier years, go check them yourself—faster than asking someone else.
This market narrative is already quite crowded. Many people are spreading the idea that compliance domestication and compliance expulsion are the same good thing. You can check once a week the asset size of that European ETP—how the channels interpret this regulation will show itself in that number sooner than any interpretation.
1
409
·
--
Verified
On the Binance trading interface from four years ago, BUSD was placed in the most convenient spot, while USDC was merely a tolerated outsider. After the whole BUSD episode, Binance stepped away from the stablecoin issuance end, and that territory was ceded. Now this exchange has turned around and is paying money to become a shareholder of Circle—and it has also tied itself into a five-year promotional agreement. With roles reversed, whose pocket the money ultimately lands in is the balance sheet that should be clarified.
The terms are all laid out in the 8-K. Binance will subscribe to Circle’s Class A common shares at $80.84 per share for a total of roughly $100 million. The deal will be settled on September 17, and disclosed before trading on September 22. The stock cannot be sold, transferred, or hedged within two years. Voting rights remain with Binance. The commercial agreement runs for five years, replacing two older arrangements signed in November 2024 and August 2025, with a focus on emerging markets.
Circle doesn’t really lack this extra $100 million. This equity is more like a block of collateral welded between the interests of both sides: the two-year lock-in keeps Binance pinned in place and promotional fees keep getting collected, but the stock can’t be pushed out. What’s being exchanged for in this transaction is distribution rights—and distribution rights are the priciest cost item in Circle’s business.
The Q2 report lays out this cost structure. Almost all of Circle’s revenue comes from interest on reserve assets. The year-over-year growth in total revenue relative to reserve earnings is 7%. In the same quarter, distribution, trading, and other costs were $412 million, up only 1% year over year. Subtract those growth rates, and the portion the company keeps after distribution has a 15% year-over-year increase. With more partners, money paid out didn’t inflate in a linear way—there are signs that Circle has been able to claw back some pricing power in channel negotiations.
To judge whether this Binance deal is expensive, you first need to use the Coinbase deal as the benchmark. The profit-sharing terms set in 2023 were renewed as-is in August this year through 2029. Coinbase receives all of the yield on its own USDC reserve on its platform, and the remaining portion outside the platform is split in half. In 2024, Circle paid about $908 million for this. With the terms unchanged and the term even longer, Circle can’t move it in the short term.
Binance’s paid structure here is narrower. Circle pays incentive fees monthly. The billing base includes only the portion of USDC held through the Modular Smart Contract Wallet service—that is, the wallet infrastructure Circle provides itself. The other USDC that circulates within the platform doesn’t go into this pool. The downside Circle suffered under the prior agreement is written into this definition.
There’s another layer of accounting that’s easy to overlook. Under the Coinbase deal’s definitions, the USDC on Binance is considered “outside the platform,” and Coinbase still takes half of the remaining residual earnings. For every additional dollar of USDC Circle puts on Binance, it first pays Binance’s monthly fee, then splits the remaining amount with Coinbase, and only then does it eventually reach its own shareholders. Before the marginal profit from the new channel shows up on Circle’s books, it has to pass through two gates.
On the cost side, things are still relatively decent. The USDC circulation volume at quarter-end was $73.3 billion—still up year over year—but it dropped from the end of March, and the in-year peak wasn’t maintained. In the same period, the reserve yield fell by 66 basis points year over year. As unit yield declines and quarter-end balances shrink sequentially, growth in scale turns from a bonus into a necessity. What Binance needs to supply is precisely that gap. Its emerging-market customer base has a rigid demand for dollar accounts—it just previously couldn’t access them.
Market disagreement about this company is a bit exaggerated. On August 3, Morgan Stanley cut CRCL from Neutral to Underweight and slashed the target price to $38, arguing that tokenized cash products and new stablecoin models would likely squeeze its profitability over the long term. The first half of that case holds up: revenue is almost entirely tied to reserve interest, and when the interest-rate environment moves, the entire income statement moves with it. The second half, though, I disagree with. Treating channel expansion as profit leakage doesn’t match the trajectory suggested by the Q2 report. The $412 million figure is right there—it hasn’t risen proportionally with the number of partners. The stock’s later path has moved farther and farther away from that target price.
I’ll rank the three layers of value in this transaction. Equity financing comes last, and the five-year channel lockup sits in the middle. The top value is that Circle has turned a competitor it faced head-on in earlier days into a distribution partner it now binds with equity. A long-term variable hanging outside the balance sheet is pulled inside.
There’s only one condition for the arrangement to fail: the share of distribution, trading, and other costs as a portion of revenue. In the next two quarters, that ratio needs to rise again; meanwhile, if USDC circulation volume at quarter-end drops again quarter over quarter, then it’s essentially “buy scale with profit,” and all the statements above become moot.
The case for the bears is also defensible. Binance’s user base is primarily trading-focused: stablecoins in trading accounts turn over quickly and are thinly “deposited,” unlike the long-term balances at custody-style platforms, which are a different type of asset. Demand in emerging markets is real, but ticket size is low—by the time it’s allocated to reserve earnings, it only becomes evident over several quarters. The agreement is written for five years, but in practice it’s just an upper limit, and early termination clauses remain dangling.
On the market front, $CRCLB spot is quoted at $92.55, down 3.38% over the past 24 hours. The day after the news landed, the price moved back—this extra $100 million wasn’t treated by the market as a reason for revaluation. Binance’s cost basis at 80.84 is still in unrealized profit, and the two-year lockup keeps it temporarily sitting on the books.
What’s worth watching next isn’t the stock price. The on-chain balance structure of #USDC is publicly verifiable, and the line item for distribution costs in Circle’s Q3 report will be disclosed as usual. If you’re interested in this business, you can add these two items to your watchlist and check back on them once per quarter.
On the Binance trading interface from four years ago, BUSD was placed in the most convenient spot, while USDC was merely a tolerated outsider. After the whole BUSD episode, Binance stepped away from the stablecoin issuance end, and that territory was ceded. Now this exchange has turned around and is paying money to become a shareholder of Circle—and it has also tied itself into a five-year promotional agreement. With roles reversed, whose pocket the money ultimately lands in is the balance sheet that should be clarified.
The terms are all laid out in the 8-K. Binance will subscribe to Circle’s Class A common shares at $80.84 per share for a total of roughly $100 million. The deal will be settled on September 17, and disclosed before trading on September 22. The stock cannot be sold, transferred, or hedged within two years. Voting rights remain with Binance. The commercial agreement runs for five years, replacing two older arrangements signed in November 2024 and August 2025, with a focus on emerging markets.
Circle doesn’t really lack this extra $100 million. This equity is more like a block of collateral welded between the interests of both sides: the two-year lock-in keeps Binance pinned in place and promotional fees keep getting collected, but the stock can’t be pushed out. What’s being exchanged for in this transaction is distribution rights—and distribution rights are the priciest cost item in Circle’s business.
The Q2 report lays out this cost structure. Almost all of Circle’s revenue comes from interest on reserve assets. The year-over-year growth in total revenue relative to reserve earnings is 7%. In the same quarter, distribution, trading, and other costs were $412 million, up only 1% year over year. Subtract those growth rates, and the portion the company keeps after distribution has a 15% year-over-year increase. With more partners, money paid out didn’t inflate in a linear way—there are signs that Circle has been able to claw back some pricing power in channel negotiations.
To judge whether this Binance deal is expensive, you first need to use the Coinbase deal as the benchmark. The profit-sharing terms set in 2023 were renewed as-is in August this year through 2029. Coinbase receives all of the yield on its own USDC reserve on its platform, and the remaining portion outside the platform is split in half. In 2024, Circle paid about $908 million for this. With the terms unchanged and the term even longer, Circle can’t move it in the short term.
Binance’s paid structure here is narrower. Circle pays incentive fees monthly. The billing base includes only the portion of USDC held through the Modular Smart Contract Wallet service—that is, the wallet infrastructure Circle provides itself. The other USDC that circulates within the platform doesn’t go into this pool. The downside Circle suffered under the prior agreement is written into this definition.
There’s another layer of accounting that’s easy to overlook. Under the Coinbase deal’s definitions, the USDC on Binance is considered “outside the platform,” and Coinbase still takes half of the remaining residual earnings. For every additional dollar of USDC Circle puts on Binance, it first pays Binance’s monthly fee, then splits the remaining amount with Coinbase, and only then does it eventually reach its own shareholders. Before the marginal profit from the new channel shows up on Circle’s books, it has to pass through two gates.
On the cost side, things are still relatively decent. The USDC circulation volume at quarter-end was $73.3 billion—still up year over year—but it dropped from the end of March, and the in-year peak wasn’t maintained. In the same period, the reserve yield fell by 66 basis points year over year. As unit yield declines and quarter-end balances shrink sequentially, growth in scale turns from a bonus into a necessity. What Binance needs to supply is precisely that gap. Its emerging-market customer base has a rigid demand for dollar accounts—it just previously couldn’t access them.
Market disagreement about this company is a bit exaggerated. On August 3, Morgan Stanley cut CRCL from Neutral to Underweight and slashed the target price to $38, arguing that tokenized cash products and new stablecoin models would likely squeeze its profitability over the long term. The first half of that case holds up: revenue is almost entirely tied to reserve interest, and when the interest-rate environment moves, the entire income statement moves with it. The second half, though, I disagree with. Treating channel expansion as profit leakage doesn’t match the trajectory suggested by the Q2 report. The $412 million figure is right there—it hasn’t risen proportionally with the number of partners. The stock’s later path has moved farther and farther away from that target price.
I’ll rank the three layers of value in this transaction. Equity financing comes last, and the five-year channel lockup sits in the middle. The top value is that Circle has turned a competitor it faced head-on in earlier days into a distribution partner it now binds with equity. A long-term variable hanging outside the balance sheet is pulled inside.
There’s only one condition for the arrangement to fail: the share of distribution, trading, and other costs as a portion of revenue. In the next two quarters, that ratio needs to rise again; meanwhile, if USDC circulation volume at quarter-end drops again quarter over quarter, then it’s essentially “buy scale with profit,” and all the statements above become moot.
The case for the bears is also defensible. Binance’s user base is primarily trading-focused: stablecoins in trading accounts turn over quickly and are thinly “deposited,” unlike the long-term balances at custody-style platforms, which are a different type of asset. Demand in emerging markets is real, but ticket size is low—by the time it’s allocated to reserve earnings, it only becomes evident over several quarters. The agreement is written for five years, but in practice it’s just an upper limit, and early termination clauses remain dangling.
On the market front, $CRCLB spot is quoted at $92.55, down 3.38% over the past 24 hours. The day after the news landed, the price moved back—this extra $100 million wasn’t treated by the market as a reason for revaluation. Binance’s cost basis at 80.84 is still in unrealized profit, and the two-year lockup keeps it temporarily sitting on the books.
What’s worth watching next isn’t the stock price. The on-chain balance structure of #USDC is publicly verifiable, and the line item for distribution costs in Circle’s Q3 report will be disclosed as usual. If you’re interested in this business, you can add these two items to your watchlist and check back on them once per quarter.
The terms are all laid out in the 8-K. Binance will subscribe to Circle’s Class A common shares at $80.84 per share for a total of roughly $100 million. The deal will be settled on September 17, and disclosed before trading on September 22. The stock cannot be sold, transferred, or hedged within two years. Voting rights remain with Binance. The commercial agreement runs for five years, replacing two older arrangements signed in November 2024 and August 2025, with a focus on emerging markets.
Circle doesn’t really lack this extra $100 million. This equity is more like a block of collateral welded between the interests of both sides: the two-year lock-in keeps Binance pinned in place and promotional fees keep getting collected, but the stock can’t be pushed out. What’s being exchanged for in this transaction is distribution rights—and distribution rights are the priciest cost item in Circle’s business.
The Q2 report lays out this cost structure. Almost all of Circle’s revenue comes from interest on reserve assets. The year-over-year growth in total revenue relative to reserve earnings is 7%. In the same quarter, distribution, trading, and other costs were $412 million, up only 1% year over year. Subtract those growth rates, and the portion the company keeps after distribution has a 15% year-over-year increase. With more partners, money paid out didn’t inflate in a linear way—there are signs that Circle has been able to claw back some pricing power in channel negotiations.
To judge whether this Binance deal is expensive, you first need to use the Coinbase deal as the benchmark. The profit-sharing terms set in 2023 were renewed as-is in August this year through 2029. Coinbase receives all of the yield on its own USDC reserve on its platform, and the remaining portion outside the platform is split in half. In 2024, Circle paid about $908 million for this. With the terms unchanged and the term even longer, Circle can’t move it in the short term.
Binance’s paid structure here is narrower. Circle pays incentive fees monthly. The billing base includes only the portion of USDC held through the Modular Smart Contract Wallet service—that is, the wallet infrastructure Circle provides itself. The other USDC that circulates within the platform doesn’t go into this pool. The downside Circle suffered under the prior agreement is written into this definition.
There’s another layer of accounting that’s easy to overlook. Under the Coinbase deal’s definitions, the USDC on Binance is considered “outside the platform,” and Coinbase still takes half of the remaining residual earnings. For every additional dollar of USDC Circle puts on Binance, it first pays Binance’s monthly fee, then splits the remaining amount with Coinbase, and only then does it eventually reach its own shareholders. Before the marginal profit from the new channel shows up on Circle’s books, it has to pass through two gates.
On the cost side, things are still relatively decent. The USDC circulation volume at quarter-end was $73.3 billion—still up year over year—but it dropped from the end of March, and the in-year peak wasn’t maintained. In the same period, the reserve yield fell by 66 basis points year over year. As unit yield declines and quarter-end balances shrink sequentially, growth in scale turns from a bonus into a necessity. What Binance needs to supply is precisely that gap. Its emerging-market customer base has a rigid demand for dollar accounts—it just previously couldn’t access them.
Market disagreement about this company is a bit exaggerated. On August 3, Morgan Stanley cut CRCL from Neutral to Underweight and slashed the target price to $38, arguing that tokenized cash products and new stablecoin models would likely squeeze its profitability over the long term. The first half of that case holds up: revenue is almost entirely tied to reserve interest, and when the interest-rate environment moves, the entire income statement moves with it. The second half, though, I disagree with. Treating channel expansion as profit leakage doesn’t match the trajectory suggested by the Q2 report. The $412 million figure is right there—it hasn’t risen proportionally with the number of partners. The stock’s later path has moved farther and farther away from that target price.
I’ll rank the three layers of value in this transaction. Equity financing comes last, and the five-year channel lockup sits in the middle. The top value is that Circle has turned a competitor it faced head-on in earlier days into a distribution partner it now binds with equity. A long-term variable hanging outside the balance sheet is pulled inside.
There’s only one condition for the arrangement to fail: the share of distribution, trading, and other costs as a portion of revenue. In the next two quarters, that ratio needs to rise again; meanwhile, if USDC circulation volume at quarter-end drops again quarter over quarter, then it’s essentially “buy scale with profit,” and all the statements above become moot.
The case for the bears is also defensible. Binance’s user base is primarily trading-focused: stablecoins in trading accounts turn over quickly and are thinly “deposited,” unlike the long-term balances at custody-style platforms, which are a different type of asset. Demand in emerging markets is real, but ticket size is low—by the time it’s allocated to reserve earnings, it only becomes evident over several quarters. The agreement is written for five years, but in practice it’s just an upper limit, and early termination clauses remain dangling.
On the market front, $CRCLB spot is quoted at $92.55, down 3.38% over the past 24 hours. The day after the news landed, the price moved back—this extra $100 million wasn’t treated by the market as a reason for revaluation. Binance’s cost basis at 80.84 is still in unrealized profit, and the two-year lockup keeps it temporarily sitting on the books.
What’s worth watching next isn’t the stock price. The on-chain balance structure of #USDC is publicly verifiable, and the line item for distribution costs in Circle’s Q3 report will be disclosed as usual. If you’re interested in this business, you can add these two items to your watchlist and check back on them once per quarter.
1
1
1.2k
Log in to explore more content
Join global crypto users on Binance Square
⚡️ Get latest and useful information about crypto.
💬 Trusted by the world’s largest crypto exchange.
👍 Discover real insights from verified creators.
Email / Phone number
Trending Topics
FedMinutesFocusOnOctoberPause
182,686 views
1,338 Discussing
🚨 HIGH ALERT ‼️ PLEASE DON’T TRADE BLINDLY FOR THE NEXT HOUR 🚨
Guys, we have FOMC Minutes coming in less than 1 hour.
And after the kind of volatility we already saw today, I really don’t want anyone opening random high-leverage positions just before this release.
The biggest reaction I’m watching will be in Gold (XAU), Silver (XAG), BTC and ETH. Then coins like SOL and other highly leveraged mid/low-cap alts can exaggerate whatever move BTC makes.
Gold and Silver are especially sensitive tonight because the market is already reacting to the US dollar + Treasury yields, and both metals have been under heavy pressure ahead of the Fed minutes.
Briefly speaking
📉Hawkish Fed Minutes → Dollar/yields can push higher → pressure on BTC, crypto, Gold & silver
📈Dovish Fed Minutes → Dollar/yields can cool → BTC, Gold, Silver and risk assets can bounce hard.
And please remember the first candle can be a trap. We can get a pump, immediate dump, liquidations on both sides, and then the real direction.
So for now, protect your positions, reduce unnecessary leverage and don’t FOMO into the first move.
Tonight I’m watching $XAU , $XAG and $BTC first. These will tell us very quickly how the market is reading the Fed.
I will Update you guys on time
Follow @Panda Traders and Turn on Your notifications right now
#FedMinutesFocusOnOctoberPause
Panda Traders
·19 Likes
·4k views
BinanceLaunchesBinanceIntelligence
1.1M views
6,544 Discussing
EvernorthDelaysNasdaqDebutToOct12
15,439 views
307 Discussing