

Bitcoinworld
69.2k Posts

Bitcoinworld
 Square Verified+
Report
Block User
BitcoinWorld is a leading media publication bringing the latest happenings in the Blockchain and Crypto Space.

#BinanceTurns7

Excellence Award (Market Buzz)

Creator of the Year
2 Following
100.7K+ Followers
287.4K+ Liked
4 Badges
Posts
All
Videos
Live
·
--

Article
See translation
15 Editions. One Industry. One Day in London: FM Summit London Returns on 24 NovemberBitcoinWorld15 Editions. One Industry. One Day in London: FM Summit London Returns on 24 November
On 24 November, Old Billingsgate brings together the decision-makers, industry leaders and companies shaping financial markets. With a headline Speaker Hall, curated Business Connect Roundtables, One to One meetings and one day to make the right connections, the opportunity starts with being in the room.
London, UK — Some industry conversations are worth more than a dozen emails. Some introductions can change the direction of a business. And some opportunities depend on being in the right room at the right time.
On 24 November 2026, FM Summit London returns to Old Billingsgate for its 15th edition, bringing together senior professionals across online trading, institutional finance, brokerage, liquidity, trading technology, fintech, payments and digital assets. Alongside a focused conference programme, the event will feature an exhibition where sponsors and exhibitors can showcase their solutions, connect directly with potential clients, meet industry decision-makers and explore new business opportunities. Through face-to-face networking, targeted meetings and conversations across the exhibition floor, attendees can build partnerships, discover new providers and develop commercial relationships, all under one roof.
The exhibition will feature leading companies including LMAX Group, Plus500, oneZero, PLUGIT, Adaptive, ATFX, CMC Markets, MetaQuotes, Devexperts, Finalto and CXM Prime. Through the Business Connect programme, attendees can also take part in pre-arranged one-to-one meetings and invitation-only roundtables, creating more direct opportunities to discuss business needs, evaluate solutions and establish partnerships with relevant decision-makers.
As FM Summit London approaches its 15th edition, the event is shaping up to be one of its most significant gatherings yet, bringing together established industry leaders, leading companies and decision-makers for a day of business development, knowledge exchange and networking. With an exhibition floor, a focused conference programme and opportunities for targeted meetings, the summit provides a setting for professionals to explore emerging trends, identify new commercial opportunities and build relationships across the industry. For those attending on 24 November, the value lies not only in understanding where the market is heading, but also in connecting with the people and businesses helping to shape its future.
The Connections Start Before the Summit: Opening Blitz on 23 November
The experience begins a day early with the Opening Networking Blitz on 23 November 2026 at The Folly, London. This pre-event gathering gives attendees an opportunity to connect with fellow industry professionals, meet potential business partners and start building valuable relationships ahead of the main Summit on 24 November at Old Billingsgate.
Now in its 15th edition, FM Summit London brings together senior decision-makers, C-level executives and industry leaders across online trading, institutional finance, brokerage, liquidity, trading technology, fintech, payments and digital assets.
The People You Need to Meet Are Coming Together
The value of an industry summit lies in both its agenda and the people in the room.
FM Summit London 2026 brings together key players across brokerage, institutional trading, liquidity, technology and digital assets. Confirmed companies include LMAX Group, Plus500, oneZero, PLUGIT, Adaptive, Edge Hound, AEGIS Trading Technology, MetaQuotes, Devexperts, Acuity and CXM Prime.
The summit offers an opportunity to explore solutions, meet potential clients and partners, and build valuable business relationships through face-to-face conversations.
The Speaker Hall: Hear Directly from the People Shaping the Industry
The most valuable industry insights often come from those who have built businesses, navigated market shifts and helped shape the financial landscape.
At FM Summit London 2026, the Speaker Hall will feature experienced industry leaders sharing perspectives on the evolution and future of financial markets.
Among the highlights is a fireside chat with Lord Peter Cruddas, founder and CEO of CMC Markets, exploring his career, the evolution of retail trading and the industry’s future.
The programme also features:
Hormoz Faryar, Managing Director of Institutional Sales, ATFX Connect, MEA
Andy Ross, Head of Institutional, Kalshi
Waqar Chaudry, Managing Director, Global Head of Digital Assets, Standard Chartered Bank
Representing expertise across institutional sales, trading, digital assets and financial markets, the speakers will bring diverse perspectives to the challenges and opportunities shaping the industry.
Beyond the presentations, the Speaker Hall offers a chance to engage with fresh ideas, exchange perspectives and continue meaningful industry conversations throughout the summit.
Business Connect Roundtables: Where Industry Challenges Meet Candid Discussion
Not every valuable conversation happens on stage. The Business Connect Roundtables at FM Summit London 2026 offer curated, invite-only discussions led by experienced chairs, creating a space for industry professionals to exchange insights and address key business challenges.
The discussions will cover a range of timely industry topics, including digital assets, prediction markets, market liquidity, payments and stablecoins, AI for traders and brokers, the future of funded firms, the role of the UK in retail trading, marketing and answer engine optimisation (AEO), offshore versus onshore licensing, and tokenisation.
These focused discussions encourage practical knowledge-sharing, fresh perspectives and meaningful professional connections. Participation is subject to the programme’s invitation and selection process, making early registration worthwhile for those interested in joining the conversations.
Choose Your Pass and Secure Your Place
FM Summit London 2026 offers three registration pass options, designed for different professional profiles across the financial markets industry.
P1 — Brokers & Prop Firms: Free pass for eligible professionals.
P2 — Affiliates & IBs: Free pass for eligible affiliates, introducing brokers and other qualifying industry professionals.
P3 — Banks & Service Providers: Early-bird pass for eligible banks, payment providers, technology providers and service providers. Early-bird pricing is available until 24 October 2026.
Attendees should select the pass that best matches their professional profile and check the registration page for the applicable terms and pricing.
With the P3 early-bird deadline approaching, eligible service providers should secure their place before 24 October 2026.
Find your pass and register: FM Summit London 2026
The Industry Will Be There. Will You?
FM Summit London 2026 takes place on 24 November 2026 at Old Billingsgate, London, bringing together the professionals, companies and ideas moving financial markets forward for its 15th edition.
With one day to connect with industry leaders, hear directly from experienced voices and explore commercially relevant opportunities, now is the time to review the programme, identify the people you want to meet and plan your attendance.
One Day. One Venue. One Industry. Make sure you are in the room.
Register for FM Summit London 2026 and start planning your day: https://events.financemagnates.com/events/fmsummitlondon
This post 15 Editions. One Industry. One Day in London: FM Summit London Returns on 24 November first appeared on BitcoinWorld.
15 Editions. One Industry. One Day in London: FM Summit London Returns on 24 November
BitcoinWorld15 Editions. One Industry. One Day in London: FM Summit London Returns on 24 November
On 24 November, Old Billingsgate brings together the decision-makers, industry leaders and companies shaping financial markets. With a headline Speaker Hall, curated Business Connect Roundtables, One to One meetings and one day to make the right connections, the opportunity starts with being in the room.
London, UK — Some industry conversations are worth more than a dozen emails. Some introductions can change the direction of a business. And some opportunities depend on being in the right room at the right time.
On 24 November 2026, FM Summit London returns to Old Billingsgate for its 15th edition, bringing together senior professionals across online trading, institutional finance, brokerage, liquidity, trading technology, fintech, payments and digital assets. Alongside a focused conference programme, the event will feature an exhibition where sponsors and exhibitors can showcase their solutions, connect directly with potential clients, meet industry decision-makers and explore new business opportunities. Through face-to-face networking, targeted meetings and conversations across the exhibition floor, attendees can build partnerships, discover new providers and develop commercial relationships, all under one roof.
The exhibition will feature leading companies including LMAX Group, Plus500, oneZero, PLUGIT, Adaptive, ATFX, CMC Markets, MetaQuotes, Devexperts, Finalto and CXM Prime. Through the Business Connect programme, attendees can also take part in pre-arranged one-to-one meetings and invitation-only roundtables, creating more direct opportunities to discuss business needs, evaluate solutions and establish partnerships with relevant decision-makers.
As FM Summit London approaches its 15th edition, the event is shaping up to be one of its most significant gatherings yet, bringing together established industry leaders, leading companies and decision-makers for a day of business development, knowledge exchange and networking. With an exhibition floor, a focused conference programme and opportunities for targeted meetings, the summit provides a setting for professionals to explore emerging trends, identify new commercial opportunities and build relationships across the industry. For those attending on 24 November, the value lies not only in understanding where the market is heading, but also in connecting with the people and businesses helping to shape its future.
The Connections Start Before the Summit: Opening Blitz on 23 November
The experience begins a day early with the Opening Networking Blitz on 23 November 2026 at The Folly, London. This pre-event gathering gives attendees an opportunity to connect with fellow industry professionals, meet potential business partners and start building valuable relationships ahead of the main Summit on 24 November at Old Billingsgate.
Now in its 15th edition, FM Summit London brings together senior decision-makers, C-level executives and industry leaders across online trading, institutional finance, brokerage, liquidity, trading technology, fintech, payments and digital assets.
The People You Need to Meet Are Coming Together
The value of an industry summit lies in both its agenda and the people in the room.
FM Summit London 2026 brings together key players across brokerage, institutional trading, liquidity, technology and digital assets. Confirmed companies include LMAX Group, Plus500, oneZero, PLUGIT, Adaptive, Edge Hound, AEGIS Trading Technology, MetaQuotes, Devexperts, Acuity and CXM Prime.
The summit offers an opportunity to explore solutions, meet potential clients and partners, and build valuable business relationships through face-to-face conversations.
The Speaker Hall: Hear Directly from the People Shaping the Industry
The most valuable industry insights often come from those who have built businesses, navigated market shifts and helped shape the financial landscape.
At FM Summit London 2026, the Speaker Hall will feature experienced industry leaders sharing perspectives on the evolution and future of financial markets.
Among the highlights is a fireside chat with Lord Peter Cruddas, founder and CEO of CMC Markets, exploring his career, the evolution of retail trading and the industry’s future.
The programme also features:
Hormoz Faryar, Managing Director of Institutional Sales, ATFX Connect, MEA
Andy Ross, Head of Institutional, Kalshi
Waqar Chaudry, Managing Director, Global Head of Digital Assets, Standard Chartered Bank
Representing expertise across institutional sales, trading, digital assets and financial markets, the speakers will bring diverse perspectives to the challenges and opportunities shaping the industry.
Beyond the presentations, the Speaker Hall offers a chance to engage with fresh ideas, exchange perspectives and continue meaningful industry conversations throughout the summit.
Business Connect Roundtables: Where Industry Challenges Meet Candid Discussion
Not every valuable conversation happens on stage. The Business Connect Roundtables at FM Summit London 2026 offer curated, invite-only discussions led by experienced chairs, creating a space for industry professionals to exchange insights and address key business challenges.
The discussions will cover a range of timely industry topics, including digital assets, prediction markets, market liquidity, payments and stablecoins, AI for traders and brokers, the future of funded firms, the role of the UK in retail trading, marketing and answer engine optimisation (AEO), offshore versus onshore licensing, and tokenisation.
These focused discussions encourage practical knowledge-sharing, fresh perspectives and meaningful professional connections. Participation is subject to the programme’s invitation and selection process, making early registration worthwhile for those interested in joining the conversations.
Choose Your Pass and Secure Your Place
FM Summit London 2026 offers three registration pass options, designed for different professional profiles across the financial markets industry.
P1 — Brokers & Prop Firms: Free pass for eligible professionals.
P2 — Affiliates & IBs: Free pass for eligible affiliates, introducing brokers and other qualifying industry professionals.
P3 — Banks & Service Providers: Early-bird pass for eligible banks, payment providers, technology providers and service providers. Early-bird pricing is available until 24 October 2026.
Attendees should select the pass that best matches their professional profile and check the registration page for the applicable terms and pricing.
With the P3 early-bird deadline approaching, eligible service providers should secure their place before 24 October 2026.
Find your pass and register: FM Summit London 2026
The Industry Will Be There. Will You?
FM Summit London 2026 takes place on 24 November 2026 at Old Billingsgate, London, bringing together the professionals, companies and ideas moving financial markets forward for its 15th edition.
With one day to connect with industry leaders, hear directly from experienced voices and explore commercially relevant opportunities, now is the time to review the programme, identify the people you want to meet and plan your attendance.
One Day. One Venue. One Industry. Make sure you are in the room.
Register for FM Summit London 2026 and start planning your day: https://events.financemagnates.com/events/fmsummitlondon
This post 15 Editions. One Industry. One Day in London: FM Summit London Returns on 24 November first appeared on BitcoinWorld.
On 24 November, Old Billingsgate brings together the decision-makers, industry leaders and companies shaping financial markets. With a headline Speaker Hall, curated Business Connect Roundtables, One to One meetings and one day to make the right connections, the opportunity starts with being in the room.
London, UK — Some industry conversations are worth more than a dozen emails. Some introductions can change the direction of a business. And some opportunities depend on being in the right room at the right time.
On 24 November 2026, FM Summit London returns to Old Billingsgate for its 15th edition, bringing together senior professionals across online trading, institutional finance, brokerage, liquidity, trading technology, fintech, payments and digital assets. Alongside a focused conference programme, the event will feature an exhibition where sponsors and exhibitors can showcase their solutions, connect directly with potential clients, meet industry decision-makers and explore new business opportunities. Through face-to-face networking, targeted meetings and conversations across the exhibition floor, attendees can build partnerships, discover new providers and develop commercial relationships, all under one roof.
The exhibition will feature leading companies including LMAX Group, Plus500, oneZero, PLUGIT, Adaptive, ATFX, CMC Markets, MetaQuotes, Devexperts, Finalto and CXM Prime. Through the Business Connect programme, attendees can also take part in pre-arranged one-to-one meetings and invitation-only roundtables, creating more direct opportunities to discuss business needs, evaluate solutions and establish partnerships with relevant decision-makers.
As FM Summit London approaches its 15th edition, the event is shaping up to be one of its most significant gatherings yet, bringing together established industry leaders, leading companies and decision-makers for a day of business development, knowledge exchange and networking. With an exhibition floor, a focused conference programme and opportunities for targeted meetings, the summit provides a setting for professionals to explore emerging trends, identify new commercial opportunities and build relationships across the industry. For those attending on 24 November, the value lies not only in understanding where the market is heading, but also in connecting with the people and businesses helping to shape its future.
The Connections Start Before the Summit: Opening Blitz on 23 November
The experience begins a day early with the Opening Networking Blitz on 23 November 2026 at The Folly, London. This pre-event gathering gives attendees an opportunity to connect with fellow industry professionals, meet potential business partners and start building valuable relationships ahead of the main Summit on 24 November at Old Billingsgate.
Now in its 15th edition, FM Summit London brings together senior decision-makers, C-level executives and industry leaders across online trading, institutional finance, brokerage, liquidity, trading technology, fintech, payments and digital assets.
The People You Need to Meet Are Coming Together
The value of an industry summit lies in both its agenda and the people in the room.
FM Summit London 2026 brings together key players across brokerage, institutional trading, liquidity, technology and digital assets. Confirmed companies include LMAX Group, Plus500, oneZero, PLUGIT, Adaptive, Edge Hound, AEGIS Trading Technology, MetaQuotes, Devexperts, Acuity and CXM Prime.
The summit offers an opportunity to explore solutions, meet potential clients and partners, and build valuable business relationships through face-to-face conversations.
The Speaker Hall: Hear Directly from the People Shaping the Industry
The most valuable industry insights often come from those who have built businesses, navigated market shifts and helped shape the financial landscape.
At FM Summit London 2026, the Speaker Hall will feature experienced industry leaders sharing perspectives on the evolution and future of financial markets.
Among the highlights is a fireside chat with Lord Peter Cruddas, founder and CEO of CMC Markets, exploring his career, the evolution of retail trading and the industry’s future.
The programme also features:
Hormoz Faryar, Managing Director of Institutional Sales, ATFX Connect, MEA
Andy Ross, Head of Institutional, Kalshi
Waqar Chaudry, Managing Director, Global Head of Digital Assets, Standard Chartered Bank
Representing expertise across institutional sales, trading, digital assets and financial markets, the speakers will bring diverse perspectives to the challenges and opportunities shaping the industry.
Beyond the presentations, the Speaker Hall offers a chance to engage with fresh ideas, exchange perspectives and continue meaningful industry conversations throughout the summit.
Business Connect Roundtables: Where Industry Challenges Meet Candid Discussion
Not every valuable conversation happens on stage. The Business Connect Roundtables at FM Summit London 2026 offer curated, invite-only discussions led by experienced chairs, creating a space for industry professionals to exchange insights and address key business challenges.
The discussions will cover a range of timely industry topics, including digital assets, prediction markets, market liquidity, payments and stablecoins, AI for traders and brokers, the future of funded firms, the role of the UK in retail trading, marketing and answer engine optimisation (AEO), offshore versus onshore licensing, and tokenisation.
These focused discussions encourage practical knowledge-sharing, fresh perspectives and meaningful professional connections. Participation is subject to the programme’s invitation and selection process, making early registration worthwhile for those interested in joining the conversations.
Choose Your Pass and Secure Your Place
FM Summit London 2026 offers three registration pass options, designed for different professional profiles across the financial markets industry.
P1 — Brokers & Prop Firms: Free pass for eligible professionals.
P2 — Affiliates & IBs: Free pass for eligible affiliates, introducing brokers and other qualifying industry professionals.
P3 — Banks & Service Providers: Early-bird pass for eligible banks, payment providers, technology providers and service providers. Early-bird pricing is available until 24 October 2026.
Attendees should select the pass that best matches their professional profile and check the registration page for the applicable terms and pricing.
With the P3 early-bird deadline approaching, eligible service providers should secure their place before 24 October 2026.
Find your pass and register: FM Summit London 2026
The Industry Will Be There. Will You?
FM Summit London 2026 takes place on 24 November 2026 at Old Billingsgate, London, bringing together the professionals, companies and ideas moving financial markets forward for its 15th edition.
With one day to connect with industry leaders, hear directly from experienced voices and explore commercially relevant opportunities, now is the time to review the programme, identify the people you want to meet and plan your attendance.
One Day. One Venue. One Industry. Make sure you are in the room.
Register for FM Summit London 2026 and start planning your day: https://events.financemagnates.com/events/fmsummitlondon
This post 15 Editions. One Industry. One Day in London: FM Summit London Returns on 24 November first appeared on BitcoinWorld.
213
·
--
Article
See translation
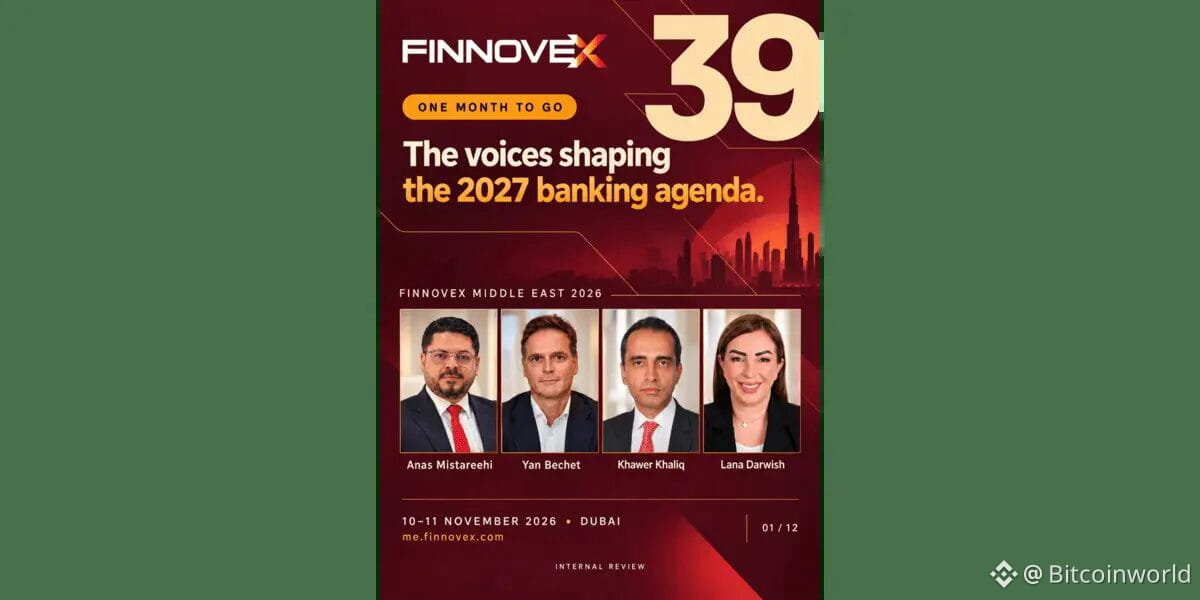
FINNOVEX Returns to Dubai for Chapter 39, Uniting Financial Leaders to Shape the Connected Financ...BitcoinWorldFINNOVEX Returns to Dubai for Chapter 39, Uniting Financial Leaders to Shape the Connected Financial Ecosystem of 2027
Under the theme “Finance in Motion,” the 2026 season finale connects executive priorities, operating evidence and the decisions that will define financial services in 2027.
EVENT : FINNOVEX Middle East — Chapter 39
THEME: Finance in Motion
DATES: 10–11 November 2026
LOCATION: Dubai, UAE
DUBAI, UAE — FINNOVEX Middle East will return to Dubai on 10–11 November 2026 for Chapter 39, bringing senior financial-services leaders together for the closing chapter of the 2026 FINNOVEX Global Series and a forward-looking conversation on the connected financial ecosystem institutions are building for 2027.
Held under the theme “Finance in Motion,” Chapter 39 is designed around a simple reality: financial transformation no longer happens inside a single institution, technology stack or market. Customers move across platforms. Money moves in real time. Intelligence is entering everyday decisions. Regulation is moving closer to the technologies and operating models it governs.
The programme will examine what must move next across customer experience, intelligent infrastructure, payments, data and identity, artificial intelligence, resilience, inclusion and regulation — not as isolated subjects, but as connected decisions that influence trust, growth and execution across the financial system.
“The next era of finance will not be defined by who innovates alone, but by who connects, collaborates and moves the financial ecosystem forward,” said Shabaz Ahmed, Executive Director, FINNOVEX Global Series. “Chapter 39 is about bringing those decisions into one room — connecting ambition with implementation, leadership with accountability, and today’s operating priorities with the financial system we need to build for 2027.”
Day One will focus on executive direction, operating cases, leadership dialogue and recognition, giving participating leaders a shared view of the decisions shaping the region’s financial-services agenda. The programme is intended to move beyond broad transformation language by asking what institutions should connect, govern, scale — or retire — as they set priorities for the year ahead.
Day Two will move into invitation-led executive dialogues and private decision rooms, creating a more focused environment for senior leaders to examine implementation questions, compare operating experience and identify relevant next actions. The format is designed to support substantive peer exchange rather than conventional conference repetition.
The Chapter 39 experience will also extend Beyond the Ballroom through FINNOVEX After Five, creating an informal setting for relationships and conversations to continue after the formal programme. Together, the two-day format connects the public leadership agenda with the quieter executive discussions that often move decisions forward.
Dubai provides a fitting setting for the 2026 finale. As a market where capital, policy, technology, trade and ambition converge at unusual speed, the city reflects the central premise of Finance in Motion: progress increasingly depends on how effectively institutions connect across systems, responsibilities and markets.
Chapter 39 also marks a transition point for FINNOVEX as the platform moves from its 2026 regional journey into its 2027 agenda. The emphasis remains consistent: bringing the right financial leaders, institutions and relevant partners into focused conversations that can translate strategic priorities into clearer operating choices and stronger executive relationships.
FINNOVEX is an Exibex portfolio, organised by Exibex. The FINNOVEX Global Series convenes financial institutions, policy perspectives, technology partners and senior executives through regional chapters and focused leadership formats designed around the practical questions shaping financial services.
PARTNER ACKNOWLEDGEMENT
Current sponsors and partners: Alfa Bank, Sardine, Sense, BPC and Posidex. PR / Communications Partner: Watermelon Communications.
Media & Partnership EnquiriesFINNOVEX Global Series · Exibex FZ LLE info@exibex.com Dubai, United Arab Emirates
This post FINNOVEX Returns to Dubai for Chapter 39, Uniting Financial Leaders to Shape the Connected Financial Ecosystem of 2027 first appeared on BitcoinWorld.
FINNOVEX Returns to Dubai for Chapter 39, Uniting Financial Leaders to Shape the Connected Financ...
BitcoinWorldFINNOVEX Returns to Dubai for Chapter 39, Uniting Financial Leaders to Shape the Connected Financial Ecosystem of 2027
Under the theme “Finance in Motion,” the 2026 season finale connects executive priorities, operating evidence and the decisions that will define financial services in 2027.
EVENT : FINNOVEX Middle East — Chapter 39
THEME: Finance in Motion
DATES: 10–11 November 2026
LOCATION: Dubai, UAE
DUBAI, UAE — FINNOVEX Middle East will return to Dubai on 10–11 November 2026 for Chapter 39, bringing senior financial-services leaders together for the closing chapter of the 2026 FINNOVEX Global Series and a forward-looking conversation on the connected financial ecosystem institutions are building for 2027.
Held under the theme “Finance in Motion,” Chapter 39 is designed around a simple reality: financial transformation no longer happens inside a single institution, technology stack or market. Customers move across platforms. Money moves in real time. Intelligence is entering everyday decisions. Regulation is moving closer to the technologies and operating models it governs.
The programme will examine what must move next across customer experience, intelligent infrastructure, payments, data and identity, artificial intelligence, resilience, inclusion and regulation — not as isolated subjects, but as connected decisions that influence trust, growth and execution across the financial system.
“The next era of finance will not be defined by who innovates alone, but by who connects, collaborates and moves the financial ecosystem forward,” said Shabaz Ahmed, Executive Director, FINNOVEX Global Series. “Chapter 39 is about bringing those decisions into one room — connecting ambition with implementation, leadership with accountability, and today’s operating priorities with the financial system we need to build for 2027.”
Day One will focus on executive direction, operating cases, leadership dialogue and recognition, giving participating leaders a shared view of the decisions shaping the region’s financial-services agenda. The programme is intended to move beyond broad transformation language by asking what institutions should connect, govern, scale — or retire — as they set priorities for the year ahead.
Day Two will move into invitation-led executive dialogues and private decision rooms, creating a more focused environment for senior leaders to examine implementation questions, compare operating experience and identify relevant next actions. The format is designed to support substantive peer exchange rather than conventional conference repetition.
The Chapter 39 experience will also extend Beyond the Ballroom through FINNOVEX After Five, creating an informal setting for relationships and conversations to continue after the formal programme. Together, the two-day format connects the public leadership agenda with the quieter executive discussions that often move decisions forward.
Dubai provides a fitting setting for the 2026 finale. As a market where capital, policy, technology, trade and ambition converge at unusual speed, the city reflects the central premise of Finance in Motion: progress increasingly depends on how effectively institutions connect across systems, responsibilities and markets.
Chapter 39 also marks a transition point for FINNOVEX as the platform moves from its 2026 regional journey into its 2027 agenda. The emphasis remains consistent: bringing the right financial leaders, institutions and relevant partners into focused conversations that can translate strategic priorities into clearer operating choices and stronger executive relationships.
FINNOVEX is an Exibex portfolio, organised by Exibex. The FINNOVEX Global Series convenes financial institutions, policy perspectives, technology partners and senior executives through regional chapters and focused leadership formats designed around the practical questions shaping financial services.
PARTNER ACKNOWLEDGEMENT
Current sponsors and partners: Alfa Bank, Sardine, Sense, BPC and Posidex. PR / Communications Partner: Watermelon Communications.
Media & Partnership EnquiriesFINNOVEX Global Series · Exibex FZ LLE info@exibex.com Dubai, United Arab Emirates
This post FINNOVEX Returns to Dubai for Chapter 39, Uniting Financial Leaders to Shape the Connected Financial Ecosystem of 2027 first appeared on BitcoinWorld.
Under the theme “Finance in Motion,” the 2026 season finale connects executive priorities, operating evidence and the decisions that will define financial services in 2027.
EVENT : FINNOVEX Middle East — Chapter 39
THEME: Finance in Motion
DATES: 10–11 November 2026
LOCATION: Dubai, UAE
DUBAI, UAE — FINNOVEX Middle East will return to Dubai on 10–11 November 2026 for Chapter 39, bringing senior financial-services leaders together for the closing chapter of the 2026 FINNOVEX Global Series and a forward-looking conversation on the connected financial ecosystem institutions are building for 2027.
Held under the theme “Finance in Motion,” Chapter 39 is designed around a simple reality: financial transformation no longer happens inside a single institution, technology stack or market. Customers move across platforms. Money moves in real time. Intelligence is entering everyday decisions. Regulation is moving closer to the technologies and operating models it governs.
The programme will examine what must move next across customer experience, intelligent infrastructure, payments, data and identity, artificial intelligence, resilience, inclusion and regulation — not as isolated subjects, but as connected decisions that influence trust, growth and execution across the financial system.
“The next era of finance will not be defined by who innovates alone, but by who connects, collaborates and moves the financial ecosystem forward,” said Shabaz Ahmed, Executive Director, FINNOVEX Global Series. “Chapter 39 is about bringing those decisions into one room — connecting ambition with implementation, leadership with accountability, and today’s operating priorities with the financial system we need to build for 2027.”
Day One will focus on executive direction, operating cases, leadership dialogue and recognition, giving participating leaders a shared view of the decisions shaping the region’s financial-services agenda. The programme is intended to move beyond broad transformation language by asking what institutions should connect, govern, scale — or retire — as they set priorities for the year ahead.
Day Two will move into invitation-led executive dialogues and private decision rooms, creating a more focused environment for senior leaders to examine implementation questions, compare operating experience and identify relevant next actions. The format is designed to support substantive peer exchange rather than conventional conference repetition.
The Chapter 39 experience will also extend Beyond the Ballroom through FINNOVEX After Five, creating an informal setting for relationships and conversations to continue after the formal programme. Together, the two-day format connects the public leadership agenda with the quieter executive discussions that often move decisions forward.
Dubai provides a fitting setting for the 2026 finale. As a market where capital, policy, technology, trade and ambition converge at unusual speed, the city reflects the central premise of Finance in Motion: progress increasingly depends on how effectively institutions connect across systems, responsibilities and markets.
Chapter 39 also marks a transition point for FINNOVEX as the platform moves from its 2026 regional journey into its 2027 agenda. The emphasis remains consistent: bringing the right financial leaders, institutions and relevant partners into focused conversations that can translate strategic priorities into clearer operating choices and stronger executive relationships.
FINNOVEX is an Exibex portfolio, organised by Exibex. The FINNOVEX Global Series convenes financial institutions, policy perspectives, technology partners and senior executives through regional chapters and focused leadership formats designed around the practical questions shaping financial services.
PARTNER ACKNOWLEDGEMENT
Current sponsors and partners: Alfa Bank, Sardine, Sense, BPC and Posidex. PR / Communications Partner: Watermelon Communications.
Media & Partnership EnquiriesFINNOVEX Global Series · Exibex FZ LLE info@exibex.com Dubai, United Arab Emirates
This post FINNOVEX Returns to Dubai for Chapter 39, Uniting Financial Leaders to Shape the Connected Financial Ecosystem of 2027 first appeared on BitcoinWorld.
160
·
--

Article
See translation
LayerZero ZRO Jumps 10% to $1.98 Ahead of Nov. 30 Mainnet LaunchBitcoinWorldLayerZero ZRO Jumps 10% to $1.98 Ahead of Nov. 30 Mainnet Launch
LayerZero’s ZRO token climbed about 10% to $1.98 over the 24 hours to Oct. 22, 2026, as traders positioned ahead of the Nov. 30 launch of the Zero mainnet and the ATLAS trading system, according to Ambcrypto. The token’s 24-hour trading volume rose more than 50% to $282 million, a sign that the move drew wider participation rather than a thin, low-liquidity spike.
ZRO rose about 10% to $1.98 in 24 hours as investors anticipated the Nov. 30 Zero mainnet and ATLAS launch. Futures positioning is slightly long-skewed and volume topped $282 million, with the $2.00 level now the next technical reference point traders are watching. Key facts
LayerZero has scheduled the Zero mainnet and ATLAS trading infrastructure for Nov. 30, with Open ATLAS expected to support more than a dozen trading venues at launch, crypto.news reported on Oct. 20.
Under the announced fee model, Open ATLAS venues receive rebates of 20% to 65% based on their ZRO stake, trading volume or both, and 75% of the fees remaining after the rebate goes to buying and burning ZRO.
Ambcrypto put ZRO at $1.98, up about 10% in 24 hours, on volume of $282 million — a gain of more than 50%.
Long positions make up 53% of leveraged ZRO futures positions, a slight buyer edge, while the Altcoin Season Index stood at 51.
LayerZero’s ATLAS documentation lists an initial capacity of 200,000 transactions per second, below the 2 million transactions per second per Zone described in its technical paper roadmap.
A launch date, and a token model behind it
The rally has a fixed reference point: the Nov. 30 rollout of Zero, a blockchain that LayerZero has described as separating transaction execution from verification through zero-knowledge proofs. ATLAS will be the first application on that network. In a post cited by crypto.news, the project said it would start with Open ATLAS and add more venues before the end of the year.
ATLAS is not a consumer product. LayerZero’s documentation calls it a “headless exchange” — an order-matching, clearing, settlement and risk engine with no interface of its own, reached only through third-party venues that manage their own users and front ends. The product categories listed include spot assets, perpetual contracts, stocks, commodities, bonds and prediction markets. Open ATLAS is aimed at crypto-native teams; a separate institutional configuration uses the same engine with rules set by the institutions themselves.
The ZRO connection runs through fees. LayerZero has announced a single Open ATLAS trading fee, with venue rebates based on ZRO stake and volume. After the rebate, 25% of the remainder goes to market creators and 75% to buying and burning ZRO. So the buy-and-burn pool scales with trading activity minus whatever venues earn back for staking. Stargate revenue has separately funded ZRO buybacks since April 2026, a policy covered in the October reporting on the token programs.
How the two reports differ
The two accounts frame the same move differently. Ambcrypto leads with the price action — the 10% gain to $1.98, the $282 million volume figure, futures long/short data from Coinalyze and CryptoQuant, and technical levels from TradingView. crypto.news concentrates on the mechanics of what is actually launching: the headless design, the fee-split percentages, the venue rebates and the capacity figures.
LayerZero’s own numbers on capacity are not uniform. The ATLAS FAQ cited by crypto.news gives 200,000 transactions per second for initial provisioning, while the company’s technical paper outlines a roadmap of 2 million transactions per second per Zone. The latency figures in the FAQ — a median below one millisecond, 1.418 milliseconds at the 95th percentile and 2.641 milliseconds at the 99th percentile — are company-reported measurements from a public-deployment environment, not independently verified results from a live mainnet.
Why it matters
ZRO’s rally is a bet on an event date rather than on revenue that has already arrived. If ATLAS venues attract trading volume after Nov. 30, the fee-split mechanism turns that activity into a persistent source of ZRO purchases and burns — a structural demand link that most token launches do not build in. If volume does not materialize, the same mechanism produces little, and the price move would rest on anticipation alone.
For readers, the distinction matters because the launch also tests a bigger claim: that a high-throughput, proof-verified chain can host real trading infrastructure behind third-party venues. LayerZero’s existing business, including a September partnership in which Anchorage Digital selected it to connect stablecoins issued through Anchorage Digital Bank across chains using the Omnichain Fungible Token standard, gives the company a separate revenue base from ATLAS. Tether’s USAT was named as the first such stablecoin to launch with that interoperability.
On the chart, Ambcrypto reported that ZRO held its 20-day EMA near $1.90, leaving $2.00 as the next level to watch and $2.50 as a further resistance zone if momentum persists. Those are technical reference points from the report, not predictions, and the token can just as easily fade if volume drops or futures traders take profits before the event.
What to watch
The Nov. 30 launch itself is the first checkpoint, followed by how many venues go live and whether Open ATLAS trading fees begin flowing into the buy-and-burn pool in the weeks after. Watch the volume figure and the long/short ratio in the run-up: Ambcrypto noted that fading volume or a reversal in futures positioning would undercut the rally’s basis.
This article is for informational purposes only and is not financial advice. Cryptocurrency prices are volatile and can move sharply in either direction; readers should do their own research before making any trading or investment decisions.
Frequently Asked Questions
Is ZRO going to break $2?
Ambcrypto identified $2.00 as the next psychological level after ZRO held its 20-day EMA near $1.90, with $2.50 cited as further resistance if momentum lasts. That is technical commentary, not a guarantee the level will be reached.
What is LayerZero’s Zero mainnet?
Zero is a blockchain that, per LayerZero’s technical description, separates transaction execution from verification using zero-knowledge proofs, with activity divided into concurrent environments called Zones. ATLAS will run in its own Zone.
Do ATLAS trading fees buy ZRO?
Yes, in part. After venue rebates of 20% to 65%, 75% of the remaining fees are allocated to buying and burning ZRO and 25% to market creators, according to the announced model reported by crypto.news.
This post LayerZero ZRO Jumps 10% to $1.98 Ahead of Nov. 30 Mainnet Launch first appeared on BitcoinWorld.
LayerZero ZRO Jumps 10% to $1.98 Ahead of Nov. 30 Mainnet Launch
BitcoinWorldLayerZero ZRO Jumps 10% to $1.98 Ahead of Nov. 30 Mainnet Launch
LayerZero’s ZRO token climbed about 10% to $1.98 over the 24 hours to Oct. 22, 2026, as traders positioned ahead of the Nov. 30 launch of the Zero mainnet and the ATLAS trading system, according to Ambcrypto. The token’s 24-hour trading volume rose more than 50% to $282 million, a sign that the move drew wider participation rather than a thin, low-liquidity spike.
ZRO rose about 10% to $1.98 in 24 hours as investors anticipated the Nov. 30 Zero mainnet and ATLAS launch. Futures positioning is slightly long-skewed and volume topped $282 million, with the $2.00 level now the next technical reference point traders are watching. Key facts
LayerZero has scheduled the Zero mainnet and ATLAS trading infrastructure for Nov. 30, with Open ATLAS expected to support more than a dozen trading venues at launch, crypto.news reported on Oct. 20.
Under the announced fee model, Open ATLAS venues receive rebates of 20% to 65% based on their ZRO stake, trading volume or both, and 75% of the fees remaining after the rebate goes to buying and burning ZRO.
Ambcrypto put ZRO at $1.98, up about 10% in 24 hours, on volume of $282 million — a gain of more than 50%.
Long positions make up 53% of leveraged ZRO futures positions, a slight buyer edge, while the Altcoin Season Index stood at 51.
LayerZero’s ATLAS documentation lists an initial capacity of 200,000 transactions per second, below the 2 million transactions per second per Zone described in its technical paper roadmap.
A launch date, and a token model behind it
The rally has a fixed reference point: the Nov. 30 rollout of Zero, a blockchain that LayerZero has described as separating transaction execution from verification through zero-knowledge proofs. ATLAS will be the first application on that network. In a post cited by crypto.news, the project said it would start with Open ATLAS and add more venues before the end of the year.
ATLAS is not a consumer product. LayerZero’s documentation calls it a “headless exchange” — an order-matching, clearing, settlement and risk engine with no interface of its own, reached only through third-party venues that manage their own users and front ends. The product categories listed include spot assets, perpetual contracts, stocks, commodities, bonds and prediction markets. Open ATLAS is aimed at crypto-native teams; a separate institutional configuration uses the same engine with rules set by the institutions themselves.
The ZRO connection runs through fees. LayerZero has announced a single Open ATLAS trading fee, with venue rebates based on ZRO stake and volume. After the rebate, 25% of the remainder goes to market creators and 75% to buying and burning ZRO. So the buy-and-burn pool scales with trading activity minus whatever venues earn back for staking. Stargate revenue has separately funded ZRO buybacks since April 2026, a policy covered in the October reporting on the token programs.
How the two reports differ
The two accounts frame the same move differently. Ambcrypto leads with the price action — the 10% gain to $1.98, the $282 million volume figure, futures long/short data from Coinalyze and CryptoQuant, and technical levels from TradingView. crypto.news concentrates on the mechanics of what is actually launching: the headless design, the fee-split percentages, the venue rebates and the capacity figures.
LayerZero’s own numbers on capacity are not uniform. The ATLAS FAQ cited by crypto.news gives 200,000 transactions per second for initial provisioning, while the company’s technical paper outlines a roadmap of 2 million transactions per second per Zone. The latency figures in the FAQ — a median below one millisecond, 1.418 milliseconds at the 95th percentile and 2.641 milliseconds at the 99th percentile — are company-reported measurements from a public-deployment environment, not independently verified results from a live mainnet.
Why it matters
ZRO’s rally is a bet on an event date rather than on revenue that has already arrived. If ATLAS venues attract trading volume after Nov. 30, the fee-split mechanism turns that activity into a persistent source of ZRO purchases and burns — a structural demand link that most token launches do not build in. If volume does not materialize, the same mechanism produces little, and the price move would rest on anticipation alone.
For readers, the distinction matters because the launch also tests a bigger claim: that a high-throughput, proof-verified chain can host real trading infrastructure behind third-party venues. LayerZero’s existing business, including a September partnership in which Anchorage Digital selected it to connect stablecoins issued through Anchorage Digital Bank across chains using the Omnichain Fungible Token standard, gives the company a separate revenue base from ATLAS. Tether’s USAT was named as the first such stablecoin to launch with that interoperability.
On the chart, Ambcrypto reported that ZRO held its 20-day EMA near $1.90, leaving $2.00 as the next level to watch and $2.50 as a further resistance zone if momentum persists. Those are technical reference points from the report, not predictions, and the token can just as easily fade if volume drops or futures traders take profits before the event.
What to watch
The Nov. 30 launch itself is the first checkpoint, followed by how many venues go live and whether Open ATLAS trading fees begin flowing into the buy-and-burn pool in the weeks after. Watch the volume figure and the long/short ratio in the run-up: Ambcrypto noted that fading volume or a reversal in futures positioning would undercut the rally’s basis.
This article is for informational purposes only and is not financial advice. Cryptocurrency prices are volatile and can move sharply in either direction; readers should do their own research before making any trading or investment decisions.
Frequently Asked Questions
Is ZRO going to break $2?
Ambcrypto identified $2.00 as the next psychological level after ZRO held its 20-day EMA near $1.90, with $2.50 cited as further resistance if momentum lasts. That is technical commentary, not a guarantee the level will be reached.
What is LayerZero’s Zero mainnet?
Zero is a blockchain that, per LayerZero’s technical description, separates transaction execution from verification using zero-knowledge proofs, with activity divided into concurrent environments called Zones. ATLAS will run in its own Zone.
Do ATLAS trading fees buy ZRO?
Yes, in part. After venue rebates of 20% to 65%, 75% of the remaining fees are allocated to buying and burning ZRO and 25% to market creators, according to the announced model reported by crypto.news.
This post LayerZero ZRO Jumps 10% to $1.98 Ahead of Nov. 30 Mainnet Launch first appeared on BitcoinWorld.
LayerZero’s ZRO token climbed about 10% to $1.98 over the 24 hours to Oct. 22, 2026, as traders positioned ahead of the Nov. 30 launch of the Zero mainnet and the ATLAS trading system, according to Ambcrypto. The token’s 24-hour trading volume rose more than 50% to $282 million, a sign that the move drew wider participation rather than a thin, low-liquidity spike.
ZRO rose about 10% to $1.98 in 24 hours as investors anticipated the Nov. 30 Zero mainnet and ATLAS launch. Futures positioning is slightly long-skewed and volume topped $282 million, with the $2.00 level now the next technical reference point traders are watching. Key facts
LayerZero has scheduled the Zero mainnet and ATLAS trading infrastructure for Nov. 30, with Open ATLAS expected to support more than a dozen trading venues at launch, crypto.news reported on Oct. 20.
Under the announced fee model, Open ATLAS venues receive rebates of 20% to 65% based on their ZRO stake, trading volume or both, and 75% of the fees remaining after the rebate goes to buying and burning ZRO.
Ambcrypto put ZRO at $1.98, up about 10% in 24 hours, on volume of $282 million — a gain of more than 50%.
Long positions make up 53% of leveraged ZRO futures positions, a slight buyer edge, while the Altcoin Season Index stood at 51.
LayerZero’s ATLAS documentation lists an initial capacity of 200,000 transactions per second, below the 2 million transactions per second per Zone described in its technical paper roadmap.
A launch date, and a token model behind it
The rally has a fixed reference point: the Nov. 30 rollout of Zero, a blockchain that LayerZero has described as separating transaction execution from verification through zero-knowledge proofs. ATLAS will be the first application on that network. In a post cited by crypto.news, the project said it would start with Open ATLAS and add more venues before the end of the year.
ATLAS is not a consumer product. LayerZero’s documentation calls it a “headless exchange” — an order-matching, clearing, settlement and risk engine with no interface of its own, reached only through third-party venues that manage their own users and front ends. The product categories listed include spot assets, perpetual contracts, stocks, commodities, bonds and prediction markets. Open ATLAS is aimed at crypto-native teams; a separate institutional configuration uses the same engine with rules set by the institutions themselves.
The ZRO connection runs through fees. LayerZero has announced a single Open ATLAS trading fee, with venue rebates based on ZRO stake and volume. After the rebate, 25% of the remainder goes to market creators and 75% to buying and burning ZRO. So the buy-and-burn pool scales with trading activity minus whatever venues earn back for staking. Stargate revenue has separately funded ZRO buybacks since April 2026, a policy covered in the October reporting on the token programs.
How the two reports differ
The two accounts frame the same move differently. Ambcrypto leads with the price action — the 10% gain to $1.98, the $282 million volume figure, futures long/short data from Coinalyze and CryptoQuant, and technical levels from TradingView. crypto.news concentrates on the mechanics of what is actually launching: the headless design, the fee-split percentages, the venue rebates and the capacity figures.
LayerZero’s own numbers on capacity are not uniform. The ATLAS FAQ cited by crypto.news gives 200,000 transactions per second for initial provisioning, while the company’s technical paper outlines a roadmap of 2 million transactions per second per Zone. The latency figures in the FAQ — a median below one millisecond, 1.418 milliseconds at the 95th percentile and 2.641 milliseconds at the 99th percentile — are company-reported measurements from a public-deployment environment, not independently verified results from a live mainnet.
Why it matters
ZRO’s rally is a bet on an event date rather than on revenue that has already arrived. If ATLAS venues attract trading volume after Nov. 30, the fee-split mechanism turns that activity into a persistent source of ZRO purchases and burns — a structural demand link that most token launches do not build in. If volume does not materialize, the same mechanism produces little, and the price move would rest on anticipation alone.
For readers, the distinction matters because the launch also tests a bigger claim: that a high-throughput, proof-verified chain can host real trading infrastructure behind third-party venues. LayerZero’s existing business, including a September partnership in which Anchorage Digital selected it to connect stablecoins issued through Anchorage Digital Bank across chains using the Omnichain Fungible Token standard, gives the company a separate revenue base from ATLAS. Tether’s USAT was named as the first such stablecoin to launch with that interoperability.
On the chart, Ambcrypto reported that ZRO held its 20-day EMA near $1.90, leaving $2.00 as the next level to watch and $2.50 as a further resistance zone if momentum persists. Those are technical reference points from the report, not predictions, and the token can just as easily fade if volume drops or futures traders take profits before the event.
What to watch
The Nov. 30 launch itself is the first checkpoint, followed by how many venues go live and whether Open ATLAS trading fees begin flowing into the buy-and-burn pool in the weeks after. Watch the volume figure and the long/short ratio in the run-up: Ambcrypto noted that fading volume or a reversal in futures positioning would undercut the rally’s basis.
This article is for informational purposes only and is not financial advice. Cryptocurrency prices are volatile and can move sharply in either direction; readers should do their own research before making any trading or investment decisions.
Frequently Asked Questions
Is ZRO going to break $2?
Ambcrypto identified $2.00 as the next psychological level after ZRO held its 20-day EMA near $1.90, with $2.50 cited as further resistance if momentum lasts. That is technical commentary, not a guarantee the level will be reached.
What is LayerZero’s Zero mainnet?
Zero is a blockchain that, per LayerZero’s technical description, separates transaction execution from verification using zero-knowledge proofs, with activity divided into concurrent environments called Zones. ATLAS will run in its own Zone.
Do ATLAS trading fees buy ZRO?
Yes, in part. After venue rebates of 20% to 65%, 75% of the remaining fees are allocated to buying and burning ZRO and 25% to market creators, according to the announced model reported by crypto.news.
This post LayerZero ZRO Jumps 10% to $1.98 Ahead of Nov. 30 Mainnet Launch first appeared on BitcoinWorld.
2
429
·
--

Article
See translation
Tesla-SpaceX Merger Talks Could Combine 30,221 BitcoinBitcoinWorldTesla-SpaceX Merger Talks Could Combine 30,221 Bitcoin
Elon Musk confirmed on SpaceX’s October 20 earnings call that Tesla and SpaceX have each formed special committees of independent directors to evaluate a potential merger, a combination that would bring 30,221 Bitcoin under a single corporate roof, according to Cryptoslate. Musk said he considers the combination a good idea but is not participating in negotiations due to his ownership stakes in both firms.
Tesla and SpaceX have formed independent committees to explore a merger that would combine their Bitcoin holdings, totaling 30,221 BTC. No terms have been agreed, and the deal requires approval from 50% of Tesla’s outstanding shares. Key facts
SpaceX holds 18,712 BTC and Tesla owns 11,509 BTC as of June 30, for a combined 30,221 BTC worth about $2,508 million at $83,000 per Bitcoin, Cryptoslate reported.
Musk warned that the special committees have not agreed on transaction terms and may never reach a deal; he called a merger assumption “overstating it,” according to Cointelegraph.
A merger would create a company worth roughly $3.5 trillion, combining Grok, X, Starlink, the Terafab chip project, and Tesla’s robotaxi and Optimus businesses, Decrypt reported.
Any deal needs the backing of 50% of all outstanding Tesla shares, which Musk called “quite a high hurdle,” and Tesla’s annual meeting is set for December 3, Decrypt reported.
JPMorgan analyst Rajat Gupta said an all-stock transaction could offer Tesla shareholders a 30% to 35% premium, with Chinese regulatory approval as the biggest obstacle, according to Cryptoslate.
Bitcoin treasury implications
The combined Bitcoin holdings would rank sixth among publicly traded corporate treasuries, behind Strategy, Metaplanet, Twenty One Capital, MARA Holdings, and Strive, based on BitcoinTreasuries’ October 21 rankings and the companies’ disclosed holdings. Cointelegraph reported the merged entity would surpass crypto exchange Bullish in Bitcoin holdings.
The two companies have diverging cryptocurrency histories. Tesla bought $1,500 million in Bitcoin in 2021 before selling about 75% of its holdings the following year to strengthen liquidity. SpaceX acquired its position for roughly $661 million and valued its digital assets at $1,573 million as of September 30, down from $1,637 million at the end of 2025.
Financial and strategic context
SpaceX reported third-quarter revenue of $14.6 billion, up 161% year over year, driven largely by its Super Intelligence AI segment. The segment generated $7.6 billion in revenue, an 830% increase from a year earlier, making it the company’s largest revenue contributor, Cointelegraph reported. Decrypt noted SpaceX booked its first quarterly profit since going public, aided by renting AI server capacity to firms including Anthropic and Google.
Musk highlighted opportunities to integrate AI infrastructure, chip development, and manufacturing, including the jointly developed Terafab semiconductor project. JPMorgan cited overlapping engineering talent and AI infrastructure as compelling reasons to combine the businesses, and highlighted SpaceX’s approximately $2 trillion valuation as valuable acquisition currency.
JPMorgan identified Chinese regulatory approval as potentially the biggest obstacle to a merger. China accounts for roughly 20% of Tesla’s revenue, while SpaceX maintains extensive US defense relationships and operates Starlink, which lacks authorization in China. Analyst Gupta suggested Tesla could separate its Chinese operations under majority local ownership while retaining licensing arrangements.
Wall Street analyst Dan Ives of Yorkville Ives & Co. told Reuters that Tesla shares would need to be valued around $550 apiece to win the vote, according to Decrypt. Tesla investor Gene Munster of Deepwater Asset Management puts the odds of a deal within two years at 95%, Decrypt reported.
Why it matters
A merger would create one of the largest corporate Bitcoin treasuries under a single entity, potentially influencing how the combined company manages its cryptocurrency reserves given Tesla’s history of selling Bitcoin to preserve liquidity. The deal would also concentrate significant AI, space, and automotive assets under Musk’s control, raising national security and regulatory questions across Washington and Beijing. For Tesla shareholders, the transaction could offer a premium but requires a high approval threshold.
What to watch
Tesla’s annual meeting on December 3 and the special committees’ negotiations will determine whether a transaction moves forward. JPMorgan’s note and Barclays’ suggestion that an announcement could come before the meeting indicate that further details may emerge in the coming weeks.
Disclaimer: This article does not constitute financial advice. Cryptocurrency markets are volatile and uncertain; readers should conduct their own research before making any investment decisions.
Frequently Asked Questions
How much Bitcoin would the merged company hold?
The combined entity would hold 30,221 BTC, based on SpaceX’s 18,712 BTC and Tesla’s 11,509 BTC as of June 30.
What are the main obstacles to the merger?
The deal requires approval from 50% of all outstanding Tesla shares, and JPMorgan identified Chinese regulatory approval as a significant hurdle.
When is Tesla’s annual meeting?
Tesla’s annual meeting is scheduled for December 3, per Decrypt.
This post Tesla-SpaceX Merger Talks Could Combine 30,221 Bitcoin first appeared on BitcoinWorld.
Tesla-SpaceX Merger Talks Could Combine 30,221 Bitcoin
BitcoinWorldTesla-SpaceX Merger Talks Could Combine 30,221 Bitcoin
Elon Musk confirmed on SpaceX’s October 20 earnings call that Tesla and SpaceX have each formed special committees of independent directors to evaluate a potential merger, a combination that would bring 30,221 Bitcoin under a single corporate roof, according to Cryptoslate. Musk said he considers the combination a good idea but is not participating in negotiations due to his ownership stakes in both firms.
Tesla and SpaceX have formed independent committees to explore a merger that would combine their Bitcoin holdings, totaling 30,221 BTC. No terms have been agreed, and the deal requires approval from 50% of Tesla’s outstanding shares. Key facts
SpaceX holds 18,712 BTC and Tesla owns 11,509 BTC as of June 30, for a combined 30,221 BTC worth about $2,508 million at $83,000 per Bitcoin, Cryptoslate reported.
Musk warned that the special committees have not agreed on transaction terms and may never reach a deal; he called a merger assumption “overstating it,” according to Cointelegraph.
A merger would create a company worth roughly $3.5 trillion, combining Grok, X, Starlink, the Terafab chip project, and Tesla’s robotaxi and Optimus businesses, Decrypt reported.
Any deal needs the backing of 50% of all outstanding Tesla shares, which Musk called “quite a high hurdle,” and Tesla’s annual meeting is set for December 3, Decrypt reported.
JPMorgan analyst Rajat Gupta said an all-stock transaction could offer Tesla shareholders a 30% to 35% premium, with Chinese regulatory approval as the biggest obstacle, according to Cryptoslate.
Bitcoin treasury implications
The combined Bitcoin holdings would rank sixth among publicly traded corporate treasuries, behind Strategy, Metaplanet, Twenty One Capital, MARA Holdings, and Strive, based on BitcoinTreasuries’ October 21 rankings and the companies’ disclosed holdings. Cointelegraph reported the merged entity would surpass crypto exchange Bullish in Bitcoin holdings.
The two companies have diverging cryptocurrency histories. Tesla bought $1,500 million in Bitcoin in 2021 before selling about 75% of its holdings the following year to strengthen liquidity. SpaceX acquired its position for roughly $661 million and valued its digital assets at $1,573 million as of September 30, down from $1,637 million at the end of 2025.
Financial and strategic context
SpaceX reported third-quarter revenue of $14.6 billion, up 161% year over year, driven largely by its Super Intelligence AI segment. The segment generated $7.6 billion in revenue, an 830% increase from a year earlier, making it the company’s largest revenue contributor, Cointelegraph reported. Decrypt noted SpaceX booked its first quarterly profit since going public, aided by renting AI server capacity to firms including Anthropic and Google.
Musk highlighted opportunities to integrate AI infrastructure, chip development, and manufacturing, including the jointly developed Terafab semiconductor project. JPMorgan cited overlapping engineering talent and AI infrastructure as compelling reasons to combine the businesses, and highlighted SpaceX’s approximately $2 trillion valuation as valuable acquisition currency.
JPMorgan identified Chinese regulatory approval as potentially the biggest obstacle to a merger. China accounts for roughly 20% of Tesla’s revenue, while SpaceX maintains extensive US defense relationships and operates Starlink, which lacks authorization in China. Analyst Gupta suggested Tesla could separate its Chinese operations under majority local ownership while retaining licensing arrangements.
Wall Street analyst Dan Ives of Yorkville Ives & Co. told Reuters that Tesla shares would need to be valued around $550 apiece to win the vote, according to Decrypt. Tesla investor Gene Munster of Deepwater Asset Management puts the odds of a deal within two years at 95%, Decrypt reported.
Why it matters
A merger would create one of the largest corporate Bitcoin treasuries under a single entity, potentially influencing how the combined company manages its cryptocurrency reserves given Tesla’s history of selling Bitcoin to preserve liquidity. The deal would also concentrate significant AI, space, and automotive assets under Musk’s control, raising national security and regulatory questions across Washington and Beijing. For Tesla shareholders, the transaction could offer a premium but requires a high approval threshold.
What to watch
Tesla’s annual meeting on December 3 and the special committees’ negotiations will determine whether a transaction moves forward. JPMorgan’s note and Barclays’ suggestion that an announcement could come before the meeting indicate that further details may emerge in the coming weeks.
Disclaimer: This article does not constitute financial advice. Cryptocurrency markets are volatile and uncertain; readers should conduct their own research before making any investment decisions.
Frequently Asked Questions
How much Bitcoin would the merged company hold?
The combined entity would hold 30,221 BTC, based on SpaceX’s 18,712 BTC and Tesla’s 11,509 BTC as of June 30.
What are the main obstacles to the merger?
The deal requires approval from 50% of all outstanding Tesla shares, and JPMorgan identified Chinese regulatory approval as a significant hurdle.
When is Tesla’s annual meeting?
Tesla’s annual meeting is scheduled for December 3, per Decrypt.
This post Tesla-SpaceX Merger Talks Could Combine 30,221 Bitcoin first appeared on BitcoinWorld.
Elon Musk confirmed on SpaceX’s October 20 earnings call that Tesla and SpaceX have each formed special committees of independent directors to evaluate a potential merger, a combination that would bring 30,221 Bitcoin under a single corporate roof, according to Cryptoslate. Musk said he considers the combination a good idea but is not participating in negotiations due to his ownership stakes in both firms.
Tesla and SpaceX have formed independent committees to explore a merger that would combine their Bitcoin holdings, totaling 30,221 BTC. No terms have been agreed, and the deal requires approval from 50% of Tesla’s outstanding shares. Key facts
SpaceX holds 18,712 BTC and Tesla owns 11,509 BTC as of June 30, for a combined 30,221 BTC worth about $2,508 million at $83,000 per Bitcoin, Cryptoslate reported.
Musk warned that the special committees have not agreed on transaction terms and may never reach a deal; he called a merger assumption “overstating it,” according to Cointelegraph.
A merger would create a company worth roughly $3.5 trillion, combining Grok, X, Starlink, the Terafab chip project, and Tesla’s robotaxi and Optimus businesses, Decrypt reported.
Any deal needs the backing of 50% of all outstanding Tesla shares, which Musk called “quite a high hurdle,” and Tesla’s annual meeting is set for December 3, Decrypt reported.
JPMorgan analyst Rajat Gupta said an all-stock transaction could offer Tesla shareholders a 30% to 35% premium, with Chinese regulatory approval as the biggest obstacle, according to Cryptoslate.
Bitcoin treasury implications
The combined Bitcoin holdings would rank sixth among publicly traded corporate treasuries, behind Strategy, Metaplanet, Twenty One Capital, MARA Holdings, and Strive, based on BitcoinTreasuries’ October 21 rankings and the companies’ disclosed holdings. Cointelegraph reported the merged entity would surpass crypto exchange Bullish in Bitcoin holdings.
The two companies have diverging cryptocurrency histories. Tesla bought $1,500 million in Bitcoin in 2021 before selling about 75% of its holdings the following year to strengthen liquidity. SpaceX acquired its position for roughly $661 million and valued its digital assets at $1,573 million as of September 30, down from $1,637 million at the end of 2025.
Financial and strategic context
SpaceX reported third-quarter revenue of $14.6 billion, up 161% year over year, driven largely by its Super Intelligence AI segment. The segment generated $7.6 billion in revenue, an 830% increase from a year earlier, making it the company’s largest revenue contributor, Cointelegraph reported. Decrypt noted SpaceX booked its first quarterly profit since going public, aided by renting AI server capacity to firms including Anthropic and Google.
Musk highlighted opportunities to integrate AI infrastructure, chip development, and manufacturing, including the jointly developed Terafab semiconductor project. JPMorgan cited overlapping engineering talent and AI infrastructure as compelling reasons to combine the businesses, and highlighted SpaceX’s approximately $2 trillion valuation as valuable acquisition currency.
JPMorgan identified Chinese regulatory approval as potentially the biggest obstacle to a merger. China accounts for roughly 20% of Tesla’s revenue, while SpaceX maintains extensive US defense relationships and operates Starlink, which lacks authorization in China. Analyst Gupta suggested Tesla could separate its Chinese operations under majority local ownership while retaining licensing arrangements.
Wall Street analyst Dan Ives of Yorkville Ives & Co. told Reuters that Tesla shares would need to be valued around $550 apiece to win the vote, according to Decrypt. Tesla investor Gene Munster of Deepwater Asset Management puts the odds of a deal within two years at 95%, Decrypt reported.
Why it matters
A merger would create one of the largest corporate Bitcoin treasuries under a single entity, potentially influencing how the combined company manages its cryptocurrency reserves given Tesla’s history of selling Bitcoin to preserve liquidity. The deal would also concentrate significant AI, space, and automotive assets under Musk’s control, raising national security and regulatory questions across Washington and Beijing. For Tesla shareholders, the transaction could offer a premium but requires a high approval threshold.
What to watch
Tesla’s annual meeting on December 3 and the special committees’ negotiations will determine whether a transaction moves forward. JPMorgan’s note and Barclays’ suggestion that an announcement could come before the meeting indicate that further details may emerge in the coming weeks.
Disclaimer: This article does not constitute financial advice. Cryptocurrency markets are volatile and uncertain; readers should conduct their own research before making any investment decisions.
Frequently Asked Questions
How much Bitcoin would the merged company hold?
The combined entity would hold 30,221 BTC, based on SpaceX’s 18,712 BTC and Tesla’s 11,509 BTC as of June 30.
What are the main obstacles to the merger?
The deal requires approval from 50% of all outstanding Tesla shares, and JPMorgan identified Chinese regulatory approval as a significant hurdle.
When is Tesla’s annual meeting?
Tesla’s annual meeting is scheduled for December 3, per Decrypt.
This post Tesla-SpaceX Merger Talks Could Combine 30,221 Bitcoin first appeared on BitcoinWorld.
283
·
--

Article
See translation
Bybit AI Empowers Users With Their Personal Financial Edge, Adding Personalization and MemoryBitcoinWorldBybit AI Empowers Users with Their Personal Financial Edge, Adding Personalization and Memory
DUBAI, UAE, Oct. 22, 2026 /PRNewswire/ — Bybit, the New Financial Platform trusted by more than 80 million users worldwide, has announced new personalization and memory features for Bybit AI, its in-app intelligent conversational layer. Bybit AI now builds a profile from each user’s assets, positions, behavior and risk profile, connecting wealth, markets and trading across the Bybit ecosystem.
Launched in September, Bybit AI organically unifies Bybit’s core services within a single chat interface. The newly added features extend its capacity from responding to individual requests to maintaining a continuous understanding of the user, giving each user their personal financial edge.
Putting the user at the center, Bybit AI is evolving on three pillars:
Personalized: With permissions granted and limits set, Bybit AI analyzes actual account information, including financial behavior and risk profile alongside assets and positions, to generate outputs tailored to the individual.
Connected: Bybit AI links Markets, Trading, Earn, Card and other Bybit products, drawing on the full picture of a user’s holdings and activity rather than a single product.
Remembered: Users can proactively share their preferences with Bybit AI, which retains this context through long-term memory so that each conversation builds on the previous one.
The release also introduces Featured, a set of customized entry points for specific use cases. Each entry point offers predefined prompts, such as generating a wealth management plan based on a user’s assets and risk tolerance, and returns structured analysis with key data, clear insights and suggested next steps.
Bybit AI supports main account operations while giving users the option to deploy it within a dedicated Bybit AI sub-account. The AI-powered assistant is built on a security-first architecture. Outputs are provided for informational purposes only and do not constitute investment advice. Instructions are executed in chats only after customer authorizations.
Bybit expects to introduce further updates to Bybit AI as it continues to build toward AI-native financial services, with conversational intelligence positioned as core infrastructure.
To explore Bybit AI and learn more about how it works, users may visit: Bybit AI – Learn how to use Bybit through conversation.
#Bybit / #NewFinancialPlatform
About Bybit
Bybit is The New Financial Platform.
We believe every person should have access to every financial opportunity on earth. That’s why we’re building the first intelligent platform that connects anyone, anywhere to the world’s finance.
Trusted by more than 80 million users worldwide, Bybit brings together investing, trading, payments, and wealth-building in a single secure and intelligent ecosystem. Through the combination of AI-powered technology, deep global liquidity, robust security, and transparent operations, Bybit makes global finance more accessible, efficient, and empowering for everyone.
Built for everyone. Powered by intelligence. Open to the world.
Learn more at Bybit.com.
For more details about Bybit, please visit Bybit Press
For media inquiries, please contact: media@bybit.com
For updates, please follow: Bybit’s Communities and Social Media
Facebook | Instagram | LinkedIn | Reddit | Telegram | TikTok | X | Youtube
View original content to download multimedia:https://www.prnewswire.co.uk/news-releases/bybit-ai-empowers-users-with-their-personal-financial-edge-adding-personalization-and-memory-302916350.html
This post Bybit AI Empowers Users with Their Personal Financial Edge, Adding Personalization and Memory first appeared on BitcoinWorld.
Bybit AI Empowers Users With Their Personal Financial Edge, Adding Personalization and Memory
BitcoinWorldBybit AI Empowers Users with Their Personal Financial Edge, Adding Personalization and Memory
DUBAI, UAE, Oct. 22, 2026 /PRNewswire/ — Bybit, the New Financial Platform trusted by more than 80 million users worldwide, has announced new personalization and memory features for Bybit AI, its in-app intelligent conversational layer. Bybit AI now builds a profile from each user’s assets, positions, behavior and risk profile, connecting wealth, markets and trading across the Bybit ecosystem.
Launched in September, Bybit AI organically unifies Bybit’s core services within a single chat interface. The newly added features extend its capacity from responding to individual requests to maintaining a continuous understanding of the user, giving each user their personal financial edge.
Putting the user at the center, Bybit AI is evolving on three pillars:
Personalized: With permissions granted and limits set, Bybit AI analyzes actual account information, including financial behavior and risk profile alongside assets and positions, to generate outputs tailored to the individual.
Connected: Bybit AI links Markets, Trading, Earn, Card and other Bybit products, drawing on the full picture of a user’s holdings and activity rather than a single product.
Remembered: Users can proactively share their preferences with Bybit AI, which retains this context through long-term memory so that each conversation builds on the previous one.
The release also introduces Featured, a set of customized entry points for specific use cases. Each entry point offers predefined prompts, such as generating a wealth management plan based on a user’s assets and risk tolerance, and returns structured analysis with key data, clear insights and suggested next steps.
Bybit AI supports main account operations while giving users the option to deploy it within a dedicated Bybit AI sub-account. The AI-powered assistant is built on a security-first architecture. Outputs are provided for informational purposes only and do not constitute investment advice. Instructions are executed in chats only after customer authorizations.
Bybit expects to introduce further updates to Bybit AI as it continues to build toward AI-native financial services, with conversational intelligence positioned as core infrastructure.
To explore Bybit AI and learn more about how it works, users may visit: Bybit AI – Learn how to use Bybit through conversation.
#Bybit / #NewFinancialPlatform
About Bybit
Bybit is The New Financial Platform.
We believe every person should have access to every financial opportunity on earth. That’s why we’re building the first intelligent platform that connects anyone, anywhere to the world’s finance.
Trusted by more than 80 million users worldwide, Bybit brings together investing, trading, payments, and wealth-building in a single secure and intelligent ecosystem. Through the combination of AI-powered technology, deep global liquidity, robust security, and transparent operations, Bybit makes global finance more accessible, efficient, and empowering for everyone.
Built for everyone. Powered by intelligence. Open to the world.
Learn more at Bybit.com.
For more details about Bybit, please visit Bybit Press
For media inquiries, please contact: media@bybit.com
For updates, please follow: Bybit’s Communities and Social Media
Facebook | Instagram | LinkedIn | Reddit | Telegram | TikTok | X | Youtube
View original content to download multimedia:https://www.prnewswire.co.uk/news-releases/bybit-ai-empowers-users-with-their-personal-financial-edge-adding-personalization-and-memory-302916350.html
This post Bybit AI Empowers Users with Their Personal Financial Edge, Adding Personalization and Memory first appeared on BitcoinWorld.
DUBAI, UAE, Oct. 22, 2026 /PRNewswire/ — Bybit, the New Financial Platform trusted by more than 80 million users worldwide, has announced new personalization and memory features for Bybit AI, its in-app intelligent conversational layer. Bybit AI now builds a profile from each user’s assets, positions, behavior and risk profile, connecting wealth, markets and trading across the Bybit ecosystem.
Launched in September, Bybit AI organically unifies Bybit’s core services within a single chat interface. The newly added features extend its capacity from responding to individual requests to maintaining a continuous understanding of the user, giving each user their personal financial edge.
Putting the user at the center, Bybit AI is evolving on three pillars:
Personalized: With permissions granted and limits set, Bybit AI analyzes actual account information, including financial behavior and risk profile alongside assets and positions, to generate outputs tailored to the individual.
Connected: Bybit AI links Markets, Trading, Earn, Card and other Bybit products, drawing on the full picture of a user’s holdings and activity rather than a single product.
Remembered: Users can proactively share their preferences with Bybit AI, which retains this context through long-term memory so that each conversation builds on the previous one.
The release also introduces Featured, a set of customized entry points for specific use cases. Each entry point offers predefined prompts, such as generating a wealth management plan based on a user’s assets and risk tolerance, and returns structured analysis with key data, clear insights and suggested next steps.
Bybit AI supports main account operations while giving users the option to deploy it within a dedicated Bybit AI sub-account. The AI-powered assistant is built on a security-first architecture. Outputs are provided for informational purposes only and do not constitute investment advice. Instructions are executed in chats only after customer authorizations.
Bybit expects to introduce further updates to Bybit AI as it continues to build toward AI-native financial services, with conversational intelligence positioned as core infrastructure.
To explore Bybit AI and learn more about how it works, users may visit: Bybit AI – Learn how to use Bybit through conversation.
#Bybit / #NewFinancialPlatform
About Bybit
Bybit is The New Financial Platform.
We believe every person should have access to every financial opportunity on earth. That’s why we’re building the first intelligent platform that connects anyone, anywhere to the world’s finance.
Trusted by more than 80 million users worldwide, Bybit brings together investing, trading, payments, and wealth-building in a single secure and intelligent ecosystem. Through the combination of AI-powered technology, deep global liquidity, robust security, and transparent operations, Bybit makes global finance more accessible, efficient, and empowering for everyone.
Built for everyone. Powered by intelligence. Open to the world.
Learn more at Bybit.com.
For more details about Bybit, please visit Bybit Press
For media inquiries, please contact: media@bybit.com
For updates, please follow: Bybit’s Communities and Social Media
Facebook | Instagram | LinkedIn | Reddit | Telegram | TikTok | X | Youtube
View original content to download multimedia:https://www.prnewswire.co.uk/news-releases/bybit-ai-empowers-users-with-their-personal-financial-edge-adding-personalization-and-memory-302916350.html
This post Bybit AI Empowers Users with Their Personal Financial Edge, Adding Personalization and Memory first appeared on BitcoinWorld.
206
·
--

Article
See translation
EDGE Markets on Track to Process $2 Billion This NFL Season As Fans Embrace 24/7 TradingBitcoinWorldEDGE Markets on Track to Process $2 Billion This NFL Season as Fans Embrace 24/7 Trading
As football fans trade around the clock, demand is surging for a payment card and infrastructure that moves money in real time
NEW YORK, Oct. 22, 2026 /PRNewswire/ — EDGE Markets, a financial services company purpose-built for prediction markets, gaming, and crypto, today announced it expects to process more than $2 billion in transactions this NFL season, outpacing the $1.2 billion EDGE processed last season. The milestone follows the launch of EDGE Connect, which moves funds in real time from EDGE Boost to partner prediction markets.
A Sunday upset, an injury report or a Monday-night comeback can shift markets in seconds, and traders need their money ready when it happens. EDGE Boost, a special purpose debit account and Visa debit card, keeps users trading funds in one dedicated place, separate from everyday finances. Paired with EDGE Connect, it sends those funds in real time to Kalshi, Polymarket, ProphetX and Splash Sports, even when banks are closed.
Football season brings a surge in real-time activity for EDGE Boost cardholders. In the first 44 days of the season, EDGE processed more than $800 million in transactions, nearly four times over the same period last season.
“Football has become a 24/7 market, and the money behind it has been stuck on banking hours,” said Seni Thomas, CEO and Founder of EDGE Markets. “Fans want a fast, dedicated way to fund their sports entertainment, and we keep building and improving our products around the idea that money should move as fast as the game does.”
What sets EDGE Boost apart:
Real-time, 24/7/365. Traders can move money from their EDGE Boost balance to a partner market in real time even as traditional transfers sit idle.
Rewards. Cardholders earn up to 0.5% cash back on qualifying spend categories.
Built for size. Up to $5 million per transaction and $50 million per day can move from EDGE Boost to Kalshi, Polymarket or ProphetX.
Zero fees. No fees to move money onto partner markets.
No credit cards. EDGE Boost is funded with traders’ own money by ACH from a linked checking or savings account, by wire, or with crypto converted to USD through Zero Hash1. It is never funded with credit.
A dedicated account. A special purpose debit account and Visa debit card keeps trading activity separate from everyday finances, so traders can see their full trading balance in one place.
With the playoffs and the holiday slate still ahead, football’s highest-volume weeks are yet to come. EDGE Boost is available now at edgeboost.io and on iOS and Google Play, so fans can open an account and fund their trades in real time before the next kickoff.
About EDGE Markets
EDGE Markets is a U.S. financial services company that empowers users with financial transparency, supporting emerging verticals such as betting, gaming and casinos. Its original product, EDGE Boost, is the first responsible financial platform for smart bettors. It is the first of its kind in a betting-only debit card account that is FDIC and/or NCUA deposit insurance up to $10,000,000 or more through Cross River Bank, Member FDIC, and Participating Institutions2.
Media Contact: press@edgemarkets.io
1 Virtual currency services are provided by Zero Hash LLC. Zero Hash LLC is licensed by the New York State Department of Financial Services to engage in Virtual Currency Business Activity. Availability of virtual currency services is subject to applicable regulatory requirements, geographic restrictions, and any required approvals. Certain services may not be available in all jurisdictions.
2 Deposit accounts are held at Cross River Bank, Member FDIC, and are insured up to $250,000 per depositor. Through our relationship with IntraFi® Network Deposits℠, funds may be eligible for additional FDIC insurance coverage by being distributed across participating network banks, up to $10,000,000 in aggregate for consumer accounts enrolled in the applicable program. FDIC insurance coverage is subject to applicable terms and conditions, including account structure, account ownership categories and regulatory requirements. The EDGE Boost Visa® Debit Card is issued by Cross River Bank, Member FDIC, pursuant to a license from Visa U.S.A. Inc., and is not available to all residents of U.S. territories. Account limits and other applicable terms are described in our Terms of Service and Cardholder Agreement and CRB Account Agreement.
View original content to download multimedia:https://www.prnewswire.com/apac/news-releases/edge-markets-on-track-to-process-2-billion-this-nfl-season-as-fans-embrace-247-trading-302915943.html
SOURCE EDGE Markets
This post EDGE Markets on Track to Process $2 Billion This NFL Season as Fans Embrace 24/7 Trading first appeared on BitcoinWorld.
EDGE Markets on Track to Process $2 Billion This NFL Season As Fans Embrace 24/7 Trading
BitcoinWorldEDGE Markets on Track to Process $2 Billion This NFL Season as Fans Embrace 24/7 Trading
As football fans trade around the clock, demand is surging for a payment card and infrastructure that moves money in real time
NEW YORK, Oct. 22, 2026 /PRNewswire/ — EDGE Markets, a financial services company purpose-built for prediction markets, gaming, and crypto, today announced it expects to process more than $2 billion in transactions this NFL season, outpacing the $1.2 billion EDGE processed last season. The milestone follows the launch of EDGE Connect, which moves funds in real time from EDGE Boost to partner prediction markets.
A Sunday upset, an injury report or a Monday-night comeback can shift markets in seconds, and traders need their money ready when it happens. EDGE Boost, a special purpose debit account and Visa debit card, keeps users trading funds in one dedicated place, separate from everyday finances. Paired with EDGE Connect, it sends those funds in real time to Kalshi, Polymarket, ProphetX and Splash Sports, even when banks are closed.
Football season brings a surge in real-time activity for EDGE Boost cardholders. In the first 44 days of the season, EDGE processed more than $800 million in transactions, nearly four times over the same period last season.
“Football has become a 24/7 market, and the money behind it has been stuck on banking hours,” said Seni Thomas, CEO and Founder of EDGE Markets. “Fans want a fast, dedicated way to fund their sports entertainment, and we keep building and improving our products around the idea that money should move as fast as the game does.”
What sets EDGE Boost apart:
Real-time, 24/7/365. Traders can move money from their EDGE Boost balance to a partner market in real time even as traditional transfers sit idle.
Rewards. Cardholders earn up to 0.5% cash back on qualifying spend categories.
Built for size. Up to $5 million per transaction and $50 million per day can move from EDGE Boost to Kalshi, Polymarket or ProphetX.
Zero fees. No fees to move money onto partner markets.
No credit cards. EDGE Boost is funded with traders’ own money by ACH from a linked checking or savings account, by wire, or with crypto converted to USD through Zero Hash1. It is never funded with credit.
A dedicated account. A special purpose debit account and Visa debit card keeps trading activity separate from everyday finances, so traders can see their full trading balance in one place.
With the playoffs and the holiday slate still ahead, football’s highest-volume weeks are yet to come. EDGE Boost is available now at edgeboost.io and on iOS and Google Play, so fans can open an account and fund their trades in real time before the next kickoff.
About EDGE Markets
EDGE Markets is a U.S. financial services company that empowers users with financial transparency, supporting emerging verticals such as betting, gaming and casinos. Its original product, EDGE Boost, is the first responsible financial platform for smart bettors. It is the first of its kind in a betting-only debit card account that is FDIC and/or NCUA deposit insurance up to $10,000,000 or more through Cross River Bank, Member FDIC, and Participating Institutions2.
Media Contact: press@edgemarkets.io
1 Virtual currency services are provided by Zero Hash LLC. Zero Hash LLC is licensed by the New York State Department of Financial Services to engage in Virtual Currency Business Activity. Availability of virtual currency services is subject to applicable regulatory requirements, geographic restrictions, and any required approvals. Certain services may not be available in all jurisdictions.
2 Deposit accounts are held at Cross River Bank, Member FDIC, and are insured up to $250,000 per depositor. Through our relationship with IntraFi® Network Deposits℠, funds may be eligible for additional FDIC insurance coverage by being distributed across participating network banks, up to $10,000,000 in aggregate for consumer accounts enrolled in the applicable program. FDIC insurance coverage is subject to applicable terms and conditions, including account structure, account ownership categories and regulatory requirements. The EDGE Boost Visa® Debit Card is issued by Cross River Bank, Member FDIC, pursuant to a license from Visa U.S.A. Inc., and is not available to all residents of U.S. territories. Account limits and other applicable terms are described in our Terms of Service and Cardholder Agreement and CRB Account Agreement.
View original content to download multimedia:https://www.prnewswire.com/apac/news-releases/edge-markets-on-track-to-process-2-billion-this-nfl-season-as-fans-embrace-247-trading-302915943.html
SOURCE EDGE Markets
This post EDGE Markets on Track to Process $2 Billion This NFL Season as Fans Embrace 24/7 Trading first appeared on BitcoinWorld.
As football fans trade around the clock, demand is surging for a payment card and infrastructure that moves money in real time
NEW YORK, Oct. 22, 2026 /PRNewswire/ — EDGE Markets, a financial services company purpose-built for prediction markets, gaming, and crypto, today announced it expects to process more than $2 billion in transactions this NFL season, outpacing the $1.2 billion EDGE processed last season. The milestone follows the launch of EDGE Connect, which moves funds in real time from EDGE Boost to partner prediction markets.
A Sunday upset, an injury report or a Monday-night comeback can shift markets in seconds, and traders need their money ready when it happens. EDGE Boost, a special purpose debit account and Visa debit card, keeps users trading funds in one dedicated place, separate from everyday finances. Paired with EDGE Connect, it sends those funds in real time to Kalshi, Polymarket, ProphetX and Splash Sports, even when banks are closed.
Football season brings a surge in real-time activity for EDGE Boost cardholders. In the first 44 days of the season, EDGE processed more than $800 million in transactions, nearly four times over the same period last season.
“Football has become a 24/7 market, and the money behind it has been stuck on banking hours,” said Seni Thomas, CEO and Founder of EDGE Markets. “Fans want a fast, dedicated way to fund their sports entertainment, and we keep building and improving our products around the idea that money should move as fast as the game does.”
What sets EDGE Boost apart:
Real-time, 24/7/365. Traders can move money from their EDGE Boost balance to a partner market in real time even as traditional transfers sit idle.
Rewards. Cardholders earn up to 0.5% cash back on qualifying spend categories.
Built for size. Up to $5 million per transaction and $50 million per day can move from EDGE Boost to Kalshi, Polymarket or ProphetX.
Zero fees. No fees to move money onto partner markets.
No credit cards. EDGE Boost is funded with traders’ own money by ACH from a linked checking or savings account, by wire, or with crypto converted to USD through Zero Hash1. It is never funded with credit.
A dedicated account. A special purpose debit account and Visa debit card keeps trading activity separate from everyday finances, so traders can see their full trading balance in one place.
With the playoffs and the holiday slate still ahead, football’s highest-volume weeks are yet to come. EDGE Boost is available now at edgeboost.io and on iOS and Google Play, so fans can open an account and fund their trades in real time before the next kickoff.
About EDGE Markets
EDGE Markets is a U.S. financial services company that empowers users with financial transparency, supporting emerging verticals such as betting, gaming and casinos. Its original product, EDGE Boost, is the first responsible financial platform for smart bettors. It is the first of its kind in a betting-only debit card account that is FDIC and/or NCUA deposit insurance up to $10,000,000 or more through Cross River Bank, Member FDIC, and Participating Institutions2.
Media Contact: press@edgemarkets.io
1 Virtual currency services are provided by Zero Hash LLC. Zero Hash LLC is licensed by the New York State Department of Financial Services to engage in Virtual Currency Business Activity. Availability of virtual currency services is subject to applicable regulatory requirements, geographic restrictions, and any required approvals. Certain services may not be available in all jurisdictions.
2 Deposit accounts are held at Cross River Bank, Member FDIC, and are insured up to $250,000 per depositor. Through our relationship with IntraFi® Network Deposits℠, funds may be eligible for additional FDIC insurance coverage by being distributed across participating network banks, up to $10,000,000 in aggregate for consumer accounts enrolled in the applicable program. FDIC insurance coverage is subject to applicable terms and conditions, including account structure, account ownership categories and regulatory requirements. The EDGE Boost Visa® Debit Card is issued by Cross River Bank, Member FDIC, pursuant to a license from Visa U.S.A. Inc., and is not available to all residents of U.S. territories. Account limits and other applicable terms are described in our Terms of Service and Cardholder Agreement and CRB Account Agreement.
View original content to download multimedia:https://www.prnewswire.com/apac/news-releases/edge-markets-on-track-to-process-2-billion-this-nfl-season-as-fans-embrace-247-trading-302915943.html
SOURCE EDGE Markets
This post EDGE Markets on Track to Process $2 Billion This NFL Season as Fans Embrace 24/7 Trading first appeared on BitcoinWorld.
1
199
·
--

Article
See translation
One Month to Go: Prediction Markets Summit Europe Breaking Ground in GibraltarBitcoinWorldOne Month to Go: Prediction Markets Summit Europe Breaking Ground in Gibraltar
With only one month to go, the inaugural Prediction Markets Summit Europe will bring together industry stakeholders in Gibraltar on 9–10 November 2026 to discuss regulation, commercial opportunities and the future development of prediction markets.
Taking place at Sunborn Gibraltar, the event will welcome operators, regulators, investors, technology providers, legal experts and broader market participants to examine the opportunities facing this developing sector.
With Gibraltar emerging as a key jurisdiction in the industry’s regulatory development, the summit will explore the frameworks, technologies and commercial strategies that could shape the growth of prediction markets as they enter the European fold.
Sponsor Spotlight: BetConstruct AI
BetConstruct AI joins Prediction Markets Summit Europe 2026 as a valued sponsor, bringing its experience in gaming technology to discussions around the evolving relationship between technology, regulation and emerging market models.
As artificial intelligence becomes increasingly relevant to gaming technology and operations, questions around its commercial potential, transparency and responsible application are becoming more important.
Ahead of the summit, the Eventus team put five questions to Seda Hovsepyan, BetConstruct’s Regional Business Development Manager, about AI, the future of prediction markets and the varying trends and outliers which face the industry.
Key Insights from BetConstruct AI
On AI’s potential to shape prediction markets
Prediction markets are developing rapidly across Europe and beyond. When asked where BetConstruct sees AI having the greatest potential to shape the next generation of these markets, Seda replied:
“We’ve already seen how AI is transforming the gaming industry, particularly in data analysis, risk management, and personalization.
For prediction markets, I see a similar opportunity. AI can help analyze huge amounts of real-time information, identify emerging trends, and support more efficient market operations.
But what really excites me is the possibility of making complex markets easier for everyday users to understand and participate in.”
On lessons from the gaming industry
Prediction markets sit at the intersection of traditional gaming, financial markets and emerging technology. Seda was asked what the prediction-market sector can learn from the gaming industry’s experience with AI.
“We’ve spent years developing technologies that manage large volumes of transactions, analyze user behavior, detect suspicious activity, and deliver personalized experiences in real time.
At BetConstruct, we see how important it is to combine innovation with reliability and operational efficiency.
One important lesson is that AI should not simply be introduced because it’s trending. It needs to solve real problems, improve performance, and create measurable value.
Prediction markets can benefit from this experience, particularly when it comes to scalability, risk management, and building long-term user trust.”
On opportunities for innovation
As prediction markets expand into new categories and jurisdictions, Seda had this to say about where AI could have the greatest impact on the user experience and the infrastructure supporting these markets.
“For me, there are two major opportunities: personalization and operational efficiency.
From the user’s perspective, AI can make platforms more intuitive, help people discover relevant markets, and present complicated information in a much simpler way.
From the operator’s perspective, AI can support market monitoring, fraud detection, risk analysis, and faster decision-making.
And because I work closely with different European markets, I also see a huge opportunity in helping platforms adapt to different regulatory environments and local user expectations.”
On trust and responsible innovation
With AI raising questions around transparency, responsible use and trust, Seda was asked what safeguards will be essential as the technology becomes more deeply integrated into emerging market models such as prediction markets.
“Trust will be one of the most important factors determining the future of prediction markets.
AI brings incredible opportunities, but transparency and responsibility have to develop alongside innovation. Users need to understand how markets operate, how outcomes are determined, and how their data is being used.
We also need strong safeguards against manipulation, fraud, and misleading information, supported by human oversight and clear accountability.
Coming from the gaming industry, we know that responsible practices and regulatory compliance are not optional. They’re essential for sustainable growth.”
Looking ahead to PX Markets Europe
Finally, Seda was asked what its representative is most looking forward to exploring at the upcoming PX Markets Summit Europe, and which developments the wider industry should be paying closer attention to.
“I’m particularly excited to see how prediction markets are evolving and how technology providers, operators, and regulators are approaching this emerging sector.
Working in European business development at BetConstruct, I’m always interested in identifying new opportunities, understanding market trends, and exploring where our industry’s experience can create value.
I think the wider industry should be paying closer attention to the intersection of AI, regulation, and user experience.
Prediction markets have enormous potential, but their long-term success will depend on how well we balance innovation, trust, and commercial sustainability.
And that’s exactly why events like PX Markets Europe are so valuable: they bring together different perspectives and help shape what comes next.”
Meet BetConstruct AI at PX Markets Summit Europe
PX Markets Summit Europe 2026 takes place on 9–10 November at Sunborn Gibraltar. Industry professionals are invited to join the summit for discussions with the people shaping the prediction-market ecosystem.
Register for PX Markets Summit Europe: https://www.eventus-international.com/pm-europe
Organisations interested in sponsorship and exhibition opportunities can contact Eventus International to discuss participation.
For sponsorship or exhibition enquiries, contact:
Lou-Mari Burnett,
Chief Operating Officer, Eventus International
loumari@eventus-international.com
This post One Month to Go: Prediction Markets Summit Europe Breaking Ground in Gibraltar first appeared on BitcoinWorld.
One Month to Go: Prediction Markets Summit Europe Breaking Ground in Gibraltar
BitcoinWorldOne Month to Go: Prediction Markets Summit Europe Breaking Ground in Gibraltar
With only one month to go, the inaugural Prediction Markets Summit Europe will bring together industry stakeholders in Gibraltar on 9–10 November 2026 to discuss regulation, commercial opportunities and the future development of prediction markets.
Taking place at Sunborn Gibraltar, the event will welcome operators, regulators, investors, technology providers, legal experts and broader market participants to examine the opportunities facing this developing sector.
With Gibraltar emerging as a key jurisdiction in the industry’s regulatory development, the summit will explore the frameworks, technologies and commercial strategies that could shape the growth of prediction markets as they enter the European fold.
Sponsor Spotlight: BetConstruct AI
BetConstruct AI joins Prediction Markets Summit Europe 2026 as a valued sponsor, bringing its experience in gaming technology to discussions around the evolving relationship between technology, regulation and emerging market models.
As artificial intelligence becomes increasingly relevant to gaming technology and operations, questions around its commercial potential, transparency and responsible application are becoming more important.
Ahead of the summit, the Eventus team put five questions to Seda Hovsepyan, BetConstruct’s Regional Business Development Manager, about AI, the future of prediction markets and the varying trends and outliers which face the industry.
Key Insights from BetConstruct AI
On AI’s potential to shape prediction markets
Prediction markets are developing rapidly across Europe and beyond. When asked where BetConstruct sees AI having the greatest potential to shape the next generation of these markets, Seda replied:
“We’ve already seen how AI is transforming the gaming industry, particularly in data analysis, risk management, and personalization.
For prediction markets, I see a similar opportunity. AI can help analyze huge amounts of real-time information, identify emerging trends, and support more efficient market operations.
But what really excites me is the possibility of making complex markets easier for everyday users to understand and participate in.”
On lessons from the gaming industry
Prediction markets sit at the intersection of traditional gaming, financial markets and emerging technology. Seda was asked what the prediction-market sector can learn from the gaming industry’s experience with AI.
“We’ve spent years developing technologies that manage large volumes of transactions, analyze user behavior, detect suspicious activity, and deliver personalized experiences in real time.
At BetConstruct, we see how important it is to combine innovation with reliability and operational efficiency.
One important lesson is that AI should not simply be introduced because it’s trending. It needs to solve real problems, improve performance, and create measurable value.
Prediction markets can benefit from this experience, particularly when it comes to scalability, risk management, and building long-term user trust.”
On opportunities for innovation
As prediction markets expand into new categories and jurisdictions, Seda had this to say about where AI could have the greatest impact on the user experience and the infrastructure supporting these markets.
“For me, there are two major opportunities: personalization and operational efficiency.
From the user’s perspective, AI can make platforms more intuitive, help people discover relevant markets, and present complicated information in a much simpler way.
From the operator’s perspective, AI can support market monitoring, fraud detection, risk analysis, and faster decision-making.
And because I work closely with different European markets, I also see a huge opportunity in helping platforms adapt to different regulatory environments and local user expectations.”
On trust and responsible innovation
With AI raising questions around transparency, responsible use and trust, Seda was asked what safeguards will be essential as the technology becomes more deeply integrated into emerging market models such as prediction markets.
“Trust will be one of the most important factors determining the future of prediction markets.
AI brings incredible opportunities, but transparency and responsibility have to develop alongside innovation. Users need to understand how markets operate, how outcomes are determined, and how their data is being used.
We also need strong safeguards against manipulation, fraud, and misleading information, supported by human oversight and clear accountability.
Coming from the gaming industry, we know that responsible practices and regulatory compliance are not optional. They’re essential for sustainable growth.”
Looking ahead to PX Markets Europe
Finally, Seda was asked what its representative is most looking forward to exploring at the upcoming PX Markets Summit Europe, and which developments the wider industry should be paying closer attention to.
“I’m particularly excited to see how prediction markets are evolving and how technology providers, operators, and regulators are approaching this emerging sector.
Working in European business development at BetConstruct, I’m always interested in identifying new opportunities, understanding market trends, and exploring where our industry’s experience can create value.
I think the wider industry should be paying closer attention to the intersection of AI, regulation, and user experience.
Prediction markets have enormous potential, but their long-term success will depend on how well we balance innovation, trust, and commercial sustainability.
And that’s exactly why events like PX Markets Europe are so valuable: they bring together different perspectives and help shape what comes next.”
Meet BetConstruct AI at PX Markets Summit Europe
PX Markets Summit Europe 2026 takes place on 9–10 November at Sunborn Gibraltar. Industry professionals are invited to join the summit for discussions with the people shaping the prediction-market ecosystem.
Register for PX Markets Summit Europe: https://www.eventus-international.com/pm-europe
Organisations interested in sponsorship and exhibition opportunities can contact Eventus International to discuss participation.
For sponsorship or exhibition enquiries, contact:
Lou-Mari Burnett,
Chief Operating Officer, Eventus International
loumari@eventus-international.com
This post One Month to Go: Prediction Markets Summit Europe Breaking Ground in Gibraltar first appeared on BitcoinWorld.
With only one month to go, the inaugural Prediction Markets Summit Europe will bring together industry stakeholders in Gibraltar on 9–10 November 2026 to discuss regulation, commercial opportunities and the future development of prediction markets.
Taking place at Sunborn Gibraltar, the event will welcome operators, regulators, investors, technology providers, legal experts and broader market participants to examine the opportunities facing this developing sector.
With Gibraltar emerging as a key jurisdiction in the industry’s regulatory development, the summit will explore the frameworks, technologies and commercial strategies that could shape the growth of prediction markets as they enter the European fold.
Sponsor Spotlight: BetConstruct AI
BetConstruct AI joins Prediction Markets Summit Europe 2026 as a valued sponsor, bringing its experience in gaming technology to discussions around the evolving relationship between technology, regulation and emerging market models.
As artificial intelligence becomes increasingly relevant to gaming technology and operations, questions around its commercial potential, transparency and responsible application are becoming more important.
Ahead of the summit, the Eventus team put five questions to Seda Hovsepyan, BetConstruct’s Regional Business Development Manager, about AI, the future of prediction markets and the varying trends and outliers which face the industry.
Key Insights from BetConstruct AI
On AI’s potential to shape prediction markets
Prediction markets are developing rapidly across Europe and beyond. When asked where BetConstruct sees AI having the greatest potential to shape the next generation of these markets, Seda replied:
“We’ve already seen how AI is transforming the gaming industry, particularly in data analysis, risk management, and personalization.
For prediction markets, I see a similar opportunity. AI can help analyze huge amounts of real-time information, identify emerging trends, and support more efficient market operations.
But what really excites me is the possibility of making complex markets easier for everyday users to understand and participate in.”
On lessons from the gaming industry
Prediction markets sit at the intersection of traditional gaming, financial markets and emerging technology. Seda was asked what the prediction-market sector can learn from the gaming industry’s experience with AI.
“We’ve spent years developing technologies that manage large volumes of transactions, analyze user behavior, detect suspicious activity, and deliver personalized experiences in real time.
At BetConstruct, we see how important it is to combine innovation with reliability and operational efficiency.
One important lesson is that AI should not simply be introduced because it’s trending. It needs to solve real problems, improve performance, and create measurable value.
Prediction markets can benefit from this experience, particularly when it comes to scalability, risk management, and building long-term user trust.”
On opportunities for innovation
As prediction markets expand into new categories and jurisdictions, Seda had this to say about where AI could have the greatest impact on the user experience and the infrastructure supporting these markets.
“For me, there are two major opportunities: personalization and operational efficiency.
From the user’s perspective, AI can make platforms more intuitive, help people discover relevant markets, and present complicated information in a much simpler way.
From the operator’s perspective, AI can support market monitoring, fraud detection, risk analysis, and faster decision-making.
And because I work closely with different European markets, I also see a huge opportunity in helping platforms adapt to different regulatory environments and local user expectations.”
On trust and responsible innovation
With AI raising questions around transparency, responsible use and trust, Seda was asked what safeguards will be essential as the technology becomes more deeply integrated into emerging market models such as prediction markets.
“Trust will be one of the most important factors determining the future of prediction markets.
AI brings incredible opportunities, but transparency and responsibility have to develop alongside innovation. Users need to understand how markets operate, how outcomes are determined, and how their data is being used.
We also need strong safeguards against manipulation, fraud, and misleading information, supported by human oversight and clear accountability.
Coming from the gaming industry, we know that responsible practices and regulatory compliance are not optional. They’re essential for sustainable growth.”
Looking ahead to PX Markets Europe
Finally, Seda was asked what its representative is most looking forward to exploring at the upcoming PX Markets Summit Europe, and which developments the wider industry should be paying closer attention to.
“I’m particularly excited to see how prediction markets are evolving and how technology providers, operators, and regulators are approaching this emerging sector.
Working in European business development at BetConstruct, I’m always interested in identifying new opportunities, understanding market trends, and exploring where our industry’s experience can create value.
I think the wider industry should be paying closer attention to the intersection of AI, regulation, and user experience.
Prediction markets have enormous potential, but their long-term success will depend on how well we balance innovation, trust, and commercial sustainability.
And that’s exactly why events like PX Markets Europe are so valuable: they bring together different perspectives and help shape what comes next.”
Meet BetConstruct AI at PX Markets Summit Europe
PX Markets Summit Europe 2026 takes place on 9–10 November at Sunborn Gibraltar. Industry professionals are invited to join the summit for discussions with the people shaping the prediction-market ecosystem.
Register for PX Markets Summit Europe: https://www.eventus-international.com/pm-europe
Organisations interested in sponsorship and exhibition opportunities can contact Eventus International to discuss participation.
For sponsorship or exhibition enquiries, contact:
Lou-Mari Burnett,
Chief Operating Officer, Eventus International
loumari@eventus-international.com
This post One Month to Go: Prediction Markets Summit Europe Breaking Ground in Gibraltar first appeared on BitcoinWorld.
188
·
--
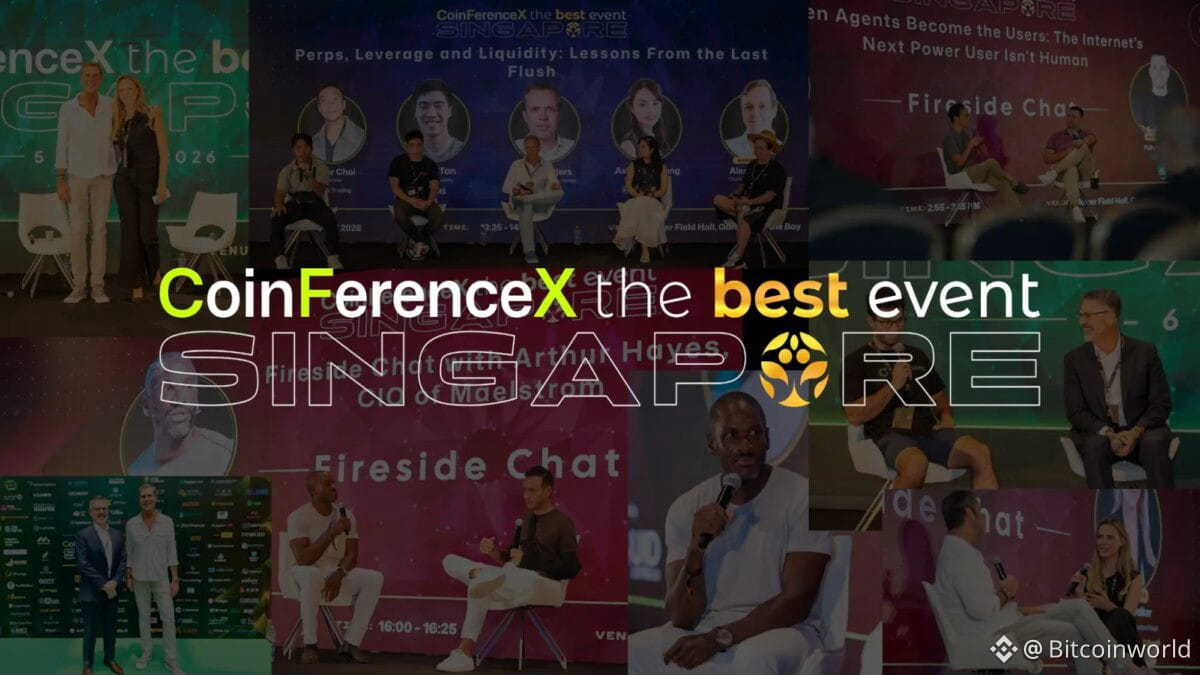
Article
See translation
CoinFerenceX the Best Event Singapore 2026 Concludes Two-Day Web3 Summit, Bringing Together 3,000...BitcoinWorldCoinFerenceX The Best Event Singapore 2026 Concludes Two-Day Web3 Summit, Bringing Together 3,000+ Attendees
Singapore, October 2026 — CoinFerenceX The Best Event Singapore 2026 brought together founders, investors, blockchain innovators, institutional leaders and Web3 professionals for a two-day summit on October 5–6 at Flower Field Hall, Gardens by the Bay. Held during TOKEN2049 week, the event convened participants from across the global digital asset ecosystem for discussions on blockchain infrastructure, institutional adoption, tokenised real-world assets (RWAs), decentralised finance (DeFi), artificial intelligence (AI) and the evolving digital economy.
With 3,000+ attendees, subject to final attendance verification, the Singapore edition marked a major milestone for CoinFerenceX, reinforcing its position as a platform for connecting Web3 businesses, investors, builders and ecosystem partners through industry discussions, networking and collaboration.
A Global Gathering of Web3 Leaders
CoinFerenceX Singapore 2026 featured a high-profile lineup of industry executives, entrepreneurs, investors and technology leaders representing leading organisations across the digital asset sector.
Among the headline speakers were:
Arthur Hayes, Chief Investment Officer at Maelstrom
Raoul Pal, Co-Founder and CEO of Real Vision
Yat Siu, Co-Founder and Executive Chairman of Animoca Brands
Sandeep Nailwal, Co-Founder and CEO of Polygon Labs
Andrei Grachev, Managing Partner at DWF Labs
Michael Heinrich, Co-Founder and CEO of OG Labs
Vugar Usi, CEO of MEXC
Luuk Strijers, Head of Exchanges at Coinbase
Jessica Walker, Global Media and Content Lead at Binance
The wider speaker lineup included representatives from organisations such as BNB Chain, BingX, Gate, Crypto.com, CertiK, MetaMask, Base, Berachain, Aethir, RedStone, Spartan Group and other companies working across the Web3 ecosystem.
Across its conference programme, the event created opportunities to examine the business models, technologies and investment themes influencing the industry’s direction.
From Digital Asset Markets to Real-World Adoption
The summit’s programme explored several themes shaping the future of Web3, with discussions extending beyond market speculation to practical business applications and infrastructure development.
Institutional adoption and tokenised real-world assets: Speakers examined the development of tokenised funds, treasuries, private credit and other financial instruments, alongside the infrastructure required to connect traditional capital markets with blockchain networks.
Stablecoins and digital payments: Discussions explored how stablecoins and blockchain-based payment systems could support settlement, cross-border transactions and other financial use cases.
Artificial intelligence and autonomous agents: Sessions considered the intersection of AI and crypto, including autonomous agents, machine-driven payments, digital identity and the implications of AI-powered economic activity.
DeFi and financial infrastructure: Industry participants discussed the evolution of decentralised finance, institutional-grade infrastructure, on-chain credit and new approaches to digital asset liquidity.
Blockchain security and institutional trust: The programme also addressed cybersecurity, custody, smart-contract vulnerabilities and the safeguards needed to support broader participation in digital asset markets.
Together, these conversations reflected the industry’s continuing shift towards practical applications, sustainable business models and infrastructure capable of supporting wider adoption.
https://x.com/CoinFerenceX/status/2107280642845380864
CoinFerenceX Singapore 2026 Sponsors and Partners
The summit was supported by sponsors and ecosystem partners whose participation contributed to the event’s industry reach and programme.
Powered by: Liquid Loans
Featured Sponsors: ZIG Finance and Golden Ratio Group
Other Sponsors: M5Dex, RealX, AWS, AEON, Hamieverse, Hashlock, VulSight, TiDB, Coinut, CT and DigiMaaya.
The participating organisations represented a range of sectors, including digital asset finance, blockchain infrastructure, decentralised applications, payments, data technology, Web3 entertainment and security.
Their involvement also reflected the importance of collaboration between technology providers, financial platforms, infrastructure companies and emerging Web3 businesses.
CoinFerenceX also partnered with The Best Event to deliver the Singapore edition, combining conference programming with opportunities for networking and industry engagement.
The event’s broader ecosystem included media, community and conference partners. The full sponsor and partner directory is available at CoinFerenceX Singapore Partners.
Leadership Perspectives: A Milestone for the Global Web3 Community
“CoinFerenceX Singapore 2026 marks an important milestone in our mission to unite the global Web3 community, foster meaningful connections and drive innovation. We are grateful to our speakers, sponsors, partners and attendees for making this edition a success. We look forward to building on this momentum and creating even greater opportunities for collaboration in our future editions,” said Radhe Gupta, Founder of CoinFerenceX“CoinFerenceX The Best Event Singapore proved that it’s not just the biggest rooms with the best voices,” shared Brent Fulfer, Co-Founder of The Best Event and Investor at TBV. “Connecting the community is how The Best Event began, so we’re glad we could bring together an event that fosters innovation, collaboration and meaningful partnerships. We thank everyone involved and look forward to creating more impactful experiences for the global Web3 community,”
Building on the Momentum: What’s Next for CoinFerenceX?
Following the success of CoinFerenceX Singapore 2026, the team is preparing for its upcoming international editions, including CoinFerenceX Dubai on 19–20 April 2027 and the next Singapore edition on 4-5 October 2027.
The upcoming editions will continue to bring together Web3 founders, investors, blockchain innovators and industry leaders, creating opportunities for networking, knowledge sharing and strategic partnerships across the global digital asset ecosystem.
Further details regarding speakers, sponsorships and participation opportunities will be announced through the official CoinFerenceX website.
With its expanding international presence, CoinFerenceX remains committed to connecting the global Web3 community and creating meaningful opportunities for collaboration and innovation.
About CoinFerenceX
CoinFerenceX is an international Web3 summit series connecting founders, investors, blockchain innovators, institutions and ecosystem leaders. Its events focus on the developments shaping the digital asset economy, including blockchain infrastructure, decentralised finance, tokenisation, institutional adoption and emerging technologies.
Through its conferences and ecosystem partnerships, CoinFerenceX aims to facilitate industry dialogue, business networking and collaboration across the global Web3 community.
About The Best Event
The Best Event (TBE) is an event series focused on bringing together founders, investors, operators, protocols and brands through curated experiences and industry gatherings. Its collaboration with CoinFerenceX supported the delivery of the Singapore 2026 summit.
For event updates and partnership information, visit CoinFerenceX.
Contact Details:
Prince Gupta
Chair/Co-Founder
prince@coinferencex.com
This post CoinFerenceX The Best Event Singapore 2026 Concludes Two-Day Web3 Summit, Bringing Together 3,000+ Attendees first appeared on BitcoinWorld.
CoinFerenceX the Best Event Singapore 2026 Concludes Two-Day Web3 Summit, Bringing Together 3,000...
BitcoinWorldCoinFerenceX The Best Event Singapore 2026 Concludes Two-Day Web3 Summit, Bringing Together 3,000+ Attendees
Singapore, October 2026 — CoinFerenceX The Best Event Singapore 2026 brought together founders, investors, blockchain innovators, institutional leaders and Web3 professionals for a two-day summit on October 5–6 at Flower Field Hall, Gardens by the Bay. Held during TOKEN2049 week, the event convened participants from across the global digital asset ecosystem for discussions on blockchain infrastructure, institutional adoption, tokenised real-world assets (RWAs), decentralised finance (DeFi), artificial intelligence (AI) and the evolving digital economy.
With 3,000+ attendees, subject to final attendance verification, the Singapore edition marked a major milestone for CoinFerenceX, reinforcing its position as a platform for connecting Web3 businesses, investors, builders and ecosystem partners through industry discussions, networking and collaboration.
A Global Gathering of Web3 Leaders
CoinFerenceX Singapore 2026 featured a high-profile lineup of industry executives, entrepreneurs, investors and technology leaders representing leading organisations across the digital asset sector.
Among the headline speakers were:
Arthur Hayes, Chief Investment Officer at Maelstrom
Raoul Pal, Co-Founder and CEO of Real Vision
Yat Siu, Co-Founder and Executive Chairman of Animoca Brands
Sandeep Nailwal, Co-Founder and CEO of Polygon Labs
Andrei Grachev, Managing Partner at DWF Labs
Michael Heinrich, Co-Founder and CEO of OG Labs
Vugar Usi, CEO of MEXC
Luuk Strijers, Head of Exchanges at Coinbase
Jessica Walker, Global Media and Content Lead at Binance
The wider speaker lineup included representatives from organisations such as BNB Chain, BingX, Gate, Crypto.com, CertiK, MetaMask, Base, Berachain, Aethir, RedStone, Spartan Group and other companies working across the Web3 ecosystem.
Across its conference programme, the event created opportunities to examine the business models, technologies and investment themes influencing the industry’s direction.
From Digital Asset Markets to Real-World Adoption
The summit’s programme explored several themes shaping the future of Web3, with discussions extending beyond market speculation to practical business applications and infrastructure development.
Institutional adoption and tokenised real-world assets: Speakers examined the development of tokenised funds, treasuries, private credit and other financial instruments, alongside the infrastructure required to connect traditional capital markets with blockchain networks.
Stablecoins and digital payments: Discussions explored how stablecoins and blockchain-based payment systems could support settlement, cross-border transactions and other financial use cases.
Artificial intelligence and autonomous agents: Sessions considered the intersection of AI and crypto, including autonomous agents, machine-driven payments, digital identity and the implications of AI-powered economic activity.
DeFi and financial infrastructure: Industry participants discussed the evolution of decentralised finance, institutional-grade infrastructure, on-chain credit and new approaches to digital asset liquidity.
Blockchain security and institutional trust: The programme also addressed cybersecurity, custody, smart-contract vulnerabilities and the safeguards needed to support broader participation in digital asset markets.
Together, these conversations reflected the industry’s continuing shift towards practical applications, sustainable business models and infrastructure capable of supporting wider adoption.
https://x.com/CoinFerenceX/status/2107280642845380864
CoinFerenceX Singapore 2026 Sponsors and Partners
The summit was supported by sponsors and ecosystem partners whose participation contributed to the event’s industry reach and programme.
Powered by: Liquid Loans
Featured Sponsors: ZIG Finance and Golden Ratio Group
Other Sponsors: M5Dex, RealX, AWS, AEON, Hamieverse, Hashlock, VulSight, TiDB, Coinut, CT and DigiMaaya.
The participating organisations represented a range of sectors, including digital asset finance, blockchain infrastructure, decentralised applications, payments, data technology, Web3 entertainment and security.
Their involvement also reflected the importance of collaboration between technology providers, financial platforms, infrastructure companies and emerging Web3 businesses.
CoinFerenceX also partnered with The Best Event to deliver the Singapore edition, combining conference programming with opportunities for networking and industry engagement.
The event’s broader ecosystem included media, community and conference partners. The full sponsor and partner directory is available at CoinFerenceX Singapore Partners.
Leadership Perspectives: A Milestone for the Global Web3 Community
“CoinFerenceX Singapore 2026 marks an important milestone in our mission to unite the global Web3 community, foster meaningful connections and drive innovation. We are grateful to our speakers, sponsors, partners and attendees for making this edition a success. We look forward to building on this momentum and creating even greater opportunities for collaboration in our future editions,” said Radhe Gupta, Founder of CoinFerenceX“CoinFerenceX The Best Event Singapore proved that it’s not just the biggest rooms with the best voices,” shared Brent Fulfer, Co-Founder of The Best Event and Investor at TBV. “Connecting the community is how The Best Event began, so we’re glad we could bring together an event that fosters innovation, collaboration and meaningful partnerships. We thank everyone involved and look forward to creating more impactful experiences for the global Web3 community,”
Building on the Momentum: What’s Next for CoinFerenceX?
Following the success of CoinFerenceX Singapore 2026, the team is preparing for its upcoming international editions, including CoinFerenceX Dubai on 19–20 April 2027 and the next Singapore edition on 4-5 October 2027.
The upcoming editions will continue to bring together Web3 founders, investors, blockchain innovators and industry leaders, creating opportunities for networking, knowledge sharing and strategic partnerships across the global digital asset ecosystem.
Further details regarding speakers, sponsorships and participation opportunities will be announced through the official CoinFerenceX website.
With its expanding international presence, CoinFerenceX remains committed to connecting the global Web3 community and creating meaningful opportunities for collaboration and innovation.
About CoinFerenceX
CoinFerenceX is an international Web3 summit series connecting founders, investors, blockchain innovators, institutions and ecosystem leaders. Its events focus on the developments shaping the digital asset economy, including blockchain infrastructure, decentralised finance, tokenisation, institutional adoption and emerging technologies.
Through its conferences and ecosystem partnerships, CoinFerenceX aims to facilitate industry dialogue, business networking and collaboration across the global Web3 community.
About The Best Event
The Best Event (TBE) is an event series focused on bringing together founders, investors, operators, protocols and brands through curated experiences and industry gatherings. Its collaboration with CoinFerenceX supported the delivery of the Singapore 2026 summit.
For event updates and partnership information, visit CoinFerenceX.
Contact Details:
Prince Gupta
Chair/Co-Founder
prince@coinferencex.com
This post CoinFerenceX The Best Event Singapore 2026 Concludes Two-Day Web3 Summit, Bringing Together 3,000+ Attendees first appeared on BitcoinWorld.
Singapore, October 2026 — CoinFerenceX The Best Event Singapore 2026 brought together founders, investors, blockchain innovators, institutional leaders and Web3 professionals for a two-day summit on October 5–6 at Flower Field Hall, Gardens by the Bay. Held during TOKEN2049 week, the event convened participants from across the global digital asset ecosystem for discussions on blockchain infrastructure, institutional adoption, tokenised real-world assets (RWAs), decentralised finance (DeFi), artificial intelligence (AI) and the evolving digital economy.
With 3,000+ attendees, subject to final attendance verification, the Singapore edition marked a major milestone for CoinFerenceX, reinforcing its position as a platform for connecting Web3 businesses, investors, builders and ecosystem partners through industry discussions, networking and collaboration.
A Global Gathering of Web3 Leaders
CoinFerenceX Singapore 2026 featured a high-profile lineup of industry executives, entrepreneurs, investors and technology leaders representing leading organisations across the digital asset sector.
Among the headline speakers were:
Arthur Hayes, Chief Investment Officer at Maelstrom
Raoul Pal, Co-Founder and CEO of Real Vision
Yat Siu, Co-Founder and Executive Chairman of Animoca Brands
Sandeep Nailwal, Co-Founder and CEO of Polygon Labs
Andrei Grachev, Managing Partner at DWF Labs
Michael Heinrich, Co-Founder and CEO of OG Labs
Vugar Usi, CEO of MEXC
Luuk Strijers, Head of Exchanges at Coinbase
Jessica Walker, Global Media and Content Lead at Binance
The wider speaker lineup included representatives from organisations such as BNB Chain, BingX, Gate, Crypto.com, CertiK, MetaMask, Base, Berachain, Aethir, RedStone, Spartan Group and other companies working across the Web3 ecosystem.
Across its conference programme, the event created opportunities to examine the business models, technologies and investment themes influencing the industry’s direction.
From Digital Asset Markets to Real-World Adoption
The summit’s programme explored several themes shaping the future of Web3, with discussions extending beyond market speculation to practical business applications and infrastructure development.
Institutional adoption and tokenised real-world assets: Speakers examined the development of tokenised funds, treasuries, private credit and other financial instruments, alongside the infrastructure required to connect traditional capital markets with blockchain networks.
Stablecoins and digital payments: Discussions explored how stablecoins and blockchain-based payment systems could support settlement, cross-border transactions and other financial use cases.
Artificial intelligence and autonomous agents: Sessions considered the intersection of AI and crypto, including autonomous agents, machine-driven payments, digital identity and the implications of AI-powered economic activity.
DeFi and financial infrastructure: Industry participants discussed the evolution of decentralised finance, institutional-grade infrastructure, on-chain credit and new approaches to digital asset liquidity.
Blockchain security and institutional trust: The programme also addressed cybersecurity, custody, smart-contract vulnerabilities and the safeguards needed to support broader participation in digital asset markets.
Together, these conversations reflected the industry’s continuing shift towards practical applications, sustainable business models and infrastructure capable of supporting wider adoption.
https://x.com/CoinFerenceX/status/2107280642845380864
CoinFerenceX Singapore 2026 Sponsors and Partners
The summit was supported by sponsors and ecosystem partners whose participation contributed to the event’s industry reach and programme.
Powered by: Liquid Loans
Featured Sponsors: ZIG Finance and Golden Ratio Group
Other Sponsors: M5Dex, RealX, AWS, AEON, Hamieverse, Hashlock, VulSight, TiDB, Coinut, CT and DigiMaaya.
The participating organisations represented a range of sectors, including digital asset finance, blockchain infrastructure, decentralised applications, payments, data technology, Web3 entertainment and security.
Their involvement also reflected the importance of collaboration between technology providers, financial platforms, infrastructure companies and emerging Web3 businesses.
CoinFerenceX also partnered with The Best Event to deliver the Singapore edition, combining conference programming with opportunities for networking and industry engagement.
The event’s broader ecosystem included media, community and conference partners. The full sponsor and partner directory is available at CoinFerenceX Singapore Partners.
Leadership Perspectives: A Milestone for the Global Web3 Community
“CoinFerenceX Singapore 2026 marks an important milestone in our mission to unite the global Web3 community, foster meaningful connections and drive innovation. We are grateful to our speakers, sponsors, partners and attendees for making this edition a success. We look forward to building on this momentum and creating even greater opportunities for collaboration in our future editions,” said Radhe Gupta, Founder of CoinFerenceX“CoinFerenceX The Best Event Singapore proved that it’s not just the biggest rooms with the best voices,” shared Brent Fulfer, Co-Founder of The Best Event and Investor at TBV. “Connecting the community is how The Best Event began, so we’re glad we could bring together an event that fosters innovation, collaboration and meaningful partnerships. We thank everyone involved and look forward to creating more impactful experiences for the global Web3 community,”
Building on the Momentum: What’s Next for CoinFerenceX?
Following the success of CoinFerenceX Singapore 2026, the team is preparing for its upcoming international editions, including CoinFerenceX Dubai on 19–20 April 2027 and the next Singapore edition on 4-5 October 2027.
The upcoming editions will continue to bring together Web3 founders, investors, blockchain innovators and industry leaders, creating opportunities for networking, knowledge sharing and strategic partnerships across the global digital asset ecosystem.
Further details regarding speakers, sponsorships and participation opportunities will be announced through the official CoinFerenceX website.
With its expanding international presence, CoinFerenceX remains committed to connecting the global Web3 community and creating meaningful opportunities for collaboration and innovation.
About CoinFerenceX
CoinFerenceX is an international Web3 summit series connecting founders, investors, blockchain innovators, institutions and ecosystem leaders. Its events focus on the developments shaping the digital asset economy, including blockchain infrastructure, decentralised finance, tokenisation, institutional adoption and emerging technologies.
Through its conferences and ecosystem partnerships, CoinFerenceX aims to facilitate industry dialogue, business networking and collaboration across the global Web3 community.
About The Best Event
The Best Event (TBE) is an event series focused on bringing together founders, investors, operators, protocols and brands through curated experiences and industry gatherings. Its collaboration with CoinFerenceX supported the delivery of the Singapore 2026 summit.
For event updates and partnership information, visit CoinFerenceX.
Contact Details:
Prince Gupta
Chair/Co-Founder
prince@coinferencex.com
This post CoinFerenceX The Best Event Singapore 2026 Concludes Two-Day Web3 Summit, Bringing Together 3,000+ Attendees first appeared on BitcoinWorld.
184
·
--
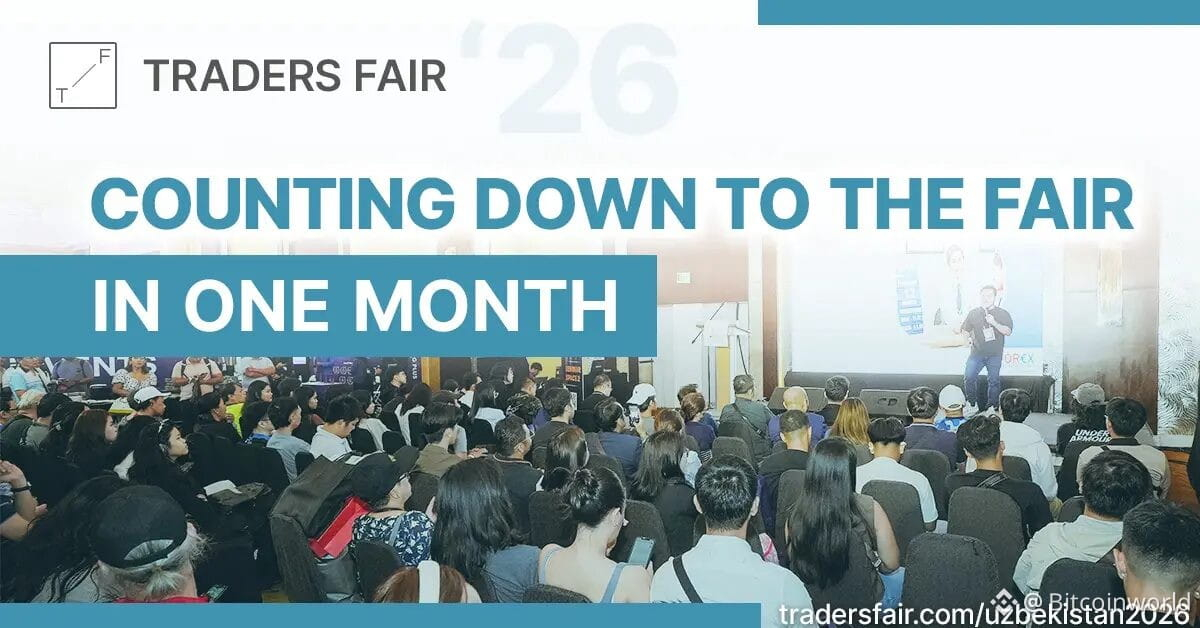
Article
See translation
High-Impact Financial Debuts in Tashkent: Traders Fair Uzbekistan Set for November 14, 2026BitcoinWorldHigh-Impact Financial Debuts in Tashkent: Traders Fair Uzbekistan Set for November 14, 2026
The countdown has officially begun for the highly anticipated debut of Traders Fair Uzbekistan 2026. Scheduled for November 14, 2026, at the JW Marriott Hotel Tashkent, the global event series brings its flagship financial conference to Central Asia, bringing together local trading enthusiasts, institutional investors, and international finance leaders. Traders Fair Tashkent 2026 offers interactive educational sessions, executive networking, and expert market analysis.Attendees will gain direct access to industry leaders and top brokerage firms sharing insights across Forex, equities,cryptocurrency, and commodities markets.
Key Discussion Topics & Panel HighlightsThe single-day summit will focus on actionable risk management, market psychology, and strategic asset allocation. Key panel topics include:
1. The Psychology of Leverage & Risk Management
High-leverage trading amplifies both market exposure and psychological pressure, often triggering cognitive traps such as loss aversion, revenge trading, and over-leveraging. This session provides a practical deep dive into behavioral finance,examining the mental biases that lead to catastrophic drawdowns during high-volatility events. Institutional market strategists will share actionable frameworks for emotional discipline, position stress-testing, and strict risk-to-reward parameters necessary to protect capital under market stress.
2. Trading vs. Investing vs. Gambling
The line between strategic market participation and reckless speculation is frequently blurred in retail trading. Panelists will dissect the foundational differences in methodology, time horizons, and risk management that separate structured trading and long-term investing from financial gambling. Attendees will gain actionable clarity on how to shift away from impulsive, emotion-driven bets toward systematic, edge-driven strategies designed for reproducible long-term growth.
3. The Reality of “Signals” and “Copy Trading”
While social trading platforms and automated signal services promise effortless profits, the operational reality is often far more complex. This panel pulls back the curtain on copy trading ecosystems to evaluate execution latency, hidden slippage, mismatched risk settings, and misleading performance metrics. Market leaders will outline how retail traders can conduct due diligence on signal providers, evaluate true risk profiles, and safely integrate automated tools without surrendering personal oversight.
Uzbekistan Traders Fair 2026Date: November 14, 2026Location: JW Marriott Hotel Tashkent, Uzbekistan
Attendees will depart this full-day summit equipped with high-value market insights, institutional-grade strategies, and practical tools to elevate their trading performance. Beyond the actionable knowledge gained from expert sessions,participants will walk away with an expanded network of industry peers and leaders, empowering them to navigate today’s dynamic markets with enhanced confidence and discipline. Secure your spot today at tradersfair.com/uzbekistan2026.
This post High-Impact Financial Debuts in Tashkent: Traders Fair Uzbekistan Set for November 14, 2026 first appeared on BitcoinWorld.
High-Impact Financial Debuts in Tashkent: Traders Fair Uzbekistan Set for November 14, 2026
BitcoinWorldHigh-Impact Financial Debuts in Tashkent: Traders Fair Uzbekistan Set for November 14, 2026
The countdown has officially begun for the highly anticipated debut of Traders Fair Uzbekistan 2026. Scheduled for November 14, 2026, at the JW Marriott Hotel Tashkent, the global event series brings its flagship financial conference to Central Asia, bringing together local trading enthusiasts, institutional investors, and international finance leaders. Traders Fair Tashkent 2026 offers interactive educational sessions, executive networking, and expert market analysis.Attendees will gain direct access to industry leaders and top brokerage firms sharing insights across Forex, equities,cryptocurrency, and commodities markets.
Key Discussion Topics & Panel HighlightsThe single-day summit will focus on actionable risk management, market psychology, and strategic asset allocation. Key panel topics include:
1. The Psychology of Leverage & Risk Management
High-leverage trading amplifies both market exposure and psychological pressure, often triggering cognitive traps such as loss aversion, revenge trading, and over-leveraging. This session provides a practical deep dive into behavioral finance,examining the mental biases that lead to catastrophic drawdowns during high-volatility events. Institutional market strategists will share actionable frameworks for emotional discipline, position stress-testing, and strict risk-to-reward parameters necessary to protect capital under market stress.
2. Trading vs. Investing vs. Gambling
The line between strategic market participation and reckless speculation is frequently blurred in retail trading. Panelists will dissect the foundational differences in methodology, time horizons, and risk management that separate structured trading and long-term investing from financial gambling. Attendees will gain actionable clarity on how to shift away from impulsive, emotion-driven bets toward systematic, edge-driven strategies designed for reproducible long-term growth.
3. The Reality of “Signals” and “Copy Trading”
While social trading platforms and automated signal services promise effortless profits, the operational reality is often far more complex. This panel pulls back the curtain on copy trading ecosystems to evaluate execution latency, hidden slippage, mismatched risk settings, and misleading performance metrics. Market leaders will outline how retail traders can conduct due diligence on signal providers, evaluate true risk profiles, and safely integrate automated tools without surrendering personal oversight.
Uzbekistan Traders Fair 2026Date: November 14, 2026Location: JW Marriott Hotel Tashkent, Uzbekistan
Attendees will depart this full-day summit equipped with high-value market insights, institutional-grade strategies, and practical tools to elevate their trading performance. Beyond the actionable knowledge gained from expert sessions,participants will walk away with an expanded network of industry peers and leaders, empowering them to navigate today’s dynamic markets with enhanced confidence and discipline. Secure your spot today at tradersfair.com/uzbekistan2026.
This post High-Impact Financial Debuts in Tashkent: Traders Fair Uzbekistan Set for November 14, 2026 first appeared on BitcoinWorld.
The countdown has officially begun for the highly anticipated debut of Traders Fair Uzbekistan 2026. Scheduled for November 14, 2026, at the JW Marriott Hotel Tashkent, the global event series brings its flagship financial conference to Central Asia, bringing together local trading enthusiasts, institutional investors, and international finance leaders. Traders Fair Tashkent 2026 offers interactive educational sessions, executive networking, and expert market analysis.Attendees will gain direct access to industry leaders and top brokerage firms sharing insights across Forex, equities,cryptocurrency, and commodities markets.
Key Discussion Topics & Panel HighlightsThe single-day summit will focus on actionable risk management, market psychology, and strategic asset allocation. Key panel topics include:
1. The Psychology of Leverage & Risk Management
High-leverage trading amplifies both market exposure and psychological pressure, often triggering cognitive traps such as loss aversion, revenge trading, and over-leveraging. This session provides a practical deep dive into behavioral finance,examining the mental biases that lead to catastrophic drawdowns during high-volatility events. Institutional market strategists will share actionable frameworks for emotional discipline, position stress-testing, and strict risk-to-reward parameters necessary to protect capital under market stress.
2. Trading vs. Investing vs. Gambling
The line between strategic market participation and reckless speculation is frequently blurred in retail trading. Panelists will dissect the foundational differences in methodology, time horizons, and risk management that separate structured trading and long-term investing from financial gambling. Attendees will gain actionable clarity on how to shift away from impulsive, emotion-driven bets toward systematic, edge-driven strategies designed for reproducible long-term growth.
3. The Reality of “Signals” and “Copy Trading”
While social trading platforms and automated signal services promise effortless profits, the operational reality is often far more complex. This panel pulls back the curtain on copy trading ecosystems to evaluate execution latency, hidden slippage, mismatched risk settings, and misleading performance metrics. Market leaders will outline how retail traders can conduct due diligence on signal providers, evaluate true risk profiles, and safely integrate automated tools without surrendering personal oversight.
Uzbekistan Traders Fair 2026Date: November 14, 2026Location: JW Marriott Hotel Tashkent, Uzbekistan
Attendees will depart this full-day summit equipped with high-value market insights, institutional-grade strategies, and practical tools to elevate their trading performance. Beyond the actionable knowledge gained from expert sessions,participants will walk away with an expanded network of industry peers and leaders, empowering them to navigate today’s dynamic markets with enhanced confidence and discipline. Secure your spot today at tradersfair.com/uzbekistan2026.
This post High-Impact Financial Debuts in Tashkent: Traders Fair Uzbekistan Set for November 14, 2026 first appeared on BitcoinWorld.
1
318
·
--
Verified

Article
See translation
Wrapped XRP on Flare is almost fully put to work, and lending is soaking up most of it, DefiLlama fiAbout 129 million of 145 million FXRP sit in DeFi protocols, but a small token base and inflation that still dwarfs fee burns leave Flare's bigger data-layer ambitions unproven.
Nearly all of the XRP that holders have wrapped onto Flare is now working inside DeFi instead of sitting in wallets. A DefiLlama Research report published October 21 counts about 129 million of the 145 million FXRP in circulation deployed across protocols, close to 90% of supply.
The base is still small. According to the report, 145 million FXRP equals roughly 0.23% of circulating XRP. The deployment ratio matters anyway, because it measures demand for using XRP as productive capital, something the XRP Ledger cannot offer on its own without general smart contracts.
FXRP went live on Flare mainnet in September 2025 through FAssets, an overcollateralized bridge. A user sends XRP to an agent, Flare's Data Connector confirms the payment on the XRP Ledger, and an equivalent token is minted on Flare. Agents back the tokens with stablecoin or ETH collateral plus FLR, and holders can redeem for native XRP. Version 1.3, released in May 2026, cut minting to a single XRPL payment, which let regulated custodians such as Hex Trust integrate directly.
Lending is where most of the supply goes. DefiLlama puts about 52% of deployed FXRP in lending markets: Morpho and Kinetic on Flare, Morpho on Ethereum and Euler on Monad. Most of it is posted as collateral, so holders can borrow cash while keeping their XRP price exposure. In Sentora's RLUSD vault on Morpho, 10.6 million FXRP backed $7.9 million of Ripple's RLUSD stablecoin supplied in late September. Another 39% sits in Firelight as staked XRP, and about 8% provides liquidity on decentralized exchanges.
FXRP is also travelling. Because it is issued as a LayerZero omnichain token, it can move to other networks, and off-Flare FXRP in DeFi climbed from about 4 million on July 9 to about 20 million in October. It now reaches seven chains: Ethereum, Base, BNB Chain, Monad, Katana, HyperEVM and HyperCore. In January it became the first XRP spot market on Hyperliquid, which had previously offered XRP only through perpetual futures.
That expansion cuts both ways for Flare. The report says part of the demand has moved to chains with deeper credit markets, and trading or lending FXRP generates no protocol revenue for Flare itself. The fee comes at minting.
The numbers also face an incentive test. Flare spent 2.2 billion FLR on its FAssets incentive program between July 2025 and July 2026. FXRP in DeFi peaked at 142 million in May and has slipped about 5% since rewards ended. DefiLlama treats that hold as a sign of real demand, though a few months is a short window to judge it.
The second half of the report covers Flare's pitch as a data network. Governance proposal FIP.16, approved in April with 98.06% of the vote, cut annual inflation to 3% in May and created FIRE, a pool that collects protocol revenue to reduce FLR supply. Fees from the Flare Data Connector, which verifies events on other blockchains, are now FIRE's fastest-growing source at 45% of the total. A July hard fork weighted direct staking five times more heavily than delegation, and staked FLR rose from about 32% of the total in April to roughly half.
The gap between revenue and issuance is still wide. At $0.0067 per FLR, DefiLlama values annual issuance at about $18 million, against roughly $154,000 in token burns. The report concludes the fee system needs far more activity before it offsets inflation.
The most ambitious piece is Flare Confidential Compute, live since July on Songbird, the canary network where Flare tries features with real value before mainnet. It runs private data inside secure hardware enclaves and posts only a signed result onchain. The first use case checks reserves for Hex Trust's USDX stablecoin. Hex Trust supplies a public reserves figure and a private cash figure, the enclave compares the total with USDX supply, and the chain learns only whether the coin is backed 1:1 or better. DefiLlama says the product could become "closer to an oracle primitive for private data" if more applications follow.
The report is candid about the limits. The system proves that approved code ran on the inputs it was given, not that those inputs are true, so the cash figure still rests on Hex Trust. During the bootstrap phase, the enclaves run on Google Cloud and are operated by the Flare Foundation.
The next milestones are Confidential Compute on Flare mainnet, FBTC for Bitcoin holders and FAssets v2. None is live yet. Together they will show whether Flare's data layer can earn its keep beyond XRP. DefiLlama's page does not say whether Flare commissioned the research; Flare distributed the findings in its own press release.
Wrapped XRP on Flare is almost fully put to work, and lending is soaking up most of it, DefiLlama fi
About 129 million of 145 million FXRP sit in DeFi protocols, but a small token base and inflation that still dwarfs fee burns leave Flare's bigger data-layer ambitions unproven.
Nearly all of the XRP that holders have wrapped onto Flare is now working inside DeFi instead of sitting in wallets. A DefiLlama Research report published October 21 counts about 129 million of the 145 million FXRP in circulation deployed across protocols, close to 90% of supply.
The base is still small. According to the report, 145 million FXRP equals roughly 0.23% of circulating XRP. The deployment ratio matters anyway, because it measures demand for using XRP as productive capital, something the XRP Ledger cannot offer on its own without general smart contracts.
FXRP went live on Flare mainnet in September 2025 through FAssets, an overcollateralized bridge. A user sends XRP to an agent, Flare's Data Connector confirms the payment on the XRP Ledger, and an equivalent token is minted on Flare. Agents back the tokens with stablecoin or ETH collateral plus FLR, and holders can redeem for native XRP. Version 1.3, released in May 2026, cut minting to a single XRPL payment, which let regulated custodians such as Hex Trust integrate directly.
Lending is where most of the supply goes. DefiLlama puts about 52% of deployed FXRP in lending markets: Morpho and Kinetic on Flare, Morpho on Ethereum and Euler on Monad. Most of it is posted as collateral, so holders can borrow cash while keeping their XRP price exposure. In Sentora's RLUSD vault on Morpho, 10.6 million FXRP backed $7.9 million of Ripple's RLUSD stablecoin supplied in late September. Another 39% sits in Firelight as staked XRP, and about 8% provides liquidity on decentralized exchanges.
FXRP is also travelling. Because it is issued as a LayerZero omnichain token, it can move to other networks, and off-Flare FXRP in DeFi climbed from about 4 million on July 9 to about 20 million in October. It now reaches seven chains: Ethereum, Base, BNB Chain, Monad, Katana, HyperEVM and HyperCore. In January it became the first XRP spot market on Hyperliquid, which had previously offered XRP only through perpetual futures.
That expansion cuts both ways for Flare. The report says part of the demand has moved to chains with deeper credit markets, and trading or lending FXRP generates no protocol revenue for Flare itself. The fee comes at minting.
The numbers also face an incentive test. Flare spent 2.2 billion FLR on its FAssets incentive program between July 2025 and July 2026. FXRP in DeFi peaked at 142 million in May and has slipped about 5% since rewards ended. DefiLlama treats that hold as a sign of real demand, though a few months is a short window to judge it.
The second half of the report covers Flare's pitch as a data network. Governance proposal FIP.16, approved in April with 98.06% of the vote, cut annual inflation to 3% in May and created FIRE, a pool that collects protocol revenue to reduce FLR supply. Fees from the Flare Data Connector, which verifies events on other blockchains, are now FIRE's fastest-growing source at 45% of the total. A July hard fork weighted direct staking five times more heavily than delegation, and staked FLR rose from about 32% of the total in April to roughly half.
The gap between revenue and issuance is still wide. At $0.0067 per FLR, DefiLlama values annual issuance at about $18 million, against roughly $154,000 in token burns. The report concludes the fee system needs far more activity before it offsets inflation.
The most ambitious piece is Flare Confidential Compute, live since July on Songbird, the canary network where Flare tries features with real value before mainnet. It runs private data inside secure hardware enclaves and posts only a signed result onchain. The first use case checks reserves for Hex Trust's USDX stablecoin. Hex Trust supplies a public reserves figure and a private cash figure, the enclave compares the total with USDX supply, and the chain learns only whether the coin is backed 1:1 or better. DefiLlama says the product could become "closer to an oracle primitive for private data" if more applications follow.
The report is candid about the limits. The system proves that approved code ran on the inputs it was given, not that those inputs are true, so the cash figure still rests on Hex Trust. During the bootstrap phase, the enclaves run on Google Cloud and are operated by the Flare Foundation.
The next milestones are Confidential Compute on Flare mainnet, FBTC for Bitcoin holders and FAssets v2. None is live yet. Together they will show whether Flare's data layer can earn its keep beyond XRP. DefiLlama's page does not say whether Flare commissioned the research; Flare distributed the findings in its own press release.
Nearly all of the XRP that holders have wrapped onto Flare is now working inside DeFi instead of sitting in wallets. A DefiLlama Research report published October 21 counts about 129 million of the 145 million FXRP in circulation deployed across protocols, close to 90% of supply.
The base is still small. According to the report, 145 million FXRP equals roughly 0.23% of circulating XRP. The deployment ratio matters anyway, because it measures demand for using XRP as productive capital, something the XRP Ledger cannot offer on its own without general smart contracts.
FXRP went live on Flare mainnet in September 2025 through FAssets, an overcollateralized bridge. A user sends XRP to an agent, Flare's Data Connector confirms the payment on the XRP Ledger, and an equivalent token is minted on Flare. Agents back the tokens with stablecoin or ETH collateral plus FLR, and holders can redeem for native XRP. Version 1.3, released in May 2026, cut minting to a single XRPL payment, which let regulated custodians such as Hex Trust integrate directly.
Lending is where most of the supply goes. DefiLlama puts about 52% of deployed FXRP in lending markets: Morpho and Kinetic on Flare, Morpho on Ethereum and Euler on Monad. Most of it is posted as collateral, so holders can borrow cash while keeping their XRP price exposure. In Sentora's RLUSD vault on Morpho, 10.6 million FXRP backed $7.9 million of Ripple's RLUSD stablecoin supplied in late September. Another 39% sits in Firelight as staked XRP, and about 8% provides liquidity on decentralized exchanges.
FXRP is also travelling. Because it is issued as a LayerZero omnichain token, it can move to other networks, and off-Flare FXRP in DeFi climbed from about 4 million on July 9 to about 20 million in October. It now reaches seven chains: Ethereum, Base, BNB Chain, Monad, Katana, HyperEVM and HyperCore. In January it became the first XRP spot market on Hyperliquid, which had previously offered XRP only through perpetual futures.
That expansion cuts both ways for Flare. The report says part of the demand has moved to chains with deeper credit markets, and trading or lending FXRP generates no protocol revenue for Flare itself. The fee comes at minting.
The numbers also face an incentive test. Flare spent 2.2 billion FLR on its FAssets incentive program between July 2025 and July 2026. FXRP in DeFi peaked at 142 million in May and has slipped about 5% since rewards ended. DefiLlama treats that hold as a sign of real demand, though a few months is a short window to judge it.
The second half of the report covers Flare's pitch as a data network. Governance proposal FIP.16, approved in April with 98.06% of the vote, cut annual inflation to 3% in May and created FIRE, a pool that collects protocol revenue to reduce FLR supply. Fees from the Flare Data Connector, which verifies events on other blockchains, are now FIRE's fastest-growing source at 45% of the total. A July hard fork weighted direct staking five times more heavily than delegation, and staked FLR rose from about 32% of the total in April to roughly half.
The gap between revenue and issuance is still wide. At $0.0067 per FLR, DefiLlama values annual issuance at about $18 million, against roughly $154,000 in token burns. The report concludes the fee system needs far more activity before it offsets inflation.
The most ambitious piece is Flare Confidential Compute, live since July on Songbird, the canary network where Flare tries features with real value before mainnet. It runs private data inside secure hardware enclaves and posts only a signed result onchain. The first use case checks reserves for Hex Trust's USDX stablecoin. Hex Trust supplies a public reserves figure and a private cash figure, the enclave compares the total with USDX supply, and the chain learns only whether the coin is backed 1:1 or better. DefiLlama says the product could become "closer to an oracle primitive for private data" if more applications follow.
The report is candid about the limits. The system proves that approved code ran on the inputs it was given, not that those inputs are true, so the cash figure still rests on Hex Trust. During the bootstrap phase, the enclaves run on Google Cloud and are operated by the Flare Foundation.
The next milestones are Confidential Compute on Flare mainnet, FBTC for Bitcoin holders and FAssets v2. None is live yet. Together they will show whether Flare's data layer can earn its keep beyond XRP. DefiLlama's page does not say whether Flare commissioned the research; Flare distributed the findings in its own press release.
374
·
--

Article
See translation
GXB Agrees on Donations With Four Major International OrganizationsBitcoinWorldGXB Agrees on Donations with Four Major International Organizations
Builds Key IT Partnership with ITEYES; Pursues Top-Tier CEX Listings, Actively Considers a Hyperliquid Listing, Poised to Become the “Eye of the Storm” in Blockchain in 2027
Innovative hybrid donation model agreed with UNCPGA, Club de Madrid, HELP and Lindau Nobel Laureate Meetings; formal agreements to be signed
MOA with financial IT specialist ITEYES includes strategic investment provisions, bringing financial institution and exchange systems expertise to GXB’s integrated financial platform
Strategic cooperation with Bank of Ghana-authorized PaySwitch targets Africa’s real-world payments market
Global top-tier CEX listings pursued; listing on leading global DEX platform Hyperliquid under active consideration
GXB, a global hybrid financial platform connecting digital assets and traditional finance, is targeting global markets through international cooperation, financial technology and real-world payments. Donation agreements with four international organizations, an ITEYES MOA and a PaySwitch partnership underpin its ambitions for blockchain finance in 2027.
GG56, the company behind GXB, said donation agreements had been reached, with formal signing forthcoming. Its innovative hybrid donation model combines cash with GXB and PAFI tokens.
The ITEYES MOA includes strategic investment provisions and establishes core IT cooperation for platform development. PaySwitch cooperation supports expansion into African payments. GG56 is pursuing top-tier CEX listings and actively considering Hyperliquid, connecting international networks, technology and local payment capabilities with business development and wider trading channels.
1. Innovative Hybrid Donation Model Agreed with Four International Organizations; Formal Agreements to Follow Soon
Guided by “Global Good, 5 Oceans & 6 Continents,” GG56 agreed on donations combining cash and digital assets with organizations covering diplomacy, democracy, water and disaster response, and scientific exchange:
UNCPGA: Council of Presidents of the United Nations General AssemblyClub de Madrid: A forum of former heads of state and governmentHELP: High-Level Experts and Leaders Panel on Water and DisastersLindau Nobel Laureate Meetings: Meetings bringing together Nobel laureates for scientific exchange
According to GG56, the agreed terms provide each organization with cash alongside GXB and PAFI tokens, extending conventional giving through digital assets.
Formal agreements will be signed shortly, with support following agreed terms. GG56 views this as a turning point in translating its social contribution philosophy into action on international public-interest priorities. Each recipient retains authority over donation management and disbursement.
2. MOA with Financial IT Leader ITEYES Secures Technical Momentum for GXB’s Integrated Financial Platform
Financial IT and AI specialist ITEYES is a core partner. Their MOA, including strategic investment provisions, establishes long-term cooperation on IT development, implementation and operations for GG56’s financial businesses.
Alongside Oracle and IBM partnerships, ITEYES’s development and implementation experience includes Samsung Asset Management’s ETF system, Hyundai Marine & Fire Insurance’s next-generation platform, Korea Exchange’s Trade Repository (TR), Nextrade’s alternative exchange matching system, Korea Development Bank’s global standard banking and KB Kookmin Bank’s market risk management.
This experience underpins platform implementation. GXB plans to apply expertise in transaction accuracy, large-scale data processing, trade information management and risk analysis.
ITEYES also offers security token issuance solutions and AI and data platforms. GXB plans to combine its partner’s traditional finance experience and digital asset technologies in an integrated banking and exchange platform.
Cooperation covers IT strategy, consulting, systems development and integration, operations, maintenance, data, AI, financial regulatory requirements and information security. Strategic investment remains subject to final terms and relevant procedures.
GXB plans to connect banking services with digital asset exchange GGEX through account linking, integrated transaction and asset information, and KYC/AML measures, enabling fiat and digital asset services on one platform.
GG56 said the partnership provides technical momentum and professional capabilities to turn its business vision into services.
3. Strategic Cooperation with Ghana’s PaySwitch Targets Africa’s Real-World Payments Market
GXB plans to connect digital assets with local payments through Ghanaian fintech PaySwitch, developing financial services for the real economy.
PaySwitch holds PSP Enhanced authorization from the Bank of Ghana, providing card payments, mobile money and payment gateways for consumers and businesses.
Its operational infrastructure and experience underpin GXB’s plans for payment and remittance services linking digital assets with real-world transactions.
Ghana will be the first expansion base. Integration scope and service arrangements will reflect technical discussions and local regulatory requirements, with locally suitable models supporting expansion elsewhere.
GG56 described the partnership as a foundation for extending GXB into the real economy, addressing local payment needs and eventually expanding into areas including real-world assets (RWA).
4. Pursuing Global Top-Tier CEX Listings; Actively Considering a Hyperliquid Listing
GXB is pursuing listings on global top-tier centralized exchanges while actively considering a listing on Hyperliquid. Its strategy is to broaden user access across centralized and decentralized markets while expanding financial services and trading channels.
Pursuing Global Top-Tier CEX Listings
According to GG56, discussions are underway with multiple global top-tier centralized exchanges regarding GXB token listings to improve global trading access and broaden its trading base.
GXB’s strengths lie in a business model connecting banking services with digital asset trading. Financial IT partnerships and African payment initiatives are intended to support the project’s utility and scalability.
By advancing real-world financial businesses alongside trading channels, GXB aims to strengthen its global market entry. Listing decisions and timing depend on each exchange’s review and the outcome of discussions.
Actively Considering a Listing on Hyperliquid, a Leading Global DEX Platform
GG56 said it is actively considering a GXB token listing on Hyperliquid to reach more global on-chain users and expand trading channels.
Hyperliquid is a leading decentralized trading platform with international recognition and an active on-chain ecosystem. Its prominent market position and global user base underpin GXB’s consideration.
The pursuit of top-tier CEX listings and consideration of Hyperliquid form two pillars of GXB’s plans to expand global trading channels across centralized and decentralized markets.
5. Combining International Networks, Financial IT and Real-World Payments for a Decisive Move in Global Finance in 2027
GXB aims to turn partnerships into platforms and services, combining international networks, financial systems development and local payment infrastructure to compete in global hybrid finance. International Cooperation and Social Contribution: Networks of former national leaders and senior diplomats support cooperation, while hybrid donation agreements move toward implementation.
Financial IT Development: The ITEYES MOA establishes core cooperation for integrated banking and exchange development, drawing on financial institution and trading infrastructure experience.
African Real-World Payments: Bank of Ghana-authorized PaySwitch supports local payment initiatives, with Ghana serving as an expansion base.
Global Trading Access: Top-tier CEX listings and active Hyperliquid consideration seek broader trading and utility access.
GG56 identified donation implementation, financial IT development, African payments and trading channel expansion as core drivers for 2027, focusing on translating partnerships into services.
Combining financial systems experience, local payment execution and international cooperation, GXB aims to connect traditional finance with digital assets. GG56 plans to convert these foundations into business results and strengthen GXB’s presence in global blockchain finance in 2027.
Official Project Information and Channels
Official Website: https://www.ggxbank.com
GG56 Official Portal: https://gg56.com
ITEYES Official Portal: https://www.iteyes.co.kr
Official Global Telegram: https://t.me/GxBEnglishOfficial
Institutional and Media Inquiries: media@gg56.world
This post GXB Agrees on Donations with Four Major International Organizations first appeared on BitcoinWorld.
GXB Agrees on Donations With Four Major International Organizations
BitcoinWorldGXB Agrees on Donations with Four Major International Organizations
Builds Key IT Partnership with ITEYES; Pursues Top-Tier CEX Listings, Actively Considers a Hyperliquid Listing, Poised to Become the “Eye of the Storm” in Blockchain in 2027
Innovative hybrid donation model agreed with UNCPGA, Club de Madrid, HELP and Lindau Nobel Laureate Meetings; formal agreements to be signed
MOA with financial IT specialist ITEYES includes strategic investment provisions, bringing financial institution and exchange systems expertise to GXB’s integrated financial platform
Strategic cooperation with Bank of Ghana-authorized PaySwitch targets Africa’s real-world payments market
Global top-tier CEX listings pursued; listing on leading global DEX platform Hyperliquid under active consideration
GXB, a global hybrid financial platform connecting digital assets and traditional finance, is targeting global markets through international cooperation, financial technology and real-world payments. Donation agreements with four international organizations, an ITEYES MOA and a PaySwitch partnership underpin its ambitions for blockchain finance in 2027.
GG56, the company behind GXB, said donation agreements had been reached, with formal signing forthcoming. Its innovative hybrid donation model combines cash with GXB and PAFI tokens.
The ITEYES MOA includes strategic investment provisions and establishes core IT cooperation for platform development. PaySwitch cooperation supports expansion into African payments. GG56 is pursuing top-tier CEX listings and actively considering Hyperliquid, connecting international networks, technology and local payment capabilities with business development and wider trading channels.
1. Innovative Hybrid Donation Model Agreed with Four International Organizations; Formal Agreements to Follow Soon
Guided by “Global Good, 5 Oceans & 6 Continents,” GG56 agreed on donations combining cash and digital assets with organizations covering diplomacy, democracy, water and disaster response, and scientific exchange:
UNCPGA: Council of Presidents of the United Nations General AssemblyClub de Madrid: A forum of former heads of state and governmentHELP: High-Level Experts and Leaders Panel on Water and DisastersLindau Nobel Laureate Meetings: Meetings bringing together Nobel laureates for scientific exchange
According to GG56, the agreed terms provide each organization with cash alongside GXB and PAFI tokens, extending conventional giving through digital assets.
Formal agreements will be signed shortly, with support following agreed terms. GG56 views this as a turning point in translating its social contribution philosophy into action on international public-interest priorities. Each recipient retains authority over donation management and disbursement.
2. MOA with Financial IT Leader ITEYES Secures Technical Momentum for GXB’s Integrated Financial Platform
Financial IT and AI specialist ITEYES is a core partner. Their MOA, including strategic investment provisions, establishes long-term cooperation on IT development, implementation and operations for GG56’s financial businesses.
Alongside Oracle and IBM partnerships, ITEYES’s development and implementation experience includes Samsung Asset Management’s ETF system, Hyundai Marine & Fire Insurance’s next-generation platform, Korea Exchange’s Trade Repository (TR), Nextrade’s alternative exchange matching system, Korea Development Bank’s global standard banking and KB Kookmin Bank’s market risk management.
This experience underpins platform implementation. GXB plans to apply expertise in transaction accuracy, large-scale data processing, trade information management and risk analysis.
ITEYES also offers security token issuance solutions and AI and data platforms. GXB plans to combine its partner’s traditional finance experience and digital asset technologies in an integrated banking and exchange platform.
Cooperation covers IT strategy, consulting, systems development and integration, operations, maintenance, data, AI, financial regulatory requirements and information security. Strategic investment remains subject to final terms and relevant procedures.
GXB plans to connect banking services with digital asset exchange GGEX through account linking, integrated transaction and asset information, and KYC/AML measures, enabling fiat and digital asset services on one platform.
GG56 said the partnership provides technical momentum and professional capabilities to turn its business vision into services.
3. Strategic Cooperation with Ghana’s PaySwitch Targets Africa’s Real-World Payments Market
GXB plans to connect digital assets with local payments through Ghanaian fintech PaySwitch, developing financial services for the real economy.
PaySwitch holds PSP Enhanced authorization from the Bank of Ghana, providing card payments, mobile money and payment gateways for consumers and businesses.
Its operational infrastructure and experience underpin GXB’s plans for payment and remittance services linking digital assets with real-world transactions.
Ghana will be the first expansion base. Integration scope and service arrangements will reflect technical discussions and local regulatory requirements, with locally suitable models supporting expansion elsewhere.
GG56 described the partnership as a foundation for extending GXB into the real economy, addressing local payment needs and eventually expanding into areas including real-world assets (RWA).
4. Pursuing Global Top-Tier CEX Listings; Actively Considering a Hyperliquid Listing
GXB is pursuing listings on global top-tier centralized exchanges while actively considering a listing on Hyperliquid. Its strategy is to broaden user access across centralized and decentralized markets while expanding financial services and trading channels.
Pursuing Global Top-Tier CEX Listings
According to GG56, discussions are underway with multiple global top-tier centralized exchanges regarding GXB token listings to improve global trading access and broaden its trading base.
GXB’s strengths lie in a business model connecting banking services with digital asset trading. Financial IT partnerships and African payment initiatives are intended to support the project’s utility and scalability.
By advancing real-world financial businesses alongside trading channels, GXB aims to strengthen its global market entry. Listing decisions and timing depend on each exchange’s review and the outcome of discussions.
Actively Considering a Listing on Hyperliquid, a Leading Global DEX Platform
GG56 said it is actively considering a GXB token listing on Hyperliquid to reach more global on-chain users and expand trading channels.
Hyperliquid is a leading decentralized trading platform with international recognition and an active on-chain ecosystem. Its prominent market position and global user base underpin GXB’s consideration.
The pursuit of top-tier CEX listings and consideration of Hyperliquid form two pillars of GXB’s plans to expand global trading channels across centralized and decentralized markets.
5. Combining International Networks, Financial IT and Real-World Payments for a Decisive Move in Global Finance in 2027
GXB aims to turn partnerships into platforms and services, combining international networks, financial systems development and local payment infrastructure to compete in global hybrid finance. International Cooperation and Social Contribution: Networks of former national leaders and senior diplomats support cooperation, while hybrid donation agreements move toward implementation.
Financial IT Development: The ITEYES MOA establishes core cooperation for integrated banking and exchange development, drawing on financial institution and trading infrastructure experience.
African Real-World Payments: Bank of Ghana-authorized PaySwitch supports local payment initiatives, with Ghana serving as an expansion base.
Global Trading Access: Top-tier CEX listings and active Hyperliquid consideration seek broader trading and utility access.
GG56 identified donation implementation, financial IT development, African payments and trading channel expansion as core drivers for 2027, focusing on translating partnerships into services.
Combining financial systems experience, local payment execution and international cooperation, GXB aims to connect traditional finance with digital assets. GG56 plans to convert these foundations into business results and strengthen GXB’s presence in global blockchain finance in 2027.
Official Project Information and Channels
Official Website: https://www.ggxbank.com
GG56 Official Portal: https://gg56.com
ITEYES Official Portal: https://www.iteyes.co.kr
Official Global Telegram: https://t.me/GxBEnglishOfficial
Institutional and Media Inquiries: media@gg56.world
This post GXB Agrees on Donations with Four Major International Organizations first appeared on BitcoinWorld.
Builds Key IT Partnership with ITEYES; Pursues Top-Tier CEX Listings, Actively Considers a Hyperliquid Listing, Poised to Become the “Eye of the Storm” in Blockchain in 2027
Innovative hybrid donation model agreed with UNCPGA, Club de Madrid, HELP and Lindau Nobel Laureate Meetings; formal agreements to be signed
MOA with financial IT specialist ITEYES includes strategic investment provisions, bringing financial institution and exchange systems expertise to GXB’s integrated financial platform
Strategic cooperation with Bank of Ghana-authorized PaySwitch targets Africa’s real-world payments market
Global top-tier CEX listings pursued; listing on leading global DEX platform Hyperliquid under active consideration
GXB, a global hybrid financial platform connecting digital assets and traditional finance, is targeting global markets through international cooperation, financial technology and real-world payments. Donation agreements with four international organizations, an ITEYES MOA and a PaySwitch partnership underpin its ambitions for blockchain finance in 2027.
GG56, the company behind GXB, said donation agreements had been reached, with formal signing forthcoming. Its innovative hybrid donation model combines cash with GXB and PAFI tokens.
The ITEYES MOA includes strategic investment provisions and establishes core IT cooperation for platform development. PaySwitch cooperation supports expansion into African payments. GG56 is pursuing top-tier CEX listings and actively considering Hyperliquid, connecting international networks, technology and local payment capabilities with business development and wider trading channels.
1. Innovative Hybrid Donation Model Agreed with Four International Organizations; Formal Agreements to Follow Soon
Guided by “Global Good, 5 Oceans & 6 Continents,” GG56 agreed on donations combining cash and digital assets with organizations covering diplomacy, democracy, water and disaster response, and scientific exchange:
UNCPGA: Council of Presidents of the United Nations General AssemblyClub de Madrid: A forum of former heads of state and governmentHELP: High-Level Experts and Leaders Panel on Water and DisastersLindau Nobel Laureate Meetings: Meetings bringing together Nobel laureates for scientific exchange
According to GG56, the agreed terms provide each organization with cash alongside GXB and PAFI tokens, extending conventional giving through digital assets.
Formal agreements will be signed shortly, with support following agreed terms. GG56 views this as a turning point in translating its social contribution philosophy into action on international public-interest priorities. Each recipient retains authority over donation management and disbursement.
2. MOA with Financial IT Leader ITEYES Secures Technical Momentum for GXB’s Integrated Financial Platform
Financial IT and AI specialist ITEYES is a core partner. Their MOA, including strategic investment provisions, establishes long-term cooperation on IT development, implementation and operations for GG56’s financial businesses.
Alongside Oracle and IBM partnerships, ITEYES’s development and implementation experience includes Samsung Asset Management’s ETF system, Hyundai Marine & Fire Insurance’s next-generation platform, Korea Exchange’s Trade Repository (TR), Nextrade’s alternative exchange matching system, Korea Development Bank’s global standard banking and KB Kookmin Bank’s market risk management.
This experience underpins platform implementation. GXB plans to apply expertise in transaction accuracy, large-scale data processing, trade information management and risk analysis.
ITEYES also offers security token issuance solutions and AI and data platforms. GXB plans to combine its partner’s traditional finance experience and digital asset technologies in an integrated banking and exchange platform.
Cooperation covers IT strategy, consulting, systems development and integration, operations, maintenance, data, AI, financial regulatory requirements and information security. Strategic investment remains subject to final terms and relevant procedures.
GXB plans to connect banking services with digital asset exchange GGEX through account linking, integrated transaction and asset information, and KYC/AML measures, enabling fiat and digital asset services on one platform.
GG56 said the partnership provides technical momentum and professional capabilities to turn its business vision into services.
3. Strategic Cooperation with Ghana’s PaySwitch Targets Africa’s Real-World Payments Market
GXB plans to connect digital assets with local payments through Ghanaian fintech PaySwitch, developing financial services for the real economy.
PaySwitch holds PSP Enhanced authorization from the Bank of Ghana, providing card payments, mobile money and payment gateways for consumers and businesses.
Its operational infrastructure and experience underpin GXB’s plans for payment and remittance services linking digital assets with real-world transactions.
Ghana will be the first expansion base. Integration scope and service arrangements will reflect technical discussions and local regulatory requirements, with locally suitable models supporting expansion elsewhere.
GG56 described the partnership as a foundation for extending GXB into the real economy, addressing local payment needs and eventually expanding into areas including real-world assets (RWA).
4. Pursuing Global Top-Tier CEX Listings; Actively Considering a Hyperliquid Listing
GXB is pursuing listings on global top-tier centralized exchanges while actively considering a listing on Hyperliquid. Its strategy is to broaden user access across centralized and decentralized markets while expanding financial services and trading channels.
Pursuing Global Top-Tier CEX Listings
According to GG56, discussions are underway with multiple global top-tier centralized exchanges regarding GXB token listings to improve global trading access and broaden its trading base.
GXB’s strengths lie in a business model connecting banking services with digital asset trading. Financial IT partnerships and African payment initiatives are intended to support the project’s utility and scalability.
By advancing real-world financial businesses alongside trading channels, GXB aims to strengthen its global market entry. Listing decisions and timing depend on each exchange’s review and the outcome of discussions.
Actively Considering a Listing on Hyperliquid, a Leading Global DEX Platform
GG56 said it is actively considering a GXB token listing on Hyperliquid to reach more global on-chain users and expand trading channels.
Hyperliquid is a leading decentralized trading platform with international recognition and an active on-chain ecosystem. Its prominent market position and global user base underpin GXB’s consideration.
The pursuit of top-tier CEX listings and consideration of Hyperliquid form two pillars of GXB’s plans to expand global trading channels across centralized and decentralized markets.
5. Combining International Networks, Financial IT and Real-World Payments for a Decisive Move in Global Finance in 2027
GXB aims to turn partnerships into platforms and services, combining international networks, financial systems development and local payment infrastructure to compete in global hybrid finance. International Cooperation and Social Contribution: Networks of former national leaders and senior diplomats support cooperation, while hybrid donation agreements move toward implementation.
Financial IT Development: The ITEYES MOA establishes core cooperation for integrated banking and exchange development, drawing on financial institution and trading infrastructure experience.
African Real-World Payments: Bank of Ghana-authorized PaySwitch supports local payment initiatives, with Ghana serving as an expansion base.
Global Trading Access: Top-tier CEX listings and active Hyperliquid consideration seek broader trading and utility access.
GG56 identified donation implementation, financial IT development, African payments and trading channel expansion as core drivers for 2027, focusing on translating partnerships into services.
Combining financial systems experience, local payment execution and international cooperation, GXB aims to connect traditional finance with digital assets. GG56 plans to convert these foundations into business results and strengthen GXB’s presence in global blockchain finance in 2027.
Official Project Information and Channels
Official Website: https://www.ggxbank.com
GG56 Official Portal: https://gg56.com
ITEYES Official Portal: https://www.iteyes.co.kr
Official Global Telegram: https://t.me/GxBEnglishOfficial
Institutional and Media Inquiries: media@gg56.world
This post GXB Agrees on Donations with Four Major International Organizations first appeared on BitcoinWorld.
303
·
--
Article
See translation
KuCoin TradFi Expands 24/7 Trading to Over 170 Assets Referencing Global Equities, Metals and Oth...BitcoinWorldKuCoin TradFi Expands 24/7 Trading to Over 170 Assets Referencing Global Equities, Metals and Other Commodities
PROVIDENCIALES, Turks and Caicos Islands, Oct. 21, 2026 /PRNewswire/ — KuCoin, a leading global crypto platform built on trust, today announced an expansion of KuCoin TradFi to offer eligible users access to contracts referencing U.S., Hong Kong and South Korean equities, metals and other commodities. KuCoin TradFi now offers more than 170 perpetual contract pairs across eight categories.
Building on the introduction of Stock Index Perpetual Contracts in March 2026, KuCoin has continued expanding its range of traditional asset-linked derivatives for eligible users. The lineup includes contracts referencing technology and semiconductor companies, such as Tesla, NVIDIA, Micron and SanDisk, alongside index- and ETF-linked contracts and contracts referencing commodities including crude oil, natural gas, copper and silver.
The expanded selection provides exposure to a range of regional markets and market themes, including AI, semiconductors, energy and metals. Subject to applicable product terms and eligibility requirements, users can respond to corporate earnings, technology investment and commodity cycles through long or short positions. Settled in USDT and available for 24/7 trading, the contracts allow users to manage positions and respond to developments beyond traditional exchange hours through a familiar futures interface.
For eligible users at VIP1 and above, KuCoin’s Unified Trading Account (UTA) supports TradFi futures trading within a shared framework for funds, margin and risk management, reducing transfers between separate trading accounts. UTA account holders can also use KCUSD as margin for supported TradFi positions while eligible holdings continue earning rewards under applicable product rules, enabling more flexible capital use without first redeeming or converting KCUSD.
The expansion advances KuCoin 5.0’s vision of bringing trading, asset management and global market opportunities together on one platform. It reinforces the “Trust, Built-in.” initiative through broader asset choice, unified account management, more flexible margin use and transparent trading mechanisms. KuCoin will continue building a more connected platform that gives users greater flexibility, efficiency and control.
Visit the TradFi Futures Spin campaign page to explore KuCoin’s expanded TradFi offering and review the applicable campaign terms and conditions.
About KuCoin
Founded in 2017, KuCoin is a leading global crypto platform built on trust and security, serving over 45 million users across 200+ countries and regions. Known for its reliability and user-first approach, the platform builds trust into every layer of the user experience, combining advanced technology, deep liquidity, and strong security safeguards to deliver a seamless trading experience. KuCoin provides access to 1,000+ digital assets through a broad product suite and remains committed to building a compliant and user-centric ecosystem for the future of finance, backed by SOC 2 Type II, ISO/IEC 27001:2022, ISO/IEC 27701:2019, ISO 22301:2019 and ISO/IEC 42001:2023 certifications. In recent years, KuCoin has continued to strengthen its global compliance foundation, marked by key milestones including AUSTRAC registration in Australia, a MiCA license in Europe, and regulatory progress in other markets.
Learn more at www.kucoin.com.
Disclaimer
This material is for informational purposes only and does not constitute investment advice or an offer or solicitation. Trading digital assets and related products involves significant risks, including the potential loss of invested funds. Product availability is subject to applicable laws, regulations, and eligibility requirements.
View original content to download multimedia:https://www.prnewswire.com/apac/news-releases/kucoin-tradfi-expands-247-trading-to-over-170-assets-referencing-global-equities-metals-and-other-commodities-302915205.html
SOURCE KuCoin
This post KuCoin TradFi Expands 24/7 Trading to Over 170 Assets Referencing Global Equities, Metals and Other Commodities first appeared on BitcoinWorld.
KuCoin TradFi Expands 24/7 Trading to Over 170 Assets Referencing Global Equities, Metals and Oth...
BitcoinWorldKuCoin TradFi Expands 24/7 Trading to Over 170 Assets Referencing Global Equities, Metals and Other Commodities
PROVIDENCIALES, Turks and Caicos Islands, Oct. 21, 2026 /PRNewswire/ — KuCoin, a leading global crypto platform built on trust, today announced an expansion of KuCoin TradFi to offer eligible users access to contracts referencing U.S., Hong Kong and South Korean equities, metals and other commodities. KuCoin TradFi now offers more than 170 perpetual contract pairs across eight categories.
Building on the introduction of Stock Index Perpetual Contracts in March 2026, KuCoin has continued expanding its range of traditional asset-linked derivatives for eligible users. The lineup includes contracts referencing technology and semiconductor companies, such as Tesla, NVIDIA, Micron and SanDisk, alongside index- and ETF-linked contracts and contracts referencing commodities including crude oil, natural gas, copper and silver.
The expanded selection provides exposure to a range of regional markets and market themes, including AI, semiconductors, energy and metals. Subject to applicable product terms and eligibility requirements, users can respond to corporate earnings, technology investment and commodity cycles through long or short positions. Settled in USDT and available for 24/7 trading, the contracts allow users to manage positions and respond to developments beyond traditional exchange hours through a familiar futures interface.
For eligible users at VIP1 and above, KuCoin’s Unified Trading Account (UTA) supports TradFi futures trading within a shared framework for funds, margin and risk management, reducing transfers between separate trading accounts. UTA account holders can also use KCUSD as margin for supported TradFi positions while eligible holdings continue earning rewards under applicable product rules, enabling more flexible capital use without first redeeming or converting KCUSD.
The expansion advances KuCoin 5.0’s vision of bringing trading, asset management and global market opportunities together on one platform. It reinforces the “Trust, Built-in.” initiative through broader asset choice, unified account management, more flexible margin use and transparent trading mechanisms. KuCoin will continue building a more connected platform that gives users greater flexibility, efficiency and control.
Visit the TradFi Futures Spin campaign page to explore KuCoin’s expanded TradFi offering and review the applicable campaign terms and conditions.
About KuCoin
Founded in 2017, KuCoin is a leading global crypto platform built on trust and security, serving over 45 million users across 200+ countries and regions. Known for its reliability and user-first approach, the platform builds trust into every layer of the user experience, combining advanced technology, deep liquidity, and strong security safeguards to deliver a seamless trading experience. KuCoin provides access to 1,000+ digital assets through a broad product suite and remains committed to building a compliant and user-centric ecosystem for the future of finance, backed by SOC 2 Type II, ISO/IEC 27001:2022, ISO/IEC 27701:2019, ISO 22301:2019 and ISO/IEC 42001:2023 certifications. In recent years, KuCoin has continued to strengthen its global compliance foundation, marked by key milestones including AUSTRAC registration in Australia, a MiCA license in Europe, and regulatory progress in other markets.
Learn more at www.kucoin.com.
Disclaimer
This material is for informational purposes only and does not constitute investment advice or an offer or solicitation. Trading digital assets and related products involves significant risks, including the potential loss of invested funds. Product availability is subject to applicable laws, regulations, and eligibility requirements.
View original content to download multimedia:https://www.prnewswire.com/apac/news-releases/kucoin-tradfi-expands-247-trading-to-over-170-assets-referencing-global-equities-metals-and-other-commodities-302915205.html
SOURCE KuCoin
This post KuCoin TradFi Expands 24/7 Trading to Over 170 Assets Referencing Global Equities, Metals and Other Commodities first appeared on BitcoinWorld.
PROVIDENCIALES, Turks and Caicos Islands, Oct. 21, 2026 /PRNewswire/ — KuCoin, a leading global crypto platform built on trust, today announced an expansion of KuCoin TradFi to offer eligible users access to contracts referencing U.S., Hong Kong and South Korean equities, metals and other commodities. KuCoin TradFi now offers more than 170 perpetual contract pairs across eight categories.
Building on the introduction of Stock Index Perpetual Contracts in March 2026, KuCoin has continued expanding its range of traditional asset-linked derivatives for eligible users. The lineup includes contracts referencing technology and semiconductor companies, such as Tesla, NVIDIA, Micron and SanDisk, alongside index- and ETF-linked contracts and contracts referencing commodities including crude oil, natural gas, copper and silver.
The expanded selection provides exposure to a range of regional markets and market themes, including AI, semiconductors, energy and metals. Subject to applicable product terms and eligibility requirements, users can respond to corporate earnings, technology investment and commodity cycles through long or short positions. Settled in USDT and available for 24/7 trading, the contracts allow users to manage positions and respond to developments beyond traditional exchange hours through a familiar futures interface.
For eligible users at VIP1 and above, KuCoin’s Unified Trading Account (UTA) supports TradFi futures trading within a shared framework for funds, margin and risk management, reducing transfers between separate trading accounts. UTA account holders can also use KCUSD as margin for supported TradFi positions while eligible holdings continue earning rewards under applicable product rules, enabling more flexible capital use without first redeeming or converting KCUSD.
The expansion advances KuCoin 5.0’s vision of bringing trading, asset management and global market opportunities together on one platform. It reinforces the “Trust, Built-in.” initiative through broader asset choice, unified account management, more flexible margin use and transparent trading mechanisms. KuCoin will continue building a more connected platform that gives users greater flexibility, efficiency and control.
Visit the TradFi Futures Spin campaign page to explore KuCoin’s expanded TradFi offering and review the applicable campaign terms and conditions.
About KuCoin
Founded in 2017, KuCoin is a leading global crypto platform built on trust and security, serving over 45 million users across 200+ countries and regions. Known for its reliability and user-first approach, the platform builds trust into every layer of the user experience, combining advanced technology, deep liquidity, and strong security safeguards to deliver a seamless trading experience. KuCoin provides access to 1,000+ digital assets through a broad product suite and remains committed to building a compliant and user-centric ecosystem for the future of finance, backed by SOC 2 Type II, ISO/IEC 27001:2022, ISO/IEC 27701:2019, ISO 22301:2019 and ISO/IEC 42001:2023 certifications. In recent years, KuCoin has continued to strengthen its global compliance foundation, marked by key milestones including AUSTRAC registration in Australia, a MiCA license in Europe, and regulatory progress in other markets.
Learn more at www.kucoin.com.
Disclaimer
This material is for informational purposes only and does not constitute investment advice or an offer or solicitation. Trading digital assets and related products involves significant risks, including the potential loss of invested funds. Product availability is subject to applicable laws, regulations, and eligibility requirements.
View original content to download multimedia:https://www.prnewswire.com/apac/news-releases/kucoin-tradfi-expands-247-trading-to-over-170-assets-referencing-global-equities-metals-and-other-commodities-302915205.html
SOURCE KuCoin
This post KuCoin TradFi Expands 24/7 Trading to Over 170 Assets Referencing Global Equities, Metals and Other Commodities first appeared on BitcoinWorld.
185
·
--
Article
See translation
Project Eleven and Relm Insurance Partner to Explore Quantum Risk in Digital Asset InsuranceBitcoinWorldProject Eleven and Relm Insurance Partner to Explore Quantum Risk in Digital Asset Insurance
The first partnership to explore post-quantum security as a factor in pricing digital asset insurance.
NEW YORK, Oct. 20, 2026 /PRNewswire/ — Project Eleven, the post-quantum security company for digital assets, today announced Relm Insurance as a development partner for Strongpoint, its flagship institutional custody product. The collaboration will explore how an institution’s post-quantum security controls could be evaluated within digital asset insurance underwriting, helping both companies better understand how quantum readiness may influence future assessments of digital asset risk.
As quantum computing advances, a sufficiently powerful machine could derive private keys from exposed public keys and compromise digital assets. Institutions need custody infrastructure capable of adapting its cryptography before such a machine becomes available. Strongpoint is built for that transition. The platform combines classical and post-quantum signing and separates institutional controls from the cryptography layer, enabling institutions to replace signing algorithms while preserving approval rules and audit history.
“Every institution holding digital assets will eventually need to prepare for post-quantum cryptography. The open question is whether that transition happens on the institution’s schedule or under pressure,” said Alex Pruden, CEO and Co-Founder of Project Eleven. “Insurance plays a critical role in how markets assess and manage risk. We believe there is an opportunity for institutions that invest in stronger post-quantum defenses to eventually see that reflected in how their risk is evaluated. Working with Relm is an important first step toward understanding what that could look like in practice.”
Exploring Post-Quantum Risk in Insurance Underwriting
Through the development partnership, Relm and Project Eleven will explore how post-quantum security could be assessed within existing digital asset insurance frameworks. Areas of investigation include key exposure, signing systems, transaction approvals, migration readiness, and third-party dependencies.
Relm will also provide input into the design and development of Strongpoint, helping Project Eleven understand how institutional custody infrastructure can better support insurance underwriting and risk assessment. This collaboration will help inform Strongpoint’s approach to security controls, auditability, and the evidence institutions may need to demonstrate their post-quantum readiness to insurers.
Joseph Ziolkowski, founder and CEO of Relm Insurance, said, “Insuring exposures across the digital asset ecosystem requires underwriters to anticipate how risks will evolve. Quantum computing is a clear example of an emerging threat that should shape the way we assess risk today. Our work with Project Eleven will explore how institutions identify their exposure, demonstrate effective controls, and prepare for the transition to post-quantum readiness. Bringing underwriting expertise into that process early can help lay the groundwork for insurance solutions that support confidence, resilience, and continued growth in digital assets.”
The collaboration is exploratory, with a focus on developing a shared understanding of post-quantum risk and the controls that could help mitigate it. Any future implications for underwriting or insurance premiums would be subject to further evaluation and Relm’s independent underwriting processes.
Institutions can learn more about Strongpoint at projecteleven.com/strongpoint.
About Project Eleven
Project Eleven builds resilient infrastructure and tooling for the post-quantum era. The company develops scalable solutions that strengthen security across a rapidly evolving quantum threat landscape. With deep expertise in cryptography, blockchain, and financial systems, Project Eleven bridges advanced post-quantum research with real-world implementations that prepare the digital asset ecosystem for the future. For more information, visit www.projecteleven.com.
About Relm Insurance
The Relm Insurance group of companies comprises Relm Insurance Ltd., a Bermuda-domiciled specialty insurance carrier supporting emerging industries and next-generation technologies, and its affiliates. Relm Insurance was launched in 2019 to address the scarcity of insurance capacity available to high-growth markets, and plays an active role in bolstering the resilience of innovative industries. With offices in Bermuda, the US, UK, and MENA, Relm’s unrivaled industry expertise and solutions-driven track record make it a highly sought-after risk partner for businesses and institutions operating at the forefront of various industries like web3, digital assets, AI, biotech, and the space economy. Relm Insurance provides A- rated paper, supporting businesses navigating complex and emerging risks.
Visit: www.relminsurance.com for more information.
Media Contacts
Aubrey Strobel / Elena Nisonoff, Halcyon Communicationsprojecteleven@halcyonpr.xyz
View original content to download multimedia:https://www.prnewswire.co.uk/news-releases/project-eleven-and-relm-insurance-partner-to-explore-quantum-risk-in-digital-asset-insurance-302913845.html
This post Project Eleven and Relm Insurance Partner to Explore Quantum Risk in Digital Asset Insurance first appeared on BitcoinWorld.
Project Eleven and Relm Insurance Partner to Explore Quantum Risk in Digital Asset Insurance
BitcoinWorldProject Eleven and Relm Insurance Partner to Explore Quantum Risk in Digital Asset Insurance
The first partnership to explore post-quantum security as a factor in pricing digital asset insurance.
NEW YORK, Oct. 20, 2026 /PRNewswire/ — Project Eleven, the post-quantum security company for digital assets, today announced Relm Insurance as a development partner for Strongpoint, its flagship institutional custody product. The collaboration will explore how an institution’s post-quantum security controls could be evaluated within digital asset insurance underwriting, helping both companies better understand how quantum readiness may influence future assessments of digital asset risk.
As quantum computing advances, a sufficiently powerful machine could derive private keys from exposed public keys and compromise digital assets. Institutions need custody infrastructure capable of adapting its cryptography before such a machine becomes available. Strongpoint is built for that transition. The platform combines classical and post-quantum signing and separates institutional controls from the cryptography layer, enabling institutions to replace signing algorithms while preserving approval rules and audit history.
“Every institution holding digital assets will eventually need to prepare for post-quantum cryptography. The open question is whether that transition happens on the institution’s schedule or under pressure,” said Alex Pruden, CEO and Co-Founder of Project Eleven. “Insurance plays a critical role in how markets assess and manage risk. We believe there is an opportunity for institutions that invest in stronger post-quantum defenses to eventually see that reflected in how their risk is evaluated. Working with Relm is an important first step toward understanding what that could look like in practice.”
Exploring Post-Quantum Risk in Insurance Underwriting
Through the development partnership, Relm and Project Eleven will explore how post-quantum security could be assessed within existing digital asset insurance frameworks. Areas of investigation include key exposure, signing systems, transaction approvals, migration readiness, and third-party dependencies.
Relm will also provide input into the design and development of Strongpoint, helping Project Eleven understand how institutional custody infrastructure can better support insurance underwriting and risk assessment. This collaboration will help inform Strongpoint’s approach to security controls, auditability, and the evidence institutions may need to demonstrate their post-quantum readiness to insurers.
Joseph Ziolkowski, founder and CEO of Relm Insurance, said, “Insuring exposures across the digital asset ecosystem requires underwriters to anticipate how risks will evolve. Quantum computing is a clear example of an emerging threat that should shape the way we assess risk today. Our work with Project Eleven will explore how institutions identify their exposure, demonstrate effective controls, and prepare for the transition to post-quantum readiness. Bringing underwriting expertise into that process early can help lay the groundwork for insurance solutions that support confidence, resilience, and continued growth in digital assets.”
The collaboration is exploratory, with a focus on developing a shared understanding of post-quantum risk and the controls that could help mitigate it. Any future implications for underwriting or insurance premiums would be subject to further evaluation and Relm’s independent underwriting processes.
Institutions can learn more about Strongpoint at projecteleven.com/strongpoint.
About Project Eleven
Project Eleven builds resilient infrastructure and tooling for the post-quantum era. The company develops scalable solutions that strengthen security across a rapidly evolving quantum threat landscape. With deep expertise in cryptography, blockchain, and financial systems, Project Eleven bridges advanced post-quantum research with real-world implementations that prepare the digital asset ecosystem for the future. For more information, visit www.projecteleven.com.
About Relm Insurance
The Relm Insurance group of companies comprises Relm Insurance Ltd., a Bermuda-domiciled specialty insurance carrier supporting emerging industries and next-generation technologies, and its affiliates. Relm Insurance was launched in 2019 to address the scarcity of insurance capacity available to high-growth markets, and plays an active role in bolstering the resilience of innovative industries. With offices in Bermuda, the US, UK, and MENA, Relm’s unrivaled industry expertise and solutions-driven track record make it a highly sought-after risk partner for businesses and institutions operating at the forefront of various industries like web3, digital assets, AI, biotech, and the space economy. Relm Insurance provides A- rated paper, supporting businesses navigating complex and emerging risks.
Visit: www.relminsurance.com for more information.
Media Contacts
Aubrey Strobel / Elena Nisonoff, Halcyon Communicationsprojecteleven@halcyonpr.xyz
View original content to download multimedia:https://www.prnewswire.co.uk/news-releases/project-eleven-and-relm-insurance-partner-to-explore-quantum-risk-in-digital-asset-insurance-302913845.html
This post Project Eleven and Relm Insurance Partner to Explore Quantum Risk in Digital Asset Insurance first appeared on BitcoinWorld.
The first partnership to explore post-quantum security as a factor in pricing digital asset insurance.
NEW YORK, Oct. 20, 2026 /PRNewswire/ — Project Eleven, the post-quantum security company for digital assets, today announced Relm Insurance as a development partner for Strongpoint, its flagship institutional custody product. The collaboration will explore how an institution’s post-quantum security controls could be evaluated within digital asset insurance underwriting, helping both companies better understand how quantum readiness may influence future assessments of digital asset risk.
As quantum computing advances, a sufficiently powerful machine could derive private keys from exposed public keys and compromise digital assets. Institutions need custody infrastructure capable of adapting its cryptography before such a machine becomes available. Strongpoint is built for that transition. The platform combines classical and post-quantum signing and separates institutional controls from the cryptography layer, enabling institutions to replace signing algorithms while preserving approval rules and audit history.
“Every institution holding digital assets will eventually need to prepare for post-quantum cryptography. The open question is whether that transition happens on the institution’s schedule or under pressure,” said Alex Pruden, CEO and Co-Founder of Project Eleven. “Insurance plays a critical role in how markets assess and manage risk. We believe there is an opportunity for institutions that invest in stronger post-quantum defenses to eventually see that reflected in how their risk is evaluated. Working with Relm is an important first step toward understanding what that could look like in practice.”
Exploring Post-Quantum Risk in Insurance Underwriting
Through the development partnership, Relm and Project Eleven will explore how post-quantum security could be assessed within existing digital asset insurance frameworks. Areas of investigation include key exposure, signing systems, transaction approvals, migration readiness, and third-party dependencies.
Relm will also provide input into the design and development of Strongpoint, helping Project Eleven understand how institutional custody infrastructure can better support insurance underwriting and risk assessment. This collaboration will help inform Strongpoint’s approach to security controls, auditability, and the evidence institutions may need to demonstrate their post-quantum readiness to insurers.
Joseph Ziolkowski, founder and CEO of Relm Insurance, said, “Insuring exposures across the digital asset ecosystem requires underwriters to anticipate how risks will evolve. Quantum computing is a clear example of an emerging threat that should shape the way we assess risk today. Our work with Project Eleven will explore how institutions identify their exposure, demonstrate effective controls, and prepare for the transition to post-quantum readiness. Bringing underwriting expertise into that process early can help lay the groundwork for insurance solutions that support confidence, resilience, and continued growth in digital assets.”
The collaboration is exploratory, with a focus on developing a shared understanding of post-quantum risk and the controls that could help mitigate it. Any future implications for underwriting or insurance premiums would be subject to further evaluation and Relm’s independent underwriting processes.
Institutions can learn more about Strongpoint at projecteleven.com/strongpoint.
About Project Eleven
Project Eleven builds resilient infrastructure and tooling for the post-quantum era. The company develops scalable solutions that strengthen security across a rapidly evolving quantum threat landscape. With deep expertise in cryptography, blockchain, and financial systems, Project Eleven bridges advanced post-quantum research with real-world implementations that prepare the digital asset ecosystem for the future. For more information, visit www.projecteleven.com.
About Relm Insurance
The Relm Insurance group of companies comprises Relm Insurance Ltd., a Bermuda-domiciled specialty insurance carrier supporting emerging industries and next-generation technologies, and its affiliates. Relm Insurance was launched in 2019 to address the scarcity of insurance capacity available to high-growth markets, and plays an active role in bolstering the resilience of innovative industries. With offices in Bermuda, the US, UK, and MENA, Relm’s unrivaled industry expertise and solutions-driven track record make it a highly sought-after risk partner for businesses and institutions operating at the forefront of various industries like web3, digital assets, AI, biotech, and the space economy. Relm Insurance provides A- rated paper, supporting businesses navigating complex and emerging risks.
Visit: www.relminsurance.com for more information.
Media Contacts
Aubrey Strobel / Elena Nisonoff, Halcyon Communicationsprojecteleven@halcyonpr.xyz
View original content to download multimedia:https://www.prnewswire.co.uk/news-releases/project-eleven-and-relm-insurance-partner-to-explore-quantum-risk-in-digital-asset-insurance-302913845.html
This post Project Eleven and Relm Insurance Partner to Explore Quantum Risk in Digital Asset Insurance first appeared on BitcoinWorld.
114
·
--
Article
See translation
Blockchain.com Launches Options Trading for Eligible UsersBitcoinWorldBlockchain.com Launches Options Trading for Eligible Users
New Trading Account feature makes it simpler to trade short-term market views with defined risk
VALLETTA, Malta, Oct. 20, 2026 /PRNewswire/ — Blockchain.com, a global leader in crypto services for retail and institutional users, today announced the launch of options trading within its Trading Account, giving eligible users a simple and intuitive way to trade short-term views on where crypto markets are headed.
Options give traders greater flexibility to express a market view based on both price direction and timing. Blockchain.com is bringing that functionality to its consumer app experience to make options more accessible, while preserving the defined risk structure of buy options.
The new experience turns a traditionally complex trading process into a straightforward flow. Users select an expiry date and target price, enter their trade amount, and review the trade before confirming. Blockchain.com then translates that view into the corresponding call or put option, allowing users to focus on their market view rather than the mechanics of structuring the trade.
“Options give traders another way to act on where they believe the market is headed, but across a wide range of providers and apps, the experience is often difficult to navigate,” said Taro Ugen, VP of Consumer at Blockchain.com. “We’ve designed the Blockchain.com options experience around the decisions that matter: where traders think the market is going, when they think it will get there, and how much they are prepared to put behind that view. We take care of the complexity in the background, so users get a simpler way to access a powerful trading service with clearly defined risk that augments their investment toolkit.”
At launch, eligible users can buy call and put options on Bitcoin (BTC), Ether (ETH), Solana (SOL), Hyperliquid (HYPE), Avalanche (AVAX), XRP and TRON (TRX). Live market prices are shown directly within the trading experience. Trades are funded upfront in USDC from the Blockchain.com Trading Account. Because users are buying options rather than trading on margin, the amount paid upfront represents the maximum potential loss.
The launch of options trading follows Blockchain.com’s introduction of perpetual futures trading earlier this year. Options will initially be available with expiries of up to one week and must be held through settlement. The product is available to eligible users in supported jurisdictions and is subject to applicable laws and regulatory requirements.
About Blockchain.com:Blockchain.com is connecting the world to the future of finance. The most trusted and fastest-growing global crypto company helps millions safely access cryptocurrency. Since its inception in 2011, Blockchain.com has supported over 95M+ wallets, 44M+ confirmed accounts, and more than $1.1 trillion in crypto transactions. Operating in more than 70 jurisdictions, Blockchain.com offers secure self-custody, institutional services, and a growing product suite aligned with global regulation and privacy standards.
Media Contact:Press@blockchain.com
View original content to download multimedia:https://www.prnewswire.co.uk/news-releases/blockchaincom-launches-options-trading-for-eligible-users-302913792.html
This post Blockchain.com Launches Options Trading for Eligible Users first appeared on BitcoinWorld.
Blockchain.com Launches Options Trading for Eligible Users
BitcoinWorldBlockchain.com Launches Options Trading for Eligible Users
New Trading Account feature makes it simpler to trade short-term market views with defined risk
VALLETTA, Malta, Oct. 20, 2026 /PRNewswire/ — Blockchain.com, a global leader in crypto services for retail and institutional users, today announced the launch of options trading within its Trading Account, giving eligible users a simple and intuitive way to trade short-term views on where crypto markets are headed.
Options give traders greater flexibility to express a market view based on both price direction and timing. Blockchain.com is bringing that functionality to its consumer app experience to make options more accessible, while preserving the defined risk structure of buy options.
The new experience turns a traditionally complex trading process into a straightforward flow. Users select an expiry date and target price, enter their trade amount, and review the trade before confirming. Blockchain.com then translates that view into the corresponding call or put option, allowing users to focus on their market view rather than the mechanics of structuring the trade.
“Options give traders another way to act on where they believe the market is headed, but across a wide range of providers and apps, the experience is often difficult to navigate,” said Taro Ugen, VP of Consumer at Blockchain.com. “We’ve designed the Blockchain.com options experience around the decisions that matter: where traders think the market is going, when they think it will get there, and how much they are prepared to put behind that view. We take care of the complexity in the background, so users get a simpler way to access a powerful trading service with clearly defined risk that augments their investment toolkit.”
At launch, eligible users can buy call and put options on Bitcoin (BTC), Ether (ETH), Solana (SOL), Hyperliquid (HYPE), Avalanche (AVAX), XRP and TRON (TRX). Live market prices are shown directly within the trading experience. Trades are funded upfront in USDC from the Blockchain.com Trading Account. Because users are buying options rather than trading on margin, the amount paid upfront represents the maximum potential loss.
The launch of options trading follows Blockchain.com’s introduction of perpetual futures trading earlier this year. Options will initially be available with expiries of up to one week and must be held through settlement. The product is available to eligible users in supported jurisdictions and is subject to applicable laws and regulatory requirements.
About Blockchain.com:Blockchain.com is connecting the world to the future of finance. The most trusted and fastest-growing global crypto company helps millions safely access cryptocurrency. Since its inception in 2011, Blockchain.com has supported over 95M+ wallets, 44M+ confirmed accounts, and more than $1.1 trillion in crypto transactions. Operating in more than 70 jurisdictions, Blockchain.com offers secure self-custody, institutional services, and a growing product suite aligned with global regulation and privacy standards.
Media Contact:Press@blockchain.com
View original content to download multimedia:https://www.prnewswire.co.uk/news-releases/blockchaincom-launches-options-trading-for-eligible-users-302913792.html
This post Blockchain.com Launches Options Trading for Eligible Users first appeared on BitcoinWorld.
New Trading Account feature makes it simpler to trade short-term market views with defined risk
VALLETTA, Malta, Oct. 20, 2026 /PRNewswire/ — Blockchain.com, a global leader in crypto services for retail and institutional users, today announced the launch of options trading within its Trading Account, giving eligible users a simple and intuitive way to trade short-term views on where crypto markets are headed.
Options give traders greater flexibility to express a market view based on both price direction and timing. Blockchain.com is bringing that functionality to its consumer app experience to make options more accessible, while preserving the defined risk structure of buy options.
The new experience turns a traditionally complex trading process into a straightforward flow. Users select an expiry date and target price, enter their trade amount, and review the trade before confirming. Blockchain.com then translates that view into the corresponding call or put option, allowing users to focus on their market view rather than the mechanics of structuring the trade.
“Options give traders another way to act on where they believe the market is headed, but across a wide range of providers and apps, the experience is often difficult to navigate,” said Taro Ugen, VP of Consumer at Blockchain.com. “We’ve designed the Blockchain.com options experience around the decisions that matter: where traders think the market is going, when they think it will get there, and how much they are prepared to put behind that view. We take care of the complexity in the background, so users get a simpler way to access a powerful trading service with clearly defined risk that augments their investment toolkit.”
At launch, eligible users can buy call and put options on Bitcoin (BTC), Ether (ETH), Solana (SOL), Hyperliquid (HYPE), Avalanche (AVAX), XRP and TRON (TRX). Live market prices are shown directly within the trading experience. Trades are funded upfront in USDC from the Blockchain.com Trading Account. Because users are buying options rather than trading on margin, the amount paid upfront represents the maximum potential loss.
The launch of options trading follows Blockchain.com’s introduction of perpetual futures trading earlier this year. Options will initially be available with expiries of up to one week and must be held through settlement. The product is available to eligible users in supported jurisdictions and is subject to applicable laws and regulatory requirements.
About Blockchain.com:Blockchain.com is connecting the world to the future of finance. The most trusted and fastest-growing global crypto company helps millions safely access cryptocurrency. Since its inception in 2011, Blockchain.com has supported over 95M+ wallets, 44M+ confirmed accounts, and more than $1.1 trillion in crypto transactions. Operating in more than 70 jurisdictions, Blockchain.com offers secure self-custody, institutional services, and a growing product suite aligned with global regulation and privacy standards.
Media Contact:Press@blockchain.com
View original content to download multimedia:https://www.prnewswire.co.uk/news-releases/blockchaincom-launches-options-trading-for-eligible-users-302913792.html
This post Blockchain.com Launches Options Trading for Eligible Users first appeared on BitcoinWorld.
1
1
123
·
--

Article
See translation
WEMADE Celebrates Legend of YMIR’s First Anniversary With Major Content Roadmap and New Assassin ...BitcoinWorldWEMADE Celebrates Legend of YMIR’s First Anniversary with Major Content Roadmap and New Assassin Class
The milestone update includes a +600% EXP fast-track server alongside rewards and comeback perks for returning players
SEOUL, South Korea, Oct. 20, 2026 /PRNewswire/ — WEMADE, the leading global game developer behind the blockbuster Unreal Engine 5 MMORPG Legend of YMIR, has rolled out a first-anniversary update to commemorate a full year of global live service of its flagship title. This milestone delivers a comprehensive content roadmap spanning October through December, headlined by the debut of a new Assassin class, the launch of the accelerated Boot Camp Season 2 progression server, and exclusive rewards.
Legend of YMIR combines high-fidelity visual worldbuilding with dark Norse mythology and large-scale Server Battles. Since its global debut, the game has kept its community engaged with steady content updates and events for players worldwide. The first-anniversary celebration now serves to expand and strengthen the established player base, as well as provide a frictionless entry point for new and returning adventurers looking to accelerate their progression.
The milestone update includes:
New Assassin Class: Delivering an agile, high-impact combat style unlike any other class in the game, players can adopt the new playstyle with class change support, without losing hard-earned character progress.
Boot Camp Season 2: A dedicated growth server engineered to expedite character development for new and returning users, it features a +600% EXP boost up to Level 65, specialized hunting buffs, and leveling support items — dramatically lowering barriers to entry and enabling players to swiftly catch up with veteran players.
Player Rewards: The pre-registration campaign surpassed 100,000 participants, unlocking the 1st Anniversary Legendary Companion for all active players. Pre-registrants will receive exclusive bonus rewards, and players who complete in-game missions during the anniversary event can also earn a Legendary-grade Disir and Valkyrie.
Community Events: Players who join community events on official social channels will stand a chance to win additional prizes by sharing anniversary messages and posting in-game screenshots.
Einherjar Fellowship Event: A referral initiative encouraging active players to invite new and returning players to the game. Invited players can earn rewards by accepting an invitation and completing designated missions, while inviters receive tiered rewards based on the number of completed “fellowships”. Rewards include Epic- and Legendary-grade items, with top-ranking inviters also having the opportunity to earn coveted Mythical-grade rewards.
Check-in Event and Mythical Companion Update: Mythical-grade Disirs and Valkyries will debut in December, alongside an exclusive 14-day check-in event for Boot Camp participants. Players who join the Boot Camp server after the first-anniversary event can still participate in this check-in event and earn a Legendary-grade Valkyrie on Day 7 and a Legendary-grade Disir on Day 14.
Michael Kim, Head of Business Division, WEMADE, said: “This first anniversary is a tribute to the passion and dedication of our global community. We have intentionally curated an extensive content roadmap designed to reward loyal veterans while providing a streamlined onboarding pathway for newcomers and returning players. With sustained updates leading into December and an upcoming YMIR Cup Season 3, we look forward to delivering even deeper immersion within the Legend of YMIR universe in the year ahead.”
For full details on the Legend of YMIR first anniversary update and events, please visit the official website as well as the official Discord, YouTube, and Facebook community channels for real-time updates and interaction.
-ENDS-
About WEMADE WEMADE is the only company combining over two decades of AAA game development success with a fully operational, game-proven blockchain ecosystem—built entirely on its proprietary Layer-1 mainnet, WEMIX3.0. Known for global hits such as The Legend of Mir, MIR4, NIGHT CROWS and Legend of YMIR, WEMADE is leading the industry in seamlessly integrating gameplay, tokenomics, NFTs, stablecoin payments, and blockchain infrastructure. Through WEMIX PLAY, WEMADE delivers a unified digital economy where players, creators, and investors can own, trade, and benefit from digital assets—powering the next generation of interactive entertainment and driving the evolution of Web3 gaming. For more information, please visit https://wemade.com/.
View original content to download multimedia:https://www.prnewswire.co.uk/news-releases/wemade-celebrates-legend-of-ymirs-first-anniversary-with-major-content-roadmap-and-new-assassin-class-302913693.html
This post WEMADE Celebrates Legend of YMIR’s First Anniversary with Major Content Roadmap and New Assassin Class first appeared on BitcoinWorld.
WEMADE Celebrates Legend of YMIR’s First Anniversary With Major Content Roadmap and New Assassin ...
BitcoinWorldWEMADE Celebrates Legend of YMIR’s First Anniversary with Major Content Roadmap and New Assassin Class
The milestone update includes a +600% EXP fast-track server alongside rewards and comeback perks for returning players
SEOUL, South Korea, Oct. 20, 2026 /PRNewswire/ — WEMADE, the leading global game developer behind the blockbuster Unreal Engine 5 MMORPG Legend of YMIR, has rolled out a first-anniversary update to commemorate a full year of global live service of its flagship title. This milestone delivers a comprehensive content roadmap spanning October through December, headlined by the debut of a new Assassin class, the launch of the accelerated Boot Camp Season 2 progression server, and exclusive rewards.
Legend of YMIR combines high-fidelity visual worldbuilding with dark Norse mythology and large-scale Server Battles. Since its global debut, the game has kept its community engaged with steady content updates and events for players worldwide. The first-anniversary celebration now serves to expand and strengthen the established player base, as well as provide a frictionless entry point for new and returning adventurers looking to accelerate their progression.
The milestone update includes:
New Assassin Class: Delivering an agile, high-impact combat style unlike any other class in the game, players can adopt the new playstyle with class change support, without losing hard-earned character progress.
Boot Camp Season 2: A dedicated growth server engineered to expedite character development for new and returning users, it features a +600% EXP boost up to Level 65, specialized hunting buffs, and leveling support items — dramatically lowering barriers to entry and enabling players to swiftly catch up with veteran players.
Player Rewards: The pre-registration campaign surpassed 100,000 participants, unlocking the 1st Anniversary Legendary Companion for all active players. Pre-registrants will receive exclusive bonus rewards, and players who complete in-game missions during the anniversary event can also earn a Legendary-grade Disir and Valkyrie.
Community Events: Players who join community events on official social channels will stand a chance to win additional prizes by sharing anniversary messages and posting in-game screenshots.
Einherjar Fellowship Event: A referral initiative encouraging active players to invite new and returning players to the game. Invited players can earn rewards by accepting an invitation and completing designated missions, while inviters receive tiered rewards based on the number of completed “fellowships”. Rewards include Epic- and Legendary-grade items, with top-ranking inviters also having the opportunity to earn coveted Mythical-grade rewards.
Check-in Event and Mythical Companion Update: Mythical-grade Disirs and Valkyries will debut in December, alongside an exclusive 14-day check-in event for Boot Camp participants. Players who join the Boot Camp server after the first-anniversary event can still participate in this check-in event and earn a Legendary-grade Valkyrie on Day 7 and a Legendary-grade Disir on Day 14.
Michael Kim, Head of Business Division, WEMADE, said: “This first anniversary is a tribute to the passion and dedication of our global community. We have intentionally curated an extensive content roadmap designed to reward loyal veterans while providing a streamlined onboarding pathway for newcomers and returning players. With sustained updates leading into December and an upcoming YMIR Cup Season 3, we look forward to delivering even deeper immersion within the Legend of YMIR universe in the year ahead.”
For full details on the Legend of YMIR first anniversary update and events, please visit the official website as well as the official Discord, YouTube, and Facebook community channels for real-time updates and interaction.
-ENDS-
About WEMADE WEMADE is the only company combining over two decades of AAA game development success with a fully operational, game-proven blockchain ecosystem—built entirely on its proprietary Layer-1 mainnet, WEMIX3.0. Known for global hits such as The Legend of Mir, MIR4, NIGHT CROWS and Legend of YMIR, WEMADE is leading the industry in seamlessly integrating gameplay, tokenomics, NFTs, stablecoin payments, and blockchain infrastructure. Through WEMIX PLAY, WEMADE delivers a unified digital economy where players, creators, and investors can own, trade, and benefit from digital assets—powering the next generation of interactive entertainment and driving the evolution of Web3 gaming. For more information, please visit https://wemade.com/.
View original content to download multimedia:https://www.prnewswire.co.uk/news-releases/wemade-celebrates-legend-of-ymirs-first-anniversary-with-major-content-roadmap-and-new-assassin-class-302913693.html
This post WEMADE Celebrates Legend of YMIR’s First Anniversary with Major Content Roadmap and New Assassin Class first appeared on BitcoinWorld.
The milestone update includes a +600% EXP fast-track server alongside rewards and comeback perks for returning players
SEOUL, South Korea, Oct. 20, 2026 /PRNewswire/ — WEMADE, the leading global game developer behind the blockbuster Unreal Engine 5 MMORPG Legend of YMIR, has rolled out a first-anniversary update to commemorate a full year of global live service of its flagship title. This milestone delivers a comprehensive content roadmap spanning October through December, headlined by the debut of a new Assassin class, the launch of the accelerated Boot Camp Season 2 progression server, and exclusive rewards.
Legend of YMIR combines high-fidelity visual worldbuilding with dark Norse mythology and large-scale Server Battles. Since its global debut, the game has kept its community engaged with steady content updates and events for players worldwide. The first-anniversary celebration now serves to expand and strengthen the established player base, as well as provide a frictionless entry point for new and returning adventurers looking to accelerate their progression.
The milestone update includes:
New Assassin Class: Delivering an agile, high-impact combat style unlike any other class in the game, players can adopt the new playstyle with class change support, without losing hard-earned character progress.
Boot Camp Season 2: A dedicated growth server engineered to expedite character development for new and returning users, it features a +600% EXP boost up to Level 65, specialized hunting buffs, and leveling support items — dramatically lowering barriers to entry and enabling players to swiftly catch up with veteran players.
Player Rewards: The pre-registration campaign surpassed 100,000 participants, unlocking the 1st Anniversary Legendary Companion for all active players. Pre-registrants will receive exclusive bonus rewards, and players who complete in-game missions during the anniversary event can also earn a Legendary-grade Disir and Valkyrie.
Community Events: Players who join community events on official social channels will stand a chance to win additional prizes by sharing anniversary messages and posting in-game screenshots.
Einherjar Fellowship Event: A referral initiative encouraging active players to invite new and returning players to the game. Invited players can earn rewards by accepting an invitation and completing designated missions, while inviters receive tiered rewards based on the number of completed “fellowships”. Rewards include Epic- and Legendary-grade items, with top-ranking inviters also having the opportunity to earn coveted Mythical-grade rewards.
Check-in Event and Mythical Companion Update: Mythical-grade Disirs and Valkyries will debut in December, alongside an exclusive 14-day check-in event for Boot Camp participants. Players who join the Boot Camp server after the first-anniversary event can still participate in this check-in event and earn a Legendary-grade Valkyrie on Day 7 and a Legendary-grade Disir on Day 14.
Michael Kim, Head of Business Division, WEMADE, said: “This first anniversary is a tribute to the passion and dedication of our global community. We have intentionally curated an extensive content roadmap designed to reward loyal veterans while providing a streamlined onboarding pathway for newcomers and returning players. With sustained updates leading into December and an upcoming YMIR Cup Season 3, we look forward to delivering even deeper immersion within the Legend of YMIR universe in the year ahead.”
For full details on the Legend of YMIR first anniversary update and events, please visit the official website as well as the official Discord, YouTube, and Facebook community channels for real-time updates and interaction.
-ENDS-
About WEMADE WEMADE is the only company combining over two decades of AAA game development success with a fully operational, game-proven blockchain ecosystem—built entirely on its proprietary Layer-1 mainnet, WEMIX3.0. Known for global hits such as The Legend of Mir, MIR4, NIGHT CROWS and Legend of YMIR, WEMADE is leading the industry in seamlessly integrating gameplay, tokenomics, NFTs, stablecoin payments, and blockchain infrastructure. Through WEMIX PLAY, WEMADE delivers a unified digital economy where players, creators, and investors can own, trade, and benefit from digital assets—powering the next generation of interactive entertainment and driving the evolution of Web3 gaming. For more information, please visit https://wemade.com/.
View original content to download multimedia:https://www.prnewswire.co.uk/news-releases/wemade-celebrates-legend-of-ymirs-first-anniversary-with-major-content-roadmap-and-new-assassin-class-302913693.html
This post WEMADE Celebrates Legend of YMIR’s First Anniversary with Major Content Roadmap and New Assassin Class first appeared on BitcoinWorld.
252
·
--
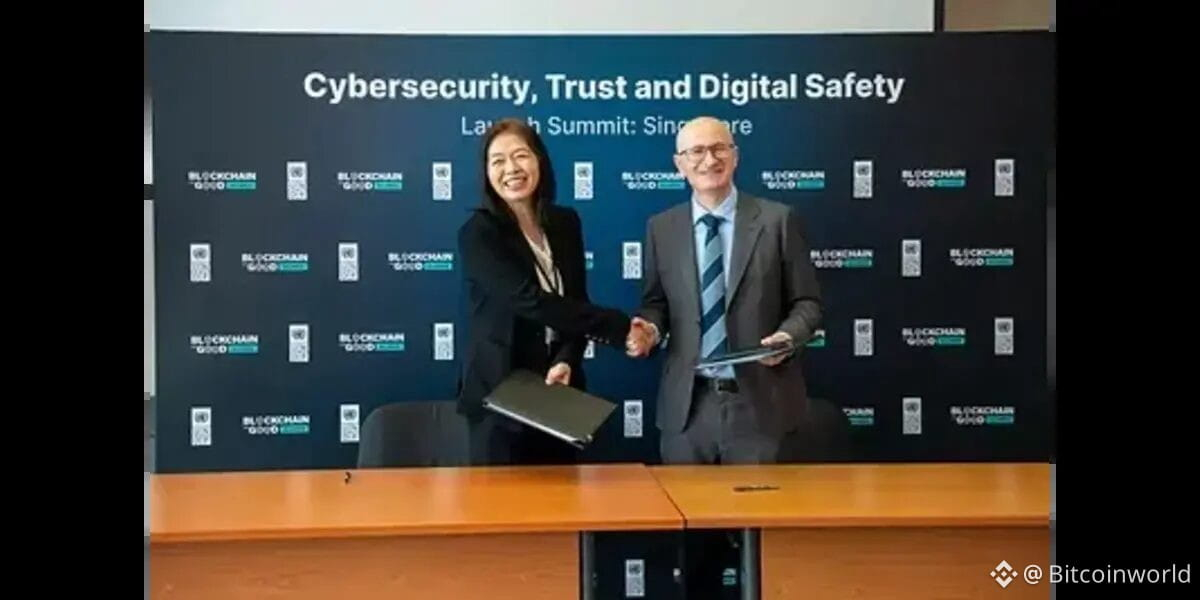
Article
See translation
BGA and UNDP Partner on Two-Year Initiative to Strengthen Digital Safety and DevelopmentBitcoinWorldBGA and UNDP Partner on Two-Year Initiative to Strengthen Digital Safety and Development
DUBAI, UAE, Oct. 19, 2026 /CNW/ — Blockchain for Good Alliance (BGA), the global non-profit initiative founded by Bybit, dedicated to leveraging blockchain for societal impact, and the United Nations Development Programme (UNDP) have signed an agreement to launch a two-year programme to strengthen cybersecurity knowledge and capacity for the responsible use of digital technologies in development. The agreement was signed by Edward Vrkić, UNDP’s Resident Representative to Malaysia, Singapore and Brunei Darussalam, and Helen Liu, Founder of BGA, at the Cybersecurity, Trust and Digital Safety Launch Summit in Singapore at the UNDP Global Centre for Technology, Innovation and Sustainable Development.
The signing was followed by a panel discussion on securing digital trust, in which Edward Vrkić and Helen Liu were joined by Robert Pašičko, Lead of the UNDP Alternative Finance Lab (AltFinLab), and Mykolas Majauskas, Global Head of Policy at Bybit, moderated by Glenn Tan, Director of Global Affairs at BGA. The discussion also examined how cybersecurity has become a development concern, how Singapore’s regulatory approach compares with other regions, and how frontline operators and public institutions can share what they learn through public-private partnerships.
“The governments we support are facing growing and increasingly complex cybersecurity challenges, driven by ongoing conflicts, AI-enabled fraud, and more sophisticated cyberattacks,” said Robert Pašičko, UNDP AltFinLab Team Lead. “Strengthening cybersecurity capacities and building resilient, trusted digital systems are essential to addressing these risks. We welcome the opportunity to deepen our collaboration with the BGA, drawing on its expertise and experience.”
A Critical Time for Collaboration
As public institutions rely more on digital systems, including blockchain technology, to manage identity, payments, aid delivery and public records, cybersecurity is essential to keeping services running, protecting public funds and maintaining trust. The rapid advance of artificial intelligence (AI) is widening that gap on both sides: attacks are becoming faster and more sophisticated, while the systems being defended grow more complex. Securing these systems requires technical expertise, strong governance and the capacity to respond to incidents and risks. The partnership will help strengthen and build these capabilities to protect essential services, public funds and the people who depend on them.
“It is fitting that this begins in Singapore, with a small group, and with the people who will actually deliver it,” said Helen Liu, Founder of the BGA. “The industry BGA comes from has learned about cybersecurity and digital safety the hard way. This partnership puts what it learned to work for the public good.”
The programme will be implemented by UNDP’s AltFinLab, in collaboration with BGA. Over two years, it will draw on cybersecurity expertise from BGA’s ecosystem to support learning through the SDG Blockchain Accelerator, that helps develop solutions powered by emerging technologies to advance the SDGs, and the Government Blockchain Academy, a capacity building programme for public officials, alongside dedicated sessions for interested UNDP Country Offices and relevant government counterparts. Through learning and advisory support, the programme will address data protection, secure digital payments and the security of public digital services.
“Prevention, response and recovery are the three pillars of cybersecurity, and public institutions need all three,” said Glenn Tan, Director of Global Affairs at the BGA. “The private sector holds much of the expertise across these areas, yet public institutions and international organizations with pressing needs often lack direct channels to access it and collaborate. This partnership opens that door.”
The partnership builds on BGA’s role as Strategic Partner of the UNDP SDG Blockchain Accelerator, now entering its third cohort, and its membership at the Blockchain Advisory Group (BAG), an advisory forum convened by the UNDP, bringing together leaders from across the blockchain ecosystem to explore how blockchain technologies can contribute to sustainable development and strengthen digital public systems.
About Blockchain for Good Alliance (BGA)The Blockchain for Good Alliance (BGA) is a global nonprofit initiative founded by Bybit, dedicated to advancing blockchain as a tool to address real-world problems. By convening leaders, innovators, and organisations from across the blockchain industry, BGA seeks to drive innovation, collaboration and action toward a more sustainable and equitable world.
For more information: Email: hello@chainforgood.org Website: www.chainforgood.org Twitter: www.x.com/chainforgood LinkedIn: https://www.linkedin.com/company/blockchainforgoodalliance/
About the United Nations Development Programme
UNDP is the leading United Nations organisation fighting to end the injustice of poverty, inequality and climate change. Working with our broad network of experts and partners in 170 countries, we help nations to build integrated, lasting solutions for people and the planet. UNDP Alternative Finance Lab is a global initiative that connects finance, innovation, and emerging technologies to explore, test, and scale new approaches for sustainable development.
For more information: Twitter: https://x.com/UNDP_AltFinLab LinkedIn: https://www.linkedin.com/company/105843439
View original content to download multimedia:https://www.prnewswire.com/news-releases/bga-and-undp-partner-on-two-year-initiative-to-strengthen-digital-safety-and-development-302912412.html
SOURCE Blockchain for Good Alliance (BGA)
This post BGA and UNDP Partner on Two-Year Initiative to Strengthen Digital Safety and Development first appeared on BitcoinWorld.
BGA and UNDP Partner on Two-Year Initiative to Strengthen Digital Safety and Development
BitcoinWorldBGA and UNDP Partner on Two-Year Initiative to Strengthen Digital Safety and Development
DUBAI, UAE, Oct. 19, 2026 /CNW/ — Blockchain for Good Alliance (BGA), the global non-profit initiative founded by Bybit, dedicated to leveraging blockchain for societal impact, and the United Nations Development Programme (UNDP) have signed an agreement to launch a two-year programme to strengthen cybersecurity knowledge and capacity for the responsible use of digital technologies in development. The agreement was signed by Edward Vrkić, UNDP’s Resident Representative to Malaysia, Singapore and Brunei Darussalam, and Helen Liu, Founder of BGA, at the Cybersecurity, Trust and Digital Safety Launch Summit in Singapore at the UNDP Global Centre for Technology, Innovation and Sustainable Development.
The signing was followed by a panel discussion on securing digital trust, in which Edward Vrkić and Helen Liu were joined by Robert Pašičko, Lead of the UNDP Alternative Finance Lab (AltFinLab), and Mykolas Majauskas, Global Head of Policy at Bybit, moderated by Glenn Tan, Director of Global Affairs at BGA. The discussion also examined how cybersecurity has become a development concern, how Singapore’s regulatory approach compares with other regions, and how frontline operators and public institutions can share what they learn through public-private partnerships.
“The governments we support are facing growing and increasingly complex cybersecurity challenges, driven by ongoing conflicts, AI-enabled fraud, and more sophisticated cyberattacks,” said Robert Pašičko, UNDP AltFinLab Team Lead. “Strengthening cybersecurity capacities and building resilient, trusted digital systems are essential to addressing these risks. We welcome the opportunity to deepen our collaboration with the BGA, drawing on its expertise and experience.”
A Critical Time for Collaboration
As public institutions rely more on digital systems, including blockchain technology, to manage identity, payments, aid delivery and public records, cybersecurity is essential to keeping services running, protecting public funds and maintaining trust. The rapid advance of artificial intelligence (AI) is widening that gap on both sides: attacks are becoming faster and more sophisticated, while the systems being defended grow more complex. Securing these systems requires technical expertise, strong governance and the capacity to respond to incidents and risks. The partnership will help strengthen and build these capabilities to protect essential services, public funds and the people who depend on them.
“It is fitting that this begins in Singapore, with a small group, and with the people who will actually deliver it,” said Helen Liu, Founder of the BGA. “The industry BGA comes from has learned about cybersecurity and digital safety the hard way. This partnership puts what it learned to work for the public good.”
The programme will be implemented by UNDP’s AltFinLab, in collaboration with BGA. Over two years, it will draw on cybersecurity expertise from BGA’s ecosystem to support learning through the SDG Blockchain Accelerator, that helps develop solutions powered by emerging technologies to advance the SDGs, and the Government Blockchain Academy, a capacity building programme for public officials, alongside dedicated sessions for interested UNDP Country Offices and relevant government counterparts. Through learning and advisory support, the programme will address data protection, secure digital payments and the security of public digital services.
“Prevention, response and recovery are the three pillars of cybersecurity, and public institutions need all three,” said Glenn Tan, Director of Global Affairs at the BGA. “The private sector holds much of the expertise across these areas, yet public institutions and international organizations with pressing needs often lack direct channels to access it and collaborate. This partnership opens that door.”
The partnership builds on BGA’s role as Strategic Partner of the UNDP SDG Blockchain Accelerator, now entering its third cohort, and its membership at the Blockchain Advisory Group (BAG), an advisory forum convened by the UNDP, bringing together leaders from across the blockchain ecosystem to explore how blockchain technologies can contribute to sustainable development and strengthen digital public systems.
About Blockchain for Good Alliance (BGA)The Blockchain for Good Alliance (BGA) is a global nonprofit initiative founded by Bybit, dedicated to advancing blockchain as a tool to address real-world problems. By convening leaders, innovators, and organisations from across the blockchain industry, BGA seeks to drive innovation, collaboration and action toward a more sustainable and equitable world.
For more information: Email: hello@chainforgood.org Website: www.chainforgood.org Twitter: www.x.com/chainforgood LinkedIn: https://www.linkedin.com/company/blockchainforgoodalliance/
About the United Nations Development Programme
UNDP is the leading United Nations organisation fighting to end the injustice of poverty, inequality and climate change. Working with our broad network of experts and partners in 170 countries, we help nations to build integrated, lasting solutions for people and the planet. UNDP Alternative Finance Lab is a global initiative that connects finance, innovation, and emerging technologies to explore, test, and scale new approaches for sustainable development.
For more information: Twitter: https://x.com/UNDP_AltFinLab LinkedIn: https://www.linkedin.com/company/105843439
View original content to download multimedia:https://www.prnewswire.com/news-releases/bga-and-undp-partner-on-two-year-initiative-to-strengthen-digital-safety-and-development-302912412.html
SOURCE Blockchain for Good Alliance (BGA)
This post BGA and UNDP Partner on Two-Year Initiative to Strengthen Digital Safety and Development first appeared on BitcoinWorld.
DUBAI, UAE, Oct. 19, 2026 /CNW/ — Blockchain for Good Alliance (BGA), the global non-profit initiative founded by Bybit, dedicated to leveraging blockchain for societal impact, and the United Nations Development Programme (UNDP) have signed an agreement to launch a two-year programme to strengthen cybersecurity knowledge and capacity for the responsible use of digital technologies in development. The agreement was signed by Edward Vrkić, UNDP’s Resident Representative to Malaysia, Singapore and Brunei Darussalam, and Helen Liu, Founder of BGA, at the Cybersecurity, Trust and Digital Safety Launch Summit in Singapore at the UNDP Global Centre for Technology, Innovation and Sustainable Development.
The signing was followed by a panel discussion on securing digital trust, in which Edward Vrkić and Helen Liu were joined by Robert Pašičko, Lead of the UNDP Alternative Finance Lab (AltFinLab), and Mykolas Majauskas, Global Head of Policy at Bybit, moderated by Glenn Tan, Director of Global Affairs at BGA. The discussion also examined how cybersecurity has become a development concern, how Singapore’s regulatory approach compares with other regions, and how frontline operators and public institutions can share what they learn through public-private partnerships.
“The governments we support are facing growing and increasingly complex cybersecurity challenges, driven by ongoing conflicts, AI-enabled fraud, and more sophisticated cyberattacks,” said Robert Pašičko, UNDP AltFinLab Team Lead. “Strengthening cybersecurity capacities and building resilient, trusted digital systems are essential to addressing these risks. We welcome the opportunity to deepen our collaboration with the BGA, drawing on its expertise and experience.”
A Critical Time for Collaboration
As public institutions rely more on digital systems, including blockchain technology, to manage identity, payments, aid delivery and public records, cybersecurity is essential to keeping services running, protecting public funds and maintaining trust. The rapid advance of artificial intelligence (AI) is widening that gap on both sides: attacks are becoming faster and more sophisticated, while the systems being defended grow more complex. Securing these systems requires technical expertise, strong governance and the capacity to respond to incidents and risks. The partnership will help strengthen and build these capabilities to protect essential services, public funds and the people who depend on them.
“It is fitting that this begins in Singapore, with a small group, and with the people who will actually deliver it,” said Helen Liu, Founder of the BGA. “The industry BGA comes from has learned about cybersecurity and digital safety the hard way. This partnership puts what it learned to work for the public good.”
The programme will be implemented by UNDP’s AltFinLab, in collaboration with BGA. Over two years, it will draw on cybersecurity expertise from BGA’s ecosystem to support learning through the SDG Blockchain Accelerator, that helps develop solutions powered by emerging technologies to advance the SDGs, and the Government Blockchain Academy, a capacity building programme for public officials, alongside dedicated sessions for interested UNDP Country Offices and relevant government counterparts. Through learning and advisory support, the programme will address data protection, secure digital payments and the security of public digital services.
“Prevention, response and recovery are the three pillars of cybersecurity, and public institutions need all three,” said Glenn Tan, Director of Global Affairs at the BGA. “The private sector holds much of the expertise across these areas, yet public institutions and international organizations with pressing needs often lack direct channels to access it and collaborate. This partnership opens that door.”
The partnership builds on BGA’s role as Strategic Partner of the UNDP SDG Blockchain Accelerator, now entering its third cohort, and its membership at the Blockchain Advisory Group (BAG), an advisory forum convened by the UNDP, bringing together leaders from across the blockchain ecosystem to explore how blockchain technologies can contribute to sustainable development and strengthen digital public systems.
About Blockchain for Good Alliance (BGA)The Blockchain for Good Alliance (BGA) is a global nonprofit initiative founded by Bybit, dedicated to advancing blockchain as a tool to address real-world problems. By convening leaders, innovators, and organisations from across the blockchain industry, BGA seeks to drive innovation, collaboration and action toward a more sustainable and equitable world.
For more information: Email: hello@chainforgood.org Website: www.chainforgood.org Twitter: www.x.com/chainforgood LinkedIn: https://www.linkedin.com/company/blockchainforgoodalliance/
About the United Nations Development Programme
UNDP is the leading United Nations organisation fighting to end the injustice of poverty, inequality and climate change. Working with our broad network of experts and partners in 170 countries, we help nations to build integrated, lasting solutions for people and the planet. UNDP Alternative Finance Lab is a global initiative that connects finance, innovation, and emerging technologies to explore, test, and scale new approaches for sustainable development.
For more information: Twitter: https://x.com/UNDP_AltFinLab LinkedIn: https://www.linkedin.com/company/105843439
View original content to download multimedia:https://www.prnewswire.com/news-releases/bga-and-undp-partner-on-two-year-initiative-to-strengthen-digital-safety-and-development-302912412.html
SOURCE Blockchain for Good Alliance (BGA)
This post BGA and UNDP Partner on Two-Year Initiative to Strengthen Digital Safety and Development first appeared on BitcoinWorld.
1
235
·
--
Article
See translation
24X Completes Spot Cryptocurrency Trade in BTC With Standard Chartered and WintermuteBitcoinWorld24X Completes Spot Cryptocurrency Trade in BTC with Standard Chartered and Wintermute
HAMILTON, Bermuda, Oct. 19, 2026 /PRNewswire/ — 24X Bermuda Limited (“24X“) today announced that it has successfully completed its second consecutive spot cryptocurrency client trade on its institutional-grade, multi-asset trading platform, solidifying its position as one of a select few global venues offering both crypto spot and FX trading on a single, unified technology infrastructure.
The trade was executed in Bitcoin (BTC) as part of 24X’s strategic partnership with Standard Chartered, a leading international banking group and one of the world’s global systemically important banks (G-SIBs). Standard Chartered acted as liquidity taker and Wintermute served as liquidity provider for this trade.
The transaction follows 24X’s inaugural spot crypto trade, in which Cumberland DRW served as liquidity provider. Taken together, these two trades mark the continued development of regulated, institutional-grade infrastructure for digital asset markets, demonstrating how established financial institutions and specialist liquidity providers are helping accelerate the adoption of digital assets by institutional investors.
“Institutional demand for digital assets is increasing at an unprecedented level, and our 24X platform is ready to meet this moment,” said 24X CEO and Founder Dmitri Galinov. “This trade with Wintermute affirms the deep liquidity, rigorous oversight, and the seamless workflow of our crypto trading infrastructure. We are very happy to be working with Wintermute and Standard Chartered on this transaction, and we look forward to continuing to execute these types of trades as global markets continue to converge around digital assets.”
“Institutions already represent a significant part of the digital asset market, as reflected in their record share of our OTC spot flow in the first half of 2026, and expect the same quality of execution and infrastructure they are used to in traditional markets. Meeting those expectations requires the long-term investment in technology and operational efficiency we’ve made since Wintermute was founded. That approach has allowed us to serve a broad range of counterparties and now expand into traditional markets. We’re pleased to have provided liquidity for this trade,” said Evgeny Gaevoy, CEO and founder of Wintermute.
24X also offers Deliverable Swaps, Non-Deliverable Swaps, Metals and Spot products to institutional customers in addition to NDFs. Since its launch in 2019, 24X’s multi-asset offering through a single trading interface has enabled market participants to access increased liquidity at lower cost. 24X’s crypto activity is regulated by the Bermuda Monetary Authority.
About 24X
24X Bermuda Holdings LLC (“24 Exchange”) is a privately held company with two primary operating subsidiaries: 24X Bermuda Limited, which allows seamless and cost-effective exchange of currency exposures; and 24X National Exchange LLC, the first national securities exchange approved by the SEC to operate 23 hours each weekday. 24X’s mission is to enable cost-effective trades across a growing range of asset classes around the clock. 24X lowers the cost of exchanging assets in the global markets while delivering creative and unique workflows catered to each asset class. More information is available at https://24exchange.com/. 24X National Exchange enables retail and institutional customers around the world to trade in U.S. equities via broker-dealers who are approved members. More information about 24X National Exchange is available at https://equities.24exchange.com/home.
About Wintermute
Wintermute is a global algorithmic trading firm, leading OTC desk, and liquidity provider operating across digital asset and traditional financial markets. With over $3.5 trillion in annual trading volume, it provides liquidity across more than 70 centralized and decentralized exchanges and is a key partner to token projects seeking deep, scalable liquidity. Wintermute’s proprietary trading infrastructure allows it to trade across the entire digital asset ecosystem as well as on the leading global derivatives exchanges in traditional markets, making it the preferred counterparty for a broad range of market participants, including some of the world’s largest financial institutions. Alongside trading, building is central to Wintermute’s DNA, from backing early-stage projects through Wintermute Ventures to incubating new protocols, some of which have grown into independent businesses.
Media Contact:Eric Andrus, KARV24Xmedia@karv.global
View original content:https://www.prnewswire.com/news-releases/24x-completes-spot-cryptocurrency-trade-in-btc-with-standard-chartered-and-wintermute-302910545.html
SOURCE 24 Exchange
This post 24X Completes Spot Cryptocurrency Trade in BTC with Standard Chartered and Wintermute first appeared on BitcoinWorld.
24X Completes Spot Cryptocurrency Trade in BTC With Standard Chartered and Wintermute
BitcoinWorld24X Completes Spot Cryptocurrency Trade in BTC with Standard Chartered and Wintermute
HAMILTON, Bermuda, Oct. 19, 2026 /PRNewswire/ — 24X Bermuda Limited (“24X“) today announced that it has successfully completed its second consecutive spot cryptocurrency client trade on its institutional-grade, multi-asset trading platform, solidifying its position as one of a select few global venues offering both crypto spot and FX trading on a single, unified technology infrastructure.
The trade was executed in Bitcoin (BTC) as part of 24X’s strategic partnership with Standard Chartered, a leading international banking group and one of the world’s global systemically important banks (G-SIBs). Standard Chartered acted as liquidity taker and Wintermute served as liquidity provider for this trade.
The transaction follows 24X’s inaugural spot crypto trade, in which Cumberland DRW served as liquidity provider. Taken together, these two trades mark the continued development of regulated, institutional-grade infrastructure for digital asset markets, demonstrating how established financial institutions and specialist liquidity providers are helping accelerate the adoption of digital assets by institutional investors.
“Institutional demand for digital assets is increasing at an unprecedented level, and our 24X platform is ready to meet this moment,” said 24X CEO and Founder Dmitri Galinov. “This trade with Wintermute affirms the deep liquidity, rigorous oversight, and the seamless workflow of our crypto trading infrastructure. We are very happy to be working with Wintermute and Standard Chartered on this transaction, and we look forward to continuing to execute these types of trades as global markets continue to converge around digital assets.”
“Institutions already represent a significant part of the digital asset market, as reflected in their record share of our OTC spot flow in the first half of 2026, and expect the same quality of execution and infrastructure they are used to in traditional markets. Meeting those expectations requires the long-term investment in technology and operational efficiency we’ve made since Wintermute was founded. That approach has allowed us to serve a broad range of counterparties and now expand into traditional markets. We’re pleased to have provided liquidity for this trade,” said Evgeny Gaevoy, CEO and founder of Wintermute.
24X also offers Deliverable Swaps, Non-Deliverable Swaps, Metals and Spot products to institutional customers in addition to NDFs. Since its launch in 2019, 24X’s multi-asset offering through a single trading interface has enabled market participants to access increased liquidity at lower cost. 24X’s crypto activity is regulated by the Bermuda Monetary Authority.
About 24X
24X Bermuda Holdings LLC (“24 Exchange”) is a privately held company with two primary operating subsidiaries: 24X Bermuda Limited, which allows seamless and cost-effective exchange of currency exposures; and 24X National Exchange LLC, the first national securities exchange approved by the SEC to operate 23 hours each weekday. 24X’s mission is to enable cost-effective trades across a growing range of asset classes around the clock. 24X lowers the cost of exchanging assets in the global markets while delivering creative and unique workflows catered to each asset class. More information is available at https://24exchange.com/. 24X National Exchange enables retail and institutional customers around the world to trade in U.S. equities via broker-dealers who are approved members. More information about 24X National Exchange is available at https://equities.24exchange.com/home.
About Wintermute
Wintermute is a global algorithmic trading firm, leading OTC desk, and liquidity provider operating across digital asset and traditional financial markets. With over $3.5 trillion in annual trading volume, it provides liquidity across more than 70 centralized and decentralized exchanges and is a key partner to token projects seeking deep, scalable liquidity. Wintermute’s proprietary trading infrastructure allows it to trade across the entire digital asset ecosystem as well as on the leading global derivatives exchanges in traditional markets, making it the preferred counterparty for a broad range of market participants, including some of the world’s largest financial institutions. Alongside trading, building is central to Wintermute’s DNA, from backing early-stage projects through Wintermute Ventures to incubating new protocols, some of which have grown into independent businesses.
Media Contact:Eric Andrus, KARV24Xmedia@karv.global
View original content:https://www.prnewswire.com/news-releases/24x-completes-spot-cryptocurrency-trade-in-btc-with-standard-chartered-and-wintermute-302910545.html
SOURCE 24 Exchange
This post 24X Completes Spot Cryptocurrency Trade in BTC with Standard Chartered and Wintermute first appeared on BitcoinWorld.
HAMILTON, Bermuda, Oct. 19, 2026 /PRNewswire/ — 24X Bermuda Limited (“24X“) today announced that it has successfully completed its second consecutive spot cryptocurrency client trade on its institutional-grade, multi-asset trading platform, solidifying its position as one of a select few global venues offering both crypto spot and FX trading on a single, unified technology infrastructure.
The trade was executed in Bitcoin (BTC) as part of 24X’s strategic partnership with Standard Chartered, a leading international banking group and one of the world’s global systemically important banks (G-SIBs). Standard Chartered acted as liquidity taker and Wintermute served as liquidity provider for this trade.
The transaction follows 24X’s inaugural spot crypto trade, in which Cumberland DRW served as liquidity provider. Taken together, these two trades mark the continued development of regulated, institutional-grade infrastructure for digital asset markets, demonstrating how established financial institutions and specialist liquidity providers are helping accelerate the adoption of digital assets by institutional investors.
“Institutional demand for digital assets is increasing at an unprecedented level, and our 24X platform is ready to meet this moment,” said 24X CEO and Founder Dmitri Galinov. “This trade with Wintermute affirms the deep liquidity, rigorous oversight, and the seamless workflow of our crypto trading infrastructure. We are very happy to be working with Wintermute and Standard Chartered on this transaction, and we look forward to continuing to execute these types of trades as global markets continue to converge around digital assets.”
“Institutions already represent a significant part of the digital asset market, as reflected in their record share of our OTC spot flow in the first half of 2026, and expect the same quality of execution and infrastructure they are used to in traditional markets. Meeting those expectations requires the long-term investment in technology and operational efficiency we’ve made since Wintermute was founded. That approach has allowed us to serve a broad range of counterparties and now expand into traditional markets. We’re pleased to have provided liquidity for this trade,” said Evgeny Gaevoy, CEO and founder of Wintermute.
24X also offers Deliverable Swaps, Non-Deliverable Swaps, Metals and Spot products to institutional customers in addition to NDFs. Since its launch in 2019, 24X’s multi-asset offering through a single trading interface has enabled market participants to access increased liquidity at lower cost. 24X’s crypto activity is regulated by the Bermuda Monetary Authority.
About 24X
24X Bermuda Holdings LLC (“24 Exchange”) is a privately held company with two primary operating subsidiaries: 24X Bermuda Limited, which allows seamless and cost-effective exchange of currency exposures; and 24X National Exchange LLC, the first national securities exchange approved by the SEC to operate 23 hours each weekday. 24X’s mission is to enable cost-effective trades across a growing range of asset classes around the clock. 24X lowers the cost of exchanging assets in the global markets while delivering creative and unique workflows catered to each asset class. More information is available at https://24exchange.com/. 24X National Exchange enables retail and institutional customers around the world to trade in U.S. equities via broker-dealers who are approved members. More information about 24X National Exchange is available at https://equities.24exchange.com/home.
About Wintermute
Wintermute is a global algorithmic trading firm, leading OTC desk, and liquidity provider operating across digital asset and traditional financial markets. With over $3.5 trillion in annual trading volume, it provides liquidity across more than 70 centralized and decentralized exchanges and is a key partner to token projects seeking deep, scalable liquidity. Wintermute’s proprietary trading infrastructure allows it to trade across the entire digital asset ecosystem as well as on the leading global derivatives exchanges in traditional markets, making it the preferred counterparty for a broad range of market participants, including some of the world’s largest financial institutions. Alongside trading, building is central to Wintermute’s DNA, from backing early-stage projects through Wintermute Ventures to incubating new protocols, some of which have grown into independent businesses.
Media Contact:Eric Andrus, KARV24Xmedia@karv.global
View original content:https://www.prnewswire.com/news-releases/24x-completes-spot-cryptocurrency-trade-in-btc-with-standard-chartered-and-wintermute-302910545.html
SOURCE 24 Exchange
This post 24X Completes Spot Cryptocurrency Trade in BTC with Standard Chartered and Wintermute first appeared on BitcoinWorld.
139
·
--

Article
See translation
Traders Fair 2027 Returns to Manila to Fuel the Philippines’ Booming Digital Finance and Trading ...BitcoinWorldTraders Fair 2027 Returns to Manila to Fuel the Philippines’ Booming Digital Finance and Trading Ecosystem
Traders Fair, the premier financial conference series, will return to Manila on April 3, 2027, bringing together the region’s top trading, fintech, and investment leaders at the Edsa Shangri-La. Over 2,500 industry professionals, international brokers, financial experts, and retail investors are expected to gather for a high-impact day dedicated to market education, emerging trends, and technology.
The event’s return underscores the Philippines’ position as one of Southeast Asia’s most dynamic financial hubs. Driven by a tech-savvy, mobile-first generation, Philippine retail investors are rapidly adopting digital finance and actively seeking advanced strategies, automated trading tools, and trusted international brokerages. Traders Fair 2027 aims to fuel this momentum by directly connecting global market leaders with the country’s fast-growing trading community.
What Attendees Can Expect:
Expert-Led Seminars: Practical insights and actionable strategies delivered by over 20 top local and international mentors, strategists, and fintech leaders.
Interactive Expo & Networking: A high-energy floor featuring more than 30 global brokers, introducing brokers (IBs), and fintech innovators ready to connect with investors and potential partners.
Market & Tech Insights: Direct access to modern trading platforms, algorithmic systems, and emerging technologies powering Southeast Asia’s retail investment sector.
Exclusive Evening Gathering: An invite-only dinner following the main event, creating an intimate space for high-level networking among sponsors, speakers, and key industry leaders.
Whether tailored to newcomers or active, high-volume investors, Philippines Traders Fair 2027 provides the essential network and insights needed to navigate modern financial markets.
Registration is now open. To secure a free pass, visit tradersfair.com/philippines27.
This post Traders Fair 2027 Returns to Manila to Fuel the Philippines’ Booming Digital Finance and Trading Ecosystem first appeared on BitcoinWorld.
Traders Fair 2027 Returns to Manila to Fuel the Philippines’ Booming Digital Finance and Trading ...
BitcoinWorldTraders Fair 2027 Returns to Manila to Fuel the Philippines’ Booming Digital Finance and Trading Ecosystem
Traders Fair, the premier financial conference series, will return to Manila on April 3, 2027, bringing together the region’s top trading, fintech, and investment leaders at the Edsa Shangri-La. Over 2,500 industry professionals, international brokers, financial experts, and retail investors are expected to gather for a high-impact day dedicated to market education, emerging trends, and technology.
The event’s return underscores the Philippines’ position as one of Southeast Asia’s most dynamic financial hubs. Driven by a tech-savvy, mobile-first generation, Philippine retail investors are rapidly adopting digital finance and actively seeking advanced strategies, automated trading tools, and trusted international brokerages. Traders Fair 2027 aims to fuel this momentum by directly connecting global market leaders with the country’s fast-growing trading community.
What Attendees Can Expect:
Expert-Led Seminars: Practical insights and actionable strategies delivered by over 20 top local and international mentors, strategists, and fintech leaders.
Interactive Expo & Networking: A high-energy floor featuring more than 30 global brokers, introducing brokers (IBs), and fintech innovators ready to connect with investors and potential partners.
Market & Tech Insights: Direct access to modern trading platforms, algorithmic systems, and emerging technologies powering Southeast Asia’s retail investment sector.
Exclusive Evening Gathering: An invite-only dinner following the main event, creating an intimate space for high-level networking among sponsors, speakers, and key industry leaders.
Whether tailored to newcomers or active, high-volume investors, Philippines Traders Fair 2027 provides the essential network and insights needed to navigate modern financial markets.
Registration is now open. To secure a free pass, visit tradersfair.com/philippines27.
This post Traders Fair 2027 Returns to Manila to Fuel the Philippines’ Booming Digital Finance and Trading Ecosystem first appeared on BitcoinWorld.
Traders Fair, the premier financial conference series, will return to Manila on April 3, 2027, bringing together the region’s top trading, fintech, and investment leaders at the Edsa Shangri-La. Over 2,500 industry professionals, international brokers, financial experts, and retail investors are expected to gather for a high-impact day dedicated to market education, emerging trends, and technology.
The event’s return underscores the Philippines’ position as one of Southeast Asia’s most dynamic financial hubs. Driven by a tech-savvy, mobile-first generation, Philippine retail investors are rapidly adopting digital finance and actively seeking advanced strategies, automated trading tools, and trusted international brokerages. Traders Fair 2027 aims to fuel this momentum by directly connecting global market leaders with the country’s fast-growing trading community.
What Attendees Can Expect:
Expert-Led Seminars: Practical insights and actionable strategies delivered by over 20 top local and international mentors, strategists, and fintech leaders.
Interactive Expo & Networking: A high-energy floor featuring more than 30 global brokers, introducing brokers (IBs), and fintech innovators ready to connect with investors and potential partners.
Market & Tech Insights: Direct access to modern trading platforms, algorithmic systems, and emerging technologies powering Southeast Asia’s retail investment sector.
Exclusive Evening Gathering: An invite-only dinner following the main event, creating an intimate space for high-level networking among sponsors, speakers, and key industry leaders.
Whether tailored to newcomers or active, high-volume investors, Philippines Traders Fair 2027 provides the essential network and insights needed to navigate modern financial markets.
Registration is now open. To secure a free pass, visit tradersfair.com/philippines27.
This post Traders Fair 2027 Returns to Manila to Fuel the Philippines’ Booming Digital Finance and Trading Ecosystem first appeared on BitcoinWorld.
242
·
--
Article
See translation
LABITCONF 2026 Brings Together Global Leaders Shaping the Future of Bitcoin in Buenos AiresBitcoinWorldLABITCONF 2026 brings together global leaders shaping the future of Bitcoin in Buenos Aires
his year’s HODL edition of LABITCONF looks beyond the local moment, bringing together the people building ideas, technologies and the adoption cases of Bitcoin, Blockchain and AI that could define the next decade.
Buenos Aires, October 1, 2026 — LABITCONF will hold its 14th edition on Friday, October 30 and Saturday, October 31 at BAFerial (formerly Costa Salguero), as part of Tecweek. Once again, the event will turn Buenos Aires into a meeting point for Latin America and the world’s Bitcoin and Blockchain community and its integration with AI.
With more than 150 speakers and 5 stages, this edition – under the theme HODL – is built not only around voices analyzing the local landscape, but above all around what they bring to the global conversations shaping the ecosystem.
The program will feature authors who changed the way people understand Bitcoin, scientists working to model its evolution, government officials, developers of critical infrastructure, entrepreneurs connecting it to the real economy, and community leaders who have shown that adoption can start from the ground up, with everyday citizens.
Bitcoin is going through a defining moment: it’s establishing itself as a global assets, entering the agendas of companies and governments, coexisting with the rapid advance of AI, and facing new debates over scalability, privacy and security. Against that backdrop, LABITCONF’s HODL edition sets out to bring together, in one place, the people building the ideas, technologies and adoption cases that could shape the next decade.
“This year’s conference stands out for bringing together key names shaping the future of Bitcoin – a major moment in the story of this asset, for those who already understand it and for those who want to understand it in depth. This year we want Buenos Aires to hear from the people thinking about, building, defending, and bringing Bitcoin to the world, and using AI for real-world use cases and payments,” said Rodolfo Andragnes, founder and organizer of LABITCONF.
International and local speakers
A few of the voices reflecting LABITCONF 2026’s international and wide-ranging lineup:
Saifedean Ammous — Economist and author of The Bitcoin Standard, one of the most influential books on Bitcoin’s monetary thesis. This will mark his first visit to South America.
Giovanni Santostasi — Physicist and neuroscientist, creator of the Bitcoin Power Law Theory, a model that analyzes Bitcoin’s evolution as a long-term network phenomenon through power laws.
David Zell — Co-founder and President of the Bitcoin Policy Institute, one of the leading think tanks bringing Bitcoin research and policy proposals into Washington’s political debate.
Giacomo Zucco — President of Plan ₿ Network and one of Europe’s most recognized voices in Bitcoin education, privacy, and culture.
Raymond “Ray” Nasser — Brazil Director at Nonco, a leading institutional OTC firm for Bitcoin and crypto.
Graeme Moore — CSO of Project Eleven, a company focused on post-quantum infrastructure for digital assets. His talk will bring one of the most sensitive technological debates for Bitcoin’s future security to the stage.
Jeremy Almond — Co-founder and CEO of Paystand, a B2B payments network built on blockchain infrastructure that reaches more than a million companies. He represents the intersection of Bitcoin, fintech, and the productive economy.
Gabriel Campa — Head of Digital Assets at Towerbank, one of the most crypto-friendly banks in Latin America, headquartered in Panama.
Among the local figures who will take part are Sebastián Serrano, CEO of Ripio; Borja Martel Seward, CEO of Roxom; Andrés Ondarra, GM of Nexo Argentina; Julián Colombo, Director for South America at Bitso; Manuel Beaudroit, CEO of Belo; and Daniel Rabinovich, COO of Mercado Libre — along with Bitcoin mining executives, economists, and government representatives to be announced soon.
On Bitcoin’s standing as the most profitable asset in history, personal finance, and market projections, the program will include talks by well-known analysts and investors such as Juan Rodríguez (Papa Bitcoin), Agustín Natoli (Joven Inversor), and Norberto Giudice (CriptoNorber). Economist Iván Carrino will also take part, to discuss the government’s economic policies.
The event will also feature the leading voices in Spanish-language Bitcoin podcasting, including Lunaticoin, Lorena Ortiz, Andrés BTC, Alberto Mera, Adrian Treviño, and Miss Bitcoin — together with authors such as Saifedean himself, Adrian Bernabeu, Ariel Aguilar, and Ivan Kaleja, alongside representatives from the NGOs Bitcoin Argentina and La Cripta, who will help attendees understand the culture, self-custody, and debates shaping the Spanish-speaking ecosystem.
On the artificial intelligence front, speakers will include Ramiro Marra, politician and CEO of Bull Market, who will reflect on AI in trading, as well as Santiago Siri, Maximiliano Firtman, Ana Ojeda (criptolawyer), Malena Martín, and others exploring new technological frontiers — along with lawmakers Martin Yeza and Dario Nieto, who are working on the application of AI within the state.
They will be joined by international developers such as Sergio D. Lerner and Chris Guida, as well as leading voices in circular economies, including Román Martínez, co-founder of Bitcoin Beach (the first circular economy and the inspiration behind El Salvador’s national Bitcoin adoption); Alexandra Navarro, of Paystand, one of the largest contributors to these kinds of projects; and representatives from Bolivia, Ecuador, Brazil, Venezuela, Cuba, Chile, and Uruguay leading organizations that support vulnerable communities and entrepreneurs.
Five stages
The speaker and talk selection will cover Bitcoin, Blockchain and AI across five stages, each geared toward a different audience:
ABC: Where it all begins
The stage for those who want to understand the ecosystem from the ground up, in a clear and accessible way, with no prior knowledge required.
ORANGE PILL: When you realize Bitcoin is much more than technology.
The space for exploring the ideas and values around Bitcoin, aimed at bitcoiners, thinkers, activists, and anyone who is already orange-pilled or wants to understand the broader concept encompassing money, freedom, sovereignty, economics, philosophy, and a shift in the global paradigm.
VISION: What ‘s next starts here.
The place for those looking beyond the present to understand the technologies shaping the future — whether they’re founders, OGs, early adopters, innovators, or technologists.
WORKSHOP / CODERS: Where ideas become code.
A hands-on development track designed for learning, sharing technical knowledge, and connecting with builders, developers, hackers, founders, programmers, and creators.
VIP — BUSINESS: Where ideas become opportunities.
An exclusive area within the VIP section, available to Business and Experience ticket holders, offering content and meetings focused on business, investment, and networking opportunities with the people making decisions and building within the industry.
HODL: a long-term view
This year’s LABITCONF concept, HODL, works both as a slogan and as an editorial lens. It refers not just to holding Bitcoin, but to maintaining a long-term view amid market noise: understanding what endures, what is changing, and who is building the next layers of the ecosystem.
With that focus, the goal is to offer a broad perspective: Bitcoin as money and a store of value, but also as blockchain technology, infrastructure, public policy, a tool for inclusion, and a response to the changes brought by AI. For that reason, the conference will bring together introductory content, philosophy, forward-looking perspectives, hands-on workshops, and executive gatherings.
About LABITCONF
LABITCONF (Latin American Bitcoin & Blockchain Conference) is the oldest Bitcoin & Blockchain conference in the world and the most prestigious in Latin America. Since 2013, it has brought together global leaders, developers, companies, communities, and users each year to discuss the present and future of money and decentralized technologies.
More information and tickets: LABITCONF.com
PRESS CONTACT
Gina Giraldo | +54 9 11 2469 1507
Bárbara Distéfano | +54 9 11 2394 4543
prensa@labitconf.com
This post LABITCONF 2026 brings together global leaders shaping the future of Bitcoin in Buenos Aires first appeared on BitcoinWorld.
LABITCONF 2026 Brings Together Global Leaders Shaping the Future of Bitcoin in Buenos Aires
BitcoinWorldLABITCONF 2026 brings together global leaders shaping the future of Bitcoin in Buenos Aires
his year’s HODL edition of LABITCONF looks beyond the local moment, bringing together the people building ideas, technologies and the adoption cases of Bitcoin, Blockchain and AI that could define the next decade.
Buenos Aires, October 1, 2026 — LABITCONF will hold its 14th edition on Friday, October 30 and Saturday, October 31 at BAFerial (formerly Costa Salguero), as part of Tecweek. Once again, the event will turn Buenos Aires into a meeting point for Latin America and the world’s Bitcoin and Blockchain community and its integration with AI.
With more than 150 speakers and 5 stages, this edition – under the theme HODL – is built not only around voices analyzing the local landscape, but above all around what they bring to the global conversations shaping the ecosystem.
The program will feature authors who changed the way people understand Bitcoin, scientists working to model its evolution, government officials, developers of critical infrastructure, entrepreneurs connecting it to the real economy, and community leaders who have shown that adoption can start from the ground up, with everyday citizens.
Bitcoin is going through a defining moment: it’s establishing itself as a global assets, entering the agendas of companies and governments, coexisting with the rapid advance of AI, and facing new debates over scalability, privacy and security. Against that backdrop, LABITCONF’s HODL edition sets out to bring together, in one place, the people building the ideas, technologies and adoption cases that could shape the next decade.
“This year’s conference stands out for bringing together key names shaping the future of Bitcoin – a major moment in the story of this asset, for those who already understand it and for those who want to understand it in depth. This year we want Buenos Aires to hear from the people thinking about, building, defending, and bringing Bitcoin to the world, and using AI for real-world use cases and payments,” said Rodolfo Andragnes, founder and organizer of LABITCONF.
International and local speakers
A few of the voices reflecting LABITCONF 2026’s international and wide-ranging lineup:
Saifedean Ammous — Economist and author of The Bitcoin Standard, one of the most influential books on Bitcoin’s monetary thesis. This will mark his first visit to South America.
Giovanni Santostasi — Physicist and neuroscientist, creator of the Bitcoin Power Law Theory, a model that analyzes Bitcoin’s evolution as a long-term network phenomenon through power laws.
David Zell — Co-founder and President of the Bitcoin Policy Institute, one of the leading think tanks bringing Bitcoin research and policy proposals into Washington’s political debate.
Giacomo Zucco — President of Plan ₿ Network and one of Europe’s most recognized voices in Bitcoin education, privacy, and culture.
Raymond “Ray” Nasser — Brazil Director at Nonco, a leading institutional OTC firm for Bitcoin and crypto.
Graeme Moore — CSO of Project Eleven, a company focused on post-quantum infrastructure for digital assets. His talk will bring one of the most sensitive technological debates for Bitcoin’s future security to the stage.
Jeremy Almond — Co-founder and CEO of Paystand, a B2B payments network built on blockchain infrastructure that reaches more than a million companies. He represents the intersection of Bitcoin, fintech, and the productive economy.
Gabriel Campa — Head of Digital Assets at Towerbank, one of the most crypto-friendly banks in Latin America, headquartered in Panama.
Among the local figures who will take part are Sebastián Serrano, CEO of Ripio; Borja Martel Seward, CEO of Roxom; Andrés Ondarra, GM of Nexo Argentina; Julián Colombo, Director for South America at Bitso; Manuel Beaudroit, CEO of Belo; and Daniel Rabinovich, COO of Mercado Libre — along with Bitcoin mining executives, economists, and government representatives to be announced soon.
On Bitcoin’s standing as the most profitable asset in history, personal finance, and market projections, the program will include talks by well-known analysts and investors such as Juan Rodríguez (Papa Bitcoin), Agustín Natoli (Joven Inversor), and Norberto Giudice (CriptoNorber). Economist Iván Carrino will also take part, to discuss the government’s economic policies.
The event will also feature the leading voices in Spanish-language Bitcoin podcasting, including Lunaticoin, Lorena Ortiz, Andrés BTC, Alberto Mera, Adrian Treviño, and Miss Bitcoin — together with authors such as Saifedean himself, Adrian Bernabeu, Ariel Aguilar, and Ivan Kaleja, alongside representatives from the NGOs Bitcoin Argentina and La Cripta, who will help attendees understand the culture, self-custody, and debates shaping the Spanish-speaking ecosystem.
On the artificial intelligence front, speakers will include Ramiro Marra, politician and CEO of Bull Market, who will reflect on AI in trading, as well as Santiago Siri, Maximiliano Firtman, Ana Ojeda (criptolawyer), Malena Martín, and others exploring new technological frontiers — along with lawmakers Martin Yeza and Dario Nieto, who are working on the application of AI within the state.
They will be joined by international developers such as Sergio D. Lerner and Chris Guida, as well as leading voices in circular economies, including Román Martínez, co-founder of Bitcoin Beach (the first circular economy and the inspiration behind El Salvador’s national Bitcoin adoption); Alexandra Navarro, of Paystand, one of the largest contributors to these kinds of projects; and representatives from Bolivia, Ecuador, Brazil, Venezuela, Cuba, Chile, and Uruguay leading organizations that support vulnerable communities and entrepreneurs.
Five stages
The speaker and talk selection will cover Bitcoin, Blockchain and AI across five stages, each geared toward a different audience:
ABC: Where it all begins
The stage for those who want to understand the ecosystem from the ground up, in a clear and accessible way, with no prior knowledge required.
ORANGE PILL: When you realize Bitcoin is much more than technology.
The space for exploring the ideas and values around Bitcoin, aimed at bitcoiners, thinkers, activists, and anyone who is already orange-pilled or wants to understand the broader concept encompassing money, freedom, sovereignty, economics, philosophy, and a shift in the global paradigm.
VISION: What ‘s next starts here.
The place for those looking beyond the present to understand the technologies shaping the future — whether they’re founders, OGs, early adopters, innovators, or technologists.
WORKSHOP / CODERS: Where ideas become code.
A hands-on development track designed for learning, sharing technical knowledge, and connecting with builders, developers, hackers, founders, programmers, and creators.
VIP — BUSINESS: Where ideas become opportunities.
An exclusive area within the VIP section, available to Business and Experience ticket holders, offering content and meetings focused on business, investment, and networking opportunities with the people making decisions and building within the industry.
HODL: a long-term view
This year’s LABITCONF concept, HODL, works both as a slogan and as an editorial lens. It refers not just to holding Bitcoin, but to maintaining a long-term view amid market noise: understanding what endures, what is changing, and who is building the next layers of the ecosystem.
With that focus, the goal is to offer a broad perspective: Bitcoin as money and a store of value, but also as blockchain technology, infrastructure, public policy, a tool for inclusion, and a response to the changes brought by AI. For that reason, the conference will bring together introductory content, philosophy, forward-looking perspectives, hands-on workshops, and executive gatherings.
About LABITCONF
LABITCONF (Latin American Bitcoin & Blockchain Conference) is the oldest Bitcoin & Blockchain conference in the world and the most prestigious in Latin America. Since 2013, it has brought together global leaders, developers, companies, communities, and users each year to discuss the present and future of money and decentralized technologies.
More information and tickets: LABITCONF.com
PRESS CONTACT
Gina Giraldo | +54 9 11 2469 1507
Bárbara Distéfano | +54 9 11 2394 4543
prensa@labitconf.com
This post LABITCONF 2026 brings together global leaders shaping the future of Bitcoin in Buenos Aires first appeared on BitcoinWorld.
his year’s HODL edition of LABITCONF looks beyond the local moment, bringing together the people building ideas, technologies and the adoption cases of Bitcoin, Blockchain and AI that could define the next decade.
Buenos Aires, October 1, 2026 — LABITCONF will hold its 14th edition on Friday, October 30 and Saturday, October 31 at BAFerial (formerly Costa Salguero), as part of Tecweek. Once again, the event will turn Buenos Aires into a meeting point for Latin America and the world’s Bitcoin and Blockchain community and its integration with AI.
With more than 150 speakers and 5 stages, this edition – under the theme HODL – is built not only around voices analyzing the local landscape, but above all around what they bring to the global conversations shaping the ecosystem.
The program will feature authors who changed the way people understand Bitcoin, scientists working to model its evolution, government officials, developers of critical infrastructure, entrepreneurs connecting it to the real economy, and community leaders who have shown that adoption can start from the ground up, with everyday citizens.
Bitcoin is going through a defining moment: it’s establishing itself as a global assets, entering the agendas of companies and governments, coexisting with the rapid advance of AI, and facing new debates over scalability, privacy and security. Against that backdrop, LABITCONF’s HODL edition sets out to bring together, in one place, the people building the ideas, technologies and adoption cases that could shape the next decade.
“This year’s conference stands out for bringing together key names shaping the future of Bitcoin – a major moment in the story of this asset, for those who already understand it and for those who want to understand it in depth. This year we want Buenos Aires to hear from the people thinking about, building, defending, and bringing Bitcoin to the world, and using AI for real-world use cases and payments,” said Rodolfo Andragnes, founder and organizer of LABITCONF.
International and local speakers
A few of the voices reflecting LABITCONF 2026’s international and wide-ranging lineup:
Saifedean Ammous — Economist and author of The Bitcoin Standard, one of the most influential books on Bitcoin’s monetary thesis. This will mark his first visit to South America.
Giovanni Santostasi — Physicist and neuroscientist, creator of the Bitcoin Power Law Theory, a model that analyzes Bitcoin’s evolution as a long-term network phenomenon through power laws.
David Zell — Co-founder and President of the Bitcoin Policy Institute, one of the leading think tanks bringing Bitcoin research and policy proposals into Washington’s political debate.
Giacomo Zucco — President of Plan ₿ Network and one of Europe’s most recognized voices in Bitcoin education, privacy, and culture.
Raymond “Ray” Nasser — Brazil Director at Nonco, a leading institutional OTC firm for Bitcoin and crypto.
Graeme Moore — CSO of Project Eleven, a company focused on post-quantum infrastructure for digital assets. His talk will bring one of the most sensitive technological debates for Bitcoin’s future security to the stage.
Jeremy Almond — Co-founder and CEO of Paystand, a B2B payments network built on blockchain infrastructure that reaches more than a million companies. He represents the intersection of Bitcoin, fintech, and the productive economy.
Gabriel Campa — Head of Digital Assets at Towerbank, one of the most crypto-friendly banks in Latin America, headquartered in Panama.
Among the local figures who will take part are Sebastián Serrano, CEO of Ripio; Borja Martel Seward, CEO of Roxom; Andrés Ondarra, GM of Nexo Argentina; Julián Colombo, Director for South America at Bitso; Manuel Beaudroit, CEO of Belo; and Daniel Rabinovich, COO of Mercado Libre — along with Bitcoin mining executives, economists, and government representatives to be announced soon.
On Bitcoin’s standing as the most profitable asset in history, personal finance, and market projections, the program will include talks by well-known analysts and investors such as Juan Rodríguez (Papa Bitcoin), Agustín Natoli (Joven Inversor), and Norberto Giudice (CriptoNorber). Economist Iván Carrino will also take part, to discuss the government’s economic policies.
The event will also feature the leading voices in Spanish-language Bitcoin podcasting, including Lunaticoin, Lorena Ortiz, Andrés BTC, Alberto Mera, Adrian Treviño, and Miss Bitcoin — together with authors such as Saifedean himself, Adrian Bernabeu, Ariel Aguilar, and Ivan Kaleja, alongside representatives from the NGOs Bitcoin Argentina and La Cripta, who will help attendees understand the culture, self-custody, and debates shaping the Spanish-speaking ecosystem.
On the artificial intelligence front, speakers will include Ramiro Marra, politician and CEO of Bull Market, who will reflect on AI in trading, as well as Santiago Siri, Maximiliano Firtman, Ana Ojeda (criptolawyer), Malena Martín, and others exploring new technological frontiers — along with lawmakers Martin Yeza and Dario Nieto, who are working on the application of AI within the state.
They will be joined by international developers such as Sergio D. Lerner and Chris Guida, as well as leading voices in circular economies, including Román Martínez, co-founder of Bitcoin Beach (the first circular economy and the inspiration behind El Salvador’s national Bitcoin adoption); Alexandra Navarro, of Paystand, one of the largest contributors to these kinds of projects; and representatives from Bolivia, Ecuador, Brazil, Venezuela, Cuba, Chile, and Uruguay leading organizations that support vulnerable communities and entrepreneurs.
Five stages
The speaker and talk selection will cover Bitcoin, Blockchain and AI across five stages, each geared toward a different audience:
ABC: Where it all begins
The stage for those who want to understand the ecosystem from the ground up, in a clear and accessible way, with no prior knowledge required.
ORANGE PILL: When you realize Bitcoin is much more than technology.
The space for exploring the ideas and values around Bitcoin, aimed at bitcoiners, thinkers, activists, and anyone who is already orange-pilled or wants to understand the broader concept encompassing money, freedom, sovereignty, economics, philosophy, and a shift in the global paradigm.
VISION: What ‘s next starts here.
The place for those looking beyond the present to understand the technologies shaping the future — whether they’re founders, OGs, early adopters, innovators, or technologists.
WORKSHOP / CODERS: Where ideas become code.
A hands-on development track designed for learning, sharing technical knowledge, and connecting with builders, developers, hackers, founders, programmers, and creators.
VIP — BUSINESS: Where ideas become opportunities.
An exclusive area within the VIP section, available to Business and Experience ticket holders, offering content and meetings focused on business, investment, and networking opportunities with the people making decisions and building within the industry.
HODL: a long-term view
This year’s LABITCONF concept, HODL, works both as a slogan and as an editorial lens. It refers not just to holding Bitcoin, but to maintaining a long-term view amid market noise: understanding what endures, what is changing, and who is building the next layers of the ecosystem.
With that focus, the goal is to offer a broad perspective: Bitcoin as money and a store of value, but also as blockchain technology, infrastructure, public policy, a tool for inclusion, and a response to the changes brought by AI. For that reason, the conference will bring together introductory content, philosophy, forward-looking perspectives, hands-on workshops, and executive gatherings.
About LABITCONF
LABITCONF (Latin American Bitcoin & Blockchain Conference) is the oldest Bitcoin & Blockchain conference in the world and the most prestigious in Latin America. Since 2013, it has brought together global leaders, developers, companies, communities, and users each year to discuss the present and future of money and decentralized technologies.
More information and tickets: LABITCONF.com
PRESS CONTACT
Gina Giraldo | +54 9 11 2469 1507
Bárbara Distéfano | +54 9 11 2394 4543
prensa@labitconf.com
This post LABITCONF 2026 brings together global leaders shaping the future of Bitcoin in Buenos Aires first appeared on BitcoinWorld.
353
·
--

Article
See translation
Stablecoin Remittances Cost 84% Less, Payout Rates VaryBitcoinWorldStablecoin Remittances Cost 84% Less, Payout Rates Vary
A $200 remittance sent through stablecoin-funded rails cost a median of $2 during the third quarter of 2026, against $12.72 for a traditional transfer benchmarked to World Bank data, according to a quarterly report from stablecoin payments network Borderless.xyz. The comparison, first detailed by Crypto.news, puts the cost gap at roughly 84%.
Borderless.xyz’s Q3 2026 report found stablecoin-funded remittances cost a median of 1% — about $2 per $200 sent — versus 6.36%, or $12.72, for the traditional benchmark. Payout completion rates ranged from 73% in Costa Rica to 98.6% in Mexico, showing that savings and speed do not guarantee uniform reliability.
The headline number rests on two datasets from different periods. Borderless’s 1% figure is a Q3 2026 median, while the 6.36% traditional cost comes from the World Bank’s Remittance Prices Worldwide report for the third quarter of 2025. The World Bank independently confirms the 6.36% figure, but describes it as an average — not a median — and the two sets do not cover identical routes in the same period.
Key facts
A $200 stablecoin-funded remittance cost $2 at the median in Q3 2026, versus $12.72 for the traditional benchmark — a calculated 84.3% reduction.
Regional gaps held: Sub-Saharan Africa showed 2.9% for stablecoin-funded transfers against 8.46% traditional, while Latin America showed 1.25% against 5.64%.
A $10,000 stablecoin-funded transfer to the eurozone cost as little as $26 through the cheapest provider, against $135–$150 for a traditional bank wire.
Payout completion ranged from 98.6% on Mexico’s SPEI network and 97.8% on Brazil’s PIX to 79% on Colombia’s PSE and 73% on Costa Rica’s SINPE.
Borderless’s earlier Q2 research, reported by Cointelegraph, tracked 260 corridors across 108 countries and found that choosing the median provider over the best route cost an extra $2,330 per $1 million transferred.
Savings and speed, but uneven completion
Borderless recorded median payouts into recipients’ local bank accounts of two minutes on Brazil’s PIX and Colombia’s PSE, and three minutes on Mexico’s SPEI. Its SWIFT comparison lists next-business-day settlement as typical, with the slowest 10% of transfers taking three business days.
Completion rates were less consistent. The spread between Mexico’s 98.6% and Costa Rica’s 73% is 25.6 percentage points. Those percentages describe the report’s payment sample, not an independently established performance record for every transaction on those domestic networks.
For business payments, the report cites a $10,000 stablecoin-funded transfer to the eurozone at as low as $26 with the cheapest provider. A separate $52 figure covers the median provider across all corridors. The traditional comparison of $135 to $150 includes transfer fees and an assumed 1% foreign-exchange margin — $100 of that on a $10,000 payment from the currency-conversion assumption alone. The $26 and $52 figures describe different geographic samples.
The same report also separated coverage from actual use. Borderless listed 131 local payment rails across 70 countries, while completed deliveries during the quarter used 22 payment schemes. The company frames its numbers as network-level observations, with any individual payment’s price set by its corridor, size and provider.
Why it matters
The report lands as stablecoin payment activity keeps expanding while the sector’s overall market capitalization has grown relatively flat this year. Cointelegraph reported that Standard Chartered highlighted rising transaction volumes and now expects the market to reach $2 trillion by 2030 — two years later than its previous forecast. For senders in high-cost corridors, the practical question is no longer whether stablecoin rails are cheaper than bank wires, but whether a given provider can complete the payment at all.
Cointelegraph’s coverage of the same Borderless report frames the findings as reinforcing cross-border payments as a leading use case for digital dollars. The two outlets present the same core figures; the reliability data is where the story gets more textured, since a cheap transfer that fails to land carries its own cost.
What to watch
Borderless’s next benchmark is will show whether the completion-rate spread narrows as more local rails are put into active use — its Q2 methodology defined total delivery cost as payout pricing against a reference midpoint plus recorded payment-network fees and local taxes. Watch also whether World Bank data for Q3 2026, once published, narrows the period gap that currently separates the two cost figures.
Frequently Asked Questions
How much cheaper are stablecoin remittances than traditional transfers?
Borderless.xyz’s third-quarter 2026 report put the median stablecoin-funded cost at 1%, or $2 on a $200 transfer, against 6.36%, or $12.72, for traditional remittances — a gap of roughly 84%. The figures compare stablecoin pricing from Q3 2026 with World Bank data from Q3 2025.
Why do stablecoin payout completion rates differ so much by country?
The report lists completion rates of 98.6% for Mexico’s SPEI, 97.8% for Brazil’s PIX, 79% for Colombia’s PSE, and 73% for Costa Rica’s SINPE. Borderless presents these as observations from its payment sample rather than independently verified performance measures for every transaction on each domestic network.
Do the World Bank figures used in the comparison cover the same period?
No. Borderless’s 1% figure is a Q3 2026 median, while the 6.36% traditional benchmark comes from the World Bank’s Remittance Prices Worldwide report for Q3 2025. The World Bank independently confirms the 6.36% figure but identifies it as an average rather than a median.
What do stablecoin business payments cost for large transfers?
According to the report, a $10,000 stablecoin-funded transfer to the eurozone cost as little as $26 through the lowest-cost provider, compared with a traditional bank wire of $135 to $150 that includes transfer fees and an assumed 1% foreign-exchange margin.
This post Stablecoin Remittances Cost 84% Less, Payout Rates Vary first appeared on BitcoinWorld.
Stablecoin Remittances Cost 84% Less, Payout Rates Vary
BitcoinWorldStablecoin Remittances Cost 84% Less, Payout Rates Vary
A $200 remittance sent through stablecoin-funded rails cost a median of $2 during the third quarter of 2026, against $12.72 for a traditional transfer benchmarked to World Bank data, according to a quarterly report from stablecoin payments network Borderless.xyz. The comparison, first detailed by Crypto.news, puts the cost gap at roughly 84%.
Borderless.xyz’s Q3 2026 report found stablecoin-funded remittances cost a median of 1% — about $2 per $200 sent — versus 6.36%, or $12.72, for the traditional benchmark. Payout completion rates ranged from 73% in Costa Rica to 98.6% in Mexico, showing that savings and speed do not guarantee uniform reliability.
The headline number rests on two datasets from different periods. Borderless’s 1% figure is a Q3 2026 median, while the 6.36% traditional cost comes from the World Bank’s Remittance Prices Worldwide report for the third quarter of 2025. The World Bank independently confirms the 6.36% figure, but describes it as an average — not a median — and the two sets do not cover identical routes in the same period.
Key facts
A $200 stablecoin-funded remittance cost $2 at the median in Q3 2026, versus $12.72 for the traditional benchmark — a calculated 84.3% reduction.
Regional gaps held: Sub-Saharan Africa showed 2.9% for stablecoin-funded transfers against 8.46% traditional, while Latin America showed 1.25% against 5.64%.
A $10,000 stablecoin-funded transfer to the eurozone cost as little as $26 through the cheapest provider, against $135–$150 for a traditional bank wire.
Payout completion ranged from 98.6% on Mexico’s SPEI network and 97.8% on Brazil’s PIX to 79% on Colombia’s PSE and 73% on Costa Rica’s SINPE.
Borderless’s earlier Q2 research, reported by Cointelegraph, tracked 260 corridors across 108 countries and found that choosing the median provider over the best route cost an extra $2,330 per $1 million transferred.
Savings and speed, but uneven completion
Borderless recorded median payouts into recipients’ local bank accounts of two minutes on Brazil’s PIX and Colombia’s PSE, and three minutes on Mexico’s SPEI. Its SWIFT comparison lists next-business-day settlement as typical, with the slowest 10% of transfers taking three business days.
Completion rates were less consistent. The spread between Mexico’s 98.6% and Costa Rica’s 73% is 25.6 percentage points. Those percentages describe the report’s payment sample, not an independently established performance record for every transaction on those domestic networks.
For business payments, the report cites a $10,000 stablecoin-funded transfer to the eurozone at as low as $26 with the cheapest provider. A separate $52 figure covers the median provider across all corridors. The traditional comparison of $135 to $150 includes transfer fees and an assumed 1% foreign-exchange margin — $100 of that on a $10,000 payment from the currency-conversion assumption alone. The $26 and $52 figures describe different geographic samples.
The same report also separated coverage from actual use. Borderless listed 131 local payment rails across 70 countries, while completed deliveries during the quarter used 22 payment schemes. The company frames its numbers as network-level observations, with any individual payment’s price set by its corridor, size and provider.
Why it matters
The report lands as stablecoin payment activity keeps expanding while the sector’s overall market capitalization has grown relatively flat this year. Cointelegraph reported that Standard Chartered highlighted rising transaction volumes and now expects the market to reach $2 trillion by 2030 — two years later than its previous forecast. For senders in high-cost corridors, the practical question is no longer whether stablecoin rails are cheaper than bank wires, but whether a given provider can complete the payment at all.
Cointelegraph’s coverage of the same Borderless report frames the findings as reinforcing cross-border payments as a leading use case for digital dollars. The two outlets present the same core figures; the reliability data is where the story gets more textured, since a cheap transfer that fails to land carries its own cost.
What to watch
Borderless’s next benchmark is will show whether the completion-rate spread narrows as more local rails are put into active use — its Q2 methodology defined total delivery cost as payout pricing against a reference midpoint plus recorded payment-network fees and local taxes. Watch also whether World Bank data for Q3 2026, once published, narrows the period gap that currently separates the two cost figures.
Frequently Asked Questions
How much cheaper are stablecoin remittances than traditional transfers?
Borderless.xyz’s third-quarter 2026 report put the median stablecoin-funded cost at 1%, or $2 on a $200 transfer, against 6.36%, or $12.72, for traditional remittances — a gap of roughly 84%. The figures compare stablecoin pricing from Q3 2026 with World Bank data from Q3 2025.
Why do stablecoin payout completion rates differ so much by country?
The report lists completion rates of 98.6% for Mexico’s SPEI, 97.8% for Brazil’s PIX, 79% for Colombia’s PSE, and 73% for Costa Rica’s SINPE. Borderless presents these as observations from its payment sample rather than independently verified performance measures for every transaction on each domestic network.
Do the World Bank figures used in the comparison cover the same period?
No. Borderless’s 1% figure is a Q3 2026 median, while the 6.36% traditional benchmark comes from the World Bank’s Remittance Prices Worldwide report for Q3 2025. The World Bank independently confirms the 6.36% figure but identifies it as an average rather than a median.
What do stablecoin business payments cost for large transfers?
According to the report, a $10,000 stablecoin-funded transfer to the eurozone cost as little as $26 through the lowest-cost provider, compared with a traditional bank wire of $135 to $150 that includes transfer fees and an assumed 1% foreign-exchange margin.
This post Stablecoin Remittances Cost 84% Less, Payout Rates Vary first appeared on BitcoinWorld.
A $200 remittance sent through stablecoin-funded rails cost a median of $2 during the third quarter of 2026, against $12.72 for a traditional transfer benchmarked to World Bank data, according to a quarterly report from stablecoin payments network Borderless.xyz. The comparison, first detailed by Crypto.news, puts the cost gap at roughly 84%.
Borderless.xyz’s Q3 2026 report found stablecoin-funded remittances cost a median of 1% — about $2 per $200 sent — versus 6.36%, or $12.72, for the traditional benchmark. Payout completion rates ranged from 73% in Costa Rica to 98.6% in Mexico, showing that savings and speed do not guarantee uniform reliability.
The headline number rests on two datasets from different periods. Borderless’s 1% figure is a Q3 2026 median, while the 6.36% traditional cost comes from the World Bank’s Remittance Prices Worldwide report for the third quarter of 2025. The World Bank independently confirms the 6.36% figure, but describes it as an average — not a median — and the two sets do not cover identical routes in the same period.
Key facts
A $200 stablecoin-funded remittance cost $2 at the median in Q3 2026, versus $12.72 for the traditional benchmark — a calculated 84.3% reduction.
Regional gaps held: Sub-Saharan Africa showed 2.9% for stablecoin-funded transfers against 8.46% traditional, while Latin America showed 1.25% against 5.64%.
A $10,000 stablecoin-funded transfer to the eurozone cost as little as $26 through the cheapest provider, against $135–$150 for a traditional bank wire.
Payout completion ranged from 98.6% on Mexico’s SPEI network and 97.8% on Brazil’s PIX to 79% on Colombia’s PSE and 73% on Costa Rica’s SINPE.
Borderless’s earlier Q2 research, reported by Cointelegraph, tracked 260 corridors across 108 countries and found that choosing the median provider over the best route cost an extra $2,330 per $1 million transferred.
Savings and speed, but uneven completion
Borderless recorded median payouts into recipients’ local bank accounts of two minutes on Brazil’s PIX and Colombia’s PSE, and three minutes on Mexico’s SPEI. Its SWIFT comparison lists next-business-day settlement as typical, with the slowest 10% of transfers taking three business days.
Completion rates were less consistent. The spread between Mexico’s 98.6% and Costa Rica’s 73% is 25.6 percentage points. Those percentages describe the report’s payment sample, not an independently established performance record for every transaction on those domestic networks.
For business payments, the report cites a $10,000 stablecoin-funded transfer to the eurozone at as low as $26 with the cheapest provider. A separate $52 figure covers the median provider across all corridors. The traditional comparison of $135 to $150 includes transfer fees and an assumed 1% foreign-exchange margin — $100 of that on a $10,000 payment from the currency-conversion assumption alone. The $26 and $52 figures describe different geographic samples.
The same report also separated coverage from actual use. Borderless listed 131 local payment rails across 70 countries, while completed deliveries during the quarter used 22 payment schemes. The company frames its numbers as network-level observations, with any individual payment’s price set by its corridor, size and provider.
Why it matters
The report lands as stablecoin payment activity keeps expanding while the sector’s overall market capitalization has grown relatively flat this year. Cointelegraph reported that Standard Chartered highlighted rising transaction volumes and now expects the market to reach $2 trillion by 2030 — two years later than its previous forecast. For senders in high-cost corridors, the practical question is no longer whether stablecoin rails are cheaper than bank wires, but whether a given provider can complete the payment at all.
Cointelegraph’s coverage of the same Borderless report frames the findings as reinforcing cross-border payments as a leading use case for digital dollars. The two outlets present the same core figures; the reliability data is where the story gets more textured, since a cheap transfer that fails to land carries its own cost.
What to watch
Borderless’s next benchmark is will show whether the completion-rate spread narrows as more local rails are put into active use — its Q2 methodology defined total delivery cost as payout pricing against a reference midpoint plus recorded payment-network fees and local taxes. Watch also whether World Bank data for Q3 2026, once published, narrows the period gap that currently separates the two cost figures.
Frequently Asked Questions
How much cheaper are stablecoin remittances than traditional transfers?
Borderless.xyz’s third-quarter 2026 report put the median stablecoin-funded cost at 1%, or $2 on a $200 transfer, against 6.36%, or $12.72, for traditional remittances — a gap of roughly 84%. The figures compare stablecoin pricing from Q3 2026 with World Bank data from Q3 2025.
Why do stablecoin payout completion rates differ so much by country?
The report lists completion rates of 98.6% for Mexico’s SPEI, 97.8% for Brazil’s PIX, 79% for Colombia’s PSE, and 73% for Costa Rica’s SINPE. Borderless presents these as observations from its payment sample rather than independently verified performance measures for every transaction on each domestic network.
Do the World Bank figures used in the comparison cover the same period?
No. Borderless’s 1% figure is a Q3 2026 median, while the 6.36% traditional benchmark comes from the World Bank’s Remittance Prices Worldwide report for Q3 2025. The World Bank independently confirms the 6.36% figure but identifies it as an average rather than a median.
What do stablecoin business payments cost for large transfers?
According to the report, a $10,000 stablecoin-funded transfer to the eurozone cost as little as $26 through the lowest-cost provider, compared with a traditional bank wire of $135 to $150 that includes transfer fees and an assumed 1% foreign-exchange margin.
This post Stablecoin Remittances Cost 84% Less, Payout Rates Vary first appeared on BitcoinWorld.
270
Log in to explore more content
Join global crypto users on Binance Square
⚡️ Get latest and useful information about crypto.
💬 Trusted by the world’s largest crypto exchange.
👍 Discover real insights from verified creators.
Email / Phone number