
心如大魔王
44 Posts

心如大魔王
Report
Block User
“BTC周期观察员” “熊市猎人”
Occasional Trader
3.2 Years
20 Following
538 Followers
204 Liked
Posts
·
--
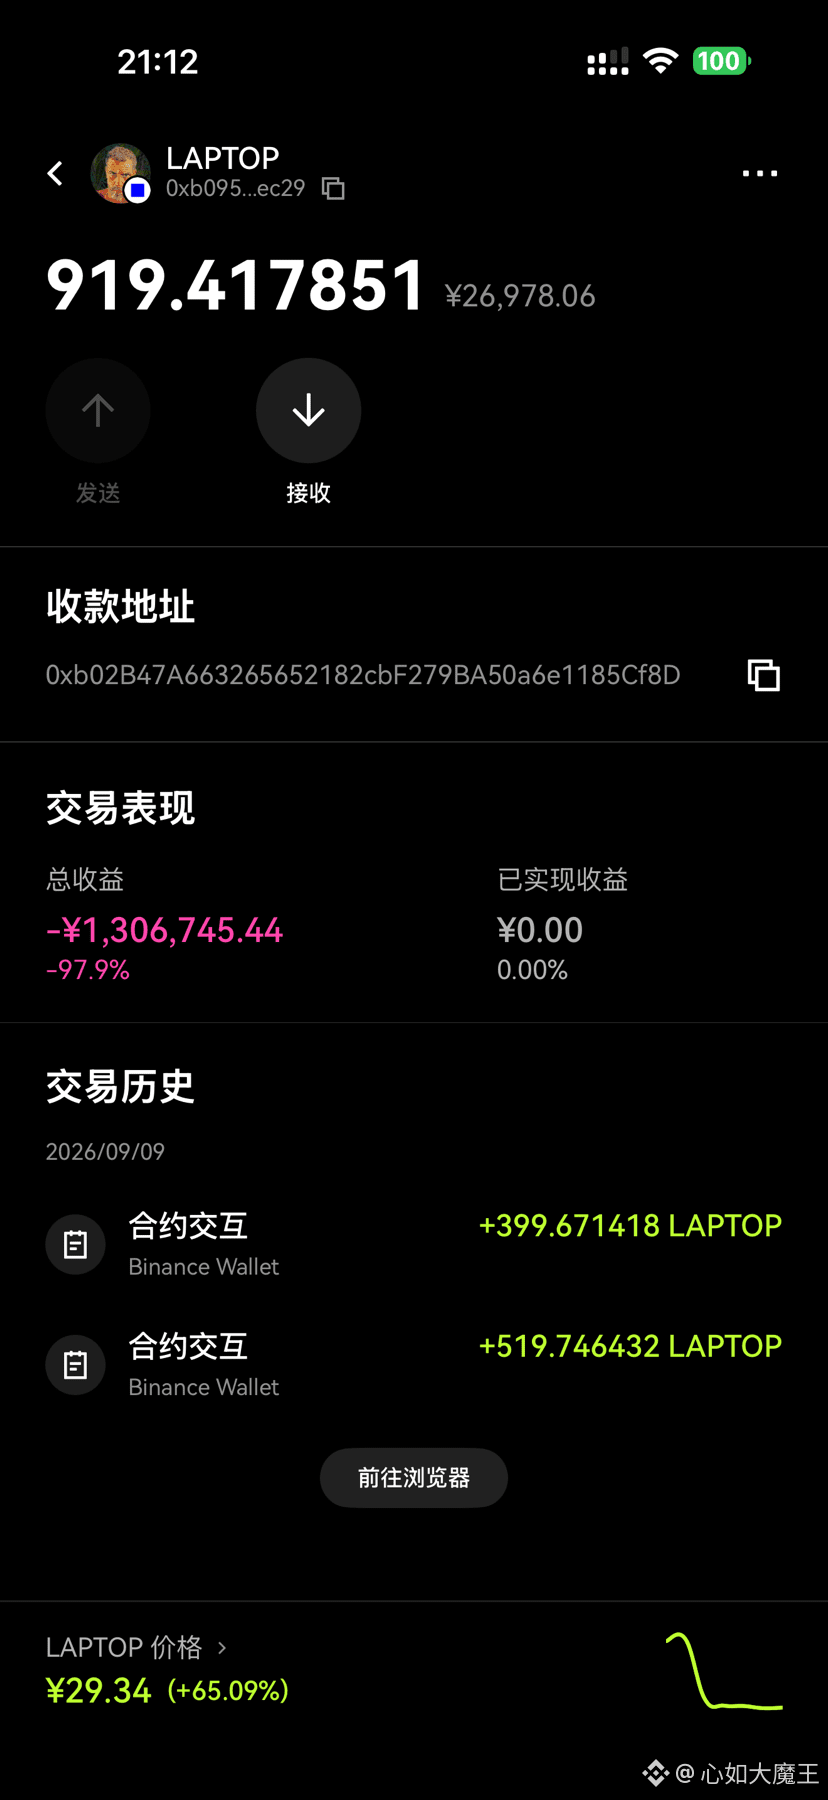
A talent spent 200,000 U to buy 919.4 units of Biden’s son coin at a price of 217.5, and then the LAPTOP dropped to 4.4. His 919 units of LAPTOP have lost 98% of their value.
In floating loss: 190,000.
Address: 0xb02B47A663265652182cbF279BA50a6e1185Cf8D
So funny—never trust junkies.
A talent spent 200,000 U to buy 919.4 units of Biden’s son coin at a price of 217.5, and then the LAPTOP dropped to 4.4. His 919 units of LAPTOP have lost 98% of their value.
In floating loss: 190,000.
Address: 0xb02B47A663265652182cbF279BA50a6e1185Cf8D
So funny—never trust junkies.
In floating loss: 190,000.
Address: 0xb02B47A663265652182cbF279BA50a6e1185Cf8D
So funny—never trust junkies.
2
2.1k
·
--
The opening market value is basically the ceiling in the crypto world
When the Trump coin was released, it was genuinely solid enough to let you earn dozens of times, even up to a hundred times
In comparison, the Trump coin can be considered extremely conscientious
Biden’s son is pure, unadulterated nonsense
The opening market value is basically the ceiling in the crypto world
When the Trump coin was released, it was genuinely solid enough to let you earn dozens of times, even up to a hundred times
In comparison, the Trump coin can be considered extremely conscientious
Biden’s son is pure, unadulterated nonsense
When the Trump coin was released, it was genuinely solid enough to let you earn dozens of times, even up to a hundred times
In comparison, the Trump coin can be considered extremely conscientious
Biden’s son is pure, unadulterated nonsense

4
1
1
2.8k
·
--
Is 82,285 a fake breakout?
I can’t be 100% certain, but if you’ve seen the previous posts: when it dumped at 8.15, if you entered and held on, then let’s bet on taking the first route together—take-profit at 73,000. Once it reaches that level, simultaneously go long again, with the stop-loss placed at 72,500. If it falls below that price, you must place a buy order at 69,000.
For those who are currently in cash and want to go short: if you want to short, wait patiently for 79,500 to appear. Set the stop-loss at 80,500, and take-profit is the same as above.
If the current price is chasing a short, and only on 8.4 it turns out to be the stage top, then you’ll likely be trapped for a long time.
In a bull market, shorting must be done cautiously. Don’t blindly chase shorts. Remember: traps are everywhere in the market. Conservative traders can just wait in place for the big crash and then buy the dip.
Many people might bottom-buy at 75,000. What I want to say is: if 82,000 is the top, then 70,000 is basically guaranteed to be reached. If 88,000 is the top, then yes, you can buy the dip at 75,000. But based on the current chart, 8.8 hasn’t appeared yet, so we can only trade as if 8.2 is the top.
If you buy the dip at 75,000, you’ll have to withstand at least a 5,000-point drop. And during the grinding period after the bottom forms, it will be very uncomfortable. I won’t make you a penny—I’ll only objectively analyze the chart and give you more reasonable advice.
If you think 7.5 is a dip-buy level, I support that too. Because the 7.3 dip-buy I gave you was to bet on 8.2 being the stage top. I bet on 8.4 and 8.8 as the stage tops.
One thing that doesn’t change: from 8.8 to 9.2, you must go short. That price range is required to short. Other prices are just so-so—I don’t recommend participating in short positions at all.
$BTC #比特币走势分析
Is 82,285 a fake breakout?
I can’t be 100% certain, but if you’ve seen the previous posts: when it dumped at 8.15, if you entered and held on, then let’s bet on taking the first route together—take-profit at 73,000. Once it reaches that level, simultaneously go long again, with the stop-loss placed at 72,500. If it falls below that price, you must place a buy order at 69,000.
For those who are currently in cash and want to go short: if you want to short, wait patiently for 79,500 to appear. Set the stop-loss at 80,500, and take-profit is the same as above.
If the current price is chasing a short, and only on 8.4 it turns out to be the stage top, then you’ll likely be trapped for a long time.
In a bull market, shorting must be done cautiously. Don’t blindly chase shorts. Remember: traps are everywhere in the market. Conservative traders can just wait in place for the big crash and then buy the dip.
Many people might bottom-buy at 75,000. What I want to say is: if 82,000 is the top, then 70,000 is basically guaranteed to be reached. If 88,000 is the top, then yes, you can buy the dip at 75,000. But based on the current chart, 8.8 hasn’t appeared yet, so we can only trade as if 8.2 is the top.
If you buy the dip at 75,000, you’ll have to withstand at least a 5,000-point drop. And during the grinding period after the bottom forms, it will be very uncomfortable. I won’t make you a penny—I’ll only objectively analyze the chart and give you more reasonable advice.
If you think 7.5 is a dip-buy level, I support that too. Because the 7.3 dip-buy I gave you was to bet on 8.2 being the stage top. I bet on 8.4 and 8.8 as the stage tops.
One thing that doesn’t change: from 8.8 to 9.2, you must go short. That price range is required to short. Other prices are just so-so—I don’t recommend participating in short positions at all.
$BTC #比特币走势分析
I can’t be 100% certain, but if you’ve seen the previous posts: when it dumped at 8.15, if you entered and held on, then let’s bet on taking the first route together—take-profit at 73,000. Once it reaches that level, simultaneously go long again, with the stop-loss placed at 72,500. If it falls below that price, you must place a buy order at 69,000.
For those who are currently in cash and want to go short: if you want to short, wait patiently for 79,500 to appear. Set the stop-loss at 80,500, and take-profit is the same as above.
If the current price is chasing a short, and only on 8.4 it turns out to be the stage top, then you’ll likely be trapped for a long time.
In a bull market, shorting must be done cautiously. Don’t blindly chase shorts. Remember: traps are everywhere in the market. Conservative traders can just wait in place for the big crash and then buy the dip.
Many people might bottom-buy at 75,000. What I want to say is: if 82,000 is the top, then 70,000 is basically guaranteed to be reached. If 88,000 is the top, then yes, you can buy the dip at 75,000. But based on the current chart, 8.8 hasn’t appeared yet, so we can only trade as if 8.2 is the top.
If you buy the dip at 75,000, you’ll have to withstand at least a 5,000-point drop. And during the grinding period after the bottom forms, it will be very uncomfortable. I won’t make you a penny—I’ll only objectively analyze the chart and give you more reasonable advice.
If you think 7.5 is a dip-buy level, I support that too. Because the 7.3 dip-buy I gave you was to bet on 8.2 being the stage top. I bet on 8.4 and 8.8 as the stage tops.
One thing that doesn’t change: from 8.8 to 9.2, you must go short. That price range is required to short. Other prices are just so-so—I don’t recommend participating in short positions at all.
$BTC #比特币走势分析
1
263
·
--
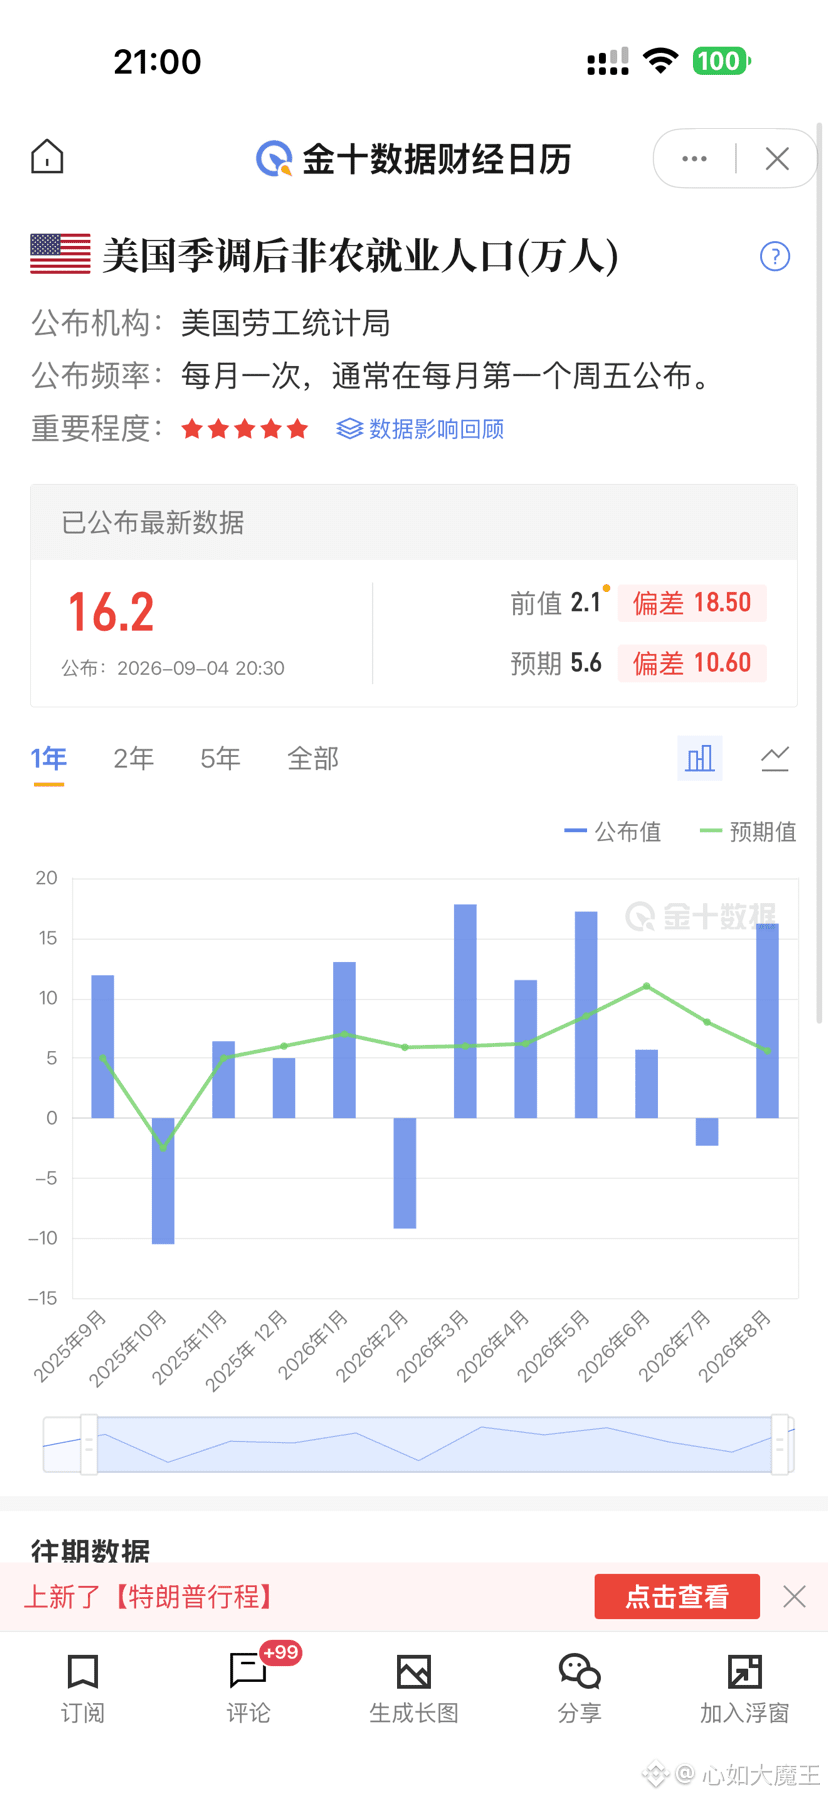
Non-Farm data is absolutely blowing out the charts—what a bizarre set of numbers. Taken at face value, it could even justify a rate hike.
Just quietly wait for 70k. If you choose to top out at 82k, the extreme downside minimum could be around 67k; under normal conditions, as long as it tops around 70k, you can go in and stack positions.
If 82k forms a staged top, you can short from the current price level. Set your stop loss at 82.5k.
If 82k is truly the phase top, by late September there’s a chance it drops to 70k. Then it will be a big-cow—main—market opportunity to get in.
After the first meaningful pullback and the big drop hits the target, remember to watch SOL’s price. If BTC returns to 70k and SOL is around 80, you can also enter a long. SOL is the priority recommendation—it should stay steady and double again to around 160–200.
Stay in cash and wait. You might miss some profits, but being in cash will never make you lose money. Low-frequency beats high-frequency trading. Most of the time, the market just hovers in the middle. What we’re doing is patiently waiting for a major drop or a major surge—not randomly going long or short.
#美国8月非农数据今日公布 #BTC走势分析
Non-Farm data is absolutely blowing out the charts—what a bizarre set of numbers. Taken at face value, it could even justify a rate hike.
Just quietly wait for 70k. If you choose to top out at 82k, the extreme downside minimum could be around 67k; under normal conditions, as long as it tops around 70k, you can go in and stack positions.
If 82k forms a staged top, you can short from the current price level. Set your stop loss at 82.5k.
If 82k is truly the phase top, by late September there’s a chance it drops to 70k. Then it will be a big-cow—main—market opportunity to get in.
After the first meaningful pullback and the big drop hits the target, remember to watch SOL’s price. If BTC returns to 70k and SOL is around 80, you can also enter a long. SOL is the priority recommendation—it should stay steady and double again to around 160–200.
Stay in cash and wait. You might miss some profits, but being in cash will never make you lose money. Low-frequency beats high-frequency trading. Most of the time, the market just hovers in the middle. What we’re doing is patiently waiting for a major drop or a major surge—not randomly going long or short.
#美国8月非农数据今日公布 #BTC走势分析
Just quietly wait for 70k. If you choose to top out at 82k, the extreme downside minimum could be around 67k; under normal conditions, as long as it tops around 70k, you can go in and stack positions.
If 82k forms a staged top, you can short from the current price level. Set your stop loss at 82.5k.
If 82k is truly the phase top, by late September there’s a chance it drops to 70k. Then it will be a big-cow—main—market opportunity to get in.
After the first meaningful pullback and the big drop hits the target, remember to watch SOL’s price. If BTC returns to 70k and SOL is around 80, you can also enter a long. SOL is the priority recommendation—it should stay steady and double again to around 160–200.
Stay in cash and wait. You might miss some profits, but being in cash will never make you lose money. Low-frequency beats high-frequency trading. Most of the time, the market just hovers in the middle. What we’re doing is patiently waiting for a major drop or a major surge—not randomly going long or short.
#美国8月非农数据今日公布 #BTC走势分析
1
1
1.8k
·
--
For those watching posts and chasing gains near 79,500, please make sure to use capital-protection/stop-loss. Around 8.2 there is still a bit of resistance. Tonight, there’s a higher likelihood of price moving in and out, repeatedly crossing back and forth.
Until a situation where there’s another squeeze/shortfall (a rerun of an empty squeeze) happens again, absolutely do not try to short. The logic is: we have already entered a bull market with confirmation beyond doubt, so short positions must be chosen very cautiously. It’s better to miss out on the profit from not shorting than to try to short the top in a bull market. In a bull market, once a short position gets stuck, there are almost no outcomes other than cutting the loss or getting liquidated.
After the target area is reached, I’ll post a reminder as soon as possible about what to do. Do not add to longs or shorts recklessly unless and until the price reaches the target. If a trader can’t even manage to stay in flat/no-position when needed, the ending won’t be good. I hope everyone becomes a low-frequency trader, not a high-frequency trader.
In the early stage of this bull market, the rhythm of this move has filled this bull cycle with imagination. 2027 will be a year of a big rally. This time, if ordinary people miss it again, then the entry cost for the bull market in 2032 will be extremely high. The current bear-market bottom can still appear around 5.7w, and you can also wait for consolidation around 8w. But the next bear bottom—no doubt—will likely be around 10w. By then, even if you buy at the bear bottom, your position cost will be very high…
I hope everyone holds the reins of this major bull-market opportunity with me. Only by capturing the rich profits of this bull market can we earn the entry ticket for 2032.
#BTC走势分析
For those watching posts and chasing gains near 79,500, please make sure to use capital-protection/stop-loss. Around 8.2 there is still a bit of resistance. Tonight, there’s a higher likelihood of price moving in and out, repeatedly crossing back and forth.
Until a situation where there’s another squeeze/shortfall (a rerun of an empty squeeze) happens again, absolutely do not try to short. The logic is: we have already entered a bull market with confirmation beyond doubt, so short positions must be chosen very cautiously. It’s better to miss out on the profit from not shorting than to try to short the top in a bull market. In a bull market, once a short position gets stuck, there are almost no outcomes other than cutting the loss or getting liquidated.
After the target area is reached, I’ll post a reminder as soon as possible about what to do. Do not add to longs or shorts recklessly unless and until the price reaches the target. If a trader can’t even manage to stay in flat/no-position when needed, the ending won’t be good. I hope everyone becomes a low-frequency trader, not a high-frequency trader.
In the early stage of this bull market, the rhythm of this move has filled this bull cycle with imagination. 2027 will be a year of a big rally. This time, if ordinary people miss it again, then the entry cost for the bull market in 2032 will be extremely high. The current bear-market bottom can still appear around 5.7w, and you can also wait for consolidation around 8w. But the next bear bottom—no doubt—will likely be around 10w. By then, even if you buy at the bear bottom, your position cost will be very high…
I hope everyone holds the reins of this major bull-market opportunity with me. Only by capturing the rich profits of this bull market can we earn the entry ticket for 2032.
#BTC走势分析
Until a situation where there’s another squeeze/shortfall (a rerun of an empty squeeze) happens again, absolutely do not try to short. The logic is: we have already entered a bull market with confirmation beyond doubt, so short positions must be chosen very cautiously. It’s better to miss out on the profit from not shorting than to try to short the top in a bull market. In a bull market, once a short position gets stuck, there are almost no outcomes other than cutting the loss or getting liquidated.
After the target area is reached, I’ll post a reminder as soon as possible about what to do. Do not add to longs or shorts recklessly unless and until the price reaches the target. If a trader can’t even manage to stay in flat/no-position when needed, the ending won’t be good. I hope everyone becomes a low-frequency trader, not a high-frequency trader.
In the early stage of this bull market, the rhythm of this move has filled this bull cycle with imagination. 2027 will be a year of a big rally. This time, if ordinary people miss it again, then the entry cost for the bull market in 2032 will be extremely high. The current bear-market bottom can still appear around 5.7w, and you can also wait for consolidation around 8w. But the next bear bottom—no doubt—will likely be around 10w. By then, even if you buy at the bear bottom, your position cost will be very high…
I hope everyone holds the reins of this major bull-market opportunity with me. Only by capturing the rich profits of this bull market can we earn the entry ticket for 2032.
#BTC走势分析
234
·
--
Bullish
Today's strong momentum breakout by the big pancake has pushed straight toward 80k. If you happened to have read my articles the past couple of days, then you must believe that at that time, even if you didn’t choose to go long, you definitely would not have gone short.
After consolidating at the high level for many days, another strong rally occurred. That means 81.5k is not the stage-top of this Bitcoin upswing. The early bullish phase of this cycle has seen a rise that can be said to be unprecedented.
If you don’t want to read a long article, just look here ⬇️
The current market still has most people going short. If you short at the current price of 79.5k, close your position and run as soon as possible. If you’re considering going short, cancel that idea immediately—shorting must wait and hold until 88k! The reason has been explained.
If you want to go long, you can try entering at the current price. Open a long at 79,500. The target prices are 82k, 84k, and 88k.
Once the price reaches these three levels, I will post to remind you whether to close the trade and take profit. When the target levels are reached, don’t forget to come to the plaza to check the latest analysis.
#美国初请失业金人数升至20.6万 #BTC走势分析
Today's strong momentum breakout by the big pancake has pushed straight toward 80k. If you happened to have read my articles the past couple of days, then you must believe that at that time, even if you didn’t choose to go long, you definitely would not have gone short.
After consolidating at the high level for many days, another strong rally occurred. That means 81.5k is not the stage-top of this Bitcoin upswing. The early bullish phase of this cycle has seen a rise that can be said to be unprecedented.
If you don’t want to read a long article, just look here ⬇️
The current market still has most people going short. If you short at the current price of 79.5k, close your position and run as soon as possible. If you’re considering going short, cancel that idea immediately—shorting must wait and hold until 88k! The reason has been explained.
If you want to go long, you can try entering at the current price. Open a long at 79,500. The target prices are 82k, 84k, and 88k.
Once the price reaches these three levels, I will post to remind you whether to close the trade and take profit. When the target levels are reached, don’t forget to come to the plaza to check the latest analysis.
#美国初请失业金人数升至20.6万 #BTC走势分析
After consolidating at the high level for many days, another strong rally occurred. That means 81.5k is not the stage-top of this Bitcoin upswing. The early bullish phase of this cycle has seen a rise that can be said to be unprecedented.
If you don’t want to read a long article, just look here ⬇️
The current market still has most people going short. If you short at the current price of 79.5k, close your position and run as soon as possible. If you’re considering going short, cancel that idea immediately—shorting must wait and hold until 88k! The reason has been explained.
If you want to go long, you can try entering at the current price. Open a long at 79,500. The target prices are 82k, 84k, and 88k.
Once the price reaches these three levels, I will post to remind you whether to close the trade and take profit. When the target levels are reached, don’t forget to come to the plaza to check the latest analysis.
#美国初请失业金人数升至20.6万 #BTC走势分析
2.5k
·
--
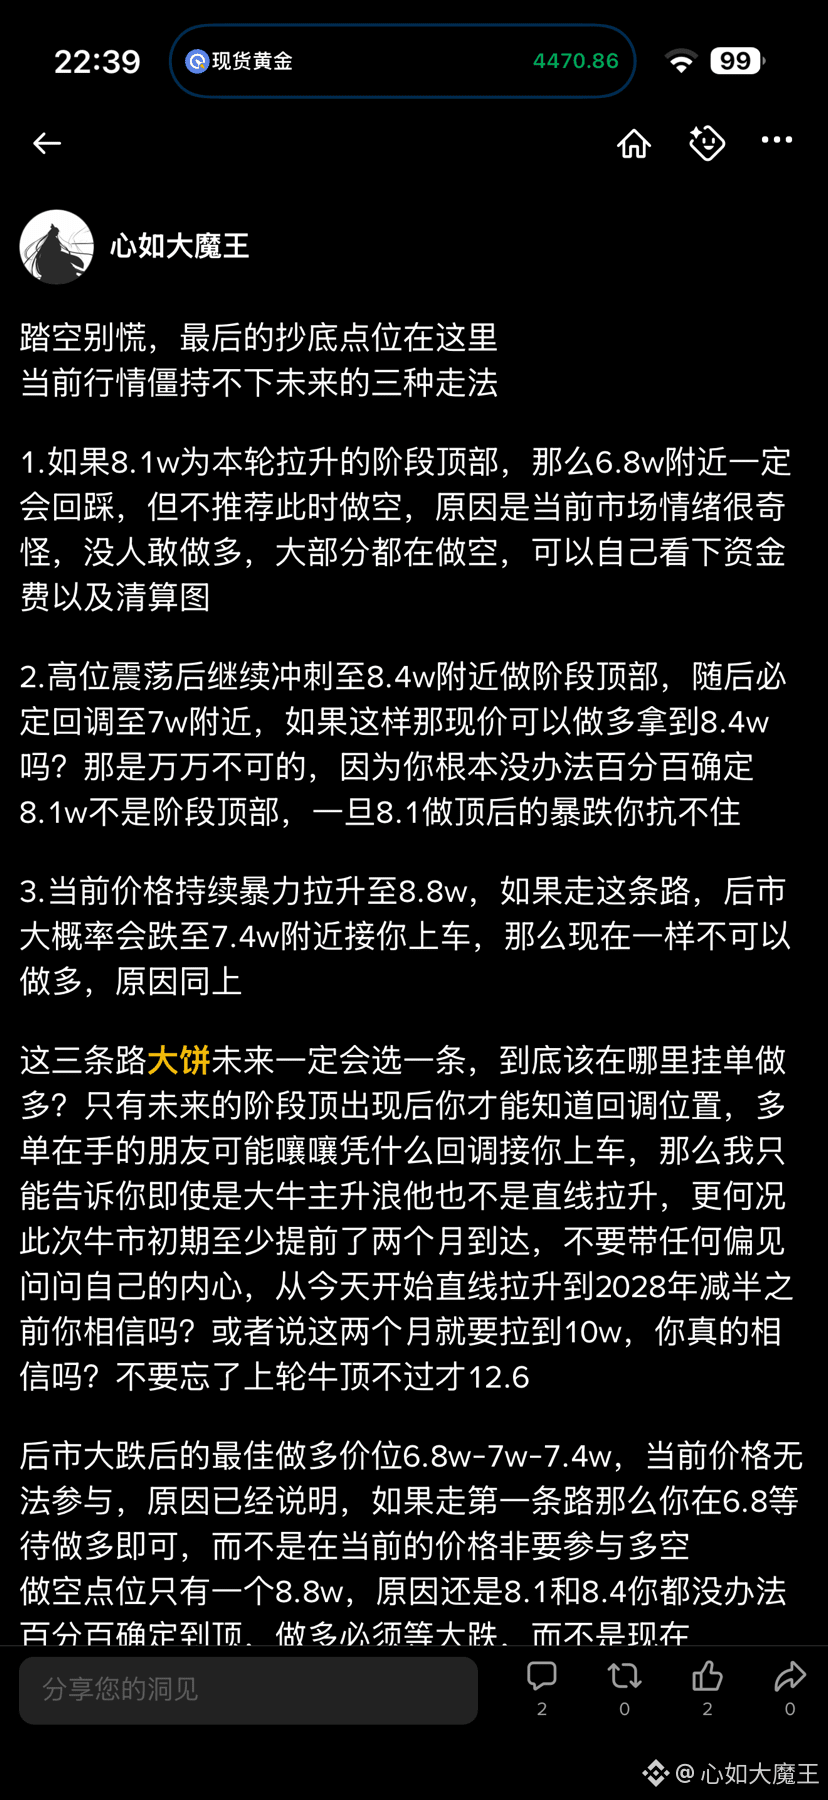
Don’t panic when you miss the move— the final bottom-picking entry is right here.
The current market is stuck; there are three possible ways it could play out in the future.
1. If 81k is the stage top of this round’s rally, then a pullback to around 68k is certain. But it’s not recommended to short here. The reason is that the market sentiment is really weird—nobody dares to go long. Most people are shorting. You can check the funding rates and the liquidation chart yourself.
2. After a period of range-bound consolidation at the high, the price pushes again toward around 84k to form the next stage top. Then it will inevitably pull back to around 70k. If that happens, can you go long at the current price and hold until 84k? Absolutely not. Because you can’t possibly be 100% sure that 81k is not the stage top. Once 81k tops and then crashes, you won’t be able to stomach it.
3. If the current price continues to surge violently to 88k, and if this is the path it takes, then most likely the future will drop to around 74k, where it will pick you up. But even now, you still shouldn’t go long. The reason is the same as above.
These three paths for BTC will definitely pick one in the future. So where should you place your long orders? Only after the future stage top is confirmed can you know the pullback level. Friends who already hold longs might ask, “Why do I get picked up on the pullback instead?” All I can say is: even in a bull market’s big breakout surge, it’s never a straight-line rally. And besides, this bull run started at least two months early. Don’t carry any bias—ask yourself honestly: starting from today, do you really believe it will surge in a straight line until the BTC halving in 2028? Or do you really believe it will run up to 100k within these two months? Don’t forget: the previous bull top was only 12.6.
The best long entry prices after a big drop are 68k—70k—74k. You can’t participate at the current price; the reasons have already been explained. If you choose the first path, then wait to go long at 68k—not force yourself to take part in longs/shorts at the current price.
There is only one short entry: 88k. The reason is still that you can’t be 100% sure about the top at 81k or 84k. Going long must wait for the big drop—not now.
The bull market is already here. Don’t hold any fantasies about breaking down below 57k. 57k is a price BTC will never go back to again, just like 1.5 back then. BTC’s cycle is unbreakable. History may not repeat exactly, but it will be strikingly similar.
#BTC走势分析
Don’t panic when you miss the move— the final bottom-picking entry is right here.
The current market is stuck; there are three possible ways it could play out in the future.
1. If 81k is the stage top of this round’s rally, then a pullback to around 68k is certain. But it’s not recommended to short here. The reason is that the market sentiment is really weird—nobody dares to go long. Most people are shorting. You can check the funding rates and the liquidation chart yourself.
2. After a period of range-bound consolidation at the high, the price pushes again toward around 84k to form the next stage top. Then it will inevitably pull back to around 70k. If that happens, can you go long at the current price and hold until 84k? Absolutely not. Because you can’t possibly be 100% sure that 81k is not the stage top. Once 81k tops and then crashes, you won’t be able to stomach it.
3. If the current price continues to surge violently to 88k, and if this is the path it takes, then most likely the future will drop to around 74k, where it will pick you up. But even now, you still shouldn’t go long. The reason is the same as above.
These three paths for BTC will definitely pick one in the future. So where should you place your long orders? Only after the future stage top is confirmed can you know the pullback level. Friends who already hold longs might ask, “Why do I get picked up on the pullback instead?” All I can say is: even in a bull market’s big breakout surge, it’s never a straight-line rally. And besides, this bull run started at least two months early. Don’t carry any bias—ask yourself honestly: starting from today, do you really believe it will surge in a straight line until the BTC halving in 2028? Or do you really believe it will run up to 100k within these two months? Don’t forget: the previous bull top was only 12.6.
The best long entry prices after a big drop are 68k—70k—74k. You can’t participate at the current price; the reasons have already been explained. If you choose the first path, then wait to go long at 68k—not force yourself to take part in longs/shorts at the current price.
There is only one short entry: 88k. The reason is still that you can’t be 100% sure about the top at 81k or 84k. Going long must wait for the big drop—not now.
The bull market is already here. Don’t hold any fantasies about breaking down below 57k. 57k is a price BTC will never go back to again, just like 1.5 back then. BTC’s cycle is unbreakable. History may not repeat exactly, but it will be strikingly similar.
#BTC走势分析
The current market is stuck; there are three possible ways it could play out in the future.
1. If 81k is the stage top of this round’s rally, then a pullback to around 68k is certain. But it’s not recommended to short here. The reason is that the market sentiment is really weird—nobody dares to go long. Most people are shorting. You can check the funding rates and the liquidation chart yourself.
2. After a period of range-bound consolidation at the high, the price pushes again toward around 84k to form the next stage top. Then it will inevitably pull back to around 70k. If that happens, can you go long at the current price and hold until 84k? Absolutely not. Because you can’t possibly be 100% sure that 81k is not the stage top. Once 81k tops and then crashes, you won’t be able to stomach it.
3. If the current price continues to surge violently to 88k, and if this is the path it takes, then most likely the future will drop to around 74k, where it will pick you up. But even now, you still shouldn’t go long. The reason is the same as above.
These three paths for BTC will definitely pick one in the future. So where should you place your long orders? Only after the future stage top is confirmed can you know the pullback level. Friends who already hold longs might ask, “Why do I get picked up on the pullback instead?” All I can say is: even in a bull market’s big breakout surge, it’s never a straight-line rally. And besides, this bull run started at least two months early. Don’t carry any bias—ask yourself honestly: starting from today, do you really believe it will surge in a straight line until the BTC halving in 2028? Or do you really believe it will run up to 100k within these two months? Don’t forget: the previous bull top was only 12.6.
The best long entry prices after a big drop are 68k—70k—74k. You can’t participate at the current price; the reasons have already been explained. If you choose the first path, then wait to go long at 68k—not force yourself to take part in longs/shorts at the current price.
There is only one short entry: 88k. The reason is still that you can’t be 100% sure about the top at 81k or 84k. Going long must wait for the big drop—not now.
The bull market is already here. Don’t hold any fantasies about breaking down below 57k. 57k is a price BTC will never go back to again, just like 1.5 back then. BTC’s cycle is unbreakable. History may not repeat exactly, but it will be strikingly similar.
#BTC走势分析
2
2
1.2k
·
--
Bullish
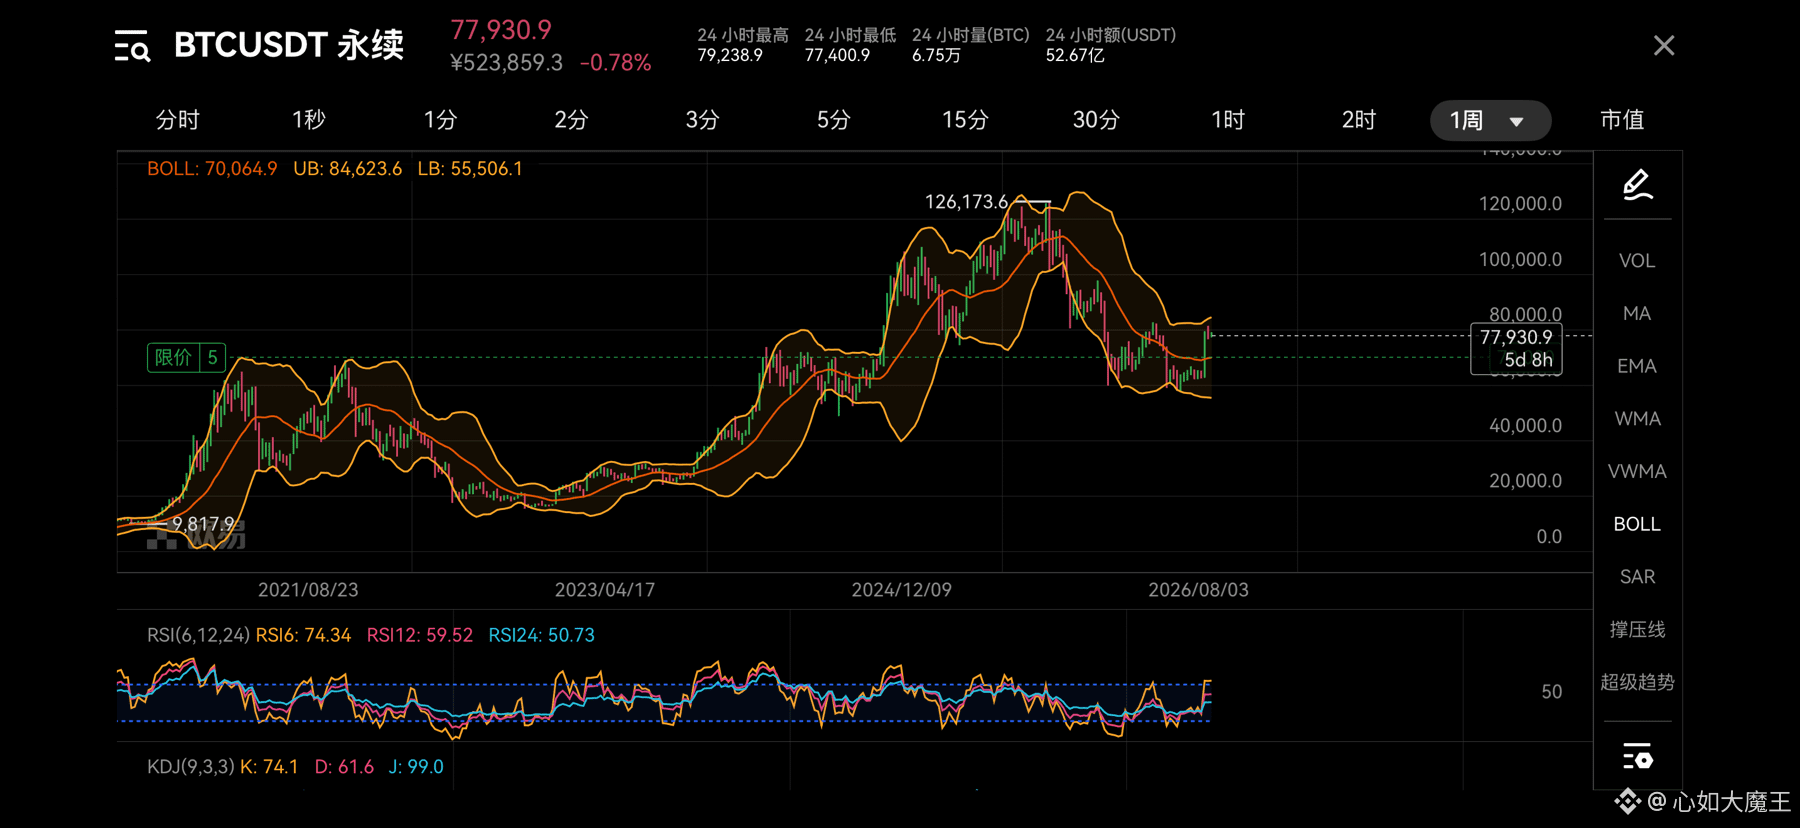
In August 2026, a wildly rough and shoddy “bull” anime movie suddenly exploded in popularity. Amid everyone’s joking, Bitcoin actually entered a brand-new bull run. Remember, the start of the previous bull run was also accompanied by a similar kind of news: a false report that the ETF had been approved caused a direct surge of 5,000 points.
57750 has already become history’s ultimate bottom. In the early stage of this bull market, the first target is 84,000, the second target is 92,000, and the end of the big bull market is 180,000!
For subsequent actions: if the price pulls back, go long. When the price is below 88,000, you must absolutely not short!
The final endpoint of this rally will be the drop’s endpoint—this bull market’s last absolutely low point, the last place to board. By then, it will be not only the entry point for BTC, but also the final entry point for altcoins!
Low-probability event: we’ve already reached the top tier and are about to pull back toward 67,000. If that happens, immediately max out leverage and go long on BTC!
$BTC
In August 2026, a wildly rough and shoddy “bull” anime movie suddenly exploded in popularity. Amid everyone’s joking, Bitcoin actually entered a brand-new bull run. Remember, the start of the previous bull run was also accompanied by a similar kind of news: a false report that the ETF had been approved caused a direct surge of 5,000 points.
57750 has already become history’s ultimate bottom. In the early stage of this bull market, the first target is 84,000, the second target is 92,000, and the end of the big bull market is 180,000!
For subsequent actions: if the price pulls back, go long. When the price is below 88,000, you must absolutely not short!
The final endpoint of this rally will be the drop’s endpoint—this bull market’s last absolutely low point, the last place to board. By then, it will be not only the entry point for BTC, but also the final entry point for altcoins!
Low-probability event: we’ve already reached the top tier and are about to pull back toward 67,000. If that happens, immediately max out leverage and go long on BTC!
$BTC
57750 has already become history’s ultimate bottom. In the early stage of this bull market, the first target is 84,000, the second target is 92,000, and the end of the big bull market is 180,000!
For subsequent actions: if the price pulls back, go long. When the price is below 88,000, you must absolutely not short!
The final endpoint of this rally will be the drop’s endpoint—this bull market’s last absolutely low point, the last place to board. By then, it will be not only the entry point for BTC, but also the final entry point for altcoins!
Low-probability event: we’ve already reached the top tier and are about to pull back toward 67,000. If that happens, immediately max out leverage and go long on BTC!
$BTC
1
725
·
--
The Bollinger Bands have narrowed down into a single line
Over the past three days, the price has been moving sideways within the range of 63,100 to 64,000. Volatility has been shrinking, while trading volume keeps getting lower. In one hour, the difference between the upper and lower Bollinger Bands is only 700 points, and in four hours it’s just 1,250 points.
This degree of band contraction is the most typical signal before a breakout. When the price is compressed to the limit, it must choose a direction.
If it moves upward: it must first hold above 63,650 (the 4-hour middle band), and then push toward 64,000 (the daily middle band). Only if 64,000 is reclaimed will the damage from the bearish candle on 8/11 be considered repaired. Otherwise, any rebound is just false.
If it moves downward: a drop below 62,800 (the daily lower band) is the confirmation signal. If that level breaks, the next area is 60,600 (the 3-day lower band), followed by the 57,000–58,000 zone. There isn’t much in the way of meaningful support in between.
After the price was smashed down from 64,500 on the night of 8/11, it has been hovering here for three days. This kind of consolidation won’t last too long. A direction should emerge within the next 24 to 48 hours.
In terms of trading, it’s far more reliable to wait for the direction to become clear before deciding, rather than guessing right now. If it breaks upward, wait for a confirmed hold above 64,000. If it breaks down, then if 62,800 can’t be defended, it means the trend will continue.
#比特币走势分析 $BTC
{future}(BTCUSDT)
The Bollinger Bands have narrowed down into a single line
Over the past three days, the price has been moving sideways within the range of 63,100 to 64,000. Volatility has been shrinking, while trading volume keeps getting lower. In one hour, the difference between the upper and lower Bollinger Bands is only 700 points, and in four hours it’s just 1,250 points.
This degree of band contraction is the most typical signal before a breakout. When the price is compressed to the limit, it must choose a direction.
If it moves upward: it must first hold above 63,650 (the 4-hour middle band), and then push toward 64,000 (the daily middle band). Only if 64,000 is reclaimed will the damage from the bearish candle on 8/11 be considered repaired. Otherwise, any rebound is just false.
If it moves downward: a drop below 62,800 (the daily lower band) is the confirmation signal. If that level breaks, the next area is 60,600 (the 3-day lower band), followed by the 57,000–58,000 zone. There isn’t much in the way of meaningful support in between.
After the price was smashed down from 64,500 on the night of 8/11, it has been hovering here for three days. This kind of consolidation won’t last too long. A direction should emerge within the next 24 to 48 hours.
In terms of trading, it’s far more reliable to wait for the direction to become clear before deciding, rather than guessing right now. If it breaks upward, wait for a confirmed hold above 64,000. If it breaks down, then if 62,800 can’t be defended, it means the trend will continue.
#比特币走势分析 $BTC
Over the past three days, the price has been moving sideways within the range of 63,100 to 64,000. Volatility has been shrinking, while trading volume keeps getting lower. In one hour, the difference between the upper and lower Bollinger Bands is only 700 points, and in four hours it’s just 1,250 points.
This degree of band contraction is the most typical signal before a breakout. When the price is compressed to the limit, it must choose a direction.
If it moves upward: it must first hold above 63,650 (the 4-hour middle band), and then push toward 64,000 (the daily middle band). Only if 64,000 is reclaimed will the damage from the bearish candle on 8/11 be considered repaired. Otherwise, any rebound is just false.
If it moves downward: a drop below 62,800 (the daily lower band) is the confirmation signal. If that level breaks, the next area is 60,600 (the 3-day lower band), followed by the 57,000–58,000 zone. There isn’t much in the way of meaningful support in between.
After the price was smashed down from 64,500 on the night of 8/11, it has been hovering here for three days. This kind of consolidation won’t last too long. A direction should emerge within the next 24 to 48 hours.
In terms of trading, it’s far more reliable to wait for the direction to become clear before deciding, rather than guessing right now. If it breaks upward, wait for a confirmed hold above 64,000. If it breaks down, then if 62,800 can’t be defended, it means the trend will continue.
#比特币走势分析 $BTC
181
·
--
After three attempts to surge past 65500 all failed, even frantic ETF buying can’t save it
On 8.7 the high was 65400, on 8.9 the high was 65500, on 8.10 the high was 65400—three times, and not a single one broke through.
At the 65500 level, the daily Bollinger upper band and the 4-hour upper band are both converging as resistance, and that pressure has been confirmed three times. Bulls kept touching it for three straight days, only to be hammered back every time. On 8.10, it even came as a single solid bearish candle: opened at 64800, the low was 63800, and it closed at 64000. It directly smashed through the lower band from the 4-hour midline, and it closed hugging the lower band without reclaiming it.
65500 is the ceiling. 64800 has turned into resistance, and 64000 is the final shred of a “shield.”
If 65500 can’t be broken through three times, and 64800 can’t be held, then 64000 is in serious danger. From the rebound on 8.1 at 62200 up to 65500, it bounced about 3300 points—then what? One K-line on 8.10 slammed it back by nearly 1000 points.
In the short term, if 64000 can’t be defended, the target directly looks at 62800. Once 62800 is lost, the entire rebound structure collapses, and the price returns to the downward channel.
$BTC #比特币走势分析
After three attempts to surge past 65500 all failed, even frantic ETF buying can’t save it
On 8.7 the high was 65400, on 8.9 the high was 65500, on 8.10 the high was 65400—three times, and not a single one broke through.
At the 65500 level, the daily Bollinger upper band and the 4-hour upper band are both converging as resistance, and that pressure has been confirmed three times. Bulls kept touching it for three straight days, only to be hammered back every time. On 8.10, it even came as a single solid bearish candle: opened at 64800, the low was 63800, and it closed at 64000. It directly smashed through the lower band from the 4-hour midline, and it closed hugging the lower band without reclaiming it.
65500 is the ceiling. 64800 has turned into resistance, and 64000 is the final shred of a “shield.”
If 65500 can’t be broken through three times, and 64800 can’t be held, then 64000 is in serious danger. From the rebound on 8.1 at 62200 up to 65500, it bounced about 3300 points—then what? One K-line on 8.10 slammed it back by nearly 1000 points.
In the short term, if 64000 can’t be defended, the target directly looks at 62800. Once 62800 is lost, the entire rebound structure collapses, and the price returns to the downward channel.
$BTC #比特币走势分析
On 8.7 the high was 65400, on 8.9 the high was 65500, on 8.10 the high was 65400—three times, and not a single one broke through.
At the 65500 level, the daily Bollinger upper band and the 4-hour upper band are both converging as resistance, and that pressure has been confirmed three times. Bulls kept touching it for three straight days, only to be hammered back every time. On 8.10, it even came as a single solid bearish candle: opened at 64800, the low was 63800, and it closed at 64000. It directly smashed through the lower band from the 4-hour midline, and it closed hugging the lower band without reclaiming it.
65500 is the ceiling. 64800 has turned into resistance, and 64000 is the final shred of a “shield.”
If 65500 can’t be broken through three times, and 64800 can’t be held, then 64000 is in serious danger. From the rebound on 8.1 at 62200 up to 65500, it bounced about 3300 points—then what? One K-line on 8.10 slammed it back by nearly 1000 points.
In the short term, if 64000 can’t be defended, the target directly looks at 62800. Once 62800 is lost, the entire rebound structure collapses, and the price returns to the downward channel.
$BTC #比特币走势分析
218
·
--
What is the market telling you when a single candlestick pierces the lower band and still doesn’t close?
Just now, this 4-hour candlestick was quite interesting.
It opened at 65100, hovering near the upper Bollinger Band around 65300, and then immediately crashed through the mid-band 64900 and smashed through the lower band 64500, with the low going as far as 64160. It closed at 64200. In one candlestick, the price went straight from above the upper band to below the lower band, and the close didn’t reclaim back.
This isn’t a wick. It’s a real body breaking through.
The statistical implication of the lower Bollinger Band is: the probability of price moving within ±2 standard deviations is about 95%. Breaking below the lower band is already a low-probability event, but opening near the upper band and then crashing through the lower band without reclaiming indicates that in these 4 hours, the bears had absolute domination.
The significance of this candlestick:
First, the short-term bullish structure is broken. The mid-band at 64900 has turned from support into resistance. Even if there’s a rebound, it will likely be capped around the mid-band.
Second, this is not a shakeout. A shakeout means piercing through the lower band and then quickly closing back, leaving a long lower shadow. Today, it closed with a real body below the lower band, showing that selling pressure is continuous. This isn’t a needle—it’s a hammer.
Third, the short-term direction is already clear—downward. The next support is at 63500-63800; below that, it’s around the prior lows.
Recently, many major KOLs have turned collectively bullish: “57,000 is the bottom,” “the bear market is over,” “the early phase of a bull market is here”—they’ve been shouting it loudly.
I don’t believe it.
The five-year cycle and the four-year halving—this pattern has been running for over a decade. It won’t become invalid just because an ETF gets approved. It won’t become invalid just because miners pivot to AI. And it won’t become invalid just because everyone wants it to go up.
In a full bear market, there will always be a final bottom where everyone feels so desperate that they end up silent. When it was 57,000, what did you see? Some people were bottom-fishing, some were calling for a bull return, and some were analyzing ETF inflows recovering.
Near the real major bottom, there’s none of that noise. Only silence, only numbness, only, “I’m never watching the charts again.”
On strategy:
For short-term sell positions, you can hold them, with a stop-loss set above the mid-band at 64900. The first target is 63500-63800.
For long-term bottom-fishing, don’t rush—it's nowhere near time yet. When everyone thinks, “Bitcoin is done for,” I’ll be the first to tell you to enter.
#比特币ETF周净流入8.53亿美元 $BTC
What is the market telling you when a single candlestick pierces the lower band and still doesn’t close?
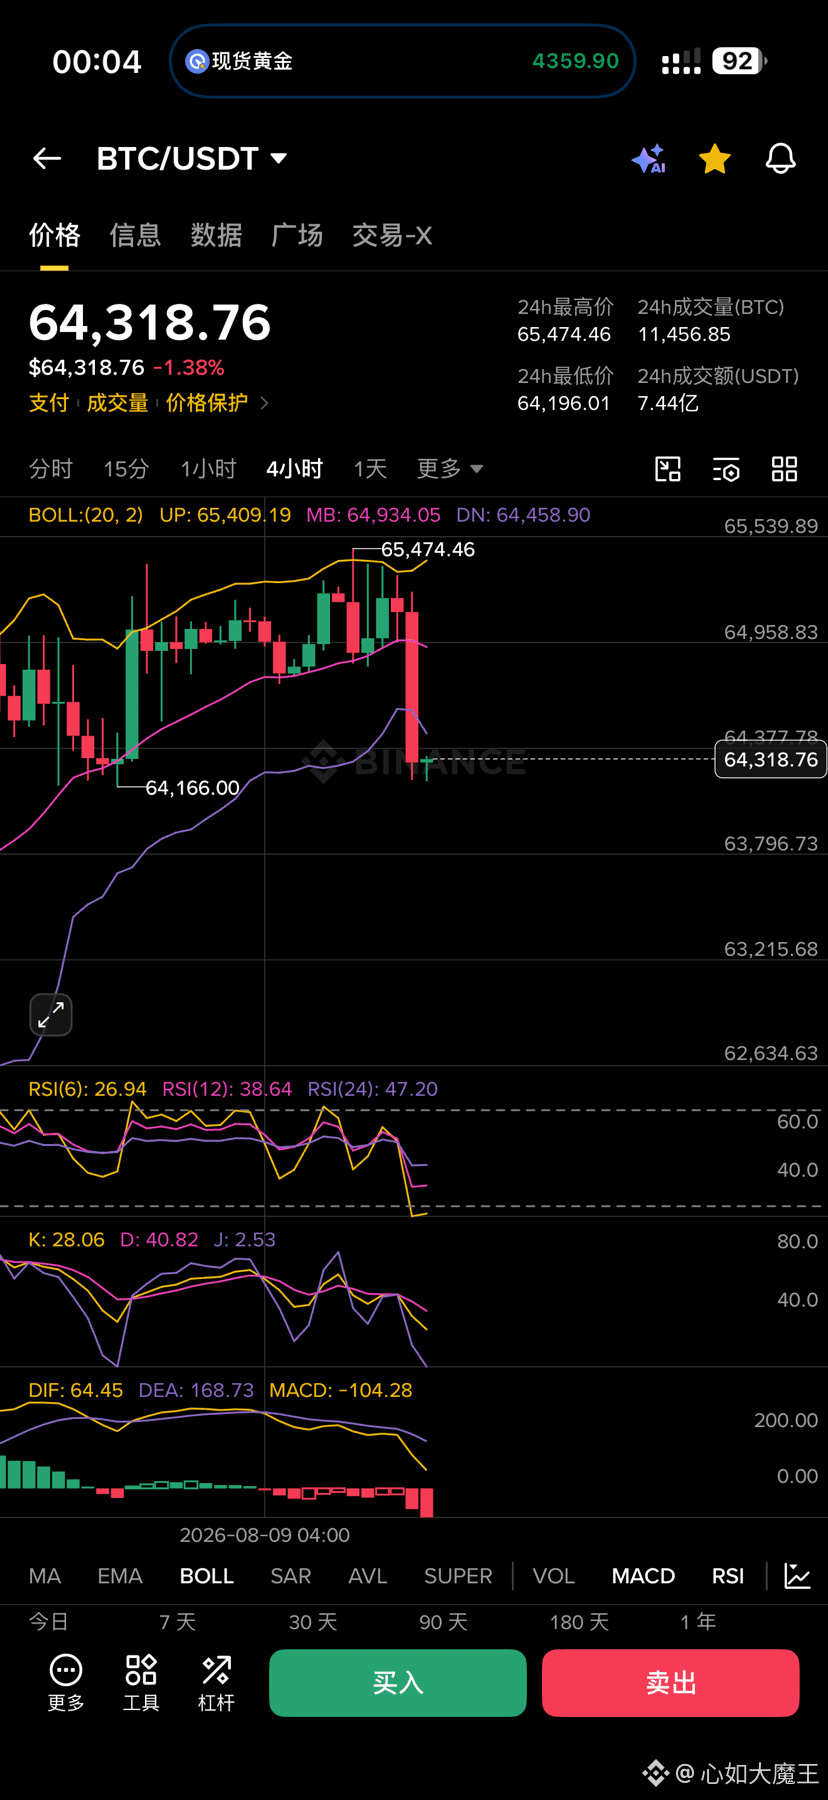
Just now, this 4-hour candlestick was quite interesting.
It opened at 65100, hovering near the upper Bollinger Band around 65300, and then immediately crashed through the mid-band 64900 and smashed through the lower band 64500, with the low going as far as 64160. It closed at 64200. In one candlestick, the price went straight from above the upper band to below the lower band, and the close didn’t reclaim back.
This isn’t a wick. It’s a real body breaking through.
The statistical implication of the lower Bollinger Band is: the probability of price moving within ±2 standard deviations is about 95%. Breaking below the lower band is already a low-probability event, but opening near the upper band and then crashing through the lower band without reclaiming indicates that in these 4 hours, the bears had absolute domination.
The significance of this candlestick:
First, the short-term bullish structure is broken. The mid-band at 64900 has turned from support into resistance. Even if there’s a rebound, it will likely be capped around the mid-band.
Second, this is not a shakeout. A shakeout means piercing through the lower band and then quickly closing back, leaving a long lower shadow. Today, it closed with a real body below the lower band, showing that selling pressure is continuous. This isn’t a needle—it’s a hammer.
Third, the short-term direction is already clear—downward. The next support is at 63500-63800; below that, it’s around the prior lows.
Recently, many major KOLs have turned collectively bullish: “57,000 is the bottom,” “the bear market is over,” “the early phase of a bull market is here”—they’ve been shouting it loudly.
I don’t believe it.
The five-year cycle and the four-year halving—this pattern has been running for over a decade. It won’t become invalid just because an ETF gets approved. It won’t become invalid just because miners pivot to AI. And it won’t become invalid just because everyone wants it to go up.
In a full bear market, there will always be a final bottom where everyone feels so desperate that they end up silent. When it was 57,000, what did you see? Some people were bottom-fishing, some were calling for a bull return, and some were analyzing ETF inflows recovering.
Near the real major bottom, there’s none of that noise. Only silence, only numbness, only, “I’m never watching the charts again.”
On strategy:
For short-term sell positions, you can hold them, with a stop-loss set above the mid-band at 64900. The first target is 63500-63800.
For long-term bottom-fishing, don’t rush—it's nowhere near time yet. When everyone thinks, “Bitcoin is done for,” I’ll be the first to tell you to enter.
#比特币ETF周净流入8.53亿美元 $BTC
Just now, this 4-hour candlestick was quite interesting.
It opened at 65100, hovering near the upper Bollinger Band around 65300, and then immediately crashed through the mid-band 64900 and smashed through the lower band 64500, with the low going as far as 64160. It closed at 64200. In one candlestick, the price went straight from above the upper band to below the lower band, and the close didn’t reclaim back.
This isn’t a wick. It’s a real body breaking through.
The statistical implication of the lower Bollinger Band is: the probability of price moving within ±2 standard deviations is about 95%. Breaking below the lower band is already a low-probability event, but opening near the upper band and then crashing through the lower band without reclaiming indicates that in these 4 hours, the bears had absolute domination.
The significance of this candlestick:
First, the short-term bullish structure is broken. The mid-band at 64900 has turned from support into resistance. Even if there’s a rebound, it will likely be capped around the mid-band.
Second, this is not a shakeout. A shakeout means piercing through the lower band and then quickly closing back, leaving a long lower shadow. Today, it closed with a real body below the lower band, showing that selling pressure is continuous. This isn’t a needle—it’s a hammer.
Third, the short-term direction is already clear—downward. The next support is at 63500-63800; below that, it’s around the prior lows.
Recently, many major KOLs have turned collectively bullish: “57,000 is the bottom,” “the bear market is over,” “the early phase of a bull market is here”—they’ve been shouting it loudly.
I don’t believe it.
The five-year cycle and the four-year halving—this pattern has been running for over a decade. It won’t become invalid just because an ETF gets approved. It won’t become invalid just because miners pivot to AI. And it won’t become invalid just because everyone wants it to go up.
In a full bear market, there will always be a final bottom where everyone feels so desperate that they end up silent. When it was 57,000, what did you see? Some people were bottom-fishing, some were calling for a bull return, and some were analyzing ETF inflows recovering.
Near the real major bottom, there’s none of that noise. Only silence, only numbness, only, “I’m never watching the charts again.”
On strategy:
For short-term sell positions, you can hold them, with a stop-loss set above the mid-band at 64900. The first target is 63500-63800.
For long-term bottom-fishing, don’t rush—it's nowhere near time yet. When everyone thinks, “Bitcoin is done for,” I’ll be the first to tell you to enter.
#比特币ETF周净流入8.53亿美元 $BTC
190
·
--
$64000, is this the bottom or the end of the rebound?
After topping at $126000, BTC has gone through:
12.6w → 8w
Rebound to 9.8w
Dropped to 6w
Rebound to 8.2w
Dropped again to 5.77w
Now, BTC has rebounded from 5.77w to 6.69w, and then pulled back to around 6.24w.
Many people are starting to say the bull market is back, but I don’t think we can rush to conclusions yet.
Technically:
$6.24w is the short-term lifeline.
If it holds here, BTC still has a chance to challenge again:
6.69w → 6.9w weekly mid-band → 7.2w
If it breaks below 6.24, it would suggest that 6.69 might have been the high of this rebound, and the market may seek out 5.77—or even lower—again.
Right now, the most important thing isn’t guessing the bottom, but whether the market can reclaim key resistance.
In the final stage of a bear market, the biggest opportunities often appear when everyone is hesitating.
#比特币收复6.4万美元关口
$64000, is this the bottom or the end of the rebound?
After topping at $126000, BTC has gone through:
12.6w → 8w
Rebound to 9.8w
Dropped to 6w
Rebound to 8.2w
Dropped again to 5.77w
Now, BTC has rebounded from 5.77w to 6.69w, and then pulled back to around 6.24w.
Many people are starting to say the bull market is back, but I don’t think we can rush to conclusions yet.
Technically:
$6.24w is the short-term lifeline.
If it holds here, BTC still has a chance to challenge again:
6.69w → 6.9w weekly mid-band → 7.2w
If it breaks below 6.24, it would suggest that 6.69 might have been the high of this rebound, and the market may seek out 5.77—or even lower—again.
Right now, the most important thing isn’t guessing the bottom, but whether the market can reclaim key resistance.
In the final stage of a bear market, the biggest opportunities often appear when everyone is hesitating.
#比特币收复6.4万美元关口
After topping at $126000, BTC has gone through:
12.6w → 8w
Rebound to 9.8w
Dropped to 6w
Rebound to 8.2w
Dropped again to 5.77w
Now, BTC has rebounded from 5.77w to 6.69w, and then pulled back to around 6.24w.
Many people are starting to say the bull market is back, but I don’t think we can rush to conclusions yet.
Technically:
$6.24w is the short-term lifeline.
If it holds here, BTC still has a chance to challenge again:
6.69w → 6.9w weekly mid-band → 7.2w
If it breaks below 6.24, it would suggest that 6.69 might have been the high of this rebound, and the market may seek out 5.77—or even lower—again.
Right now, the most important thing isn’t guessing the bottom, but whether the market can reclaim key resistance.
In the final stage of a bear market, the biggest opportunities often appear when everyone is hesitating.
#比特币收复6.4万美元关口
2
4
2.5k
Log in to explore more content
Join global crypto users on Binance Square
⚡️ Get latest and useful information about crypto.
💬 Trusted by the world’s largest crypto exchange.
👍 Discover real insights from verified creators.
Email / Phone number
Trending Topics
USAugustPPIRisesLessThanExpected
12,975 views
351 Discussing
🚨 US AUG PPI: Rises LESS Than Expected! Bullish for Crypto? 🚀
PPI +0.4% MoM as expected, but CORE PPI only +0.2% vs +0.3% expected - cooling!
What it means:
• Wholesale inflation softer than feared
• Fed rate hike chance now 62% - but dovish signals coming
• Core PCE revisions expected downward - bullish
• BTC usually pumps on softer PPI
Fed meeting Sep 15-16 - Market now expects pause, not hike?
Is this the green light for Q4 rally?
#Bitcoin #PPI #Fed #CryptoNews #BTC#usaugustppiriseslessthanexpected
True News
·1 Likes
·1.2k views
SECApprovesNasdaqTexasCommodityTrustRule
10,410 views
331 Discussing
ECBRaisesRatesSecondTimeTo2.5%
6,846 views
233 Discussing