
CryptoTraders.com
238 Posts

CryptoTraders.com
Report
Block User
Home of Top Analysts, Elite Trade Alerts, Cutting-Edge Algorithms, and Powerful Scanners — all built to give you the edge in any market. Join & Activate your 14-day free trial now to see the results yourself!
0 Following
3 Followers
3 Liked
Posts
See translation
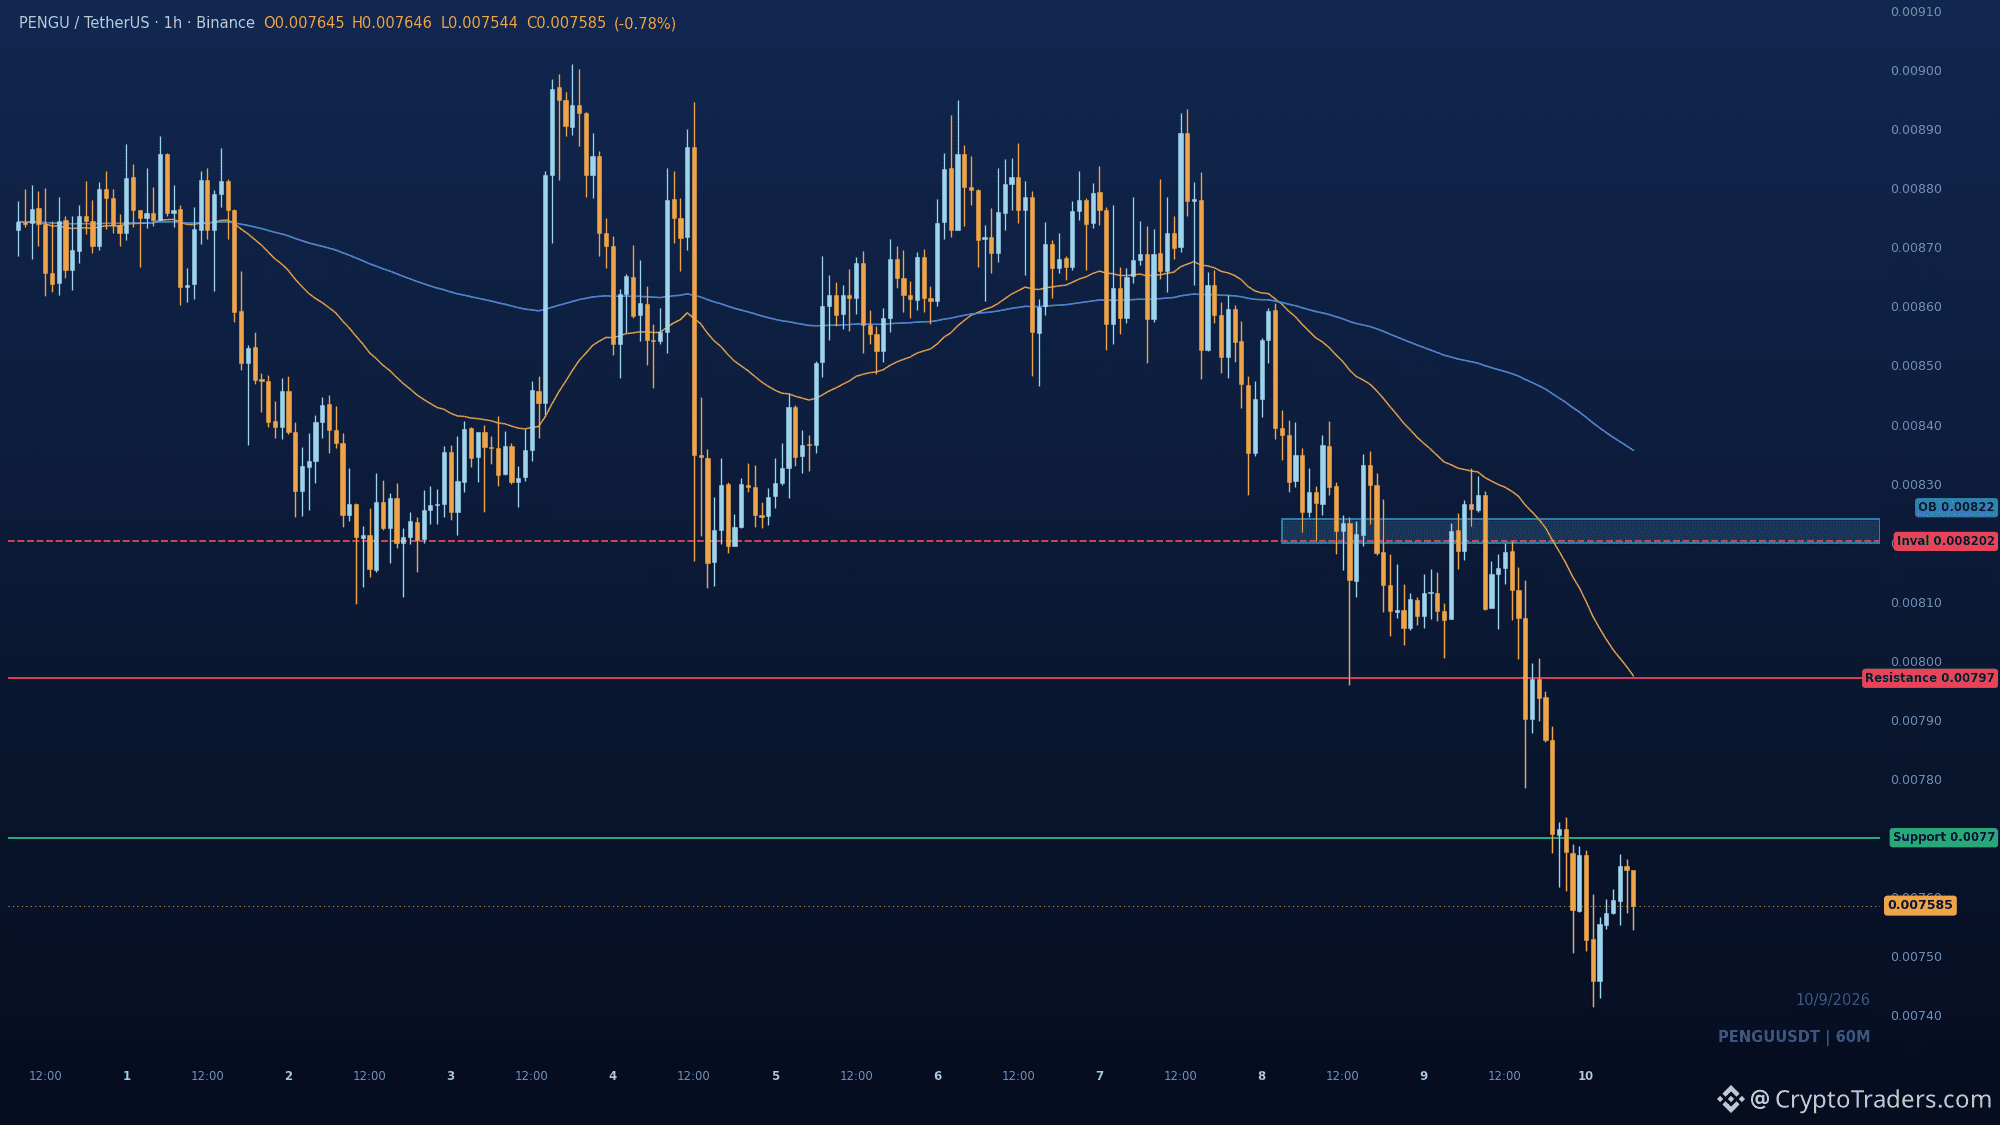
$PENGU just lost 0.00770 on the 1h, and that breakdown flips the old support into overhead supply. Smart money distributed out of the 0.00820-0.00830 block, and the selloff since has been impulsive, not a grind. Price is trading in discount now at 0.007585. What I want to see before trusting a bounce: a reclaim of 0.00797 on the fast EMA, ideally with a retest of 0.00770 holding as support instead of resistance. Until 0.008202 is reclaimed, the base case is a relief push into 0.00770-0.00797 that gets sold. Would you take the retest here or wait for 0.008202 to flip? Reads like this go out daily in the group, my bio has the details. #Altcoin Season#
$PENGU just lost 0.00770 on the 1h, and that breakdown flips the old support into overhead supply. Smart money distributed out of the 0.00820-0.00830 block, and the selloff since has been impulsive, not a grind. Price is trading in discount now at 0.007585. What I want to see before trusting a bounce: a reclaim of 0.00797 on the fast EMA, ideally with a retest of 0.00770 holding as support instead of resistance. Until 0.008202 is reclaimed, the base case is a relief push into 0.00770-0.00797 that gets sold. Would you take the retest here or wait for 0.008202 to flip? Reads like this go out daily in the group, my bio has the details. #Altcoin Season#
1
41
See translation
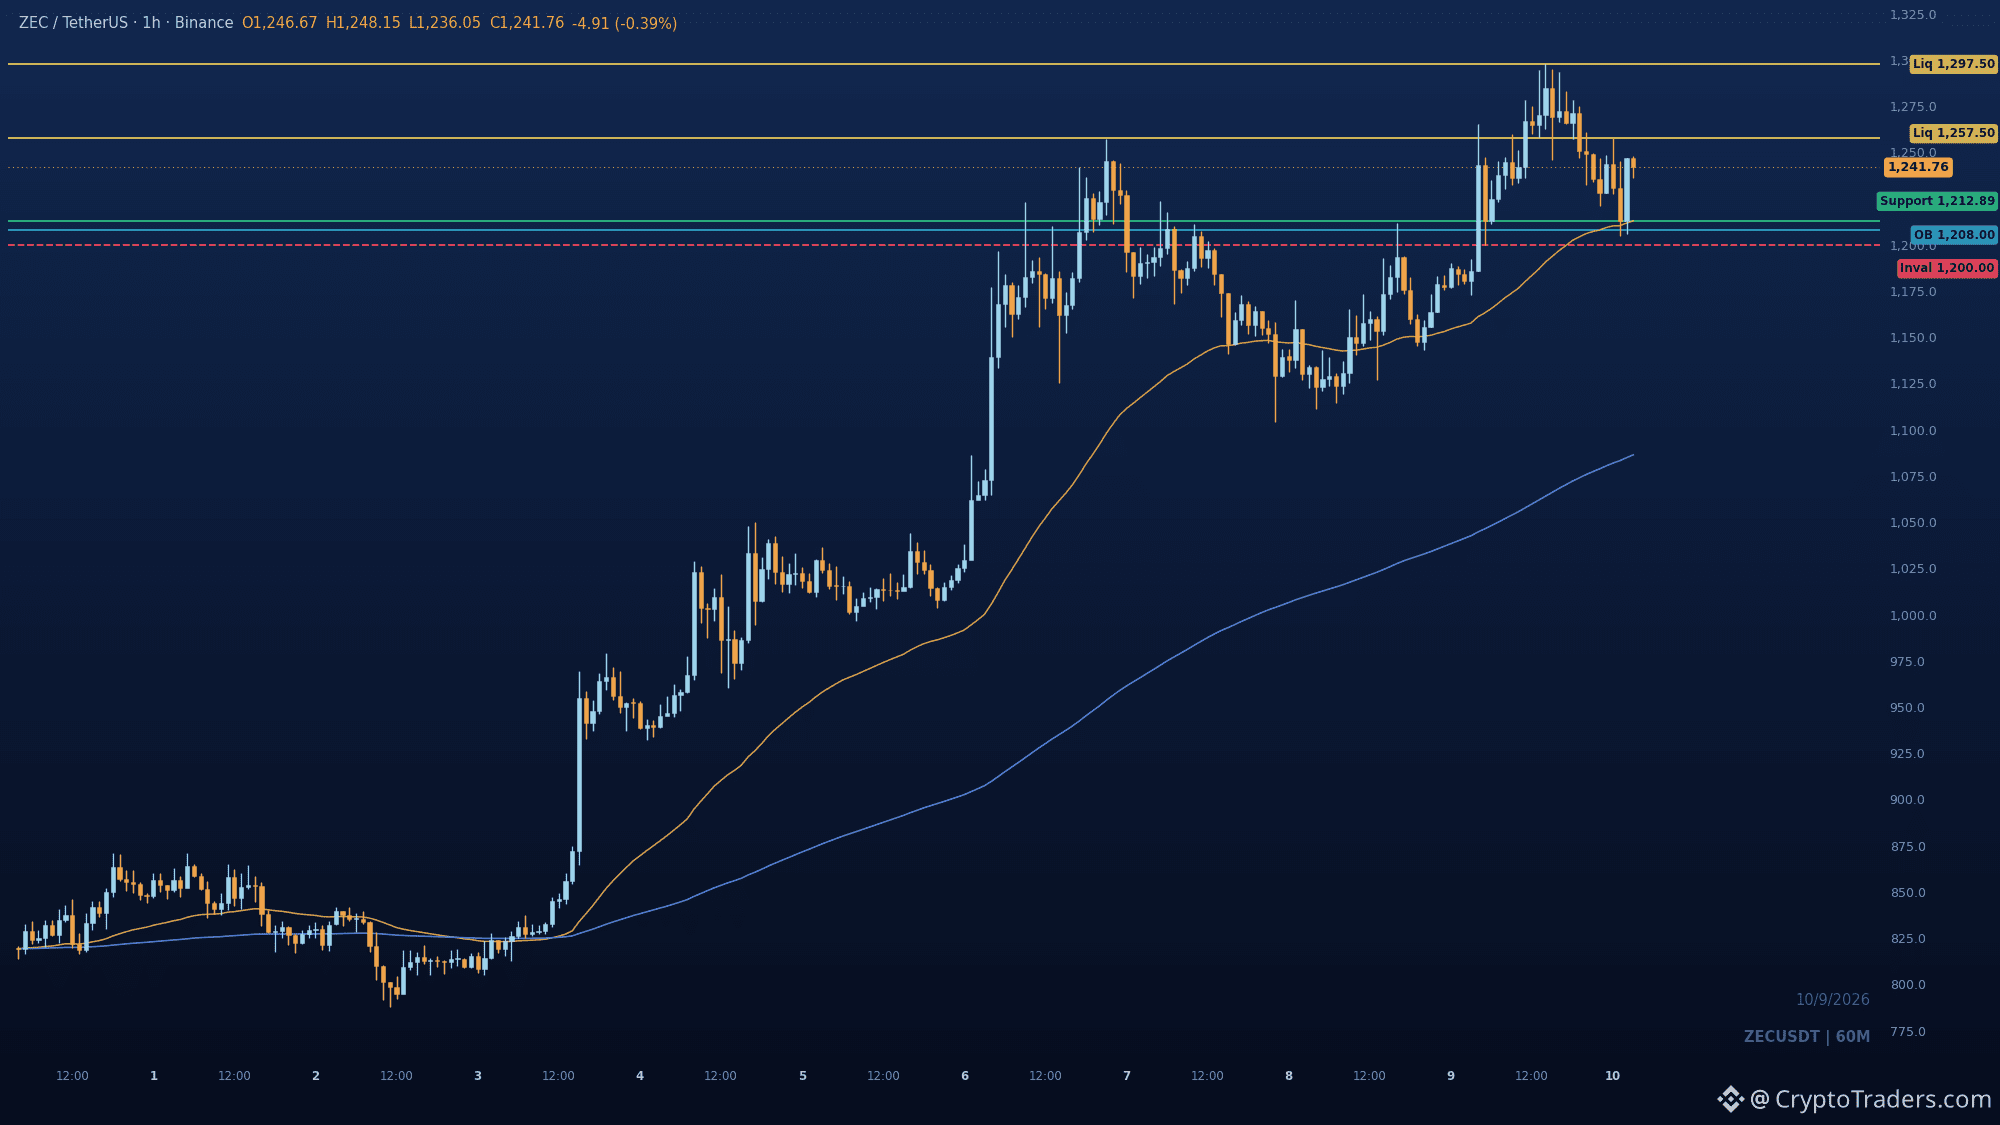
Everyone is chasing $ZEC at 1,243, but the higher-probability trade may be the pullback nobody wants to wait for. Structure is clean bullish: fresh BOS through prior highs after smart money defended the rising 50 EMA. Price sits in premium, consolidating under external highs. The zone that matters is 1212.89 to 1208, where the EMA and the bullish order block stack up. That retracement is the setup. A reclaim of 1257.5 confirms the continuation leg toward 1297.5 buy-side liquidity. Lose 1200 and the whole bullish read is void. Are you buying this premium, or waiting for the 1208 retest? #Altcoin Season#
Everyone is chasing $ZEC at 1,243, but the higher-probability trade may be the pullback nobody wants to wait for. Structure is clean bullish: fresh BOS through prior highs after smart money defended the rising 50 EMA. Price sits in premium, consolidating under external highs. The zone that matters is 1212.89 to 1208, where the EMA and the bullish order block stack up. That retracement is the setup. A reclaim of 1257.5 confirms the continuation leg toward 1297.5 buy-side liquidity. Lose 1200 and the whole bullish read is void. Are you buying this premium, or waiting for the 1208 retest? #Altcoin Season#
46
See translation
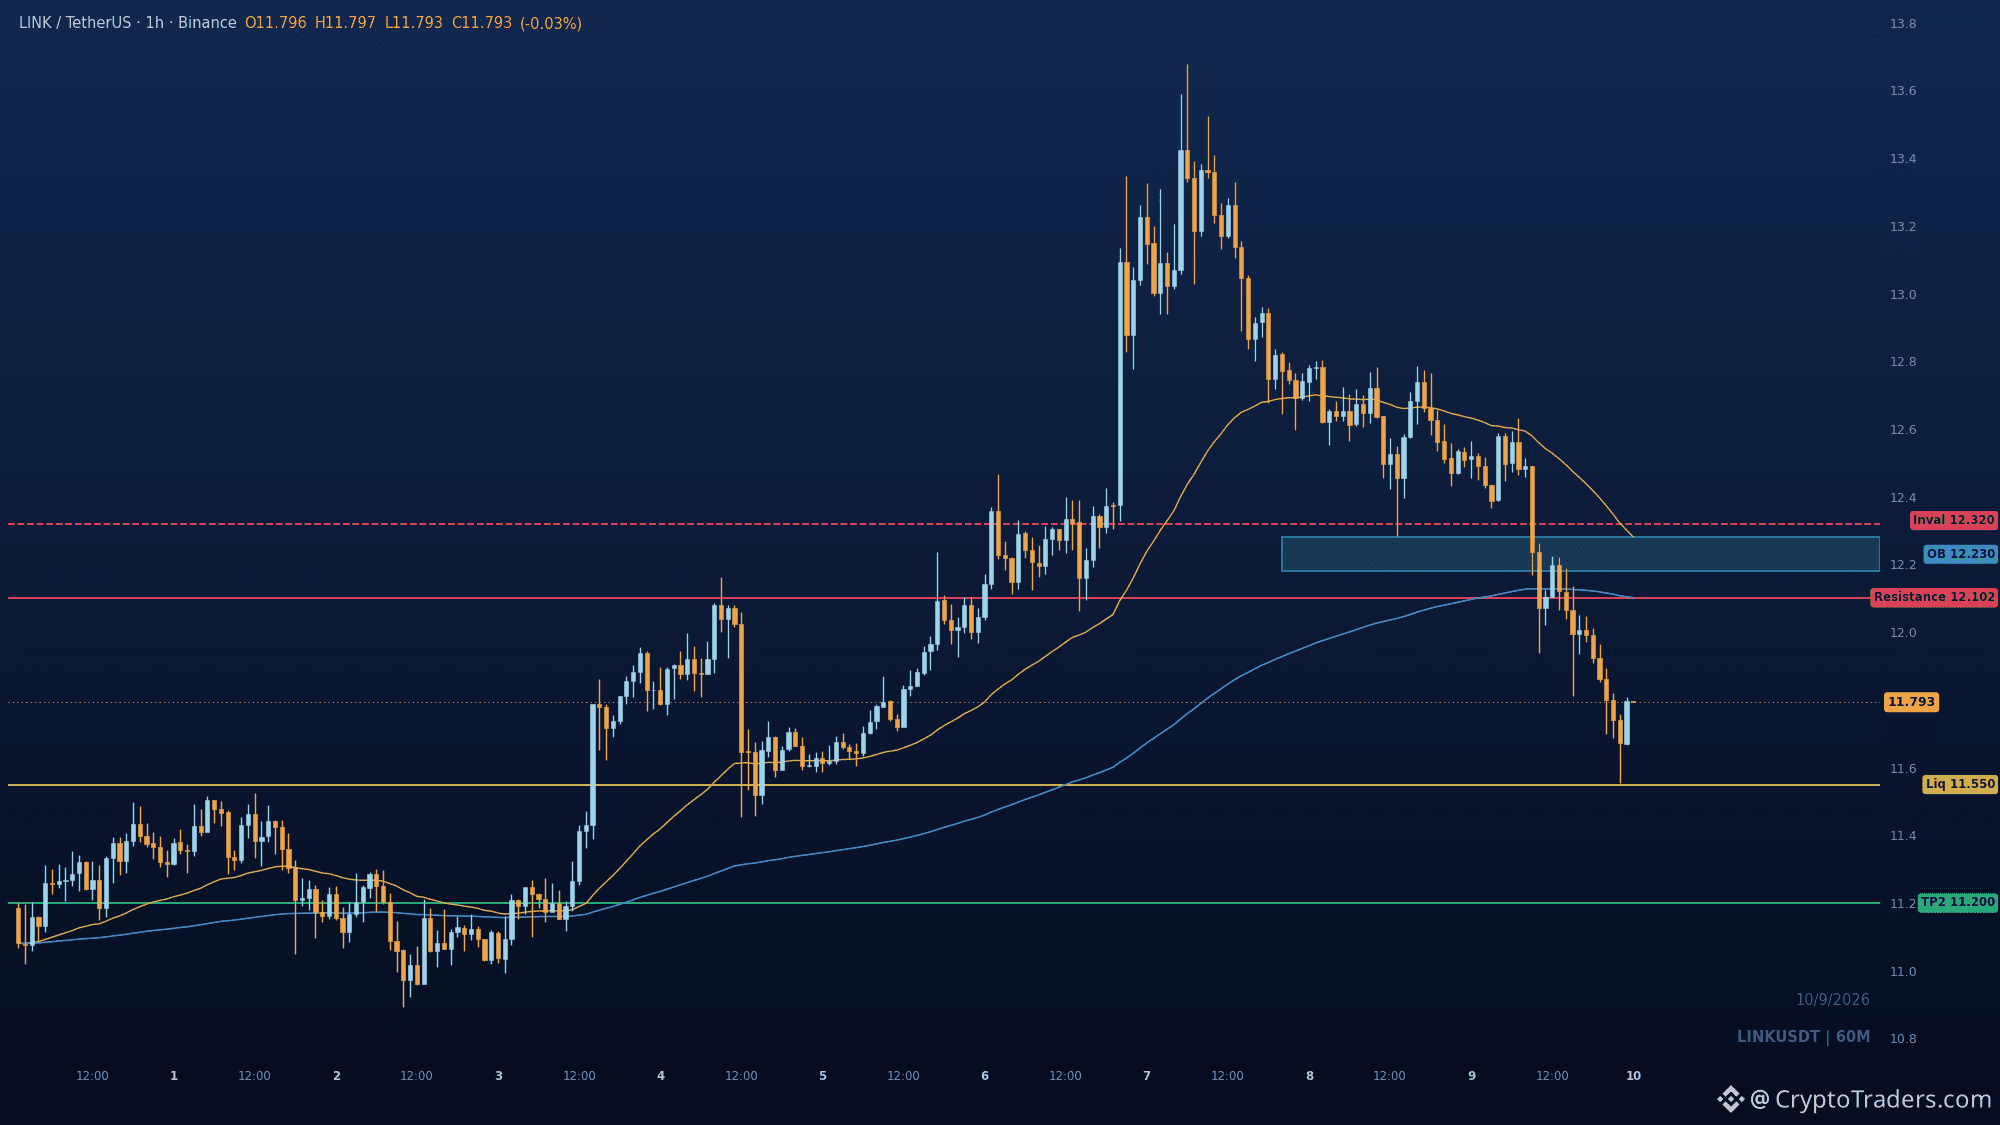
Can $LINK hold above 11.55 after that 11.811 breakdown, or is a retest of 12.10-12.28 just a gift for sellers? Smart money distributed from 12.6-13.4, then drove price below 11.811. Now trading in discount with a bearish structure. Overhead supply sits at 12.18-12.28, with the 200 EMA at 12.10 adding resistance. A corrective bounce into that zone looks like the re-entry spot. Invalidation is a reclaim of 12.32. If that fails, the path points to 11.55 liquidity, then 11.20. If you are short-biased here, where would you add on a retrace, or do you wait for the sweep of 11.55 first? We drop reads like this on the daily in the group, check the bio. #Altcoin Season#
Can $LINK hold above 11.55 after that 11.811 breakdown, or is a retest of 12.10-12.28 just a gift for sellers? Smart money distributed from 12.6-13.4, then drove price below 11.811. Now trading in discount with a bearish structure. Overhead supply sits at 12.18-12.28, with the 200 EMA at 12.10 adding resistance. A corrective bounce into that zone looks like the re-entry spot. Invalidation is a reclaim of 12.32. If that fails, the path points to 11.55 liquidity, then 11.20. If you are short-biased here, where would you add on a retrace, or do you wait for the sweep of 11.55 first? We drop reads like this on the daily in the group, check the bio. #Altcoin Season#
53
See translation
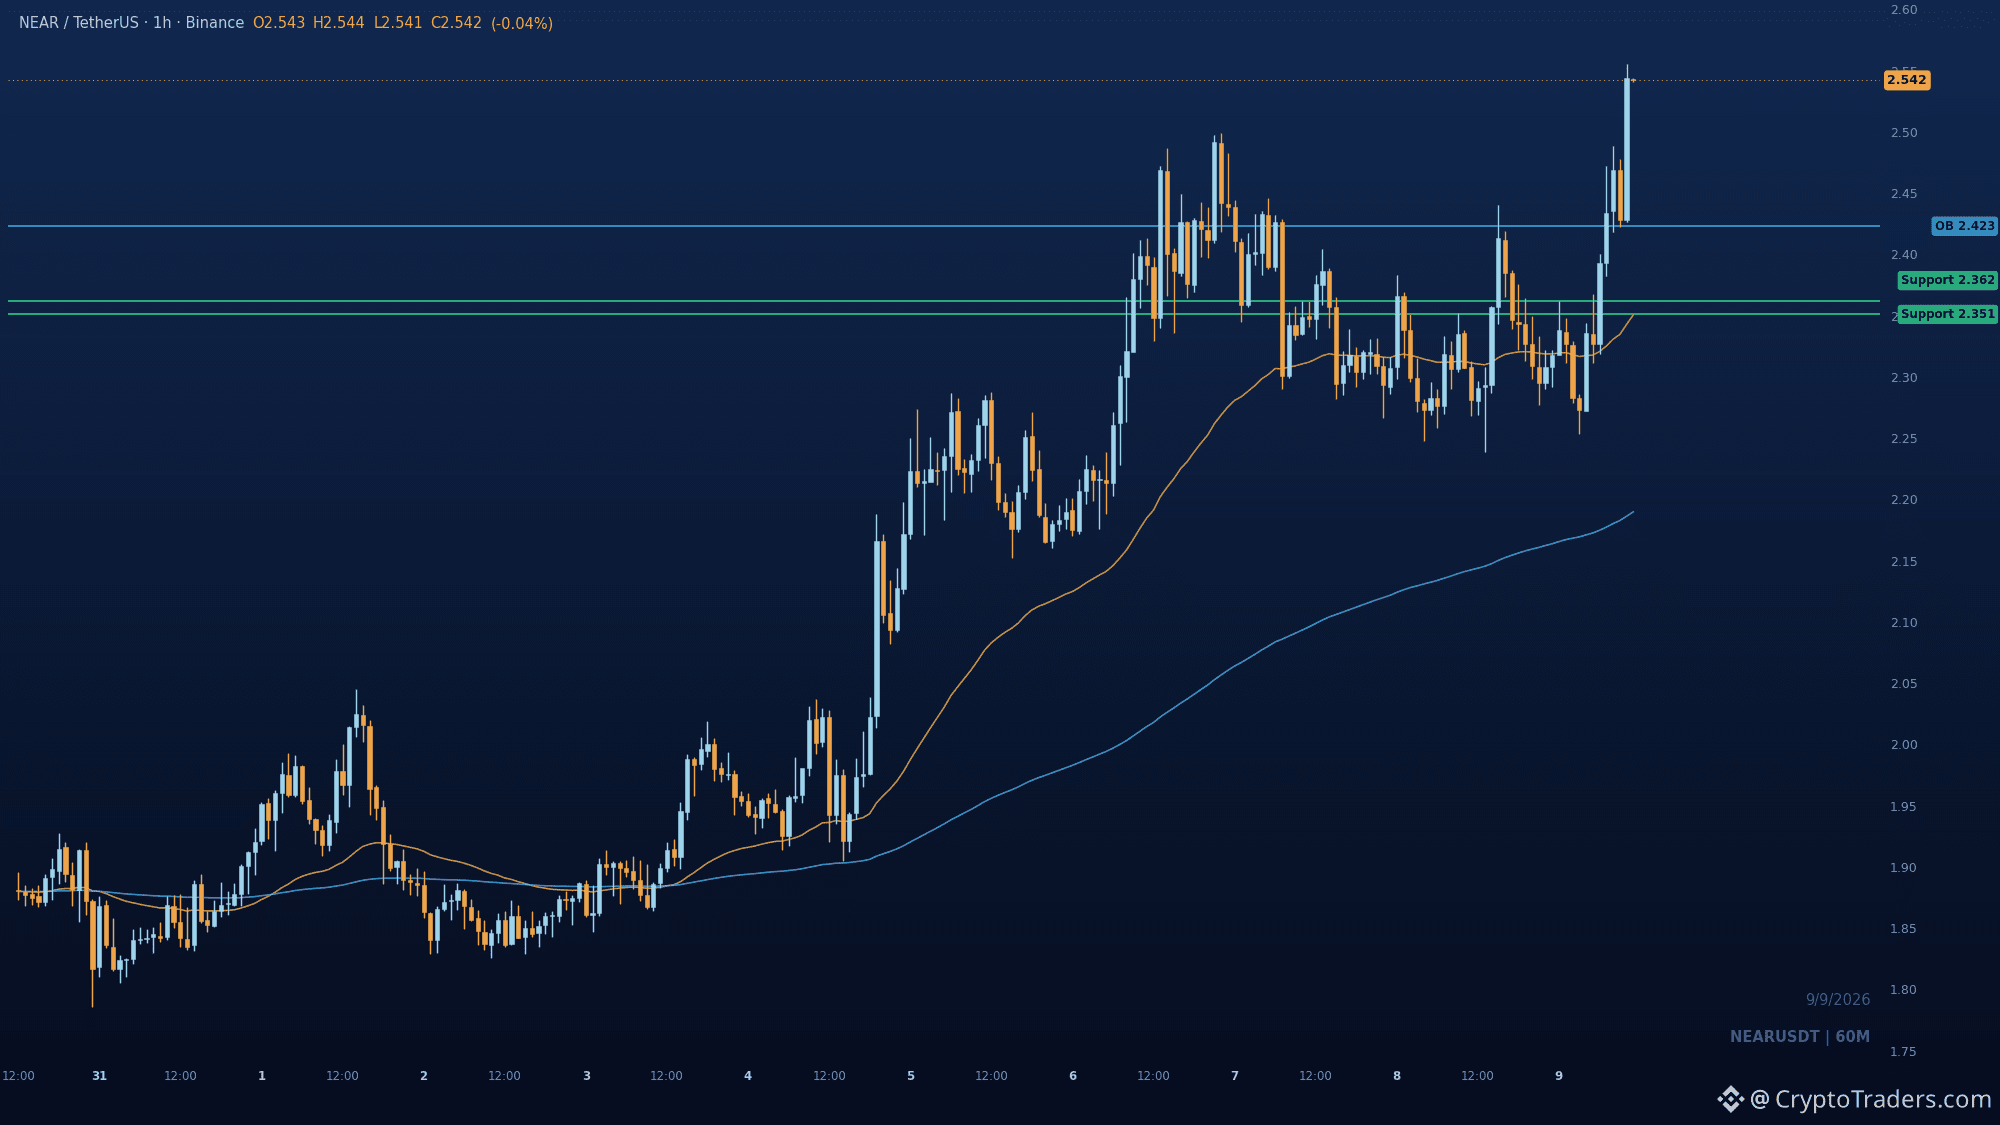
2.362. That is the whole story on $NEAR right now, and the fresh BOS above it has the market in price discovery. The 1h chart shows smart money markup reclaiming 2.362 and breaking prior highs with real momentum, not a drift. The latest bullish impulse left an order block at 2.423-2.438, and that zone plus the broken swing high at 2.362 is where a pullback should find buyers. Fast EMA confluence sits at 2.351, so a dip that holds the 2.438-2.362 pocket keeps the continuation case alive. Lose 2.362 and the higher-timeframe bullish structure gets a serious dent, but until then the path is up. Does NEAR give us that shallow retest, or does it chase straight into new highs? More daily chart reads like this in the group, bio has the way in. #Altcoin Season#
2.362. That is the whole story on $NEAR right now, and the fresh BOS above it has the market in price discovery. The 1h chart shows smart money markup reclaiming 2.362 and breaking prior highs with real momentum, not a drift. The latest bullish impulse left an order block at 2.423-2.438, and that zone plus the broken swing high at 2.362 is where a pullback should find buyers. Fast EMA confluence sits at 2.351, so a dip that holds the 2.438-2.362 pocket keeps the continuation case alive. Lose 2.362 and the higher-timeframe bullish structure gets a serious dent, but until then the path is up. Does NEAR give us that shallow retest, or does it chase straight into new highs? More daily chart reads like this in the group, bio has the way in. #Altcoin Season#
24
See translation
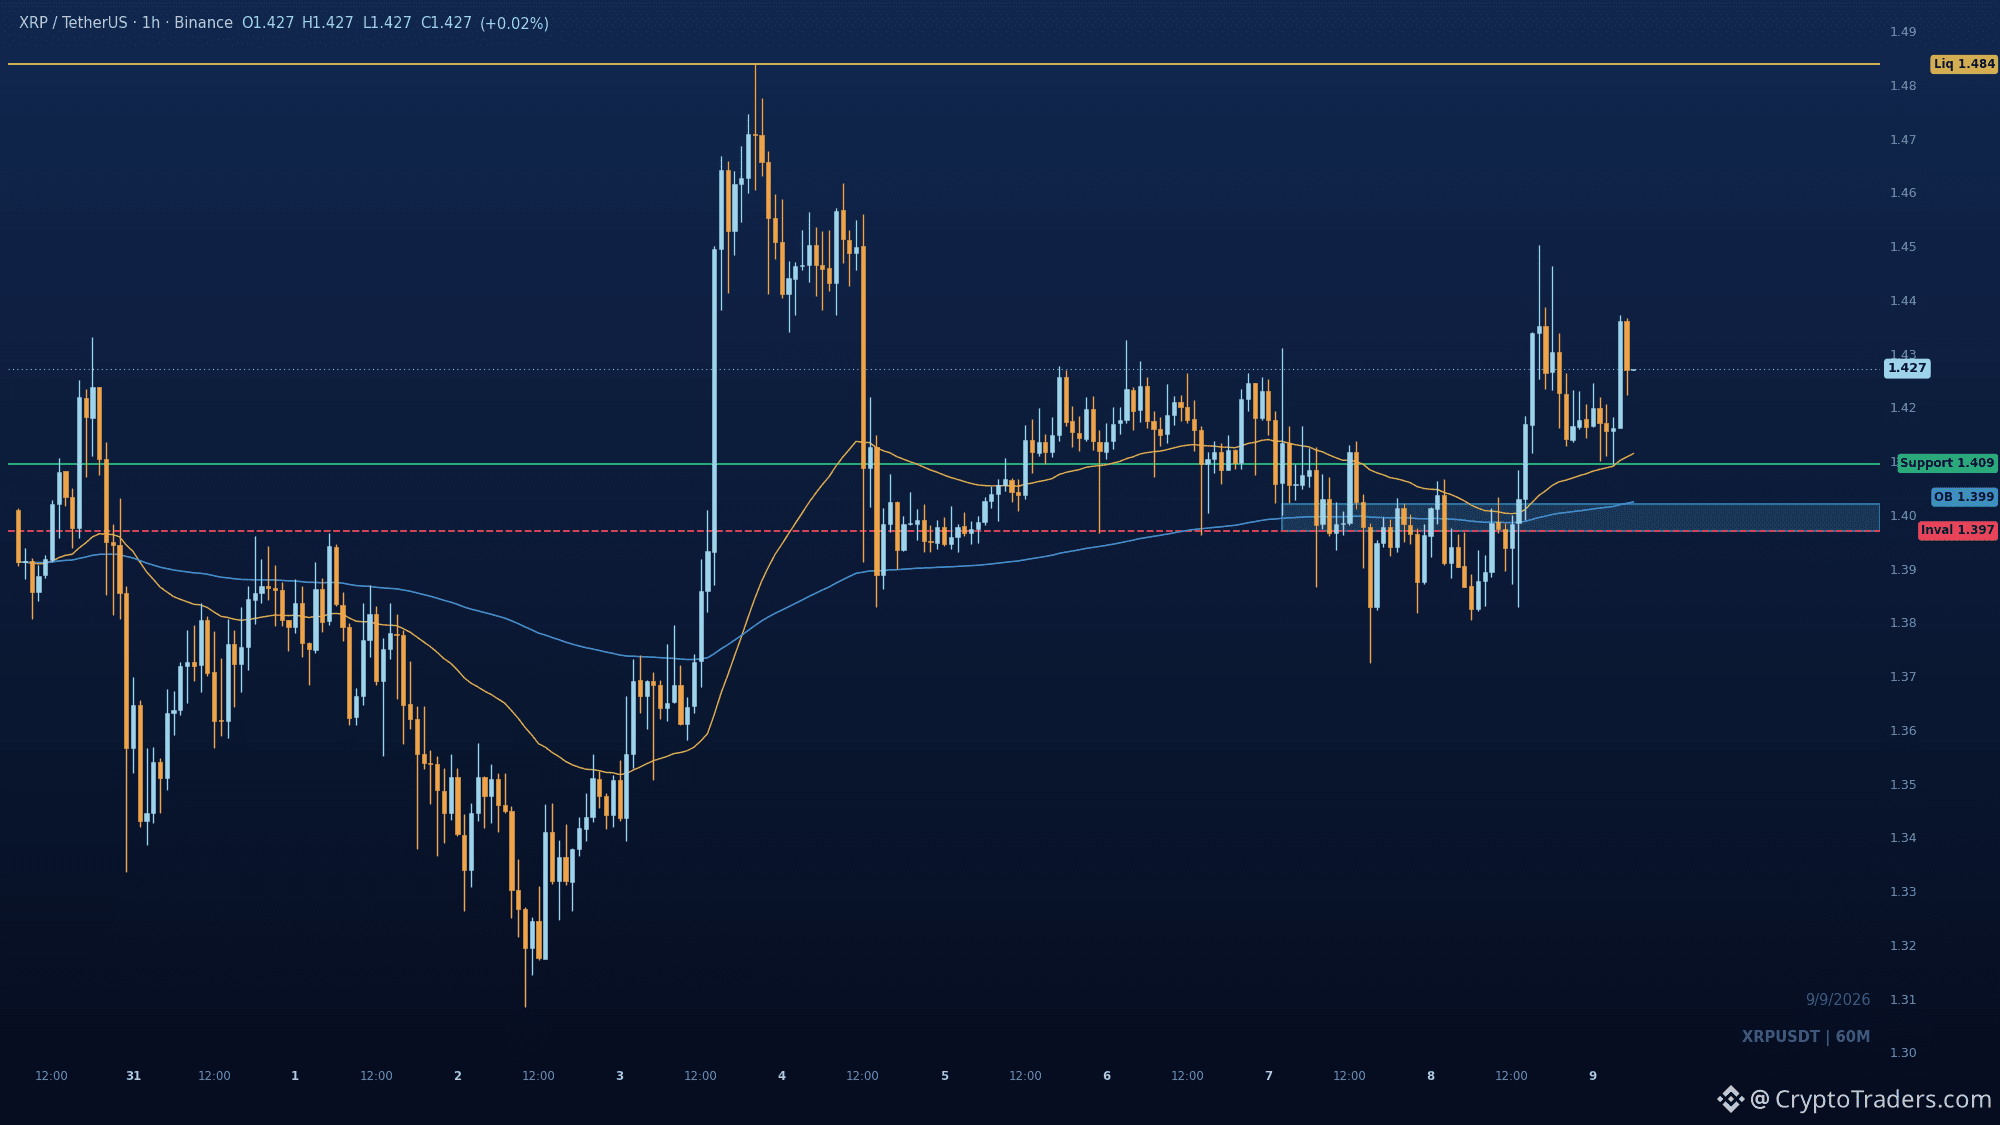
Either $XRP holds 1.4094 and grinds back toward 1.4838, or it loses that higher low and the bullish case weakens fast. Right now, the chart favors the first path. The 1.38, 1.40 base saw accumulation, then a clean break above 1.4245 put price in premium. That BOS is the line in the sand. Watch the pullback into 1.4114, 1.4094. If buyers defend there, the next leg targets the 1.4838 liquidity pool. Invalidation sits at 1.397, below the order block. A close under that flips the structure bearish. What level would you need to see hold before you'd trust the run to 1.4838? More daily chart reads like this go out in the group, check my bio. #Altcoin Season#
Either $XRP holds 1.4094 and grinds back toward 1.4838, or it loses that higher low and the bullish case weakens fast. Right now, the chart favors the first path. The 1.38, 1.40 base saw accumulation, then a clean break above 1.4245 put price in premium. That BOS is the line in the sand. Watch the pullback into 1.4114, 1.4094. If buyers defend there, the next leg targets the 1.4838 liquidity pool. Invalidation sits at 1.397, below the order block. A close under that flips the structure bearish. What level would you need to see hold before you'd trust the run to 1.4838? More daily chart reads like this go out in the group, check my bio. #Altcoin Season#
28
See translation
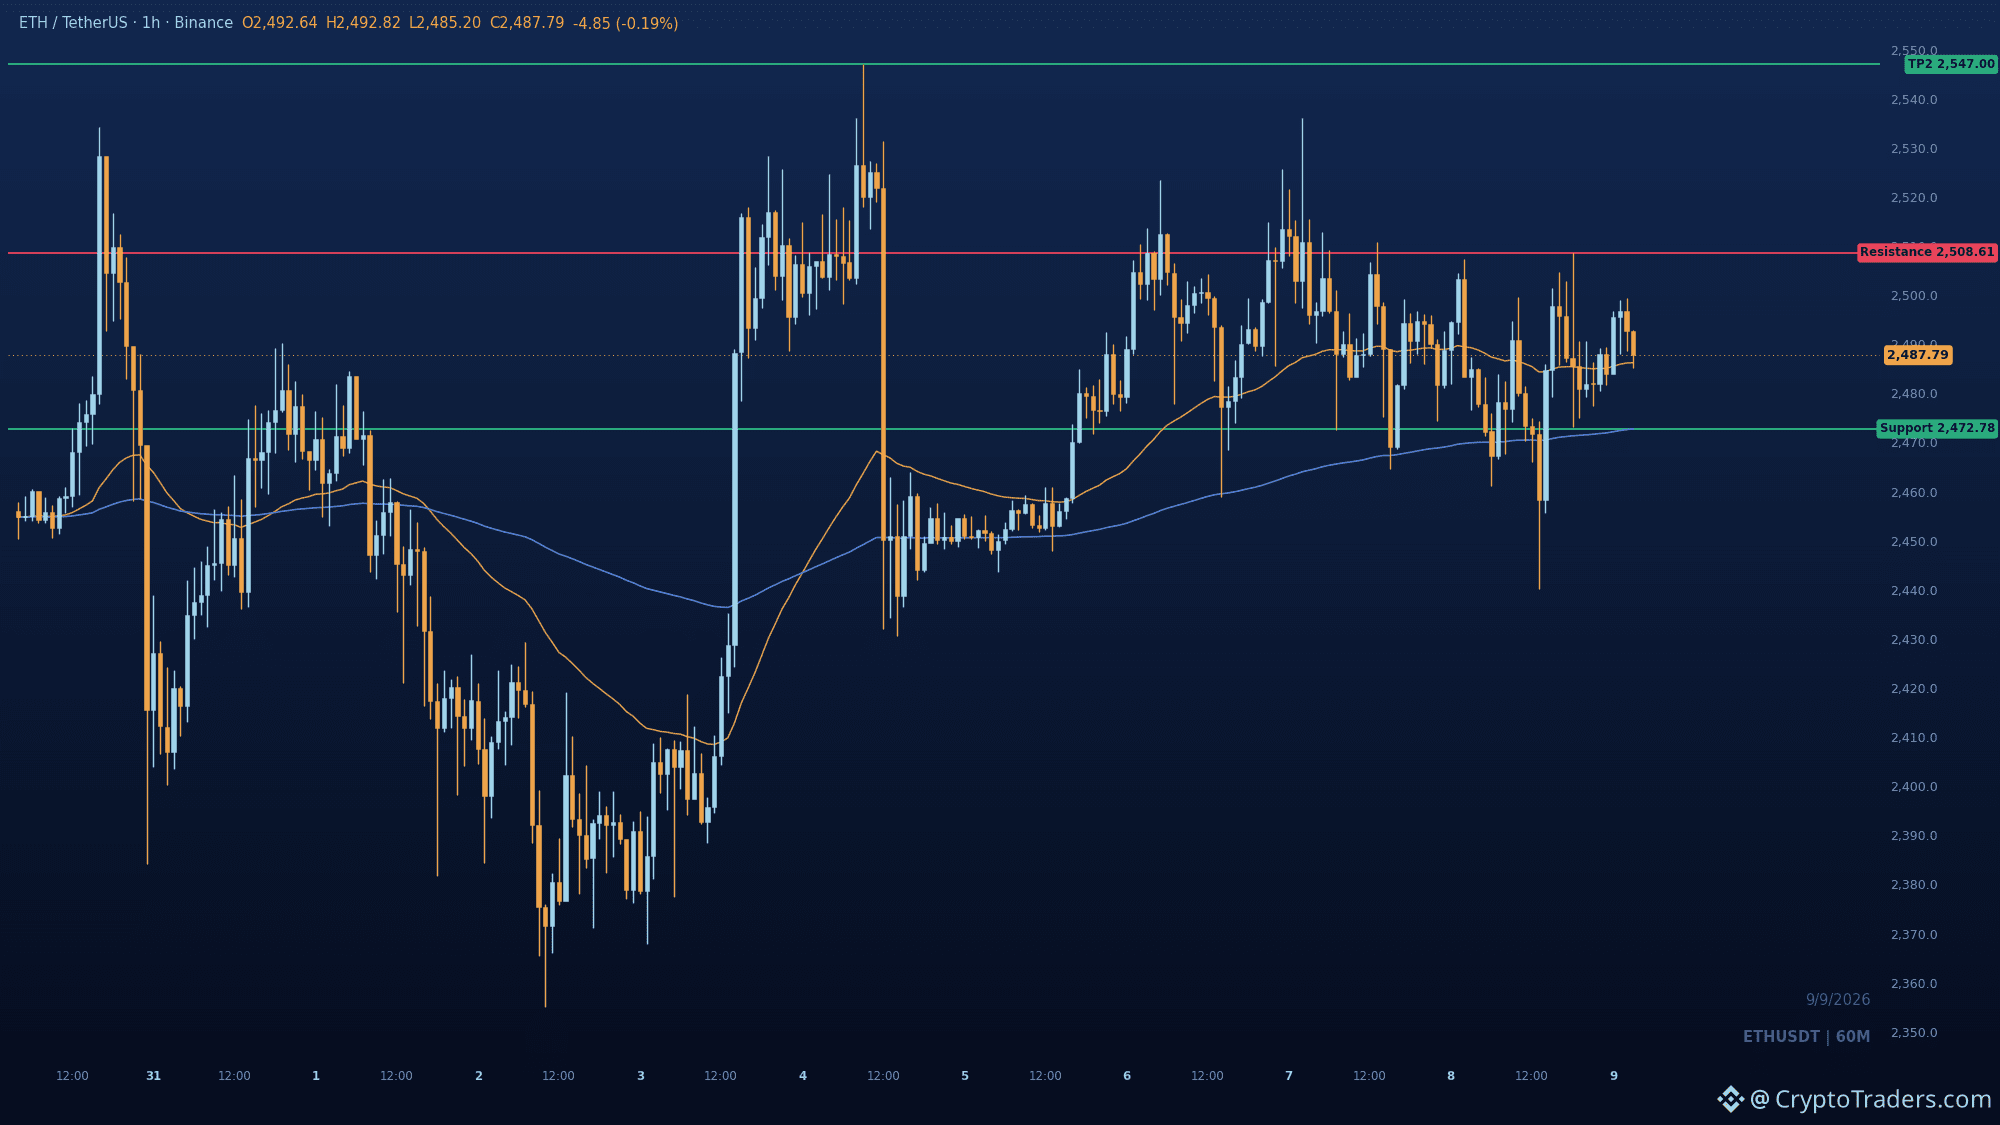
Ethereum holds 2,473 support as Coinbase premium rebounds Ethereum is trading at 2,489, basically flat on the day, but the $ETH chart is flashing a recovery pattern that has caught the attention of futures desks and on-chain trackers alike. Two data points stand out. Token Terminal shows the amount of ETH bridged to Robinhood Chain has surged 150 percent in the past month, now above 700 million. And the Coinbase Ethereum Premium has suddenly recovered, a signal traders often read as institutional accumulation during the dip. Add the Ethereum Foundation's stated plan to make ETH quantum-proof by 2029, and the longer-term narrative is firming up. The 1-hour structure remains bullish after a clean break of structure into the 2508.61 swing high. The important part is the zone just below: 2472.78 to 2473.21, where the 50 and 200 EMAs converge with the swing-low support. That level has already done its job once this window, sparking the bullish recovery that put price back into premium. Now, with price consolidating above the EMAs, the most likely path is a pullback into that same support zone before another push at 2508.61. If buyers defend 2473 again, the focus shifts to the resting liquidity above 2508.61, with a continuation zone at 2547.0. A daily close below 2472.78 invalidates the bullish structure and opens up the broader range to a deeper retest. Watch three things: whether the Coinbase premium keeps climbing on the next dip, if ETH can post a weekly close above 2,550, and whether the bid at 2473.21 comes in with any real size. A shallow pullback that holds above 2,490 would be an even stronger tell. Can the 2473 floor hold a second time, or do the sellers finally get their retest? More analysis like this is posted daily in the group, so check my bio for the way in. #Altcoin Season# #Macro Insights#
Ethereum holds 2,473 support as Coinbase premium rebounds Ethereum is trading at 2,489, basically flat on the day, but the $ETH chart is flashing a recovery pattern that has caught the attention of futures desks and on-chain trackers alike. Two data points stand out. Token Terminal shows the amount of ETH bridged to Robinhood Chain has surged 150 percent in the past month, now above 700 million. And the Coinbase Ethereum Premium has suddenly recovered, a signal traders often read as institutional accumulation during the dip. Add the Ethereum Foundation's stated plan to make ETH quantum-proof by 2029, and the longer-term narrative is firming up. The 1-hour structure remains bullish after a clean break of structure into the 2508.61 swing high. The important part is the zone just below: 2472.78 to 2473.21, where the 50 and 200 EMAs converge with the swing-low support. That level has already done its job once this window, sparking the bullish recovery that put price back into premium. Now, with price consolidating above the EMAs, the most likely path is a pullback into that same support zone before another push at 2508.61. If buyers defend 2473 again, the focus shifts to the resting liquidity above 2508.61, with a continuation zone at 2547.0. A daily close below 2472.78 invalidates the bullish structure and opens up the broader range to a deeper retest. Watch three things: whether the Coinbase premium keeps climbing on the next dip, if ETH can post a weekly close above 2,550, and whether the bid at 2473.21 comes in with any real size. A shallow pullback that holds above 2,490 would be an even stronger tell. Can the 2473 floor hold a second time, or do the sellers finally get their retest? More analysis like this is posted daily in the group, so check my bio for the way in. #Altcoin Season# #Macro Insights#
37
See translation
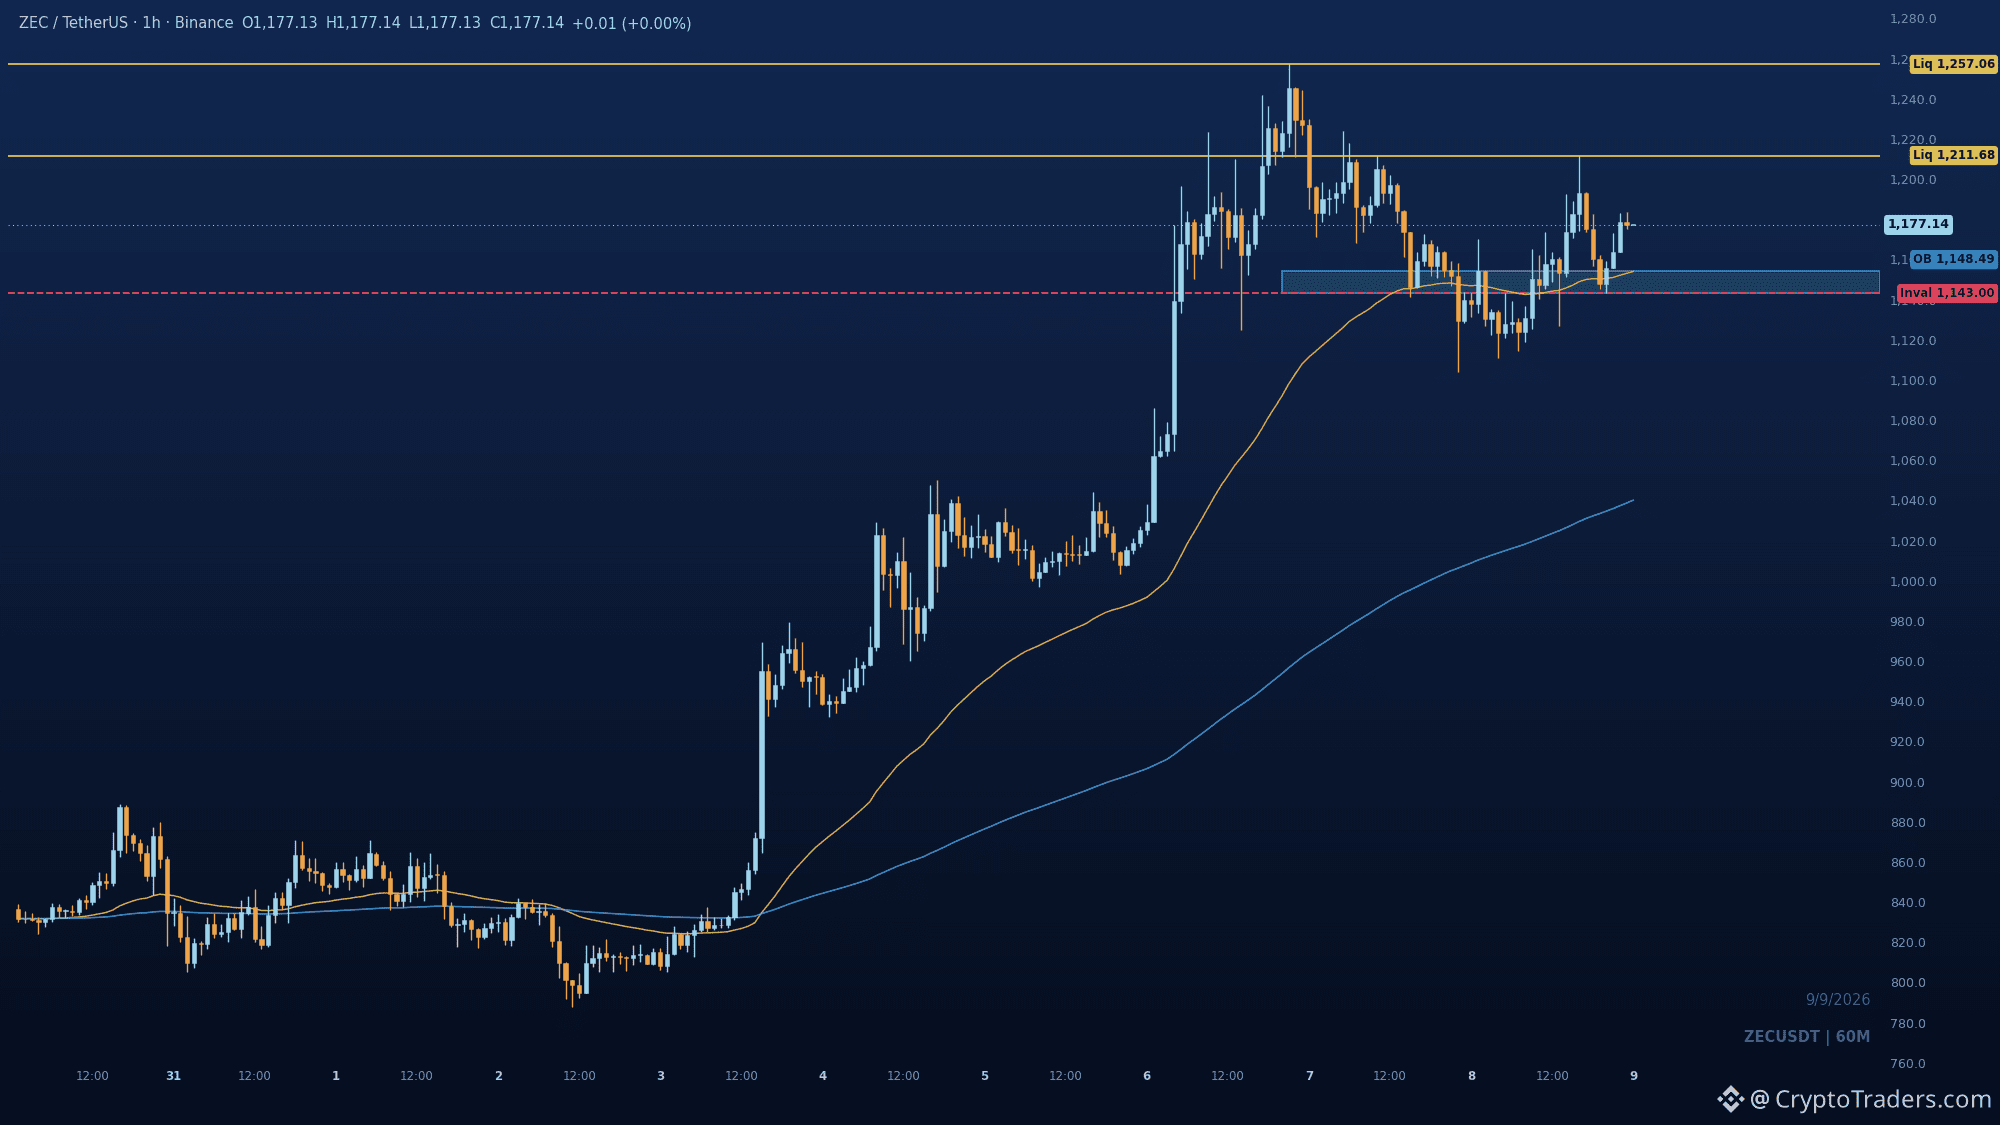
$ZEC flipped 1,143.00 into demand and reclaimed the fast EMA, and that level has already sent price flying once this window. Buyers absorbed the pullback and printed a bullish CHoCH above the 1,143.00 swing low. Next stop is the buy-side liquidity at 1,211.68, with 1,257.06 as the deeper pool if acceptance holds. A dip into the 1,153.98-1,143.00 zone is the healthy entry point for continuation. Losing 1,143.00 invalidates the bullish structure entirely. Does the liquidity above 1,211.68 get taken before the week ends? More daily chart reads in the group, check the bio for the way in. #Altcoin Season#
$ZEC flipped 1,143.00 into demand and reclaimed the fast EMA, and that level has already sent price flying once this window. Buyers absorbed the pullback and printed a bullish CHoCH above the 1,143.00 swing low. Next stop is the buy-side liquidity at 1,211.68, with 1,257.06 as the deeper pool if acceptance holds. A dip into the 1,153.98-1,143.00 zone is the healthy entry point for continuation. Losing 1,143.00 invalidates the bullish structure entirely. Does the liquidity above 1,211.68 get taken before the week ends? More daily chart reads in the group, check the bio for the way in. #Altcoin Season#
57
See translation
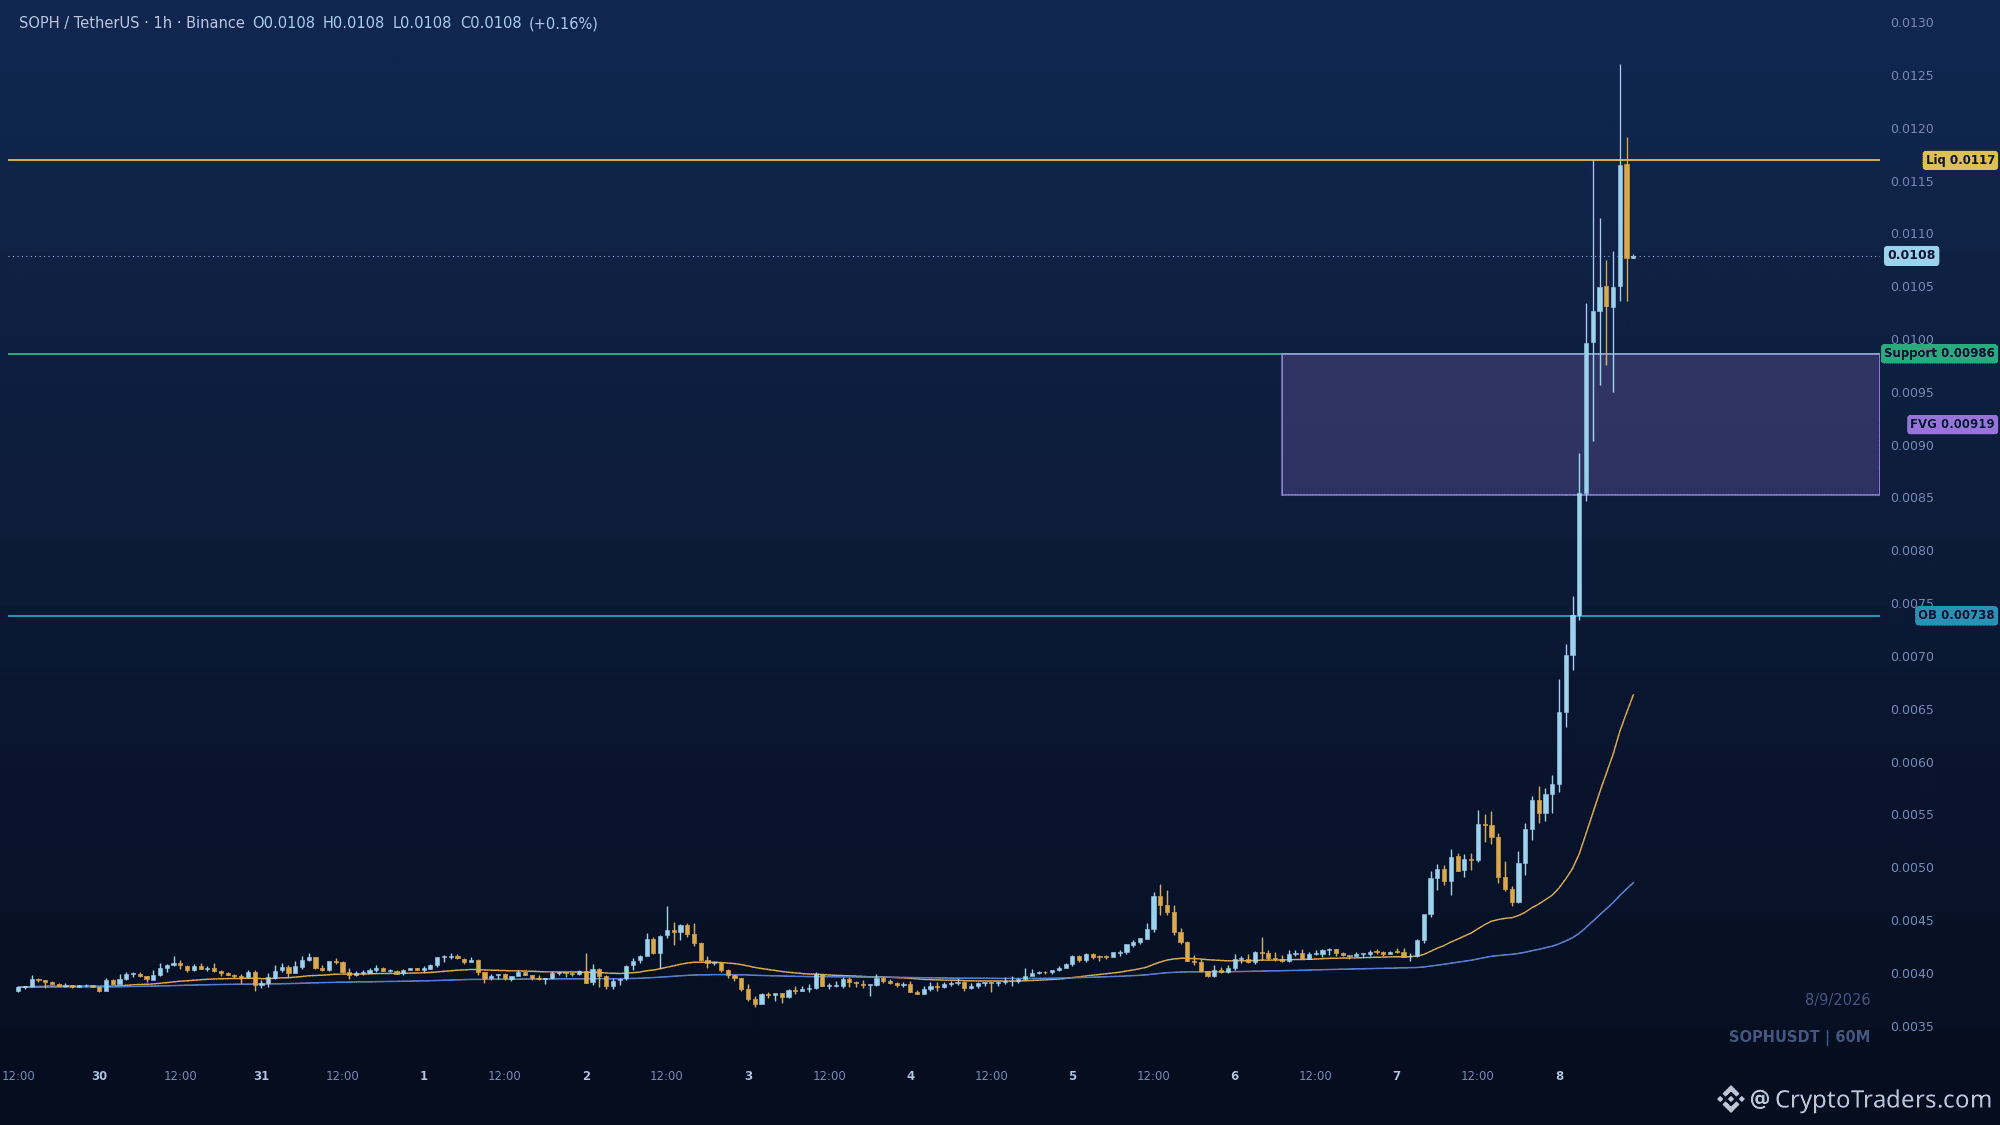
A sweep of buy-side liquidity at 0.01169 without follow-through usually means one thing: the market is about to retrace and retest. $SOPH printed that exact move. Price is now in premium after the BOS above 0.01169, and the most probable next step is a pullback into the 0.00986 support or the displacement gap at 0.00852. If that zone holds, bullish continuation is the play. A break below 0.00738 invalidates the structure entirely. What level are you watching for the retest? More chart reads like this go out daily in the group, check the bio for details. #Altcoin Season#
A sweep of buy-side liquidity at 0.01169 without follow-through usually means one thing: the market is about to retrace and retest. $SOPH printed that exact move. Price is now in premium after the BOS above 0.01169, and the most probable next step is a pullback into the 0.00986 support or the displacement gap at 0.00852. If that zone holds, bullish continuation is the play. A break below 0.00738 invalidates the structure entirely. What level are you watching for the retest? More chart reads like this go out daily in the group, check the bio for details. #Altcoin Season#
30
See translation
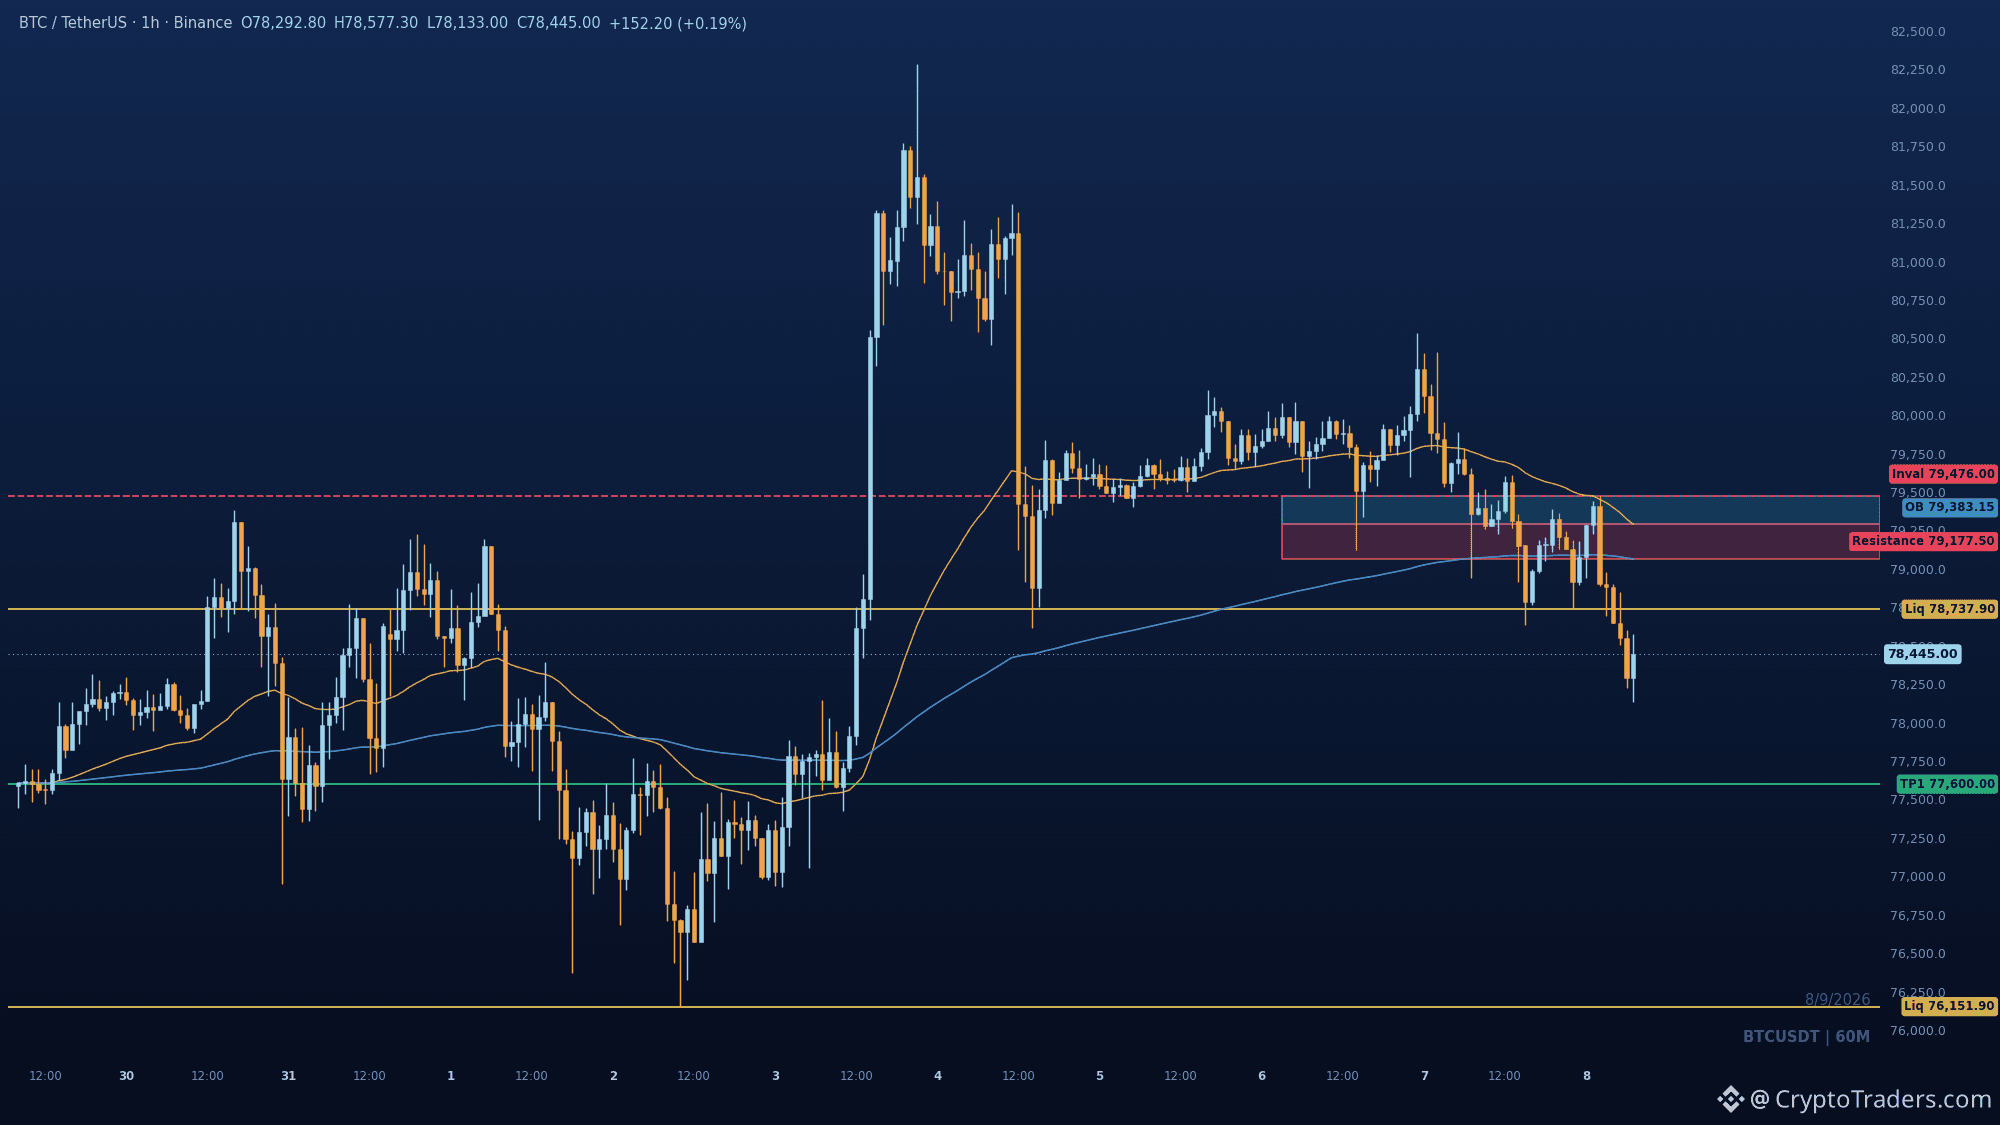
Bitcoin ETF inflows are back, but $BTC 's rebound is leaning on one fund, and that concentration is a risk. 📊 1⃣ Rebound is narrow: Spot Bitcoin ETFs pulled in 3.829 billion over three weeks after 390 million in outflows, yet IBIT alone drove 77 percent of that. In-kind creations mean reported inflows don't always equal open-market spot buys, so if IBIT demand cools without other funds stepping up, the support could thin quickly. 2⃣ Liquid's backing gap: Liquid burned 3,996 L-BTC while releasing 3,996 BTC, but a potential Elements bug may have minted already-spent tokens. Prior balances could have as little as 4.7 percent BTC coverage, making peg-outs and secondary pricing the key stress points until the backing is restored. 3⃣ Leverage elsewhere: $ZEC 's rally above 1,000 relied on Grayscale accumulation and 34.5 million in short covering, with 2.57 billion in open interest. Meanwhile, TradeXYZ is funneling 3.45 million in perp fees into spot HYPE buys, a bid that only lasts if fee generation continues. The takeaway: Bitcoin's ETF recovery is real but fragile, and the broader market is showing cracks in backing and concentrated flows. What happens to BTC if IBIT inflows stall for a week? More daily reads like this land in the community feed, and the bio points to where the group digs deeper. #BTC Price Analysis# #Bitcoin Price Prediction: What is Bitcoins next move?# #Macro Insights#
Bitcoin ETF inflows are back, but $BTC 's rebound is leaning on one fund, and that concentration is a risk. 📊 1⃣ Rebound is narrow: Spot Bitcoin ETFs pulled in 3.829 billion over three weeks after 390 million in outflows, yet IBIT alone drove 77 percent of that. In-kind creations mean reported inflows don't always equal open-market spot buys, so if IBIT demand cools without other funds stepping up, the support could thin quickly. 2⃣ Liquid's backing gap: Liquid burned 3,996 L-BTC while releasing 3,996 BTC, but a potential Elements bug may have minted already-spent tokens. Prior balances could have as little as 4.7 percent BTC coverage, making peg-outs and secondary pricing the key stress points until the backing is restored. 3⃣ Leverage elsewhere: $ZEC 's rally above 1,000 relied on Grayscale accumulation and 34.5 million in short covering, with 2.57 billion in open interest. Meanwhile, TradeXYZ is funneling 3.45 million in perp fees into spot HYPE buys, a bid that only lasts if fee generation continues. The takeaway: Bitcoin's ETF recovery is real but fragile, and the broader market is showing cracks in backing and concentrated flows. What happens to BTC if IBIT inflows stall for a week? More daily reads like this land in the community feed, and the bio points to where the group digs deeper. #BTC Price Analysis# #Bitcoin Price Prediction: What is Bitcoins next move?# #Macro Insights#
30
See translation
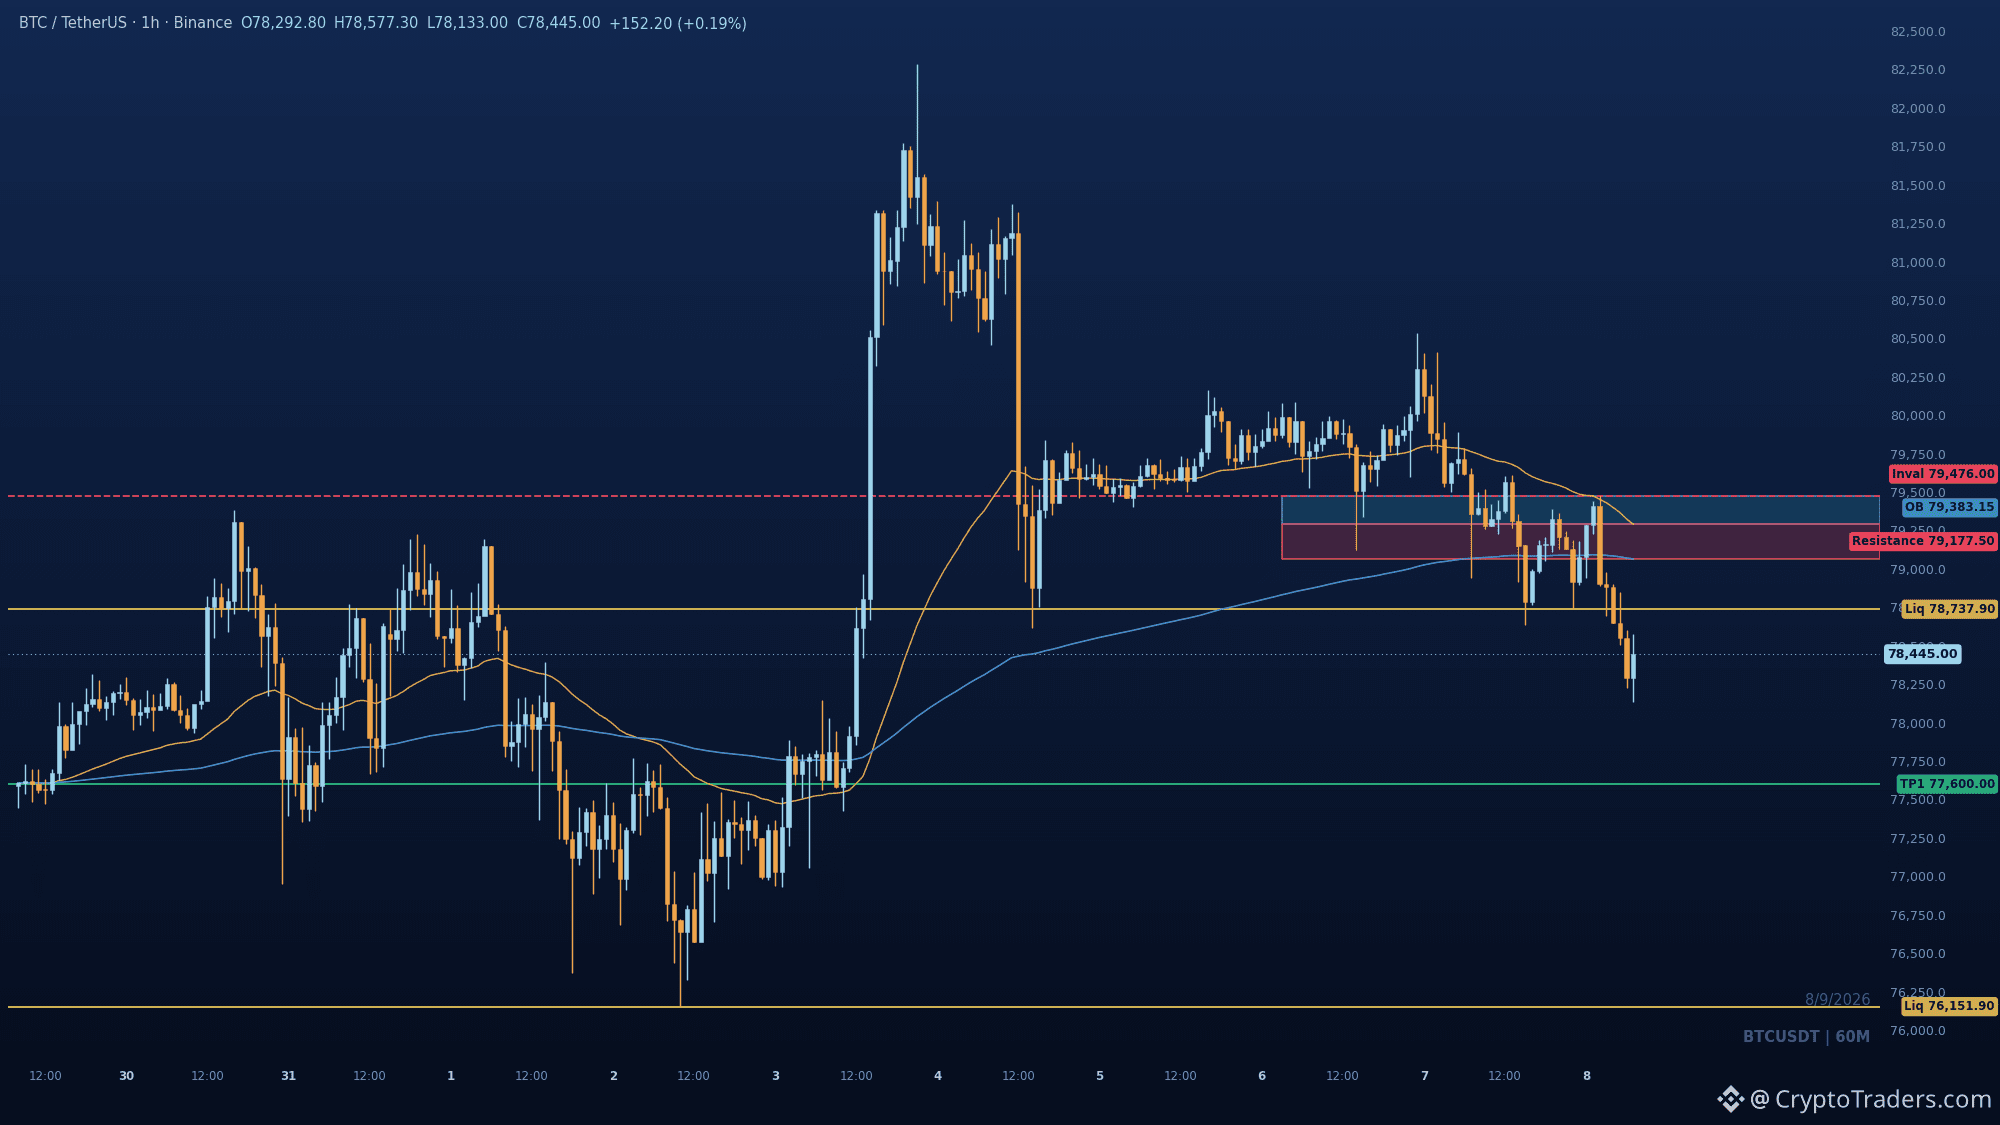
Bitcoin ETF inflows are back, but $BTC's rebound is leaning on one fund, and that concentration is a risk. 📊 1⃣ Rebound is narrow: Spot Bitcoin ETFs pulled in 3.829 billion over three weeks after 390 million in outflows, yet IBIT alone drove 77 percent of that. In-kind creations mean reported inflows don't always equal open-market spot buys, so if IBIT demand cools without other funds stepping up, the support could thin quickly. 2⃣ Liquid's backing gap: Liquid burned 3,996 L-BTC while releasing 3,996 BTC, but a potential Elements bug may have minted already-spent tokens. Prior balances could have as little as 4.7 percent BTC coverage, making peg-outs and secondary pricing the key stress points until the backing is restored. 3⃣ Leverage elsewhere: ZEC's rally above 1,000 relied on Grayscale accumulation and 34.5 million in short covering, with 2.57 billion in open interest. Meanwhile, TradeXYZ is funneling 3.45 million in perp fees into spot HYPE buys, a bid that only lasts if fee generation continues. The takeaway: Bitcoin's ETF recovery is real but fragile, and the broader market is showing cracks in backing and concentrated flows. What happens to BTC if IBIT inflows stall for a week? More daily reads like this land in the community feed, and the bio points to where the group digs deeper. #BTC Price Analysis# #Bitcoin Price Prediction: What is Bitcoins next move?# #Macro Insights#
Bitcoin ETF inflows are back, but $BTC's rebound is leaning on one fund, and that concentration is a risk. 📊 1⃣ Rebound is narrow: Spot Bitcoin ETFs pulled in 3.829 billion over three weeks after 390 million in outflows, yet IBIT alone drove 77 percent of that. In-kind creations mean reported inflows don't always equal open-market spot buys, so if IBIT demand cools without other funds stepping up, the support could thin quickly. 2⃣ Liquid's backing gap: Liquid burned 3,996 L-BTC while releasing 3,996 BTC, but a potential Elements bug may have minted already-spent tokens. Prior balances could have as little as 4.7 percent BTC coverage, making peg-outs and secondary pricing the key stress points until the backing is restored. 3⃣ Leverage elsewhere: ZEC's rally above 1,000 relied on Grayscale accumulation and 34.5 million in short covering, with 2.57 billion in open interest. Meanwhile, TradeXYZ is funneling 3.45 million in perp fees into spot HYPE buys, a bid that only lasts if fee generation continues. The takeaway: Bitcoin's ETF recovery is real but fragile, and the broader market is showing cracks in backing and concentrated flows. What happens to BTC if IBIT inflows stall for a week? More daily reads like this land in the community feed, and the bio points to where the group digs deeper. #BTC Price Analysis# #Bitcoin Price Prediction: What is Bitcoins next move?# #Macro Insights#
BTC-1.88%
IBITETF-1.66%
41
See translation
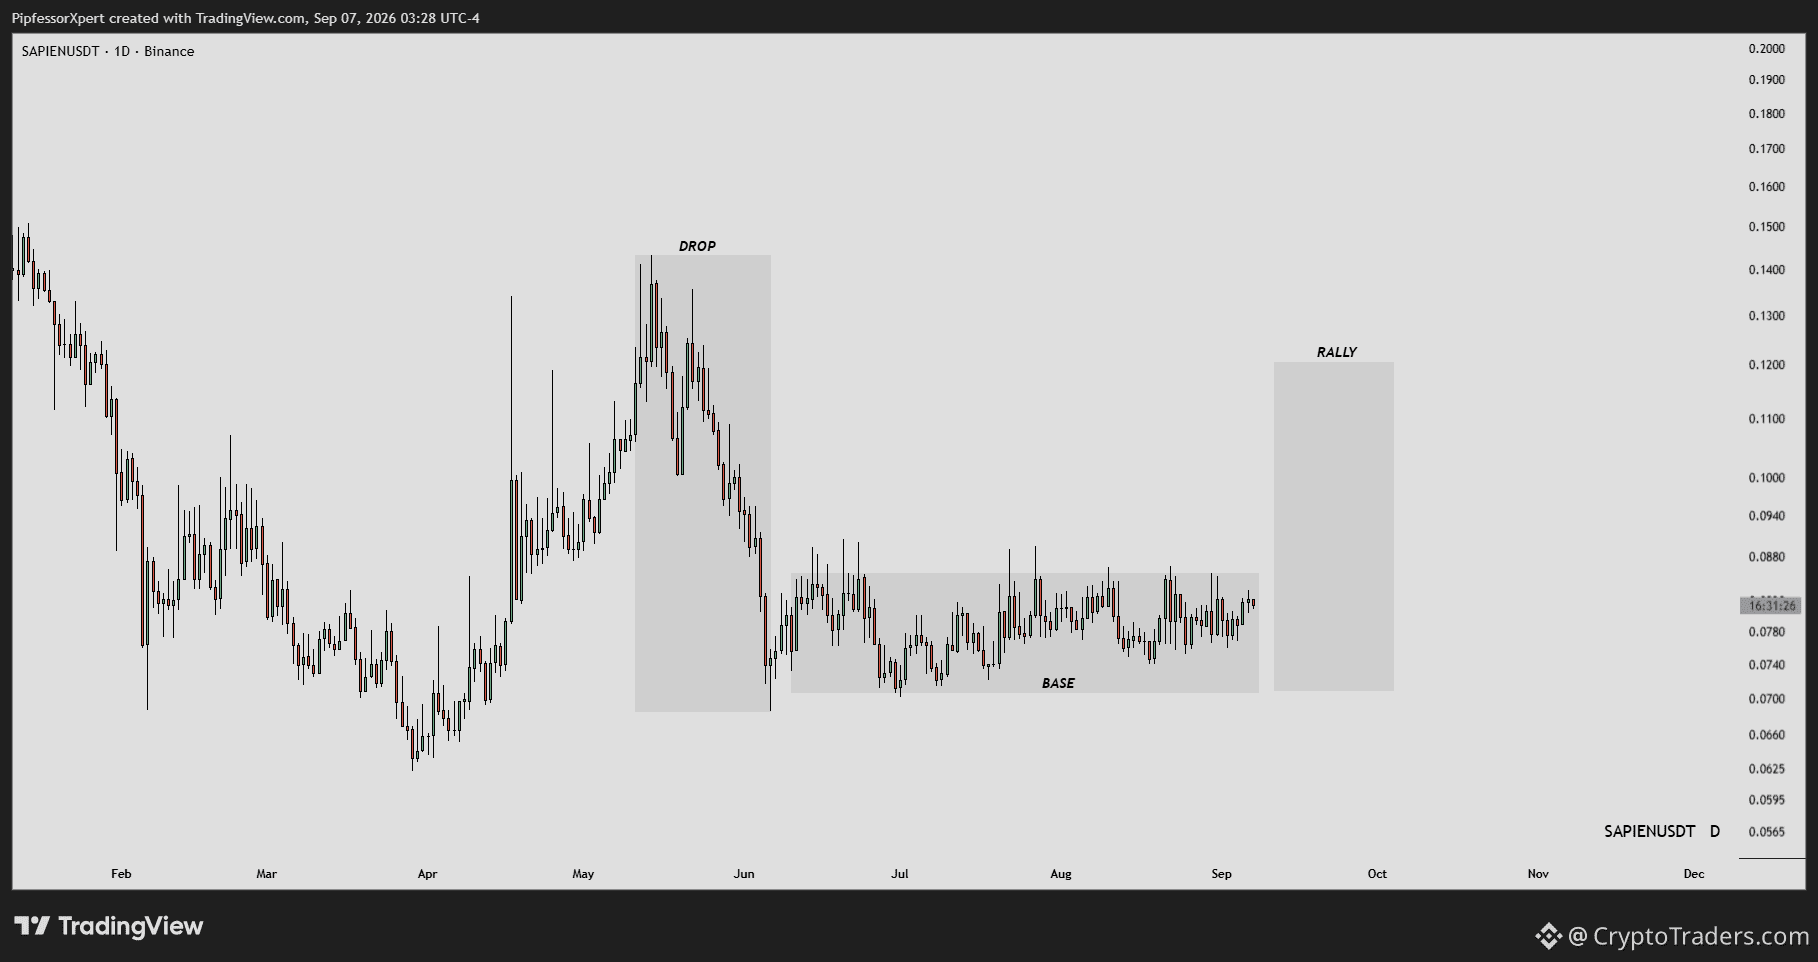
0.0816. That is the whole story on $SAPIEN, and the chart shows a textbook Drop-Base-Rally coiling up for a possible breakout. Price is grinding sideways in an accumulation phase, compressing like a spring under the surface. The base is holding steady, and a clean push above the recent consolidation high would confirm the bullish expansion. A breakdown below the base floor, though, would flip the structure and delay the rally thesis. Is this quiet accumulation the calm before the next leg up for SAPIEN? More reads like this land in the group daily - see my bio for the full picture. #Altcoin Season#
0.0816. That is the whole story on $SAPIEN, and the chart shows a textbook Drop-Base-Rally coiling up for a possible breakout. Price is grinding sideways in an accumulation phase, compressing like a spring under the surface. The base is holding steady, and a clean push above the recent consolidation high would confirm the bullish expansion. A breakdown below the base floor, though, would flip the structure and delay the rally thesis. Is this quiet accumulation the calm before the next leg up for SAPIEN? More reads like this land in the group daily - see my bio for the full picture. #Altcoin Season#
41
See translation
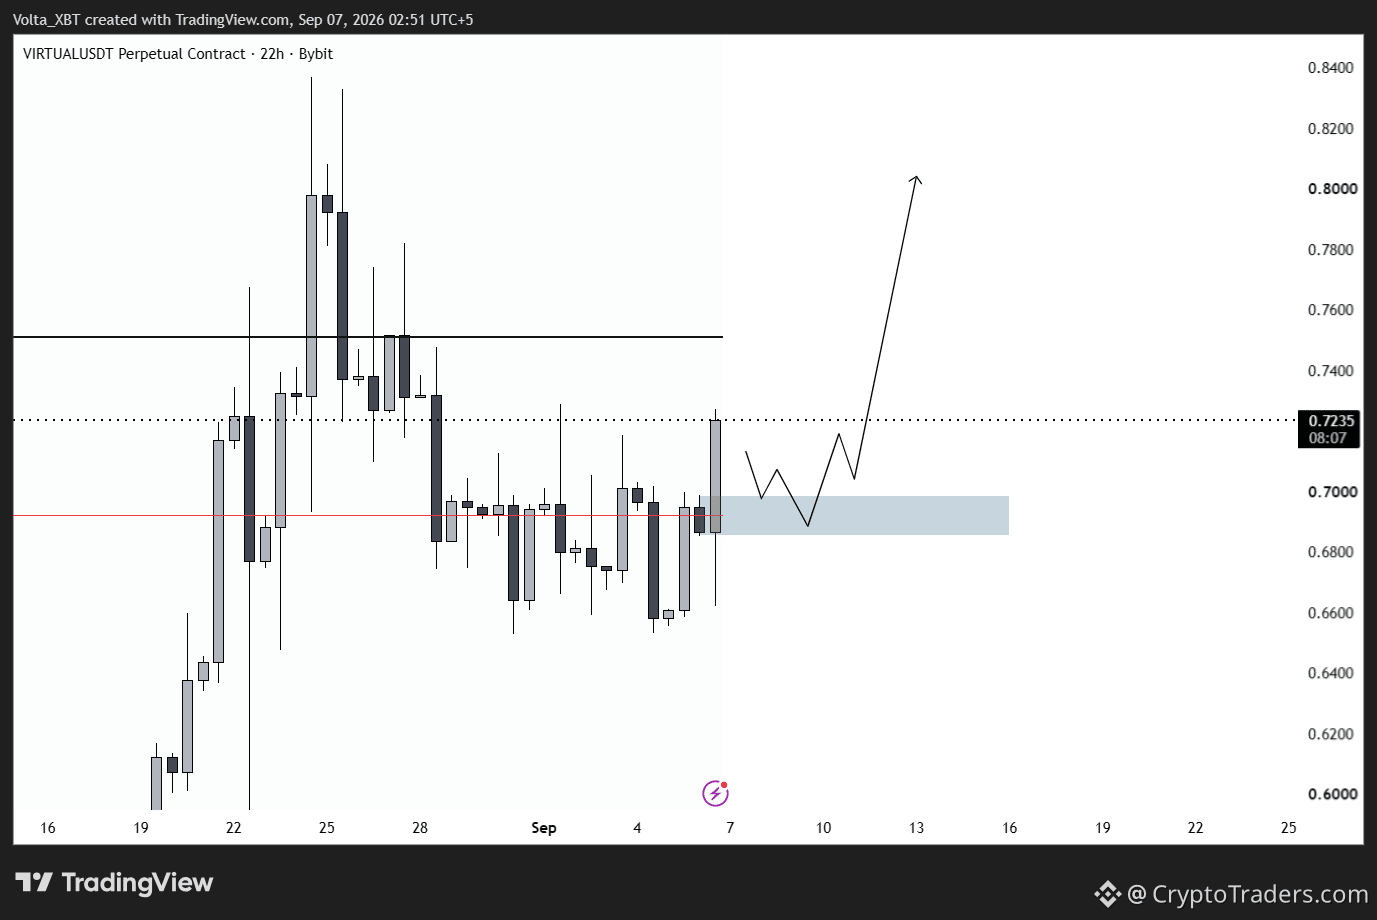
$VIRTUAL pushed 6.7% in 24h, and the chart says the squeeze is just warming up. Price is coiling in a demand zone between 0.6950 and 0.7235, with the annotated projection arrow pointing straight at 0.8000. That range low at 0.6950 is the line in the sand. A clean break above 0.7235 confirms the next leg, while losing 0.6950 flips the setup back to the 0.6800 shelf. The 22h structure shows buyers stepping in at each dip. Do you think 0.8000 prints before the week ends? More daily chart reads like this in the group - bio has the way in. #Altcoin Season#
$VIRTUAL pushed 6.7% in 24h, and the chart says the squeeze is just warming up. Price is coiling in a demand zone between 0.6950 and 0.7235, with the annotated projection arrow pointing straight at 0.8000. That range low at 0.6950 is the line in the sand. A clean break above 0.7235 confirms the next leg, while losing 0.6950 flips the setup back to the 0.6800 shelf. The 22h structure shows buyers stepping in at each dip. Do you think 0.8000 prints before the week ends? More daily chart reads like this in the group - bio has the way in. #Altcoin Season#
37
See translation
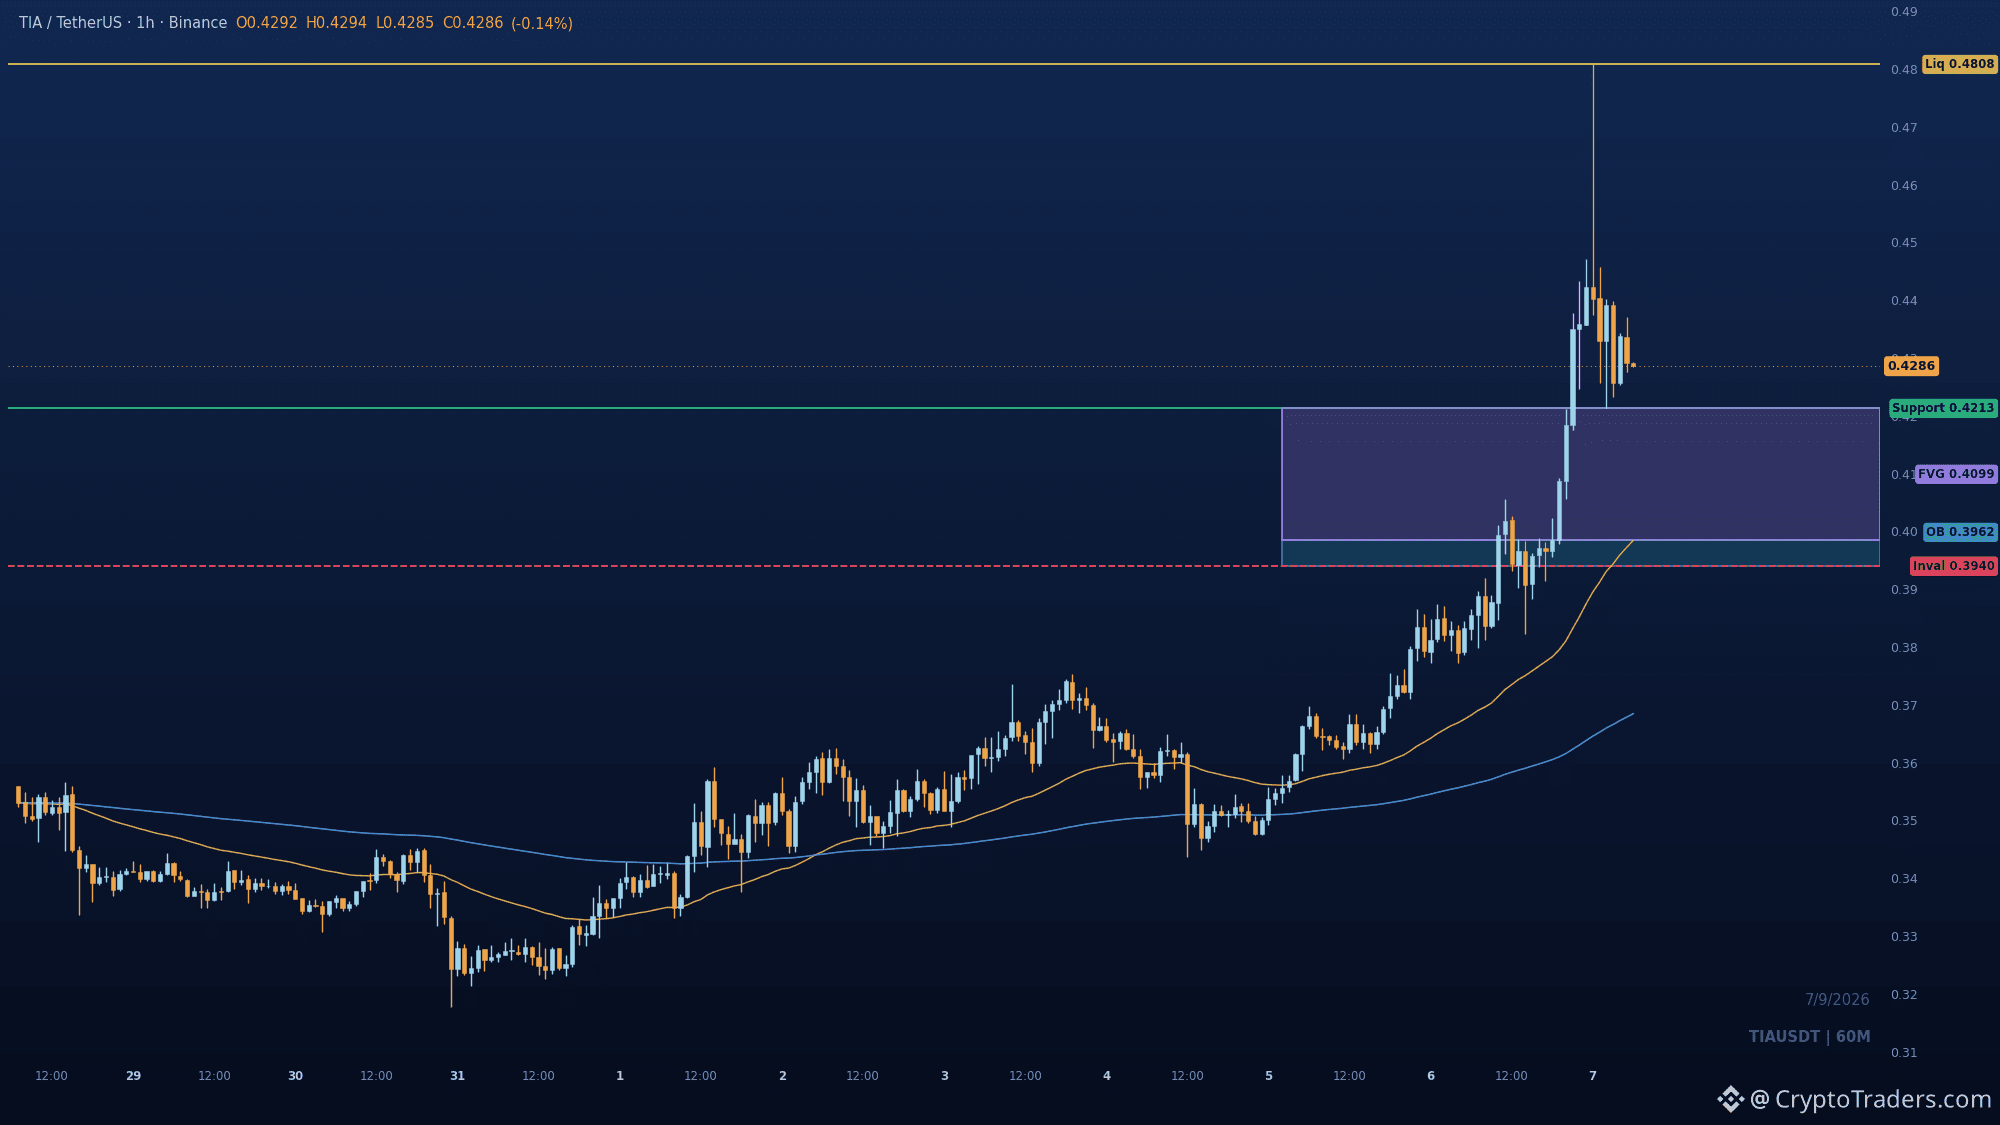
0.4808. That is the whole story on $TIA. Smart money swept that high, then started repricing lower. The bullish structure is intact: the last BOS through prior highs held, and we are now trading in premium after the rejection. Watch the 0.4213 swing support. If it defends, expect rotation back toward the 0.4808 high. Lose it, and the pullback deepens into the 0.3985 imbalance zone. Invalidation sits at 0.394, the last demand before the impulse. Does the pullback hold 0.4213 and set up another run, or does it crack into the imbalance? More reads like this land daily in the group, my bio points the way. #Altcoin Season#
0.4808. That is the whole story on $TIA. Smart money swept that high, then started repricing lower. The bullish structure is intact: the last BOS through prior highs held, and we are now trading in premium after the rejection. Watch the 0.4213 swing support. If it defends, expect rotation back toward the 0.4808 high. Lose it, and the pullback deepens into the 0.3985 imbalance zone. Invalidation sits at 0.394, the last demand before the impulse. Does the pullback hold 0.4213 and set up another run, or does it crack into the imbalance? More reads like this land daily in the group, my bio points the way. #Altcoin Season#
55
See translation
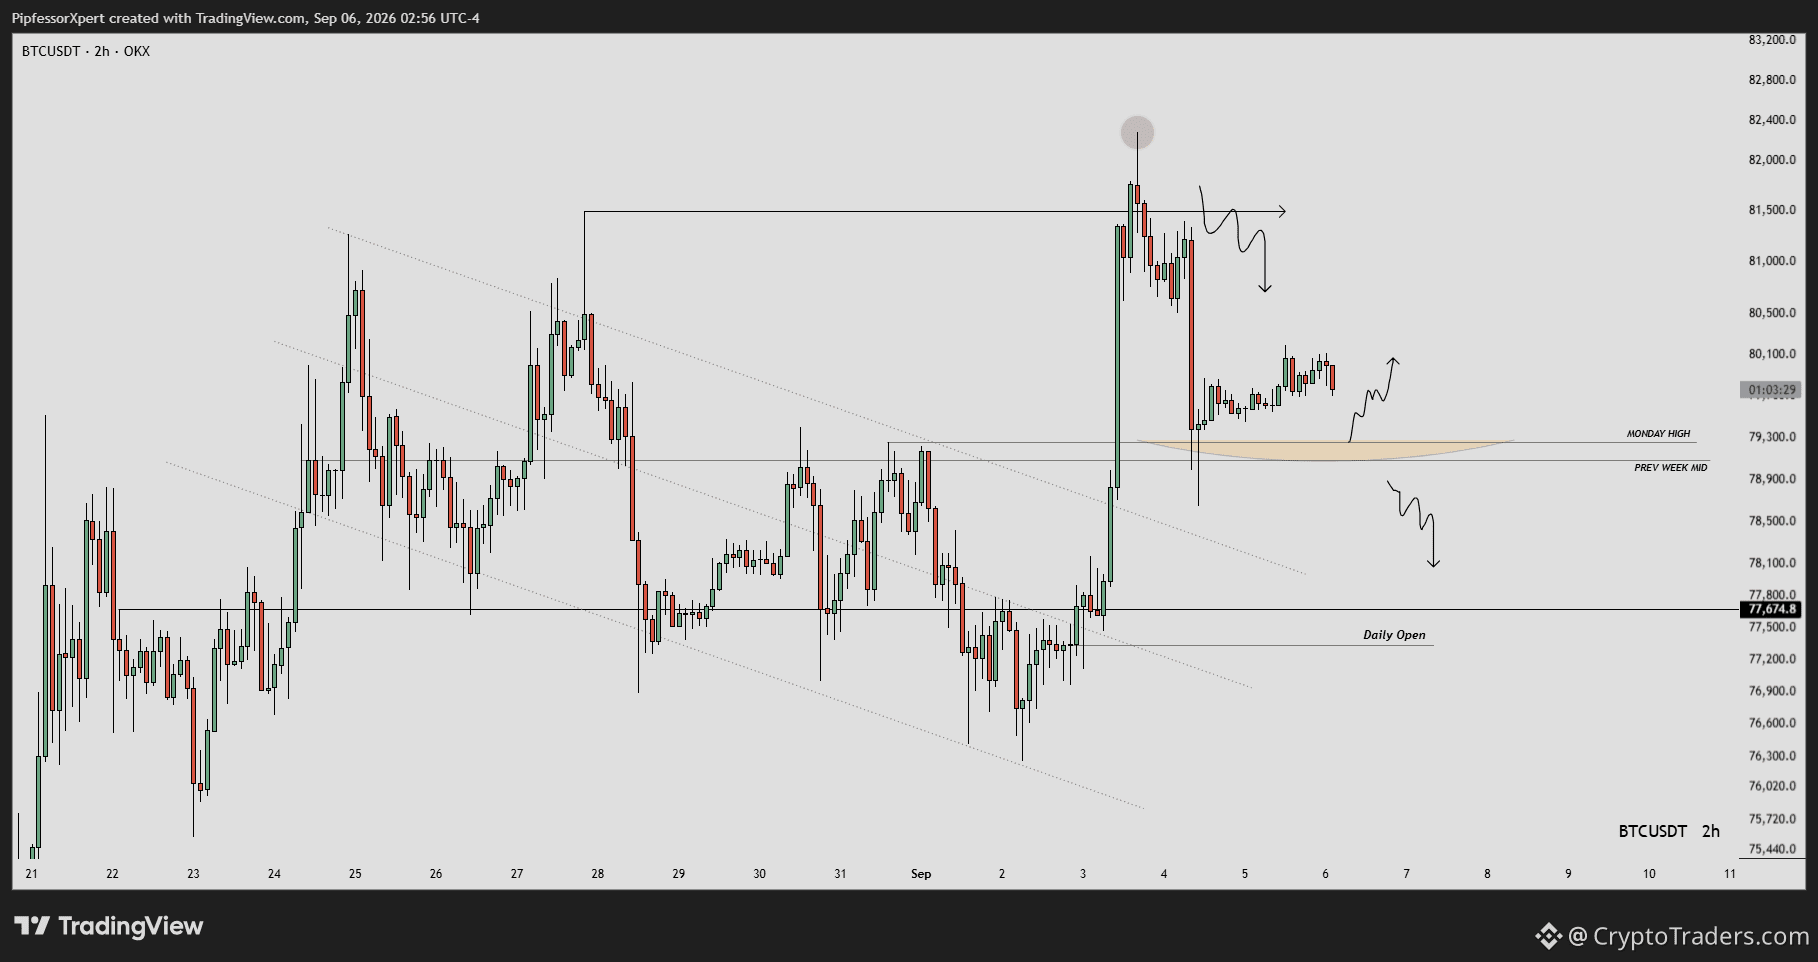
$BTC reclaimed Monday's high after the liquidity sweep, but the standoff is whether it holds this zone or loses it to the daily open. The 2h chart shows price rejected near 82,000, then consolidated above the Monday High and Prev Week Mid cluster around 79,300. Sustaining this area sets up a bounce toward 81,500. Losing it opens the path to the daily open support near 77,500. What level are you watching for the next move? More reads like this posted daily in the group, check the bio. #BTC Price Analysis# #Bitcoin Price Prediction: What is Bitcoins next move?#
$BTC reclaimed Monday's high after the liquidity sweep, but the standoff is whether it holds this zone or loses it to the daily open. The 2h chart shows price rejected near 82,000, then consolidated above the Monday High and Prev Week Mid cluster around 79,300. Sustaining this area sets up a bounce toward 81,500. Losing it opens the path to the daily open support near 77,500. What level are you watching for the next move? More reads like this posted daily in the group, check the bio. #BTC Price Analysis# #Bitcoin Price Prediction: What is Bitcoins next move?#
69
See translation
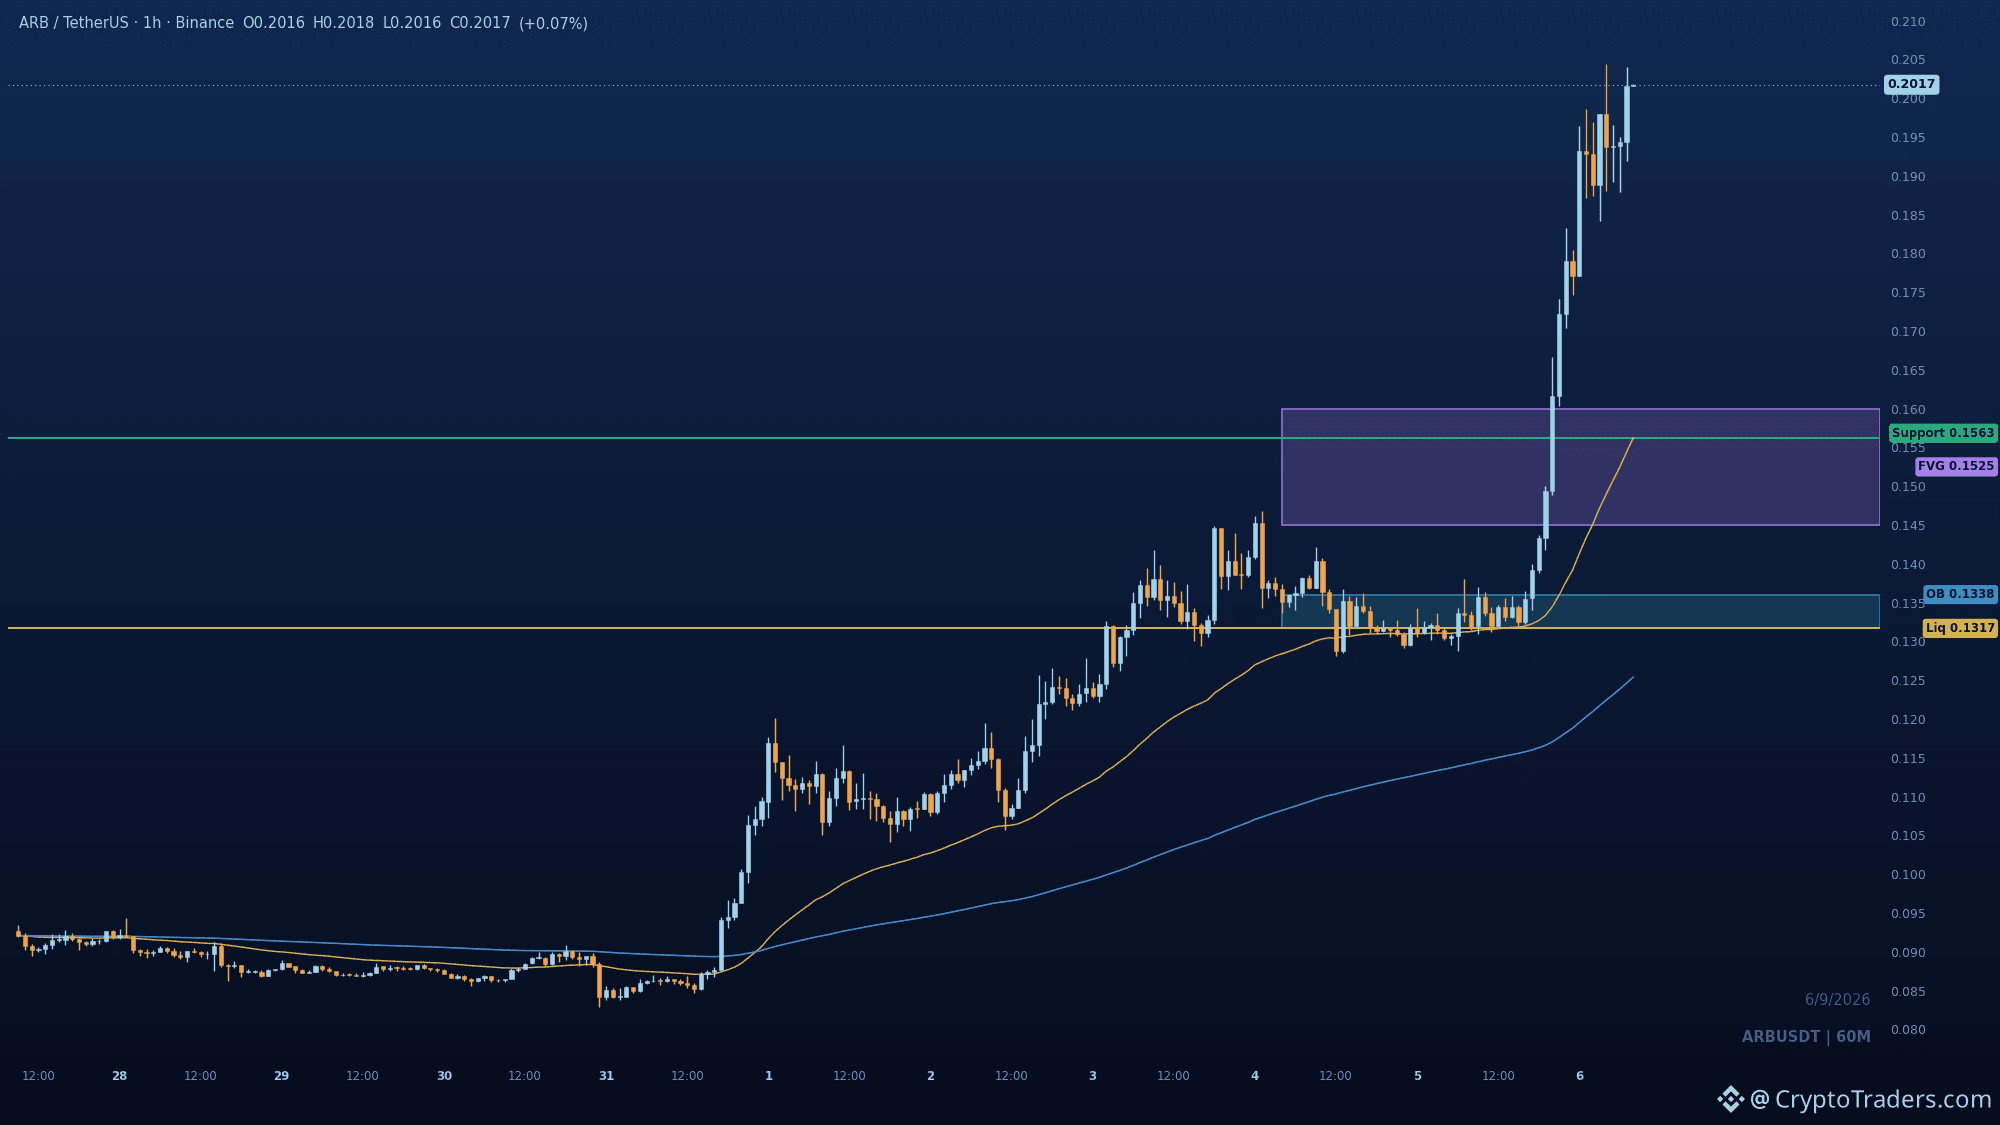
The anomaly on $ARB isn't the 51% rip, it's that the breakout through 0.20436 happened with no pause to test the old range high, leaving the shelf untested. Structure is bullish after the sweep of 0.13169, and the 0.145-0.160 imbalance zone is the magnet for any pullback. Watch 0.15626 as the dynamic floor; a dip there with bids defending keeps the expansion narrative alive. Invalidation sits at 0.13169, a break below that flips the entire impulse into a failed move. Is the 0.20436 breakout real, or does price need to retrace into the imbalance before you trust it? More reads like this land daily in the group, check the bio for the link. #Altcoin Season#
The anomaly on $ARB isn't the 51% rip, it's that the breakout through 0.20436 happened with no pause to test the old range high, leaving the shelf untested. Structure is bullish after the sweep of 0.13169, and the 0.145-0.160 imbalance zone is the magnet for any pullback. Watch 0.15626 as the dynamic floor; a dip there with bids defending keeps the expansion narrative alive. Invalidation sits at 0.13169, a break below that flips the entire impulse into a failed move. Is the 0.20436 breakout real, or does price need to retrace into the imbalance before you trust it? More reads like this land daily in the group, check the bio for the link. #Altcoin Season#
28
See translation
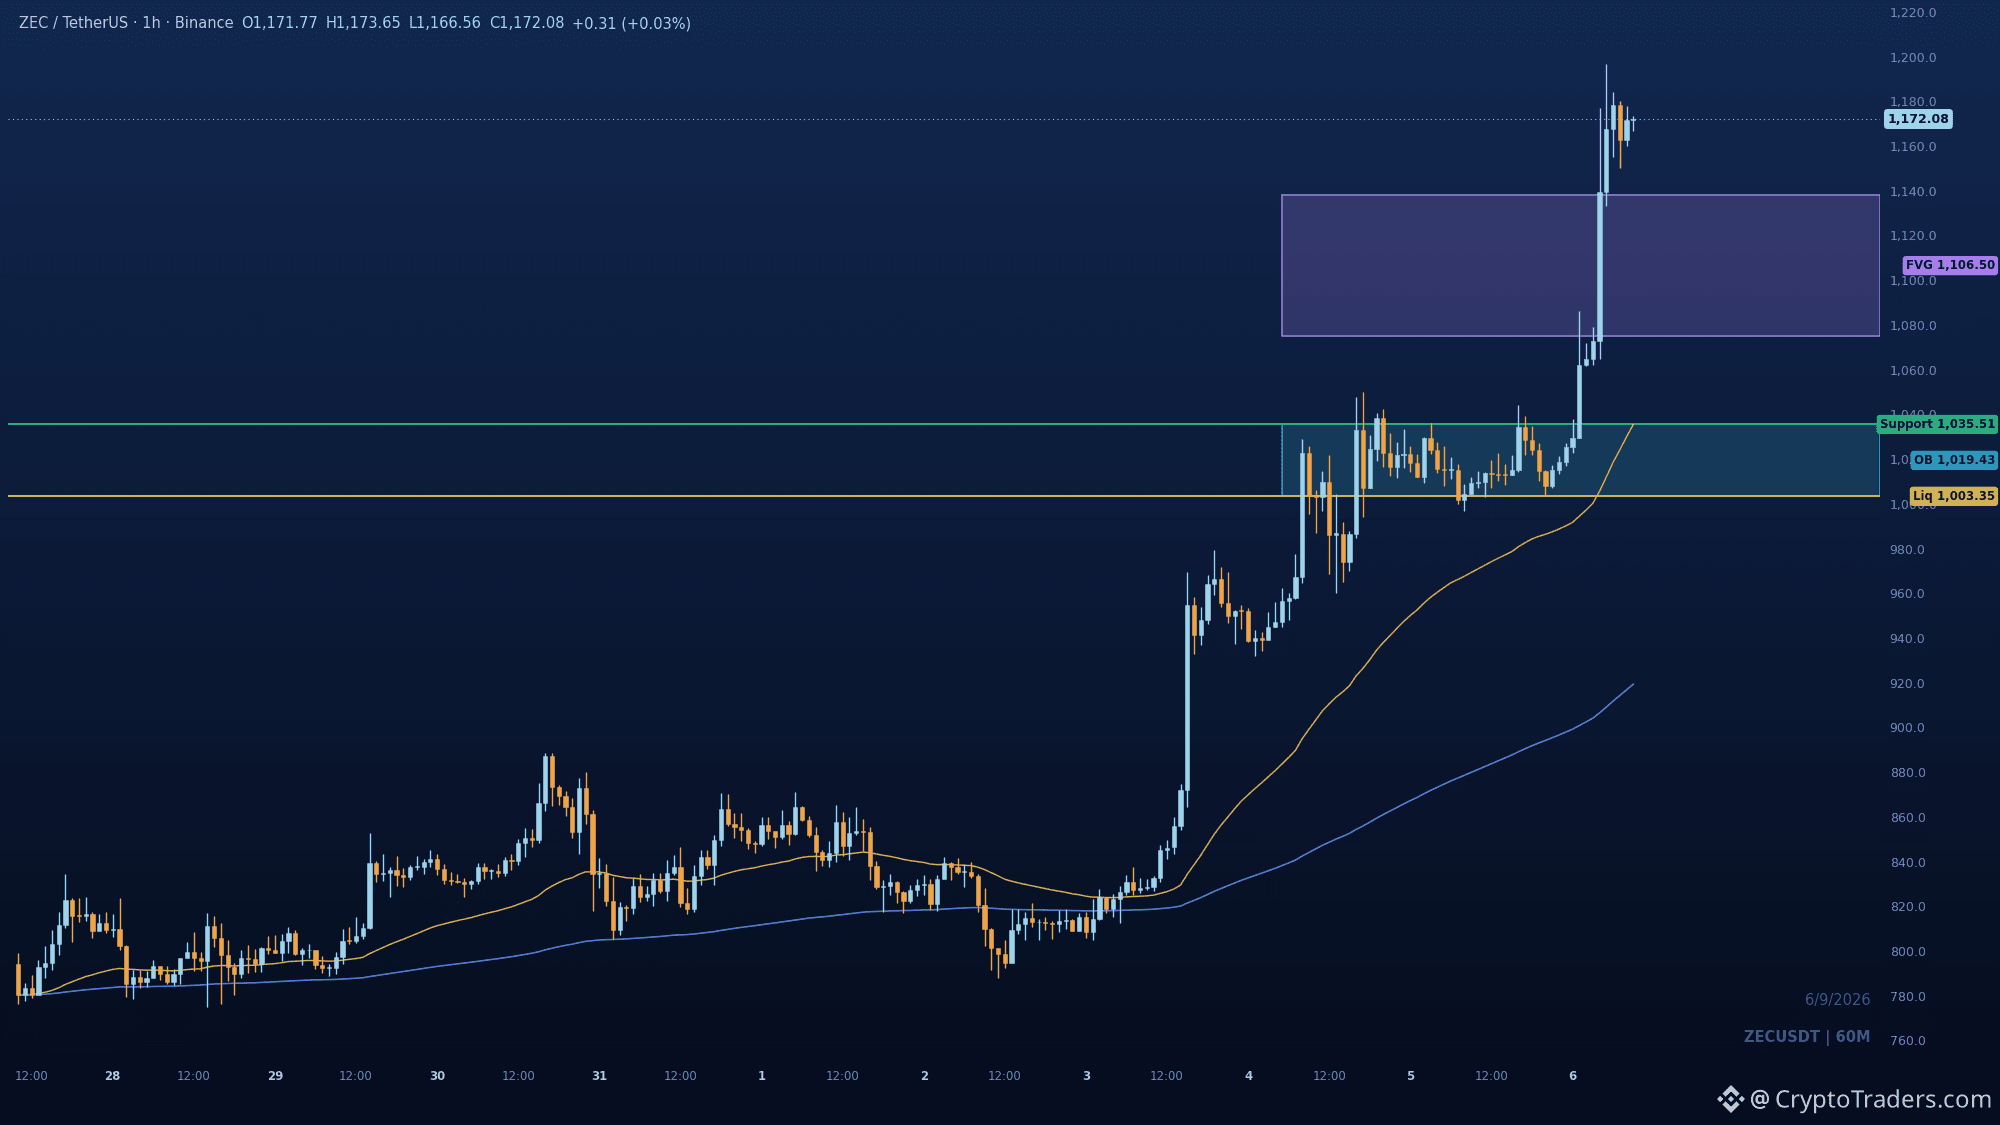
The $ZEC breakout above 1138 printed a clean BOS into new highs, but the real tell is whether the pullback holds the imbalance or folds into the demand base. The 1h chart shows displacement through prior supply, leaving a 1075-1138 imbalance beneath. That zone is the first place a healthy retrace should find bids. Above 1196.5, the move extends and the breakout base at 1003.35-1035.51 stays protected. A close back under 1003.35 would flip the script and signal the breakout was a trap. With price extended near the high, chasing here is the risk. The cleaner read is a controlled dip into the imbalance, then a defend of that area for another leg up. What would you need to see before you trusted a pullback to 1075-1138 as a buy zone versus a deeper flush? The group gets a chart read like this every morning, and we break down the levels together. #Altcoin Season#
The $ZEC breakout above 1138 printed a clean BOS into new highs, but the real tell is whether the pullback holds the imbalance or folds into the demand base. The 1h chart shows displacement through prior supply, leaving a 1075-1138 imbalance beneath. That zone is the first place a healthy retrace should find bids. Above 1196.5, the move extends and the breakout base at 1003.35-1035.51 stays protected. A close back under 1003.35 would flip the script and signal the breakout was a trap. With price extended near the high, chasing here is the risk. The cleaner read is a controlled dip into the imbalance, then a defend of that area for another leg up. What would you need to see before you trusted a pullback to 1075-1138 as a buy zone versus a deeper flush? The group gets a chart read like this every morning, and we break down the levels together. #Altcoin Season#
42
See translation
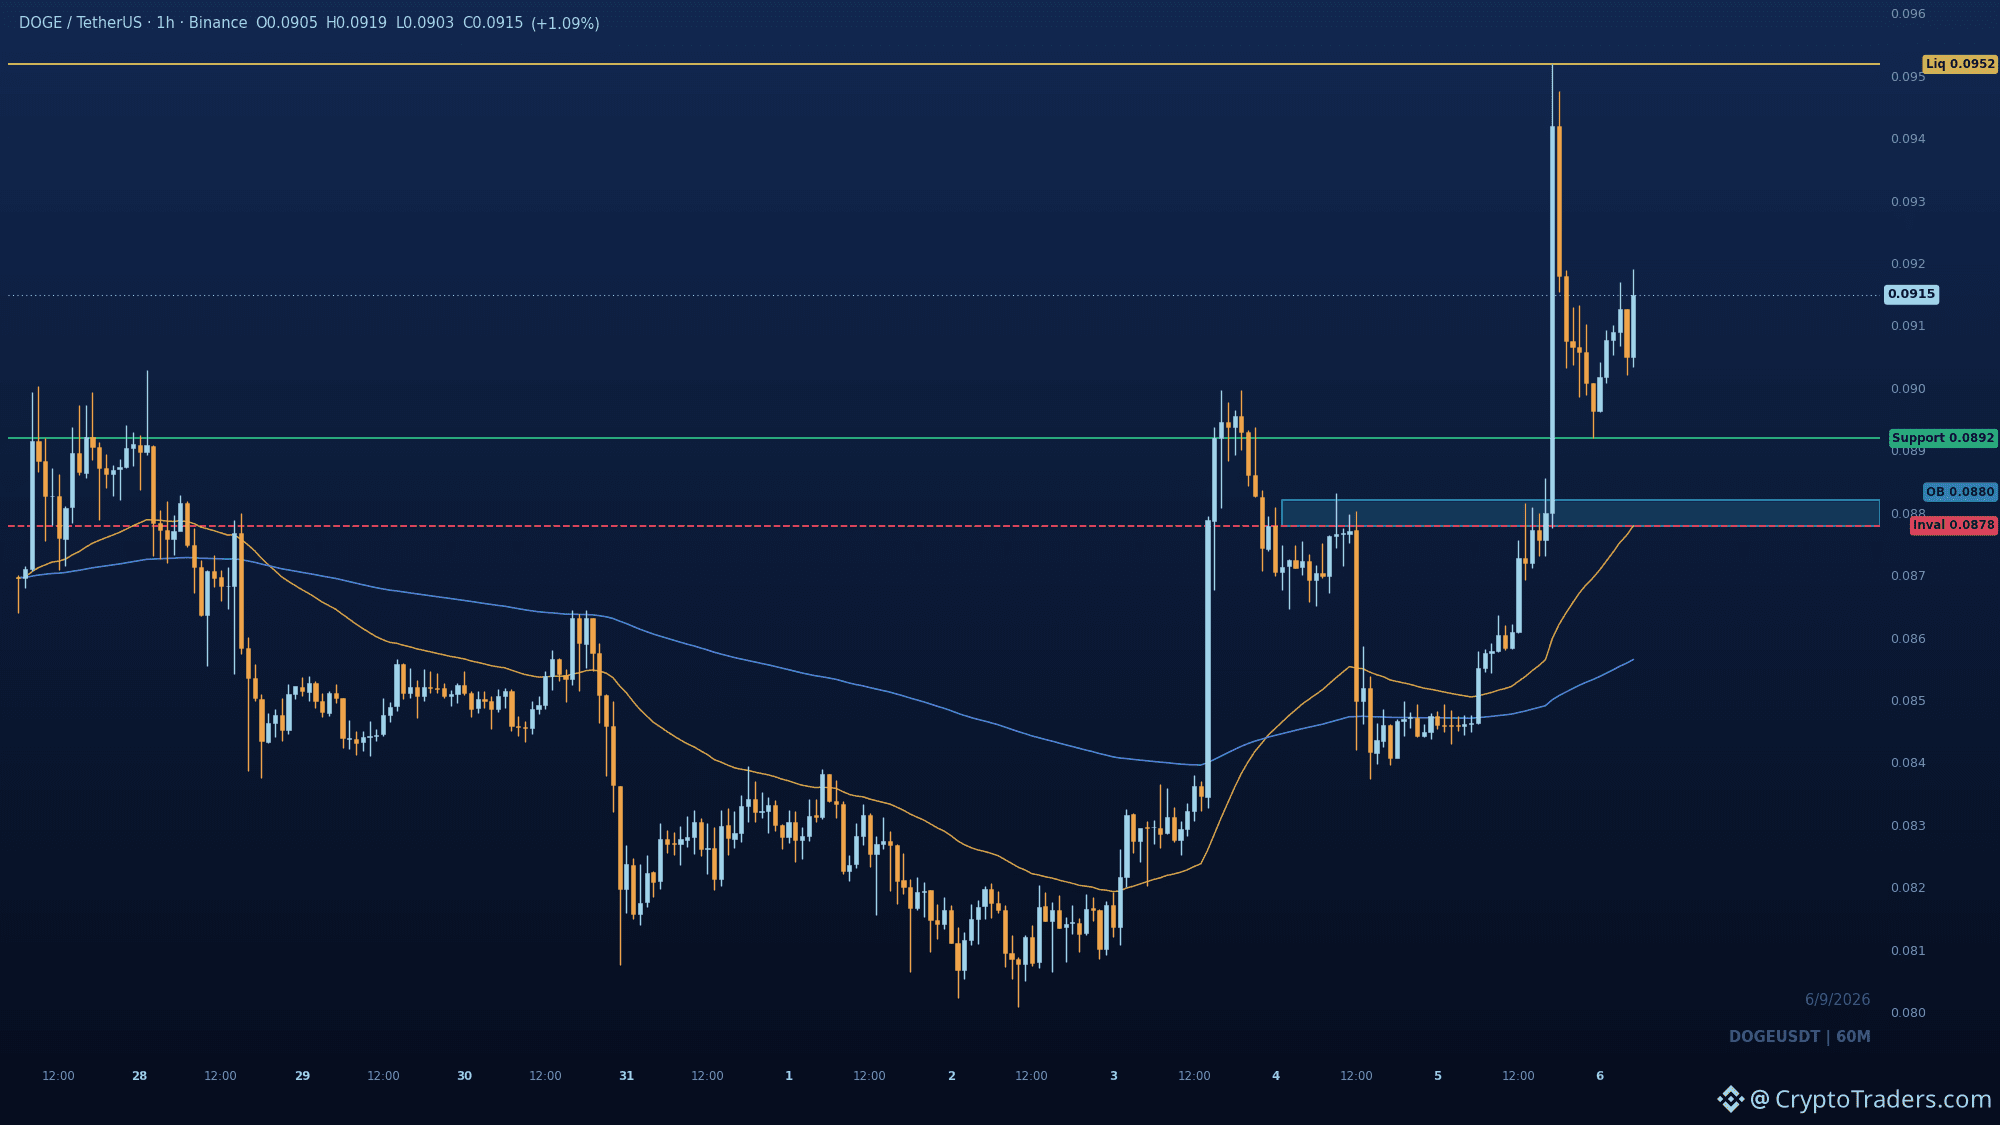
$DOGE sits at a crossroads between 0.08919 support and the 0.09518 liquidity pool, and the market has yet to pick a side. The break above prior supply was clean, and the pullback held premium, a sign buyers are still in control. As long as price stays above the reclaimed 0.08919 swing, the path toward 0.09518 remains open; a deeper dip into 0.08779-0.08820 would offer a cleaner rotation point. A close below 0.08779 would invalidate the bullish structure entirely. Which side do you think wins this standoff? More daily chart reads like this go out in the group, check the bio for the link. #Altcoin Season#
$DOGE sits at a crossroads between 0.08919 support and the 0.09518 liquidity pool, and the market has yet to pick a side. The break above prior supply was clean, and the pullback held premium, a sign buyers are still in control. As long as price stays above the reclaimed 0.08919 swing, the path toward 0.09518 remains open; a deeper dip into 0.08779-0.08820 would offer a cleaner rotation point. A close below 0.08779 would invalidate the bullish structure entirely. Which side do you think wins this standoff? More daily chart reads like this go out in the group, check the bio for the link. #Altcoin Season#
57
See translation
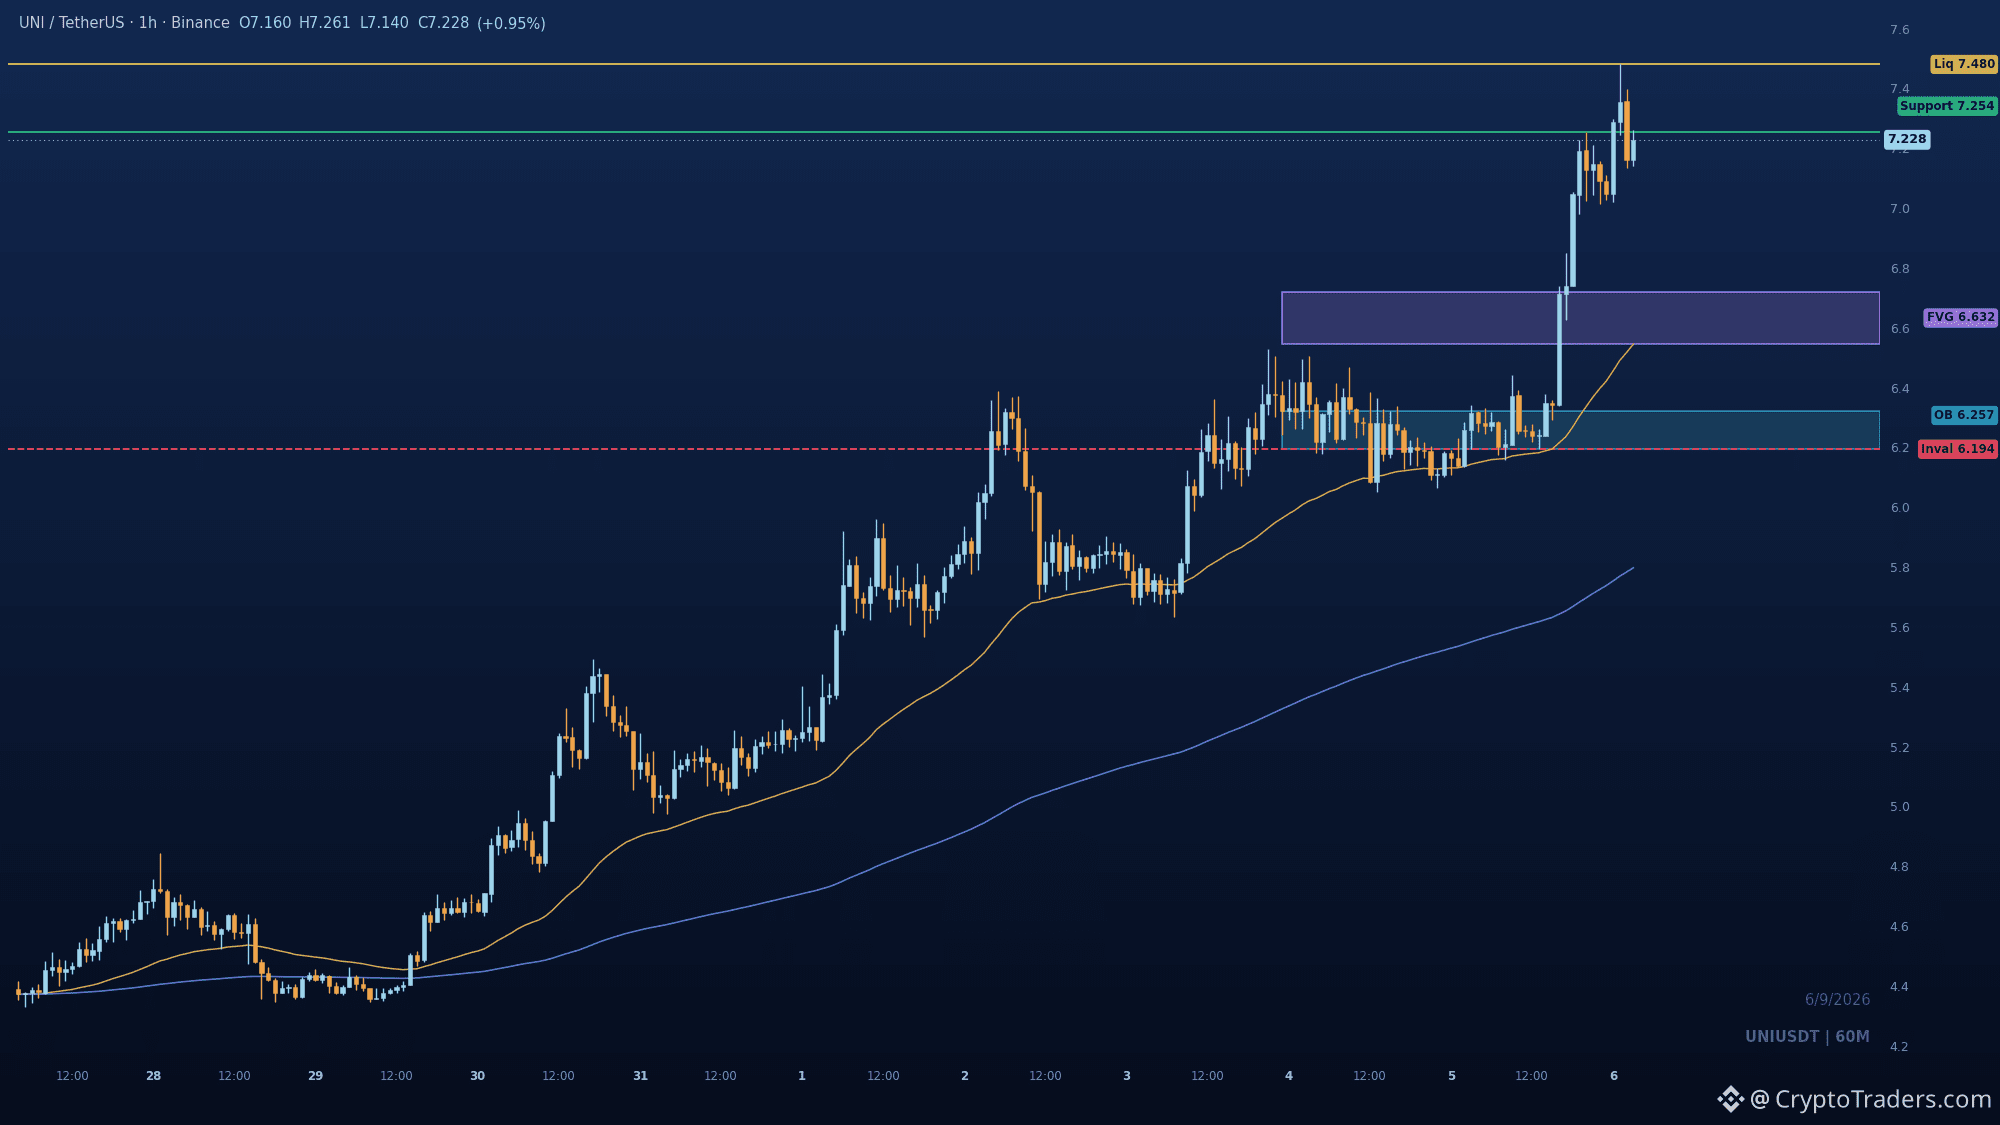
$UNI's 14.4% push into 7.48 liquidity looks strong, but the real test is whether the pullback holds. The breakout through 7.254 flipped prior resistance into support. A clean retest of that zone, or deeper into the 6.72-6.545 imbalance, would set up the next leg. What I need to see: buyers defending 6.72 without a full retrace to 6.194. If 7.254 gets reclaimed after that, the expansion likely continues. A close back under 6.194 would kill the bullish structure entirely. Are you watching for the retest or waiting for a reclaim above 7.48? More daily chart reads like this in the group, check the bio for details. #Altcoin Season#
$UNI's 14.4% push into 7.48 liquidity looks strong, but the real test is whether the pullback holds. The breakout through 7.254 flipped prior resistance into support. A clean retest of that zone, or deeper into the 6.72-6.545 imbalance, would set up the next leg. What I need to see: buyers defending 6.72 without a full retrace to 6.194. If 7.254 gets reclaimed after that, the expansion likely continues. A close back under 6.194 would kill the bullish structure entirely. Are you watching for the retest or waiting for a reclaim above 7.48? More daily chart reads like this in the group, check the bio for details. #Altcoin Season#
91
See translation
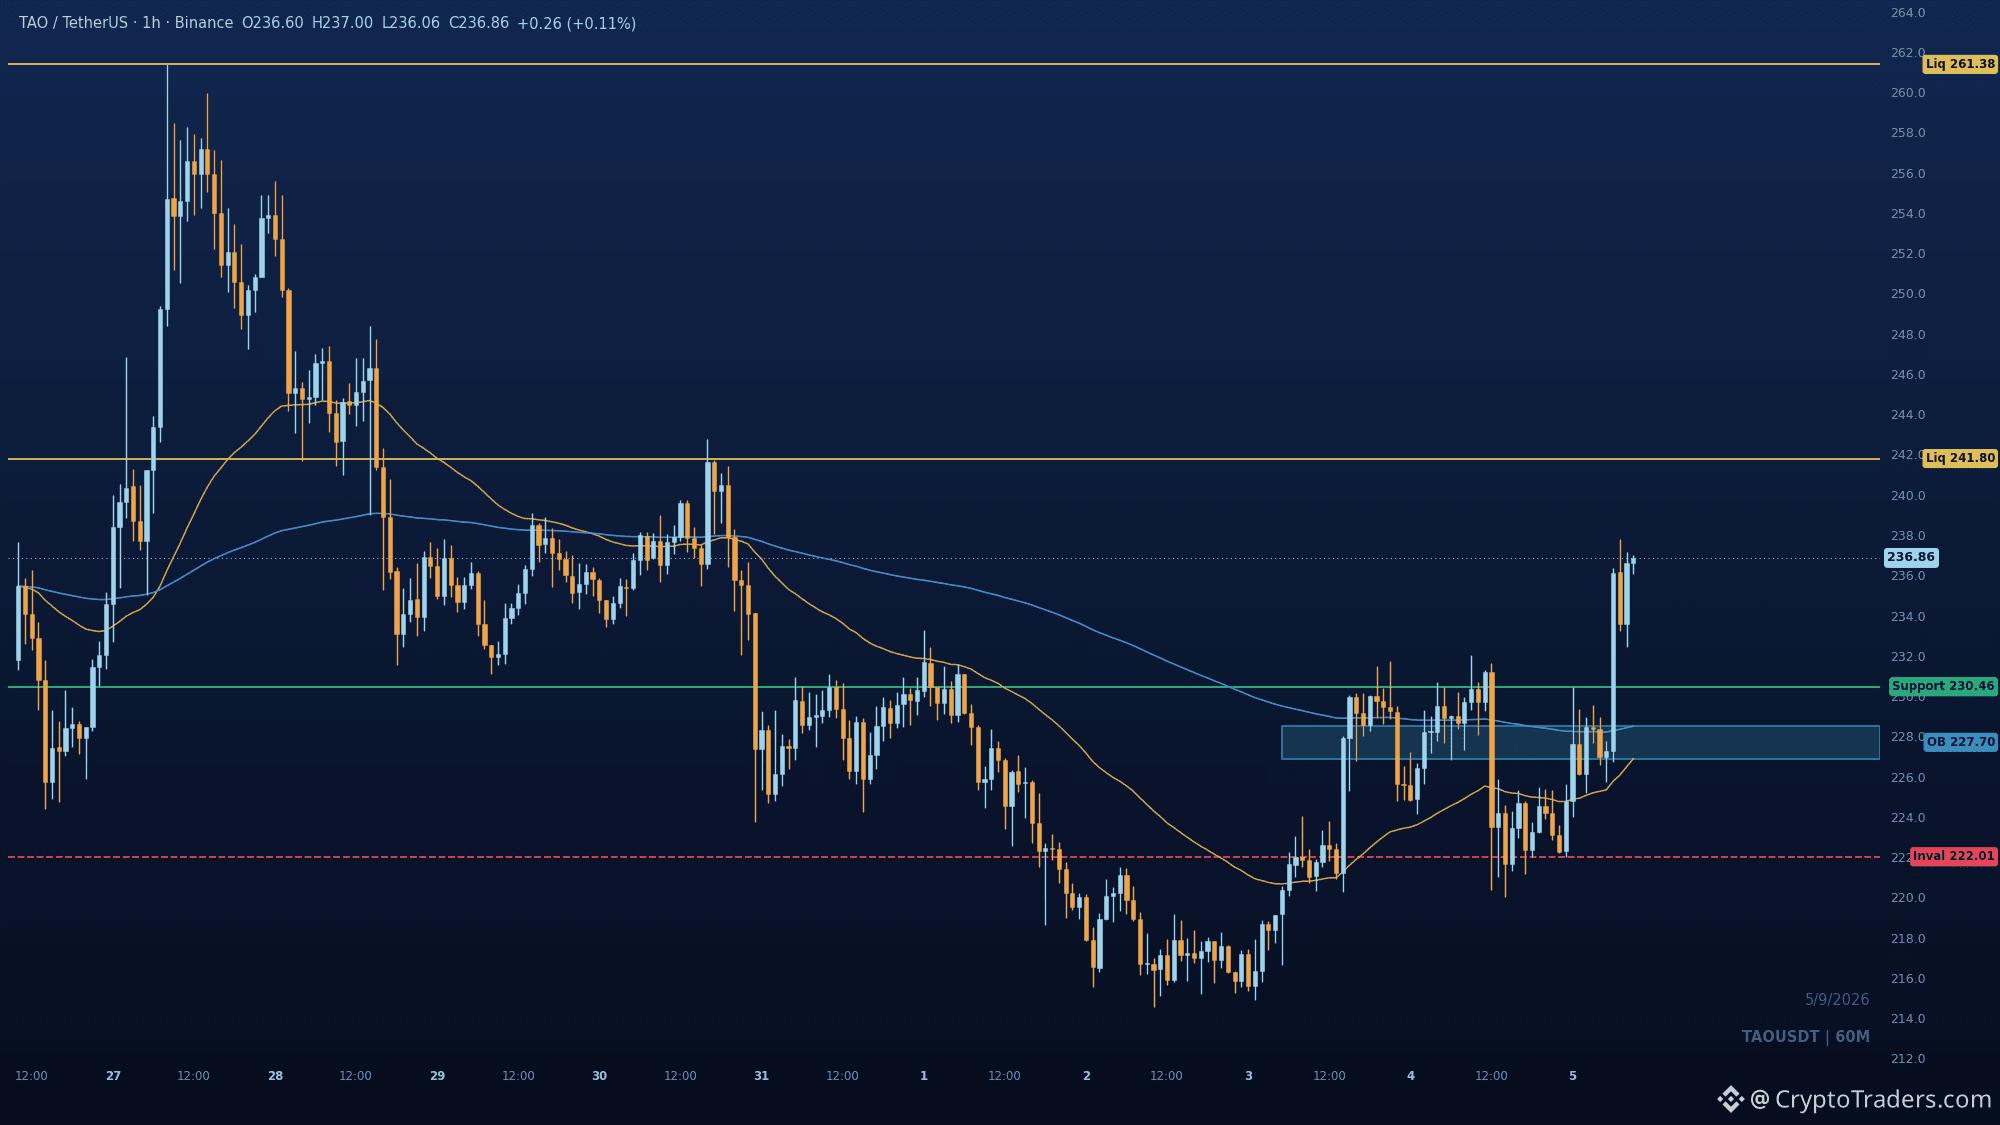
$TAO earns the watchlist slot today because the sweep below 214.57 and reclaim of 230.46 flipped the intraday script from distribution to accumulation. The 1h chart shows a clean CHoCH above 230.46 after price absorbed sell-side liquidity near the range low. That zone is now the line in the sand: hold it and the path toward 241.8 stays open, lose it and the bullish case stalls. Pullbacks into the 228.51-226.89 order block are the natural launch pad for the next leg up, with invalidation sitting at 222.01. If 230.46 fails to defend, do we fade back into the 222 area or does the sweep below 214.57 become the real bottom? One of several charts the desk breaks down for the group daily. #Altcoin Season#
$TAO earns the watchlist slot today because the sweep below 214.57 and reclaim of 230.46 flipped the intraday script from distribution to accumulation. The 1h chart shows a clean CHoCH above 230.46 after price absorbed sell-side liquidity near the range low. That zone is now the line in the sand: hold it and the path toward 241.8 stays open, lose it and the bullish case stalls. Pullbacks into the 228.51-226.89 order block are the natural launch pad for the next leg up, with invalidation sitting at 222.01. If 230.46 fails to defend, do we fade back into the 222 area or does the sweep below 214.57 become the real bottom? One of several charts the desk breaks down for the group daily. #Altcoin Season#
27
See translation
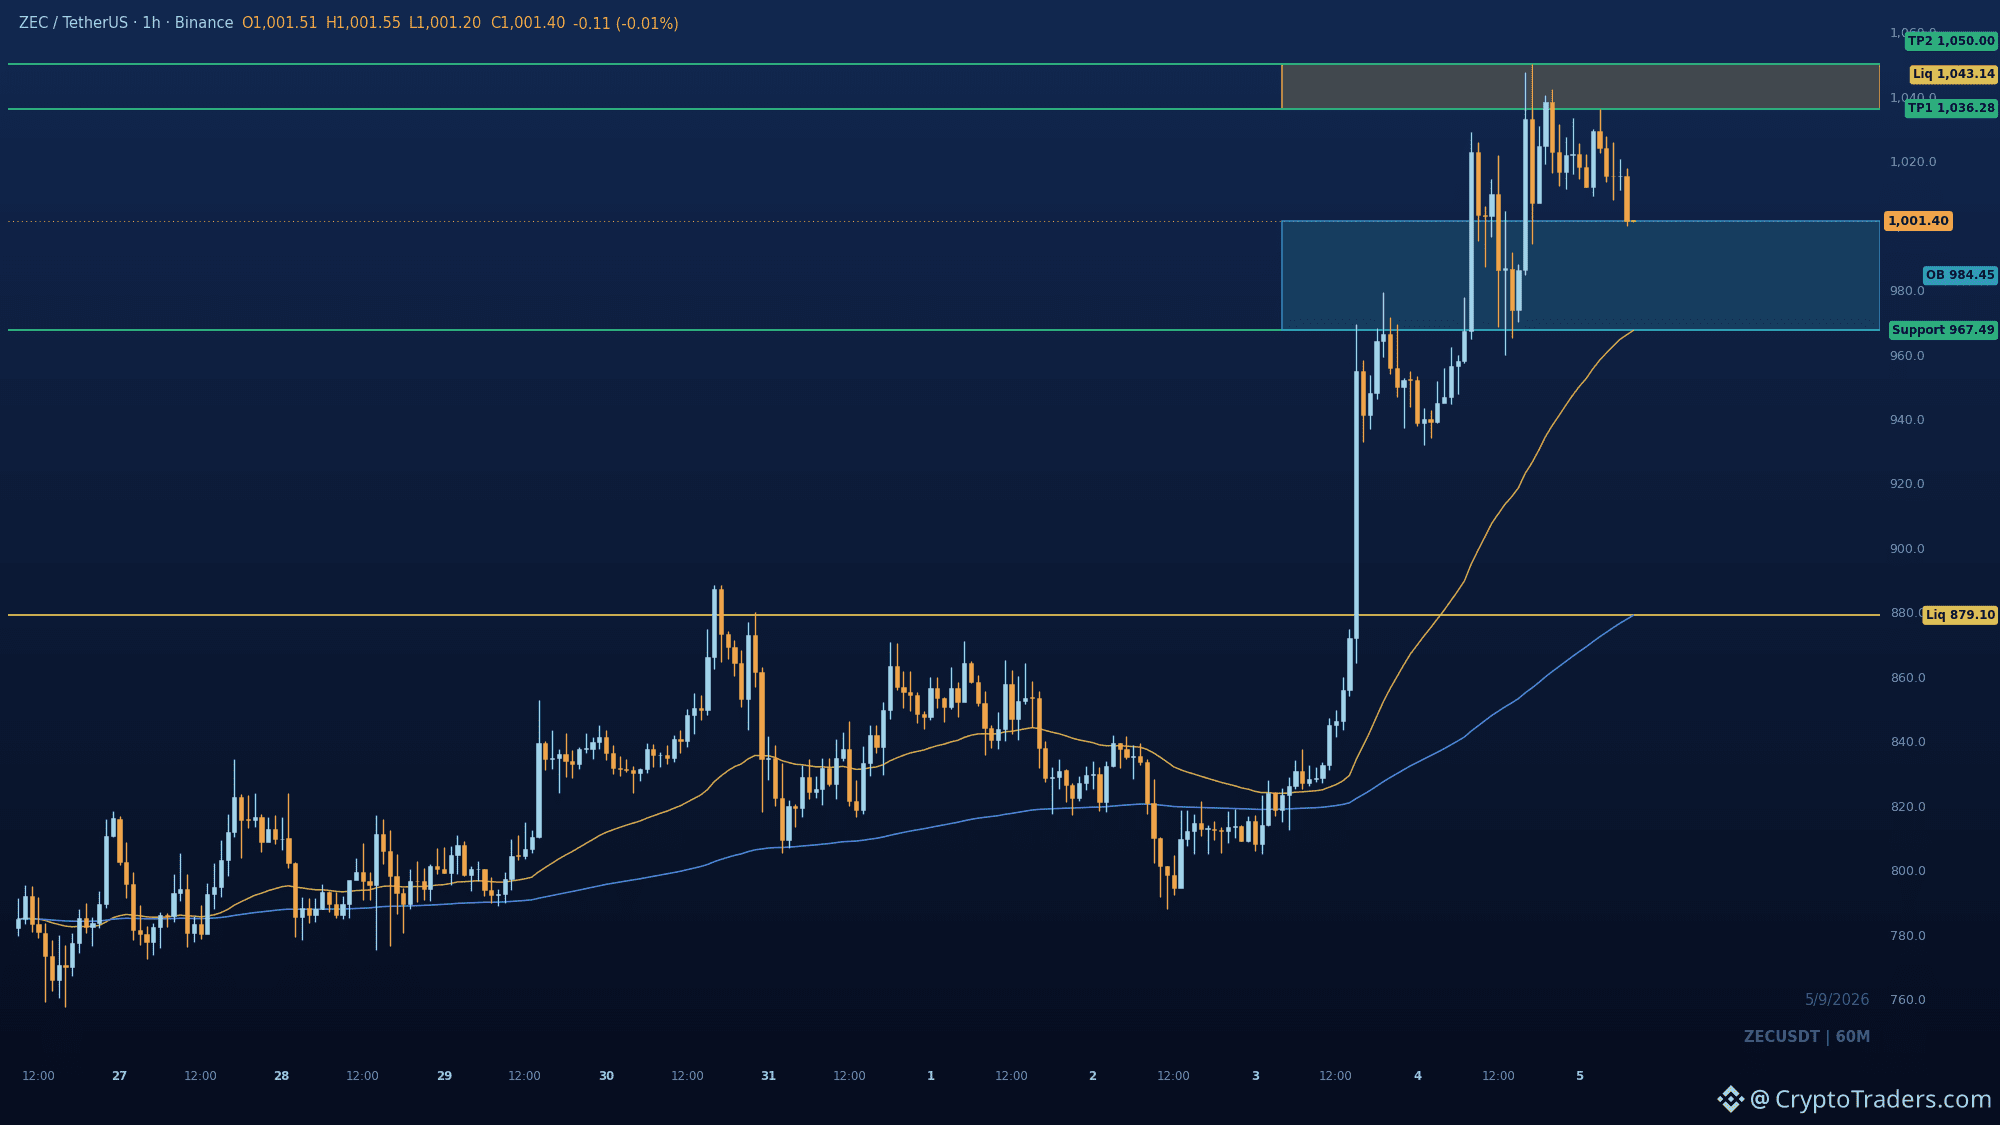
The $ZEC pullback from 1036.28-1050.0 has already taught longs one lesson: that pool was a trap, not a launchpad. Now the market is repricing lower, and the real question is whether 967.49 demand holds on the first touch. The structure is still bullish, with an upside BOS into premium before the rejection. The sweep of that buy-side pool was textbook smart money behavior, and the retrace now looks like a hunt for fresh bids. Key levels: 967.49 demand is the pivot. A reclaim of 1011.42 shifts momentum back up toward 1036.28, then 1050.0. Losing 967.49 opens a deeper draw toward the 879.09 sell-side liquidity. Watch how price reacts at 967.49 on the retest, does it hold or fold? More reads like this land daily in the group, check the bio for the way in. #Altcoin Season#
The $ZEC pullback from 1036.28-1050.0 has already taught longs one lesson: that pool was a trap, not a launchpad. Now the market is repricing lower, and the real question is whether 967.49 demand holds on the first touch. The structure is still bullish, with an upside BOS into premium before the rejection. The sweep of that buy-side pool was textbook smart money behavior, and the retrace now looks like a hunt for fresh bids. Key levels: 967.49 demand is the pivot. A reclaim of 1011.42 shifts momentum back up toward 1036.28, then 1050.0. Losing 967.49 opens a deeper draw toward the 879.09 sell-side liquidity. Watch how price reacts at 967.49 on the retest, does it hold or fold? More reads like this land daily in the group, check the bio for the way in. #Altcoin Season#
39
Log in to explore more content
Join global crypto users on Binance Square
⚡️ Get latest and useful information about crypto.
💬 Trusted by the world’s largest crypto exchange.
👍 Discover real insights from verified creators.
Email / Phone number
Trending Topics
USAugustPPIRisesLessThanExpected
8,939 views
270 Discussing
🚨 US AUG PPI: Rises LESS Than Expected! Bullish for Crypto? 🚀
PPI +0.4% MoM as expected, but CORE PPI only +0.2% vs +0.3% expected - cooling!
What it means:
• Wholesale inflation softer than feared
• Fed rate hike chance now 62% - but dovish signals coming
• Core PCE revisions expected downward - bullish
• BTC usually pumps on softer PPI
Fed meeting Sep 15-16 - Market now expects pause, not hike?
Is this the green light for Q4 rally?
#Bitcoin #PPI #Fed #CryptoNews #BTC#usaugustppiriseslessthanexpected
True News
·1 Likes
·1.1k views
SECApprovesNasdaqTexasCommodityTrustRule
6,998 views
270 Discussing
ECBRaisesRatesSecondTimeTo2.5%
4,290 views
186 Discussing