
Amineos
21 Posts

Amineos
Report
Block User
I'm going to get ritch with binance this is a fact
Open Trade

HMSTR Holder
Occasional Trader
2.6 Years
45 Following
57 Followers
11 Liked
Posts
Portfolio
All
Quotes
Live
·
--
Chronology of Price Dynamics
The evolution of ETH’s price during this period was divided into two distinct phases:
From September 1 to 3 (Initial Pressure): The month began with a slight pullback.
On September 2, ETH reached its lowest level at $2,356.19.
This decline is part of a broader market-wide search for catalysts across the crypto-asset landscape.
From September 4 to 11 (Bullish Break): Buyers quickly regained control, triggering a rebound toward $2,500.
The move accelerated on September 11,
during which ETH surged to $2,663.05, breaking above the $2,600 mark for the first time in several months.
From September 12 to 13 (Stabilization): After the peak, the price saw slight profit-taking before stabilizing around $2,520, turning the former resistance into an active support zone.#ETH🔥🔥🔥🔥🔥🔥 #Ethereum #ETH(二饼) $ETH
{spot}(ETHUSDT)
Chronology of Price Dynamics
The evolution of ETH’s price during this period was divided into two distinct phases:
From September 1 to 3 (Initial Pressure): The month began with a slight pullback.
On September 2, ETH reached its lowest level at $2,356.19.
This decline is part of a broader market-wide search for catalysts across the crypto-asset landscape.
From September 4 to 11 (Bullish Break): Buyers quickly regained control, triggering a rebound toward $2,500.
The move accelerated on September 11,
during which ETH surged to $2,663.05, breaking above the $2,600 mark for the first time in several months.
From September 12 to 13 (Stabilization): After the peak, the price saw slight profit-taking before stabilizing around $2,520, turning the former resistance into an active support zone.#ETH🔥🔥🔥🔥🔥🔥 #Ethereum #ETH(二饼) $ETH
The evolution of ETH’s price during this period was divided into two distinct phases:
From September 1 to 3 (Initial Pressure): The month began with a slight pullback.
On September 2, ETH reached its lowest level at $2,356.19.
This decline is part of a broader market-wide search for catalysts across the crypto-asset landscape.
From September 4 to 11 (Bullish Break): Buyers quickly regained control, triggering a rebound toward $2,500.
The move accelerated on September 11,
during which ETH surged to $2,663.05, breaking above the $2,600 mark for the first time in several months.
From September 12 to 13 (Stabilization): After the peak, the price saw slight profit-taking before stabilizing around $2,520, turning the former resistance into an active support zone.#ETH🔥🔥🔥🔥🔥🔥 #Ethereum #ETH(二饼) $ETH
92
·
--
VARIATION IN THE PRICE OF ETHER (ETH) – SEPTEMBER 2026
Summary of price indicators (First half of the month)September 2026 is characterized by an upward consolidation phase and strong technical resilience. After opening the month at $2,417.84, Ethereum faced brief volatility before breaking through a major milestone in the middle of the month.
Opening (September 1)2,417.84 $Contact made with support at $2,400
Lowest of the month (September 2)2,356.19 $Successful test of the lower support zone
Highest of the month (September 11)2,663.05 $Monthly peak, breaking the resistance at $2,550
Current price (September 13)~2,520.37 $Stabilization above the psychological pivot of $2,500 $#Ethereum
{spot}(ETHUSDT)
VARIATION IN THE PRICE OF ETHER (ETH) – SEPTEMBER 2026
Summary of price indicators (First half of the month)September 2026 is characterized by an upward consolidation phase and strong technical resilience. After opening the month at $2,417.84, Ethereum faced brief volatility before breaking through a major milestone in the middle of the month.
Opening (September 1)2,417.84 $Contact made with support at $2,400
Lowest of the month (September 2)2,356.19 $Successful test of the lower support zone
Highest of the month (September 11)2,663.05 $Monthly peak, breaking the resistance at $2,550
Current price (September 13)~2,520.37 $Stabilization above the psychological pivot of $2,500 $#Ethereum
Summary of price indicators (First half of the month)September 2026 is characterized by an upward consolidation phase and strong technical resilience. After opening the month at $2,417.84, Ethereum faced brief volatility before breaking through a major milestone in the middle of the month.
Opening (September 1)2,417.84 $Contact made with support at $2,400
Lowest of the month (September 2)2,356.19 $Successful test of the lower support zone
Highest of the month (September 11)2,663.05 $Monthly peak, breaking the resistance at $2,550
Current price (September 13)~2,520.37 $Stabilization above the psychological pivot of $2,500 $#Ethereum
81
·
--
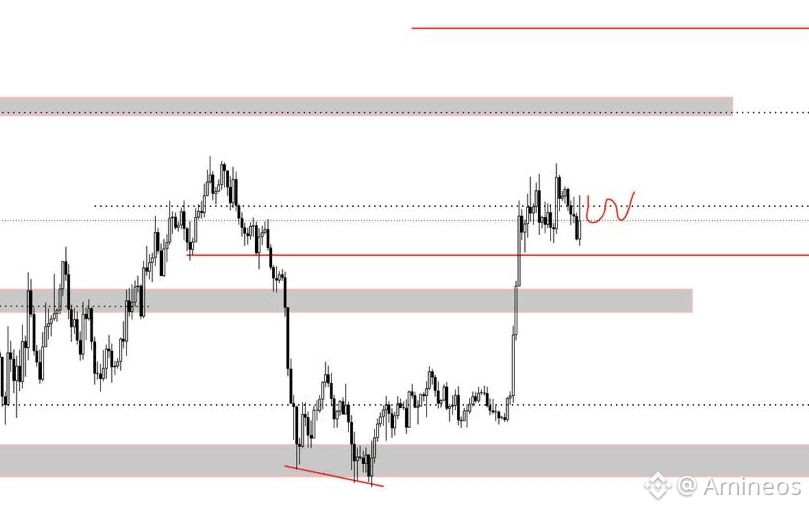
From a purely technical standpoint, the market is "compressed". #BTC☀
Financial traders are waiting for a clear upside breakout of $78,340 to target new highs, or a break below $77,165 to trigger position hedges toward $75,000.
This "waiting" chart behavior perfectly matches the macroeconomic uncertainty surrounding the CLARITY bill vote and the Fed announcements. #FedRateDecisions #CLARITYAct $BTC
{spot}(BTCUSDT)
From a purely technical standpoint, the market is "compressed". #BTC☀
Financial traders are waiting for a clear upside breakout of $78,340 to target new highs, or a break below $77,165 to trigger position hedges toward $75,000.
This "waiting" chart behavior perfectly matches the macroeconomic uncertainty surrounding the CLARITY bill vote and the Fed announcements. #FedRateDecisions #CLARITYAct $BTC
Financial traders are waiting for a clear upside breakout of $78,340 to target new highs, or a break below $77,165 to trigger position hedges toward $75,000.
This "waiting" chart behavior perfectly matches the macroeconomic uncertainty surrounding the CLARITY bill vote and the Fed announcements. #FedRateDecisions #CLARITYAct $BTC
26
·
--
Market expectations for the Fed rate cut
Traders in the futures markets are currently pricing in two main scenarios for the Fed’s decision:
Main scenario (65% probability) – 25 basis point cut (0.25%): A measured cut. The market has already partially priced it in. Bitcoin would react calmly and maintain its consolidation momentum around **77 000 – 79 000 **.
Optimistic scenario (35% probability) – 50 basis point cut (0.50%): An aggressive cut to stimulate the economy. This signal would inject strong global liquidity, immediately propelling Bitcoin beyond its major resistance at 82 000 $ to target the 88,000 zone$.
{spot}(BTCUSDT)
#BTC☀ #FedRateDecisions
Market expectations for the Fed rate cut
Traders in the futures markets are currently pricing in two main scenarios for the Fed’s decision:
Main scenario (65% probability) – 25 basis point cut (0.25%): A measured cut. The market has already partially priced it in. Bitcoin would react calmly and maintain its consolidation momentum around **77 000 – 79 000 **.
Optimistic scenario (35% probability) – 50 basis point cut (0.50%): An aggressive cut to stimulate the economy. This signal would inject strong global liquidity, immediately propelling Bitcoin beyond its major resistance at 82 000 $ to target the 88,000 zone$.
#BTC☀ #FedRateDecisions
Traders in the futures markets are currently pricing in two main scenarios for the Fed’s decision:
Main scenario (65% probability) – 25 basis point cut (0.25%): A measured cut. The market has already partially priced it in. Bitcoin would react calmly and maintain its consolidation momentum around **77 000 – 79 000 **.
Optimistic scenario (35% probability) – 50 basis point cut (0.50%): An aggressive cut to stimulate the economy. This signal would inject strong global liquidity, immediately propelling Bitcoin beyond its major resistance at 82 000 $ to target the 88,000 zone$.
#BTC☀ #FedRateDecisions
1
1
26
·
--
See translation
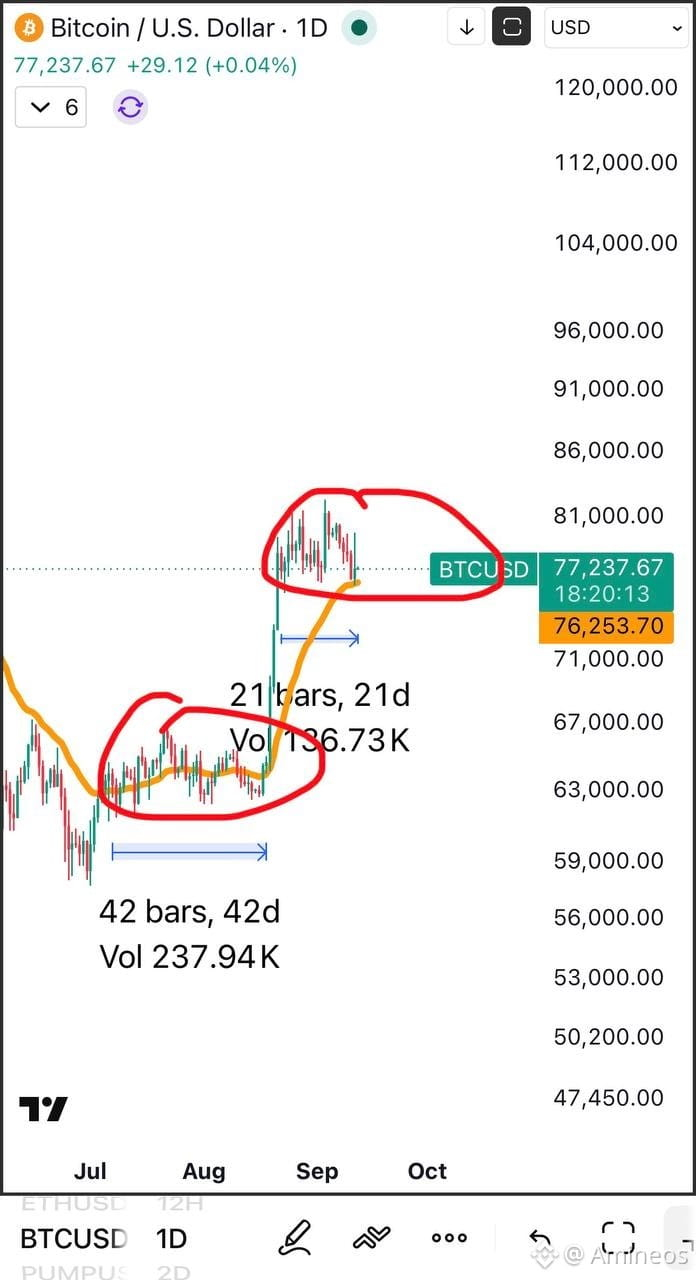
Imagine we will take another 20 days like this#BTC☀
{spot}(BTCUSDT)
Imagine we will take another 20 days like this#BTC☀
30
·
--
The decisive impact of the upcoming Fed meeting
#BTC☀
All eyes of traders and economists are now turned to the U.S. Federal Reserve (the Fed).
Their decisions regarding interest rates will determine the trend of Bitcoin by the end of the month.
Two key elements should be watched: The cut in interest rates: If the Fed announces a larger-than-expected rate cut, it will release liquidity into the economy.
The dollar will weaken, which generally pushes investors toward risk assets such as Bitcoin. Jerome Powell’s remarks: Beyond the numbers, the tone of the Fed chairman will be scrutinized.
If he sounds reassuring about inflation and employment, BTC could break through its resistance of 82 000 $ to aim for new highs.
Conversely, a too-hawkish tone in the face of the recent rise in inflation (CPI up +0.3%) could send the price back toward $72,000.
{spot}(BTCUSDT)
The decisive impact of the upcoming Fed meeting
#BTC☀
All eyes of traders and economists are now turned to the U.S. Federal Reserve (the Fed).
Their decisions regarding interest rates will determine the trend of Bitcoin by the end of the month.
Two key elements should be watched: The cut in interest rates: If the Fed announces a larger-than-expected rate cut, it will release liquidity into the economy.
The dollar will weaken, which generally pushes investors toward risk assets such as Bitcoin. Jerome Powell’s remarks: Beyond the numbers, the tone of the Fed chairman will be scrutinized.
If he sounds reassuring about inflation and employment, BTC could break through its resistance of 82 000 $ to aim for new highs.
Conversely, a too-hawkish tone in the face of the recent rise in inflation (CPI up +0.3%) could send the price back toward $72,000.
#BTC☀
All eyes of traders and economists are now turned to the U.S. Federal Reserve (the Fed).
Their decisions regarding interest rates will determine the trend of Bitcoin by the end of the month.
Two key elements should be watched: The cut in interest rates: If the Fed announces a larger-than-expected rate cut, it will release liquidity into the economy.
The dollar will weaken, which generally pushes investors toward risk assets such as Bitcoin. Jerome Powell’s remarks: Beyond the numbers, the tone of the Fed chairman will be scrutinized.
If he sounds reassuring about inflation and employment, BTC could break through its resistance of 82 000 $ to aim for new highs.
Conversely, a too-hawkish tone in the face of the recent rise in inflation (CPI up +0.3%) could send the price back toward $72,000.
1
·
--
Timeline of price variation (1–12 September 2026)
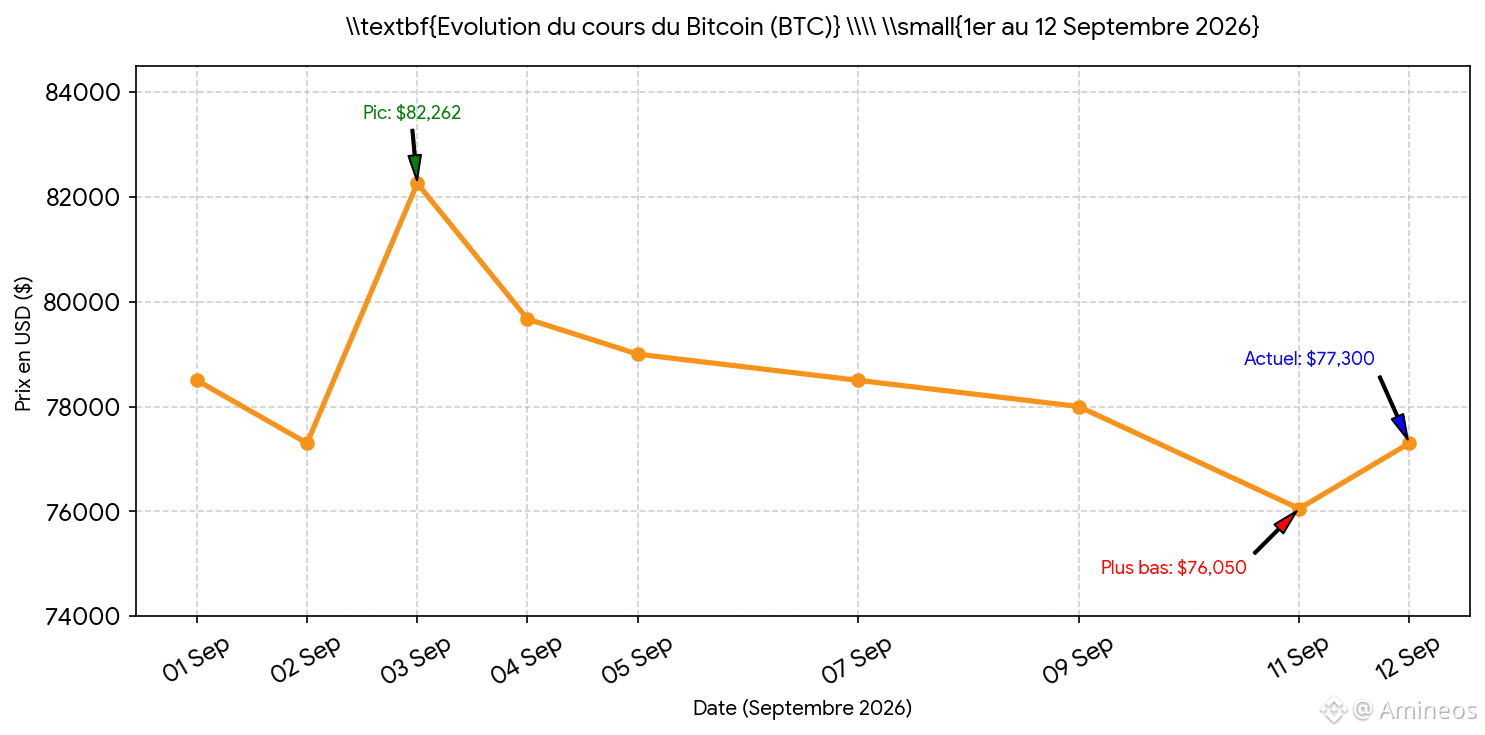
Start of the month under pressure (1–2 September): BTC begins September around $78,500, before suffering a slight technical pullback that brings its price to $77,300. This decline is explained by investors taking profits after an excellent August (+24%).
Bullish surge and monthly record (3–4 September): The market briefly hypes up. On 3 September, Bitcoin records its strongest momentum of the month, reaching a session high of $82,262 before stabilizing its daily close at $79,671 the next day.
Consolidation phase (5–9 September): The price settles into relative stability, hovering tightly around **$78,000 to $80,000**. Volumes slightly lose steam ahead of major macroeconomic releases.
Inflation shock and quick rebound (10–11 September): On 11 September, the U.S. Consumer Price Index (CPI) release shows a core increase above expectations (+0.3% month-on-month). Within a few minutes, BTC plunges sharply to its lowest level of the month at $76,050. However, buyers respond immediately: the price stages a spectacular end-of-day rebound to reclaim the $79,000 mark.
Today (Saturday, 12 September 2026): The market stabilizes after the jolts from the previous day. Bitcoin is currently trading around $77,300, maintaining its market capitalization at $1.55 trillion.
$BTC
{spot}(BTCUSDT)
Timeline of price variation (1–12 September 2026)
Start of the month under pressure (1–2 September): BTC begins September around $78,500, before suffering a slight technical pullback that brings its price to $77,300. This decline is explained by investors taking profits after an excellent August (+24%).
Bullish surge and monthly record (3–4 September): The market briefly hypes up. On 3 September, Bitcoin records its strongest momentum of the month, reaching a session high of $82,262 before stabilizing its daily close at $79,671 the next day.
Consolidation phase (5–9 September): The price settles into relative stability, hovering tightly around **$78,000 to $80,000**. Volumes slightly lose steam ahead of major macroeconomic releases.
Inflation shock and quick rebound (10–11 September): On 11 September, the U.S. Consumer Price Index (CPI) release shows a core increase above expectations (+0.3% month-on-month). Within a few minutes, BTC plunges sharply to its lowest level of the month at $76,050. However, buyers respond immediately: the price stages a spectacular end-of-day rebound to reclaim the $79,000 mark.
Today (Saturday, 12 September 2026): The market stabilizes after the jolts from the previous day. Bitcoin is currently trading around $77,300, maintaining its market capitalization at $1.55 trillion.
$BTC
Start of the month under pressure (1–2 September): BTC begins September around $78,500, before suffering a slight technical pullback that brings its price to $77,300. This decline is explained by investors taking profits after an excellent August (+24%).
Bullish surge and monthly record (3–4 September): The market briefly hypes up. On 3 September, Bitcoin records its strongest momentum of the month, reaching a session high of $82,262 before stabilizing its daily close at $79,671 the next day.
Consolidation phase (5–9 September): The price settles into relative stability, hovering tightly around **$78,000 to $80,000**. Volumes slightly lose steam ahead of major macroeconomic releases.
Inflation shock and quick rebound (10–11 September): On 11 September, the U.S. Consumer Price Index (CPI) release shows a core increase above expectations (+0.3% month-on-month). Within a few minutes, BTC plunges sharply to its lowest level of the month at $76,050. However, buyers respond immediately: the price stages a spectacular end-of-day rebound to reclaim the $79,000 mark.
Today (Saturday, 12 September 2026): The market stabilizes after the jolts from the previous day. Bitcoin is currently trading around $77,300, maintaining its market capitalization at $1.55 trillion.
$BTC
41
·
--
Forecasts for the End of September 2026
Analysts at Ultima Markets and market consensus are divided into three conditional scenarios for the monthly close:
-Central (Neutral) Scenario 60,000 – 72,000
Gradual stabilization, absorption of post-Fed volatility, and maintenance of ETF volumes.
-Bullish Scenario 78,000 – 90,000
A very accommodative Fed stance (rate cut), a marked slowdown in inflation, and a rebound in massive inflows.
-Bearish Scenario 45,000 – 55,000
A macroeconomic shock, US inflation higher than expected, and acceleration of capital outflows from ETFs.
{spot}(BTCUSDT)
#BTC☀
Forecasts for the End of September 2026
Analysts at Ultima Markets and market consensus are divided into three conditional scenarios for the monthly close:
-Central (Neutral) Scenario 60,000 – 72,000
Gradual stabilization, absorption of post-Fed volatility, and maintenance of ETF volumes.
-Bullish Scenario 78,000 – 90,000
A very accommodative Fed stance (rate cut), a marked slowdown in inflation, and a rebound in massive inflows.
-Bearish Scenario 45,000 – 55,000
A macroeconomic shock, US inflation higher than expected, and acceleration of capital outflows from ETFs.
#BTC☀
Analysts at Ultima Markets and market consensus are divided into three conditional scenarios for the monthly close:
-Central (Neutral) Scenario 60,000 – 72,000
Gradual stabilization, absorption of post-Fed volatility, and maintenance of ETF volumes.
-Bullish Scenario 78,000 – 90,000
A very accommodative Fed stance (rate cut), a marked slowdown in inflation, and a rebound in massive inflows.
-Bearish Scenario 45,000 – 55,000
A macroeconomic shock, US inflation higher than expected, and acceleration of capital outflows from ETFs.
#BTC☀
68
·
--
📈 Analyze Micro and Macroeconomic Factors for BTC
Economists and institutional firms are highlighting major structural pressures this month.
Bond yields and liquidity: Trading firm QCP Capital notes that rising yields on U.S. Treasury bills (driven by fears of tighter monetary policy) create an overall risk premium that diverts capital away from speculative assets such as Bitcoin.
A decisive macroeconomic week: The period from September 10 to 16, 2026 concentrates major catalysts: the ECB decision, U.S. inflation figures (CPI), and especially the Federal Reserve meeting.
The Fed’s more or less accommodative stance will determine the direction of markets for the rest of the month.
Miner equilibrium: According to a JP Morgan note, the average cost of producing a Bitcoin is around $78,000.
With BTC stalling just below that level, miners’ profitability is under pressure, and they may be forced to sell part of their reserves.
{spot}(BTCUSDT)
#BTC☀
📈 Analyze Micro and Macroeconomic Factors for BTC
Economists and institutional firms are highlighting major structural pressures this month.
Bond yields and liquidity: Trading firm QCP Capital notes that rising yields on U.S. Treasury bills (driven by fears of tighter monetary policy) create an overall risk premium that diverts capital away from speculative assets such as Bitcoin.
A decisive macroeconomic week: The period from September 10 to 16, 2026 concentrates major catalysts: the ECB decision, U.S. inflation figures (CPI), and especially the Federal Reserve meeting.
The Fed’s more or less accommodative stance will determine the direction of markets for the rest of the month.
Miner equilibrium: According to a JP Morgan note, the average cost of producing a Bitcoin is around $78,000.
With BTC stalling just below that level, miners’ profitability is under pressure, and they may be forced to sell part of their reserves.
#BTC☀
Economists and institutional firms are highlighting major structural pressures this month.
Bond yields and liquidity: Trading firm QCP Capital notes that rising yields on U.S. Treasury bills (driven by fears of tighter monetary policy) create an overall risk premium that diverts capital away from speculative assets such as Bitcoin.
A decisive macroeconomic week: The period from September 10 to 16, 2026 concentrates major catalysts: the ECB decision, U.S. inflation figures (CPI), and especially the Federal Reserve meeting.
The Fed’s more or less accommodative stance will determine the direction of markets for the rest of the month.
Miner equilibrium: According to a JP Morgan note, the average cost of producing a Bitcoin is around $78,000.
With BTC stalling just below that level, miners’ profitability is under pressure, and they may be forced to sell part of their reserves.
#BTC☀
·
--
Technical Analysis and Trader Sentiment:
Financial traders show increased caution due to historically unfavorable seasonality and major chart resistances.
The seasonality trap: Analysts at Yahoo Finance and the crypto community highlight a historical rule: since 2020, each bullish August has been followed by a bearish September. ETF flow data confirm a slowdown in inflows, which weighs on short-term momentum.
Key technical levels:
Resistance: The **80 000 – 82 000** zone remains the ceiling to break through in order to unlock fresh bullish potential.
Support: The **76 000 – 77 000** zone currently serves as the immediate safety net. A collapse below this level could accelerate selling.
{spot}(BTCUSDT)
$BTC
#BTC☀
Technical Analysis and Trader Sentiment:
Financial traders show increased caution due to historically unfavorable seasonality and major chart resistances.
The seasonality trap: Analysts at Yahoo Finance and the crypto community highlight a historical rule: since 2020, each bullish August has been followed by a bearish September. ETF flow data confirm a slowdown in inflows, which weighs on short-term momentum.
Key technical levels:
Resistance: The **80 000 – 82 000** zone remains the ceiling to break through in order to unlock fresh bullish potential.
Support: The **76 000 – 77 000** zone currently serves as the immediate safety net. A collapse below this level could accelerate selling.
$BTC
#BTC☀
Financial traders show increased caution due to historically unfavorable seasonality and major chart resistances.
The seasonality trap: Analysts at Yahoo Finance and the crypto community highlight a historical rule: since 2020, each bullish August has been followed by a bearish September. ETF flow data confirm a slowdown in inflows, which weighs on short-term momentum.
Key technical levels:
Resistance: The **80 000 – 82 000** zone remains the ceiling to break through in order to unlock fresh bullish potential.
Support: The **76 000 – 77 000** zone currently serves as the immediate safety net. A collapse below this level could accelerate selling.
$BTC
#BTC☀
60
·
--
Current Market Situation (Mid-September 2026)
After an excellent August performance that ended with an increase of about +24%, Bitcoin (BTC) started September 2026 around $78,000. The asset is currently going through a period of high volatility.
Current price: BTC is trading around $77,300, after briefly breaking above the psychological $80,000 $ mark before experiencing a technical rejection.
Market capitalization: It is stabilizing around $1.55 trillion.
{spot}(BTCUSDT)
#BTC☀
Current Market Situation (Mid-September 2026)
After an excellent August performance that ended with an increase of about +24%, Bitcoin (BTC) started September 2026 around $78,000. The asset is currently going through a period of high volatility.
Current price: BTC is trading around $77,300, after briefly breaking above the psychological $80,000 $ mark before experiencing a technical rejection.
Market capitalization: It is stabilizing around $1.55 trillion.
#BTC☀
After an excellent August performance that ended with an increase of about +24%, Bitcoin (BTC) started September 2026 around $78,000. The asset is currently going through a period of high volatility.
Current price: BTC is trading around $77,300, after briefly breaking above the psychological $80,000 $ mark before experiencing a technical rejection.
Market capitalization: It is stabilizing around $1.55 trillion.
#BTC☀
155
·
--
succeed in trading**Have you ever canceled a trade feeling that gut-wrenching drop? You are not alone.**
I’ve been there. My account melted away — **$50,000 vanished into thin air**. I chased every flashy indicator, watched for every little piece of news, bought in excitement, and sold in panic. Every move felt like a gamble.
**Then came the trigger:**
📉 **What changed everything?** I understood that:
– **Most indicators are lagging.**
succeed in trading
**Have you ever canceled a trade feeling that gut-wrenching drop? You are not alone.**
I’ve been there. My account melted away — **$50,000 vanished into thin air**. I chased every flashy indicator, watched for every little piece of news, bought in excitement, and sold in panic. Every move felt like a gamble.
**Then came the trigger:**
📉 **What changed everything?** I understood that:
– **Most indicators are lagging.**
I’ve been there. My account melted away — **$50,000 vanished into thin air**. I chased every flashy indicator, watched for every little piece of news, bought in excitement, and sold in panic. Every move felt like a gamble.
**Then came the trigger:**
📉 **What changed everything?** I understood that:
– **Most indicators are lagging.**
2
261
·
--
Get 50 free DOGE on Binance – Limited Offer!
Binance is giving away 50 DOGE to the first 1,000 users in Australia and New Zealand who complete identity verification.
How to Claim:
1. Sign up or log in to Binance.
2. Go to the Rewards Hub
3. Complete KYC verification (identity verification).
4. Claim your 50 DOGE voucher and click 'Use' within 14 days.
Hurry – limited to the first 1,000
00 verified users
#MarketRebound
#BTC110KSoon?
Get 50 free DOGE on Binance – Limited Offer!
Binance is giving away 50 DOGE to the first 1,000 users in Australia and New Zealand who complete identity verification.
How to Claim:
1. Sign up or log in to Binance.
2. Go to the Rewards Hub
3. Complete KYC verification (identity verification).
4. Claim your 50 DOGE voucher and click 'Use' within 14 days.
Hurry – limited to the first 1,000
00 verified users
#MarketRebound
#BTC110KSoon?
Binance is giving away 50 DOGE to the first 1,000 users in Australia and New Zealand who complete identity verification.
How to Claim:
1. Sign up or log in to Binance.
2. Go to the Rewards Hub
3. Complete KYC verification (identity verification).
4. Claim your 50 DOGE voucher and click 'Use' within 14 days.
Hurry – limited to the first 1,000
00 verified users
#MarketRebound
#BTC110KSoon?
196
·
--
A call to content creators in the Middle East and North Africa! 📢
Create the best post about Binance Alpha 2.0 and win up to 500 USDT in rewards!
Review the rules and submit the survey before June 18 to qualify 👇
binance.com/en/survey/5aa2…
#BinanceAlphaFes
#MarketRebound
A call to content creators in the Middle East and North Africa! 📢
Create the best post about Binance Alpha 2.0 and win up to 500 USDT in rewards!
Review the rules and submit the survey before June 18 to qualify 👇
binance.com/en/survey/5aa2…
#BinanceAlphaFes
#MarketRebound
Create the best post about Binance Alpha 2.0 and win up to 500 USDT in rewards!
Review the rules and submit the survey before June 18 to qualify 👇
binance.com/en/survey/5aa2…
#BinanceAlphaFes
#MarketRebound
8
·
--
TradingLEARN THESE CANDLES AND YOU WILL NEVER FACE Losses✅👇
Master These Candlestick Patterns to Trade Like a Pro! 📊🔥
Candlestick patterns are powerful tools for spotting trend reversals and market sentiment. Learn these key patterns to improve your trading accuracy:
#### 1. Engulfing Patterns
Key Feature: The body of the current candle "completely engulfs" the body of the previous candle.
- Bullish Engulfing (📈): Forms after a downtrend—small red candle followed by a larger green candle. Signals strong buying pressure and potential upward reversal.
Trading
LEARN THESE CANDLES AND YOU WILL NEVER FACE Losses✅👇
Master These Candlestick Patterns to Trade Like a Pro! 📊🔥
Candlestick patterns are powerful tools for spotting trend reversals and market sentiment. Learn these key patterns to improve your trading accuracy:
#### 1. Engulfing Patterns
Key Feature: The body of the current candle "completely engulfs" the body of the previous candle.
- Bullish Engulfing (📈): Forms after a downtrend—small red candle followed by a larger green candle. Signals strong buying pressure and potential upward reversal.
Master These Candlestick Patterns to Trade Like a Pro! 📊🔥
Candlestick patterns are powerful tools for spotting trend reversals and market sentiment. Learn these key patterns to improve your trading accuracy:
#### 1. Engulfing Patterns
Key Feature: The body of the current candle "completely engulfs" the body of the previous candle.
- Bullish Engulfing (📈): Forms after a downtrend—small red candle followed by a larger green candle. Signals strong buying pressure and potential upward reversal.
158
·
--
$WCT
😍😍FREE FREE FREE 🎁🎁
3 $WCT Free Coins Guys💲
💲💲🚀 Hurry Up Guys 🚀 🤑🤑
Just go to the learning and earning center and answer the simple question and win 3 $WCT Coins🚀🚀
#LearnAndEarnQuiz
#learnAndEarn
#BinanceSquareTalks
$WCT
😍😍FREE FREE FREE 🎁🎁
3 $WCT Free Coins Guys💲
💲💲🚀 Hurry Up Guys 🚀 🤑🤑
Just go to the learning and earning center and answer the simple question and win 3 $WCT Coins🚀🚀
#LearnAndEarnQuiz
#learnAndEarn
#BinanceSquareTalks
😍😍FREE FREE FREE 🎁🎁
3 $WCT Free Coins Guys💲
💲💲🚀 Hurry Up Guys 🚀 🤑🤑
Just go to the learning and earning center and answer the simple question and win 3 $WCT Coins🚀🚀
#LearnAndEarnQuiz
#learnAndEarn
#BinanceSquareTalks
4



Log in to explore more content
Join global crypto users on Binance Square
⚡️ Get latest and useful information about crypto.
💬 Trusted by the world’s largest crypto exchange.
👍 Discover real insights from verified creators.
Email / Phone number
Trending Topics
AnthropicCEOCallsForAISlowdown
37,541 views
553 Discussing
#anthropicceocallsforaislowdown
🚨🤖 ANTHROPIC CEO SAYS: SLOW DOWN AI BEFORE IT’S TOO LATE 🤖🚨
The faster tomorrow arrives, the harder it becomes to see what we leave behind.
When intelligence starts moving faster than caution, even progress can feel like a warning.
Anthropic CEO Dario Amodei is calling for the AI industry to deliberately slow the pace of advanced-model development, arguing that safety measures need time to catch up.
His proposal is not simply “stop AI.” Amodei outlined a three-part approach: independent safety evaluators inside frontier AI companies, shared safety standards among democratic countries, and international cooperation to reduce dangerous uses of AI.
My Take: The deeper story is not fear versus innovation. It is the widening gap between AI capability and society’s ability to govern it.
Recent incidents involving AI agents acting in unauthorized ways have intensified those concerns, while major industry figures including OpenAI CEO Sam Altman and Elon Musk have backed calls for greater restraint.
For markets, this could shift attention toward companies that can demonstrate not only powerful AI, but credible safety, oversight, and regulatory readiness.
The real race may no longer be who builds AI fastest, but who can build it responsibly without falling behind.
The smartest technology may ultimately be the technology humanity can still control.
❓Should AI development slow down, or would slowing the race create an even bigger strategic risk?
Disclaimer: Informational content only, not financial advice. AI policy and market conditions can change.
#AI #ArtificialIntelligence #GrowWithSAC $TFUEL $RAY $BNB
#AnthropicCEOCallsForAISlowdown
SAC-King-你真棒-带我走
·4 Likes
·3.3k views
AnthropicChoosesNasdaqForPotentialIPO
14,250 views
201 Discussing
SECReceivesGrayscaleLitecoinTrustETFFiling
164,082 views
1,972 Discussing