
Danish Trader DT
5.2k Posts

Danish Trader DT
Report
Block User
🥀 Crypto trader focused on smart entries, strong momentum & real profits 💰🥀 Danish Trader
20 Following
6.6K+ Followers
4.4K+ Liked
Posts
All
Quotes
Videos
Live
See translation
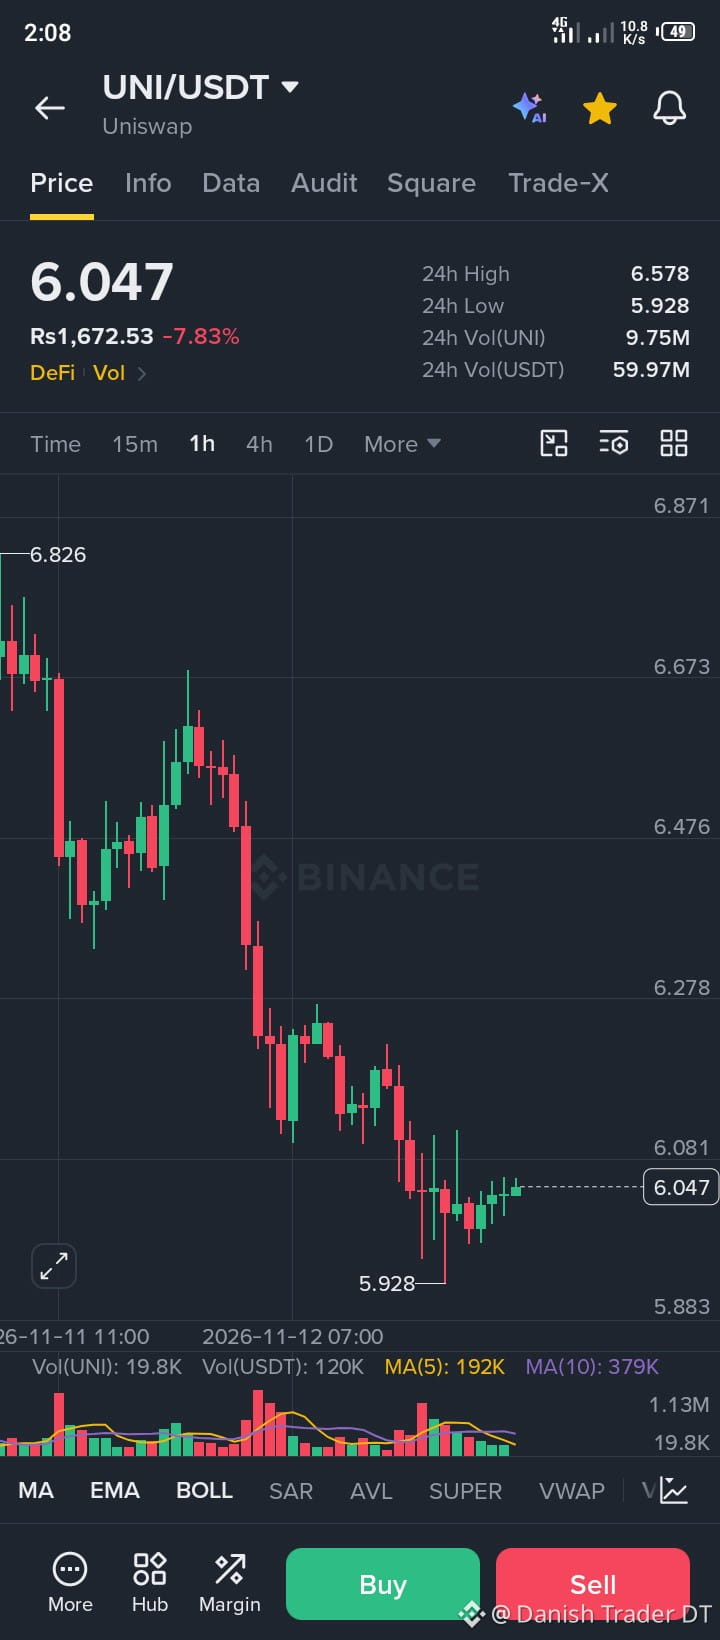
$UNI showing signs of recovery as buyers start stepping back into the market. 🚀
Trade Plan (LONG)
Stop Loss: 5.762
Targets
◉ 6.243 🎯
UNI is finally showing some strength after a quiet period. The key is whether this momentum can continue through the weekend or if it turns into another fake-out.
Watch the price action closely and manage risk carefully. 📈
{spot}(UNIUSDT)
$UNI showing signs of recovery as buyers start stepping back into the market. 🚀
Trade Plan (LONG)
Stop Loss: 5.762
Targets
◉ 6.243 🎯
UNI is finally showing some strength after a quiet period. The key is whether this momentum can continue through the weekend or if it turns into another fake-out.
Watch the price action closely and manage risk carefully. 📈
Trade Plan (LONG)
Stop Loss: 5.762
Targets
◉ 6.243 🎯
UNI is finally showing some strength after a quiet period. The key is whether this momentum can continue through the weekend or if it turns into another fake-out.
Watch the price action closely and manage risk carefully. 📈
1
3
See translation
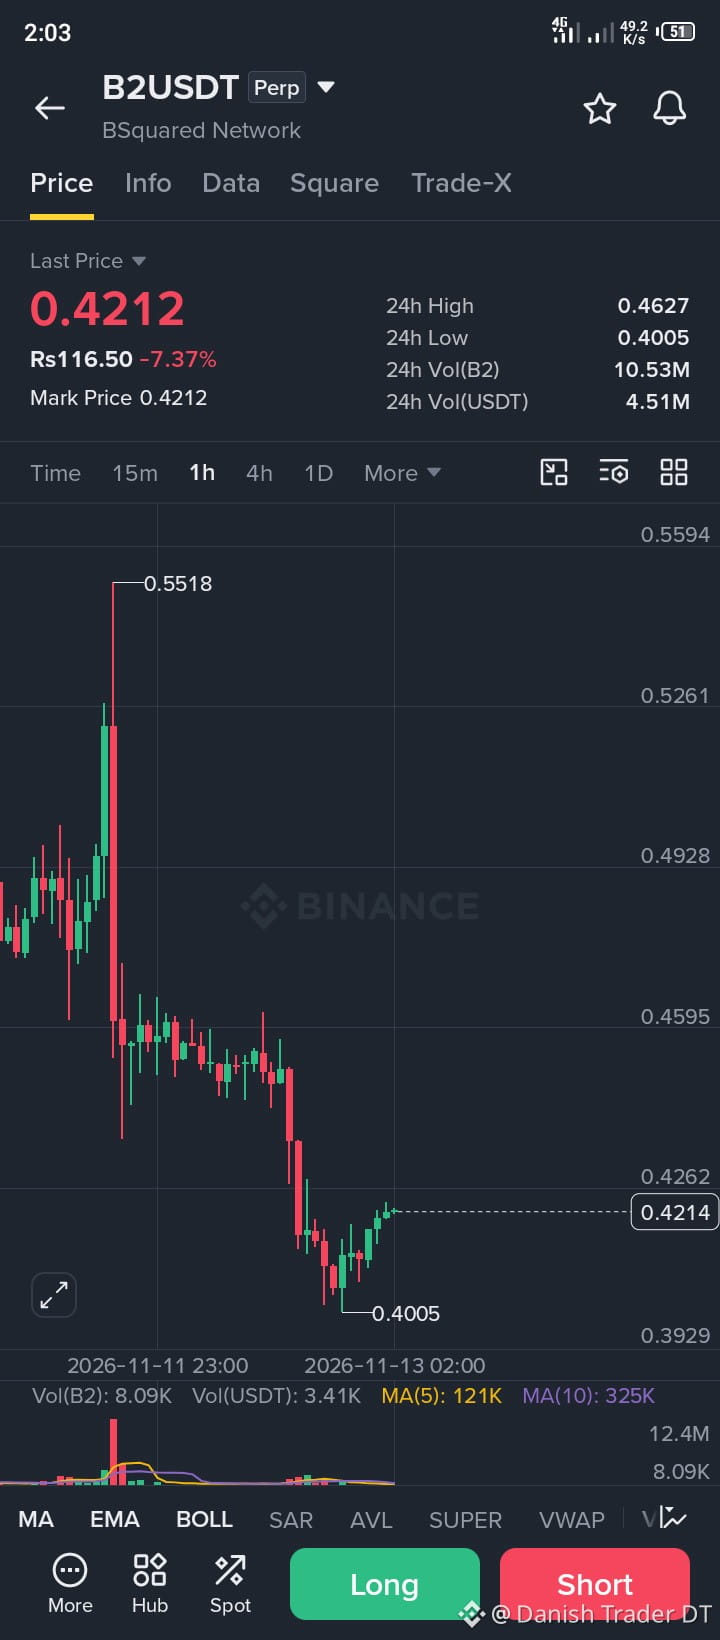
$B2 showing signs of weakness as the recent bounce starts losing momentum.
Trade Plan (SHORT)
Entry Zone: 0.4218 – 0.4274
Stop Loss: 0.4402
Targets:
◉ 0.4056
◉ 0.3904
The local recovery appears to be slowing down, while the 1H trend continues to favor sellers. A move toward lower liquidity levels is possible if bearish pressure returns.
However, 15M momentum is still positive, so a temporary squeeze before further downside remains a risk.
Bearish setup remains in focus — manage your risk carefully.
{future}(B2USDT)
$B2 showing signs of weakness as the recent bounce starts losing momentum.
Trade Plan (SHORT)
Entry Zone: 0.4218 – 0.4274
Stop Loss: 0.4402
Targets:
◉ 0.4056
◉ 0.3904
The local recovery appears to be slowing down, while the 1H trend continues to favor sellers. A move toward lower liquidity levels is possible if bearish pressure returns.
However, 15M momentum is still positive, so a temporary squeeze before further downside remains a risk.
Bearish setup remains in focus — manage your risk carefully.
Trade Plan (SHORT)
Entry Zone: 0.4218 – 0.4274
Stop Loss: 0.4402
Targets:
◉ 0.4056
◉ 0.3904
The local recovery appears to be slowing down, while the 1H trend continues to favor sellers. A move toward lower liquidity levels is possible if bearish pressure returns.
However, 15M momentum is still positive, so a temporary squeeze before further downside remains a risk.
Bearish setup remains in focus — manage your risk carefully.
1
13
See translation
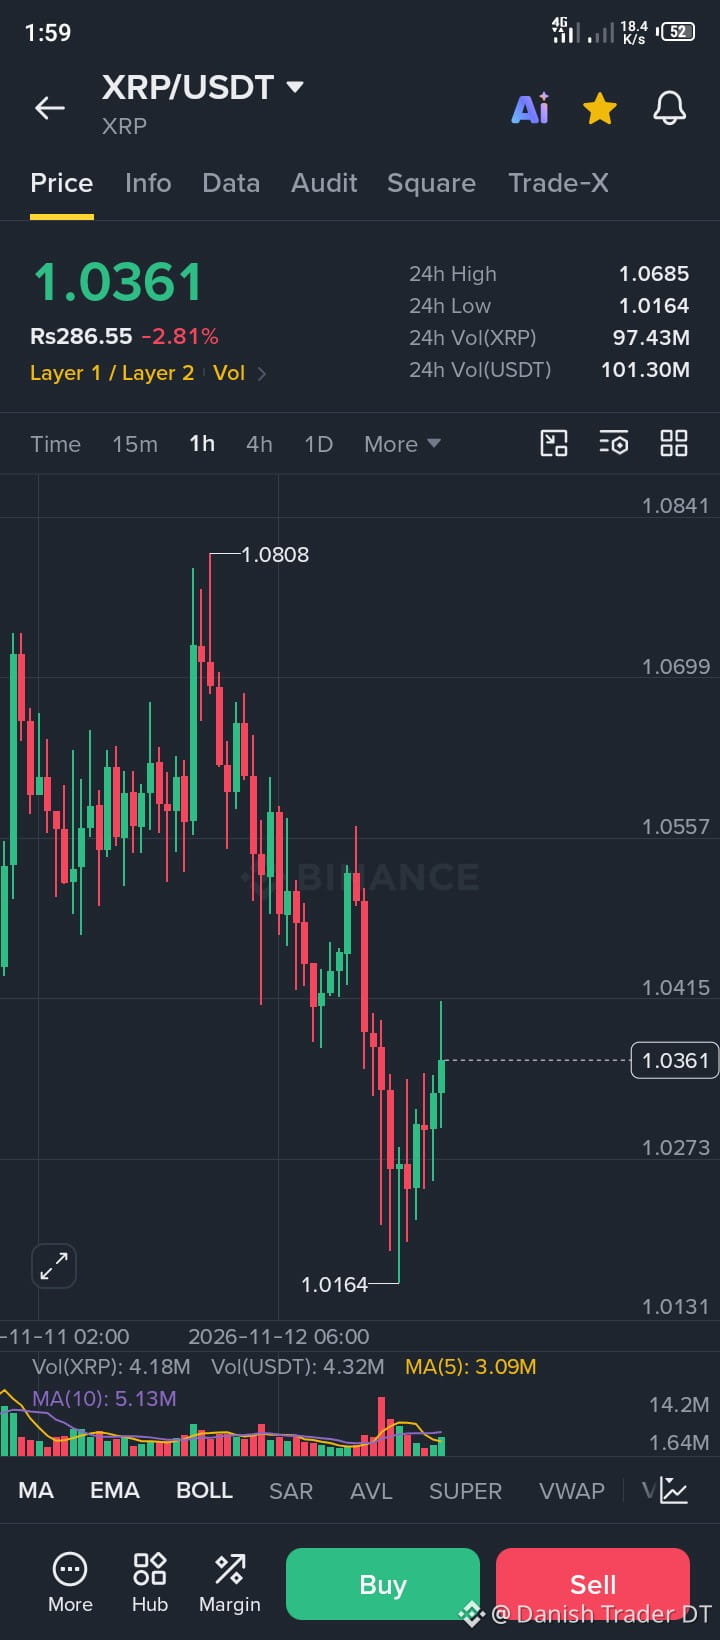
$XRP showing fresh signs of recovery as buyers start stepping back into the market.
Trade Plan (LONG)
Stop Loss: 1.0022
Targets:
◉ 1.0859
XRP is finally showing some upward momentum after spending time under pressure. The main challenge now is clearing the nearby resistance.
If buyers maintain control, the recovery could continue. However, a failed breakout may lead to another pullback.
Momentum is improving — bulls need confirmation to keep the move alive.
{future}(XRPUSDT)
$XRP showing fresh signs of recovery as buyers start stepping back into the market.
Trade Plan (LONG)
Stop Loss: 1.0022
Targets:
◉ 1.0859
XRP is finally showing some upward momentum after spending time under pressure. The main challenge now is clearing the nearby resistance.
If buyers maintain control, the recovery could continue. However, a failed breakout may lead to another pullback.
Momentum is improving — bulls need confirmation to keep the move alive.
Trade Plan (LONG)
Stop Loss: 1.0022
Targets:
◉ 1.0859
XRP is finally showing some upward momentum after spending time under pressure. The main challenge now is clearing the nearby resistance.
If buyers maintain control, the recovery could continue. However, a failed breakout may lead to another pullback.
Momentum is improving — bulls need confirmation to keep the move alive.
1
25
See translation
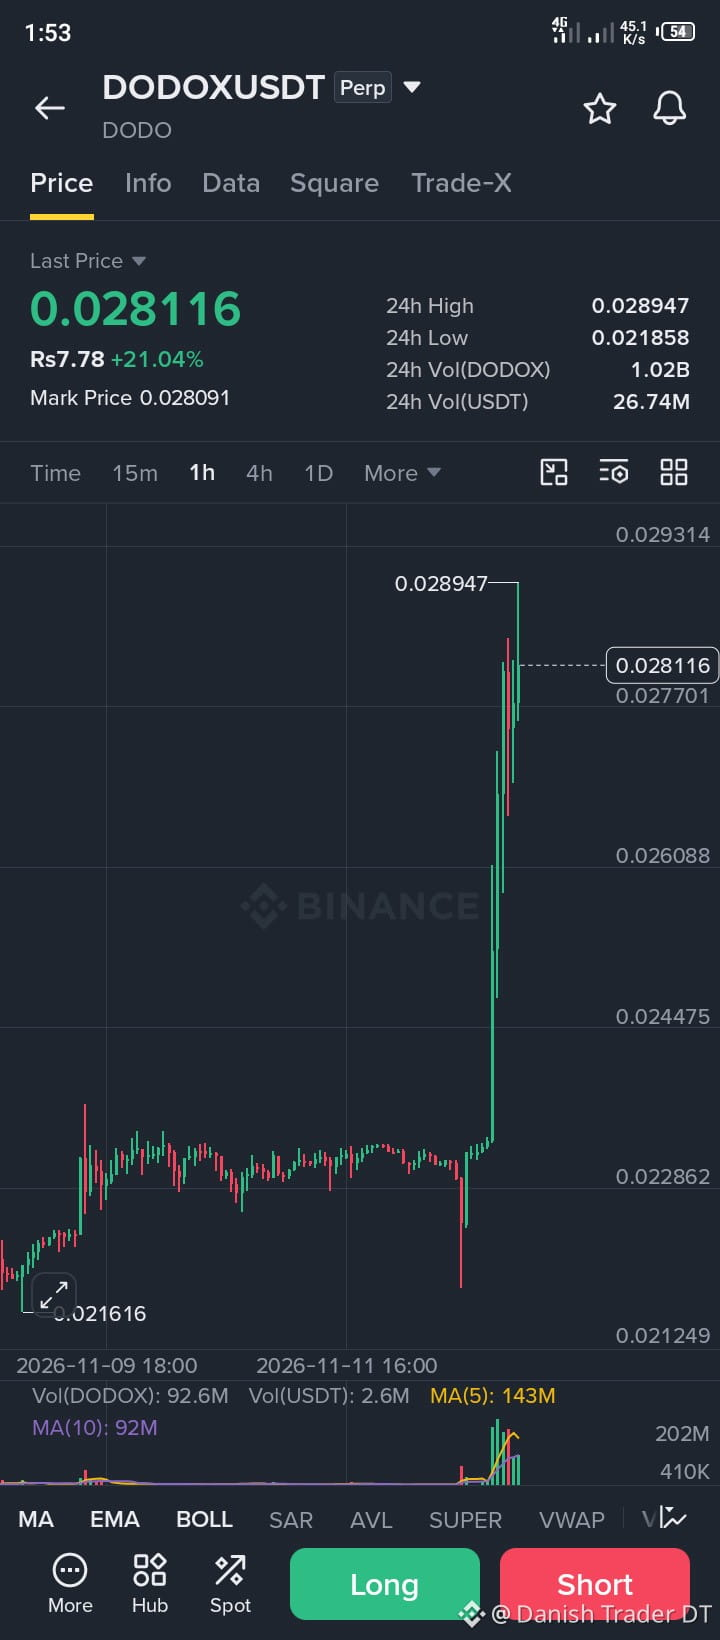
$DODOX – LONG
TP1: 0.02907
SL: 0.02613
$DODOX is holding above its moving averages, showing signs of stability. Buyers may be building momentum for another upward move.
The key now is whether price can maintain its strength and push higher. I'll be watching for bullish confirmation before the next move.
Never go all-in. Use a position size that fits your own account.
Trade $DODOX Here
{future}(DODOXUSDT)
$DODOX – LONG
TP1: 0.02907
SL: 0.02613
$DODOX is holding above its moving averages, showing signs of stability. Buyers may be building momentum for another upward move.
The key now is whether price can maintain its strength and push higher. I'll be watching for bullish confirmation before the next move.
Never go all-in. Use a position size that fits your own account.
Trade $DODOX Here
TP1: 0.02907
SL: 0.02613
$DODOX is holding above its moving averages, showing signs of stability. Buyers may be building momentum for another upward move.
The key now is whether price can maintain its strength and push higher. I'll be watching for bullish confirmation before the next move.
Never go all-in. Use a position size that fits your own account.
Trade $DODOX Here
1
14
·
--
Bullish
See translation
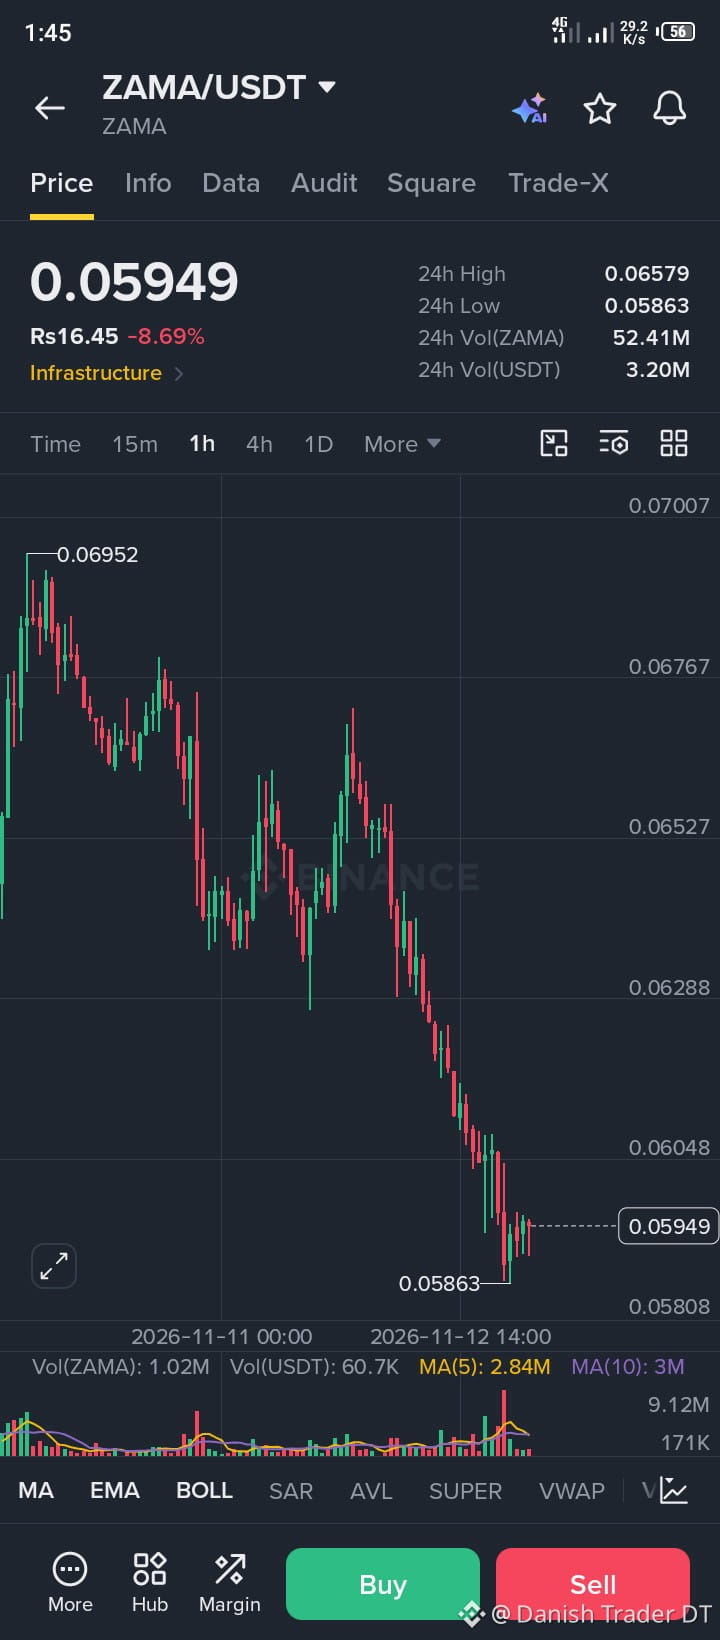
$ZAMA – LONG
Entry: 0.05809 - 0.05914
TP1: 0.06105
TP2: 0.06300
SL: 0.05635
ZAMA is trading in deeply oversold territory, making a potential relief bounce worth watching. I'm looking for a short-term recovery from these levels.
However, the 1H trend remains bearish. A spike in selling volume could cancel the bullish setup, so wait for confirmation.
Never go all-in. Use a position size that fits your own account.
Trade $ZAMA Here
{future}(ZAMAUSDT)
$ZAMA – LONG
Entry: 0.05809 - 0.05914
TP1: 0.06105
TP2: 0.06300
SL: 0.05635
ZAMA is trading in deeply oversold territory, making a potential relief bounce worth watching. I'm looking for a short-term recovery from these levels.
However, the 1H trend remains bearish. A spike in selling volume could cancel the bullish setup, so wait for confirmation.
Never go all-in. Use a position size that fits your own account.
Trade $ZAMA Here
Entry: 0.05809 - 0.05914
TP1: 0.06105
TP2: 0.06300
SL: 0.05635
ZAMA is trading in deeply oversold territory, making a potential relief bounce worth watching. I'm looking for a short-term recovery from these levels.
However, the 1H trend remains bearish. A spike in selling volume could cancel the bullish setup, so wait for confirmation.
Never go all-in. Use a position size that fits your own account.
Trade $ZAMA Here
1
29
·
--
Bullish
See translation
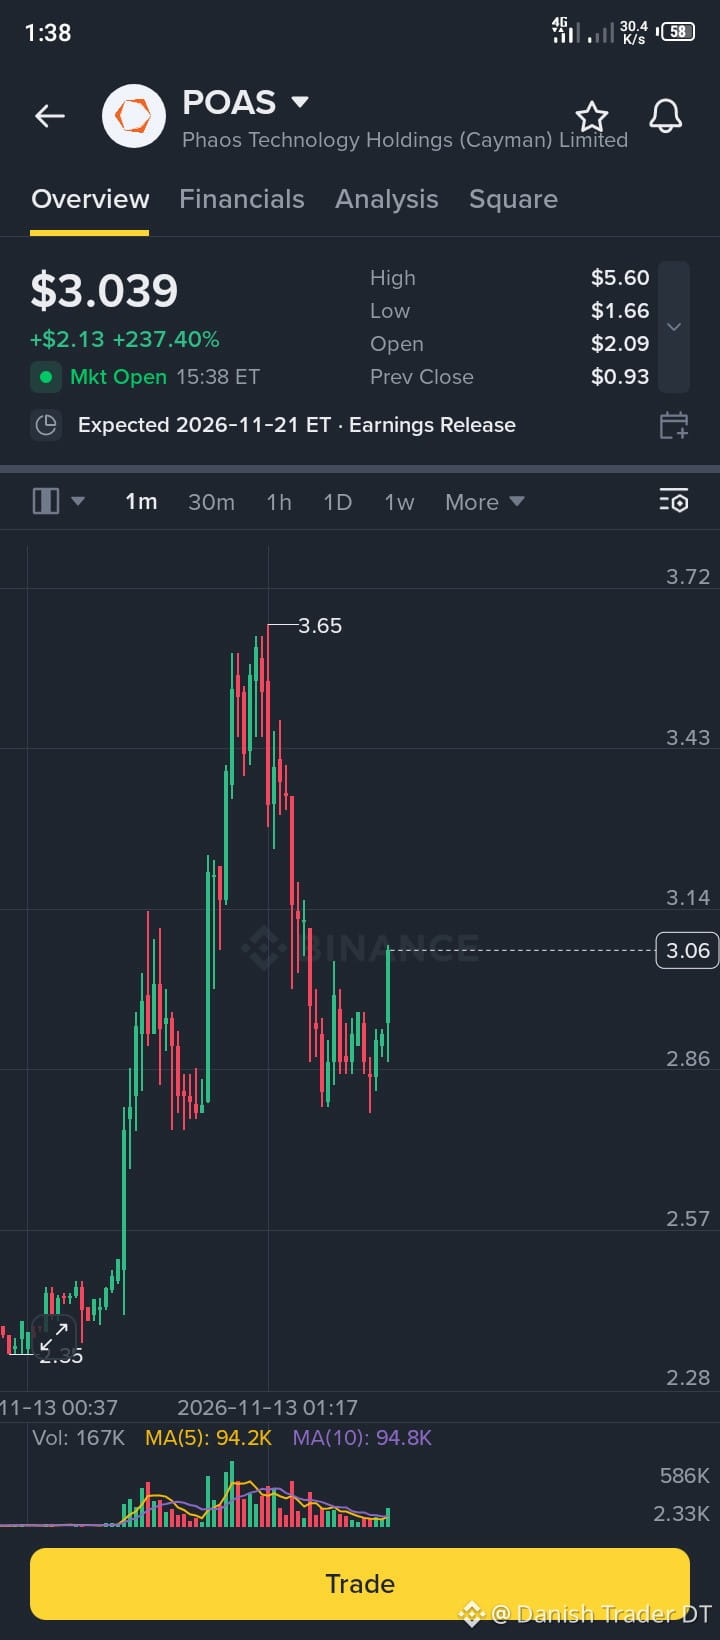
$POAS – BULLISH RECOVERY IN FOCUS
POAS has made a massive move, gaining over 237% and reaching a high of $3.65. After the sharp pullback, price found support around $2.86 and is now showing signs of recovery near $3.04.
Key levels to watch:
Support: $2.86
Resistance: $3.14
Next resistance: $3.43
Major high: $3.65
A breakout above $3.14 could strengthen the bullish momentum, while losing $2.86 may bring another pullback.
Don't chase the pump. Wait for confirmation and manage your risk carefully.
Trade $POAS.US Here
{stock_us}(POAS.US)
$POAS – BULLISH RECOVERY IN FOCUS
POAS has made a massive move, gaining over 237% and reaching a high of $3.65. After the sharp pullback, price found support around $2.86 and is now showing signs of recovery near $3.04.
Key levels to watch:
Support: $2.86
Resistance: $3.14
Next resistance: $3.43
Major high: $3.65
A breakout above $3.14 could strengthen the bullish momentum, while losing $2.86 may bring another pullback.
Don't chase the pump. Wait for confirmation and manage your risk carefully.
Trade $POAS.US Here
POAS has made a massive move, gaining over 237% and reaching a high of $3.65. After the sharp pullback, price found support around $2.86 and is now showing signs of recovery near $3.04.
Key levels to watch:
Support: $2.86
Resistance: $3.14
Next resistance: $3.43
Major high: $3.65
A breakout above $3.14 could strengthen the bullish momentum, while losing $2.86 may bring another pullback.
Don't chase the pump. Wait for confirmation and manage your risk carefully.
Trade $POAS.US Here
POASUS-9.98%
1
39
·
--
Bullish
See translation
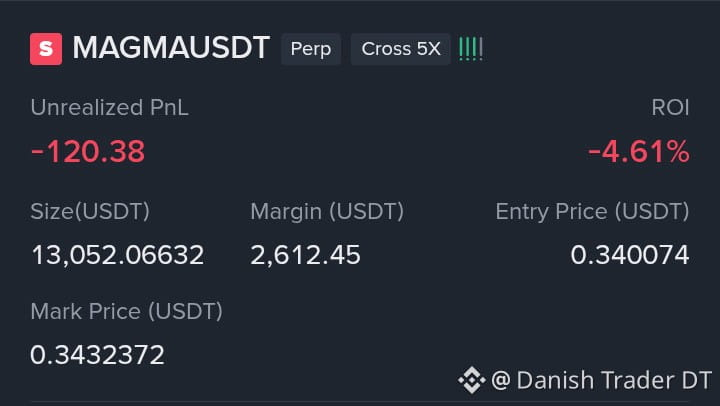
$MAGMA – LONG
Entry: 0.34447
TP1: 0.35163
TP2: 0.38593
TP3: 0.42582
SL: 0.24464
$MAGMA is showing an interesting potential upside setup. I'm watching this entry zone for a possible bullish move toward the listed targets.
Stay patient and manage your risk properly. Don't rush into the trade.
Never go all-in. Use a position size that fits your own account.
Trade $MAGMA Here
{future}(MAGMAUSDT)
$MAGMA – LONG
Entry: 0.34447
TP1: 0.35163
TP2: 0.38593
TP3: 0.42582
SL: 0.24464
$MAGMA is showing an interesting potential upside setup. I'm watching this entry zone for a possible bullish move toward the listed targets.
Stay patient and manage your risk properly. Don't rush into the trade.
Never go all-in. Use a position size that fits your own account.
Trade $MAGMA Here
Entry: 0.34447
TP1: 0.35163
TP2: 0.38593
TP3: 0.42582
SL: 0.24464
$MAGMA is showing an interesting potential upside setup. I'm watching this entry zone for a possible bullish move toward the listed targets.
Stay patient and manage your risk properly. Don't rush into the trade.
Never go all-in. Use a position size that fits your own account.
Trade $MAGMA Here
Danish Trader DT
·
--
Bullish$MAGMA – LONG SETUP
MAGMA is showing an interesting opportunity at the current price. I'm watching for a possible upward move from here.
Entry: 0.2927
TP1: 0.3267
TP2: 0.3500
SL: 0.2400
Keep your risk under control and avoid entering with more than you can afford to lose.
Trade $MAGMA Here
MAGMA is showing an interesting opportunity at the current price. I'm watching for a possible upward move from here.
Entry: 0.2927
TP1: 0.3267
TP2: 0.3500
SL: 0.2400
Keep your risk under control and avoid entering with more than you can afford to lose.
Trade $MAGMA Here
1
44
·
--
Bullish
See translation
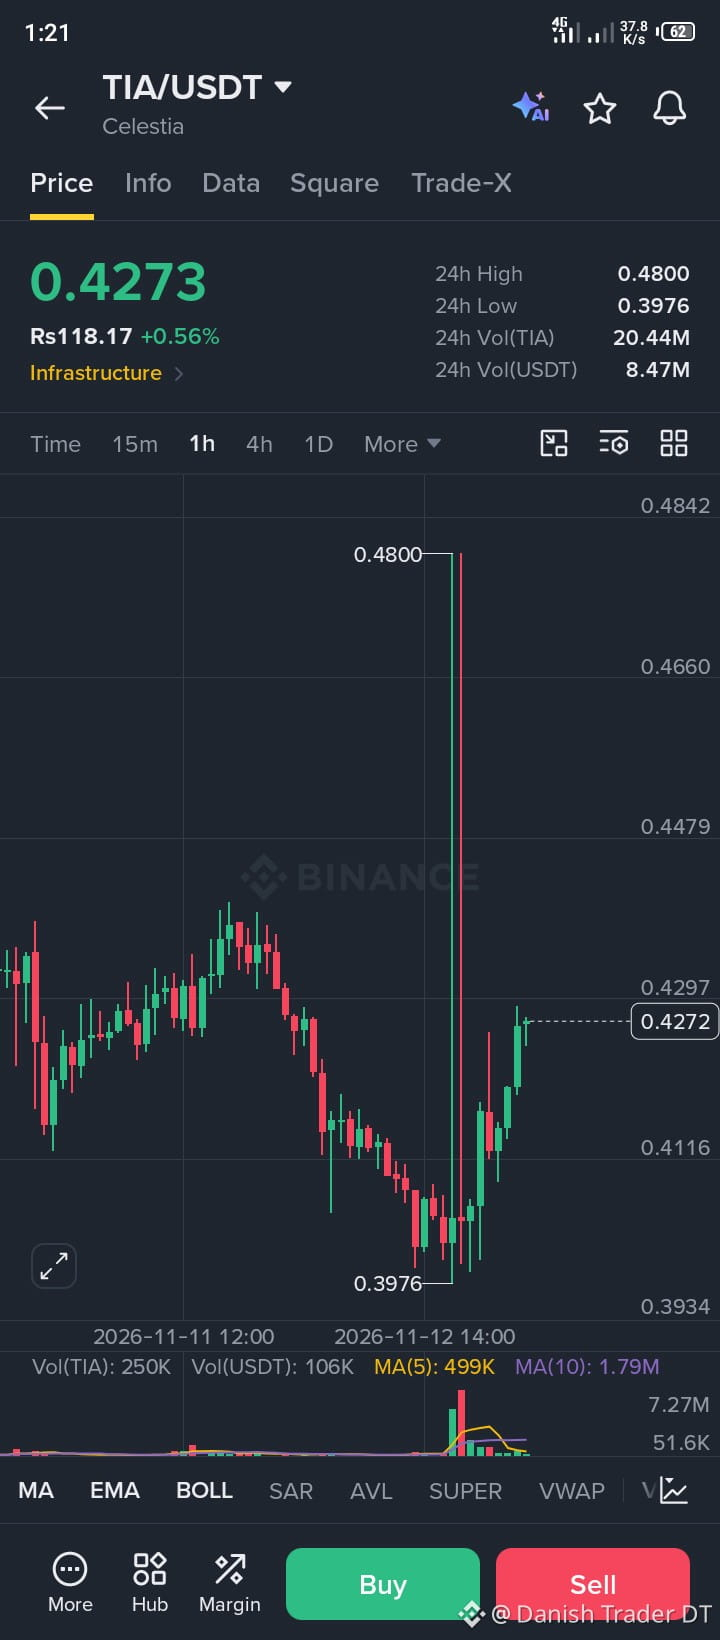
$TIA – LONG
Entry: 0.4231 - 0.4252
TP1: 0.4447
TP2: 0.4611
SL: 0.4104
TIA is showing strong momentum, but chasing the current move could be risky. I'm watching the entry zone for a possible pullback before the next upward move.
RSI is looking overextended, so a deeper correction is still possible. Wait for a suitable entry and manage risk carefully.
Never go all-in. Use a position size that fits your own account.
Trade $TIA Here
{future}(TIAUSDT)
$TIA – LONG
Entry: 0.4231 - 0.4252
TP1: 0.4447
TP2: 0.4611
SL: 0.4104
TIA is showing strong momentum, but chasing the current move could be risky. I'm watching the entry zone for a possible pullback before the next upward move.
RSI is looking overextended, so a deeper correction is still possible. Wait for a suitable entry and manage risk carefully.
Never go all-in. Use a position size that fits your own account.
Trade $TIA Here
Entry: 0.4231 - 0.4252
TP1: 0.4447
TP2: 0.4611
SL: 0.4104
TIA is showing strong momentum, but chasing the current move could be risky. I'm watching the entry zone for a possible pullback before the next upward move.
RSI is looking overextended, so a deeper correction is still possible. Wait for a suitable entry and manage risk carefully.
Never go all-in. Use a position size that fits your own account.
Trade $TIA Here
1
23
See translation
$AGT is cooling off after its massive rally!
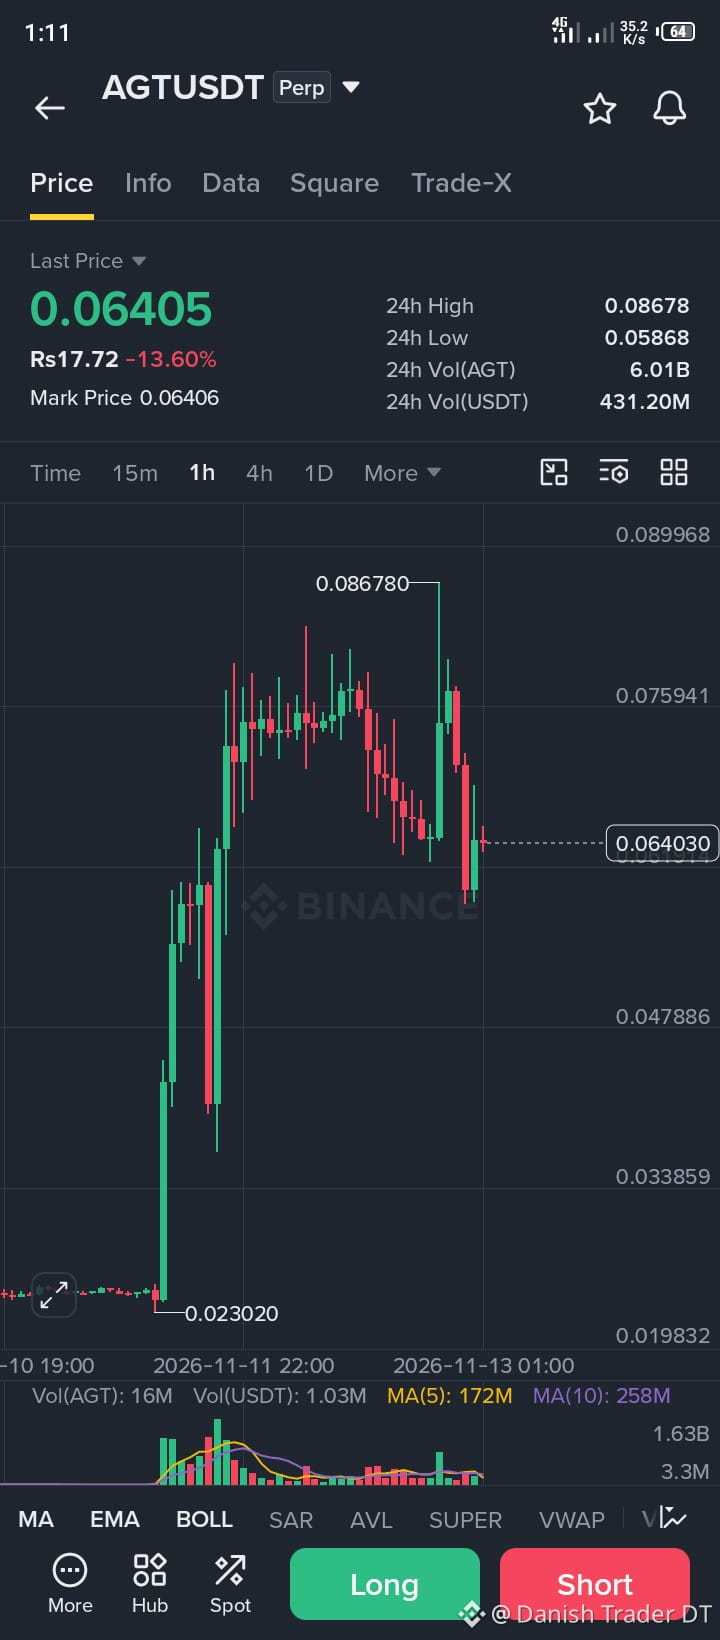
After climbing from around $0.023 to a high of $0.08678, AGT has faced strong selling pressure. It is now trading near $0.06405, down 13.60% over the last 24 hours.
The price has bounced from the $0.05868 low, but buyers still need to prove their strength. Watch the $0.05868 support and the $0.075 resistance area for the next move.
Volatility remains high, so avoid chasing the price and manage risk carefully.
Trade $AGT Here
{future}(AGTUSDT)
$AGT is cooling off after its massive rally!
After climbing from around $0.023 to a high of $0.08678, AGT has faced strong selling pressure. It is now trading near $0.06405, down 13.60% over the last 24 hours.
The price has bounced from the $0.05868 low, but buyers still need to prove their strength. Watch the $0.05868 support and the $0.075 resistance area for the next move.
Volatility remains high, so avoid chasing the price and manage risk carefully.
Trade $AGT Here
After climbing from around $0.023 to a high of $0.08678, AGT has faced strong selling pressure. It is now trading near $0.06405, down 13.60% over the last 24 hours.
The price has bounced from the $0.05868 low, but buyers still need to prove their strength. Watch the $0.05868 support and the $0.075 resistance area for the next move.
Volatility remains high, so avoid chasing the price and manage risk carefully.
Trade $AGT Here
Danish Trader DT
·
--
$AGT – I'M STILL LEANING BULLISH!
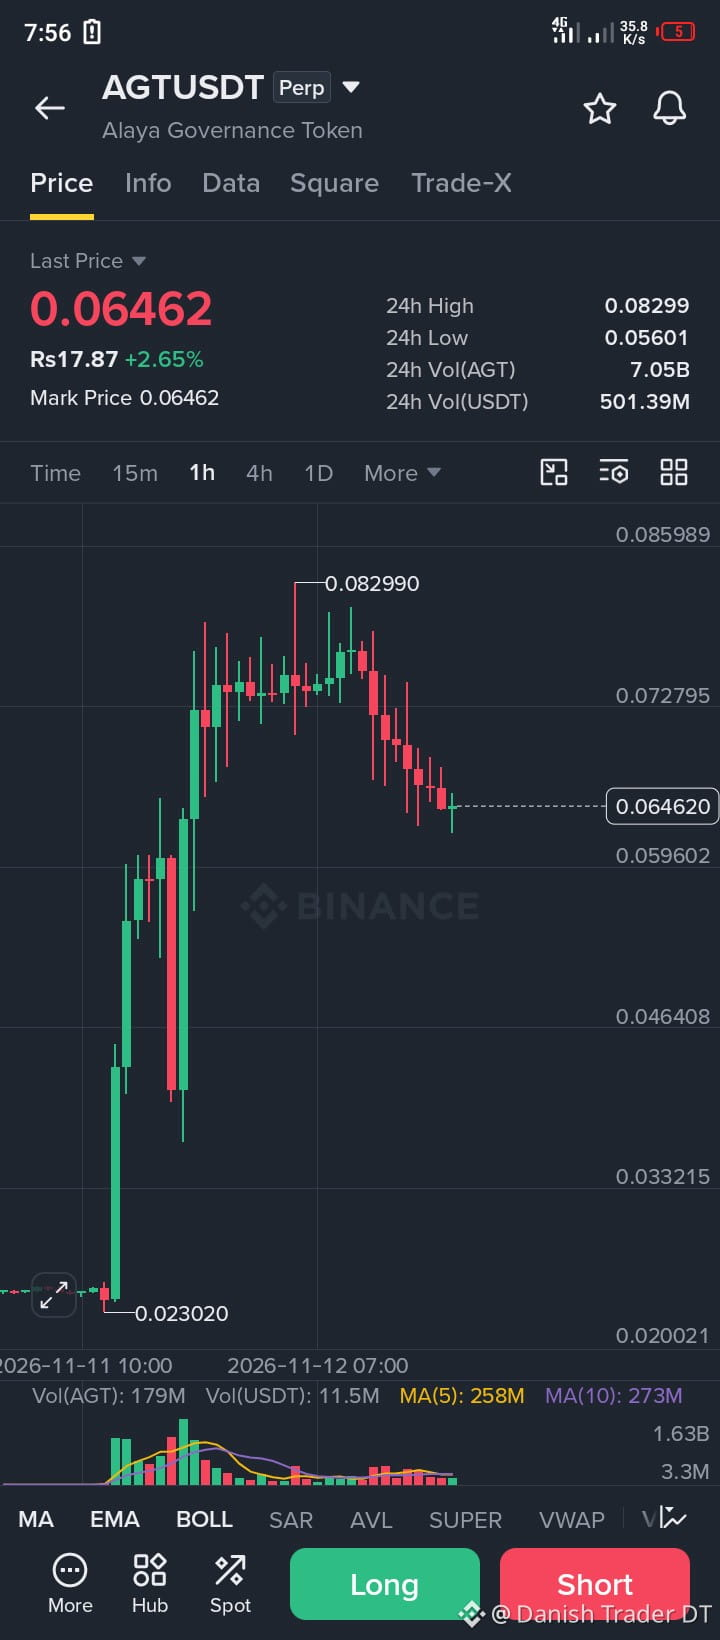
Most retail traders seem to be positioning for more downside, but I'm keeping my attention on the possibility of a bullish reversal.
With the price around $0.064, a move toward $0.30 would be a massive upside opportunity if buying pressure returns.
I believe larger holders may still have a reason to stay involved, especially while liquidity remains low. However, whale activity and market confirmation will be important to watch.
The big question is: will bears stay in control, or can bulls surprise the market?
Are you Team LONG or Team SHORT?
Most retail traders seem to be positioning for more downside, but I'm keeping my attention on the possibility of a bullish reversal.
With the price around $0.064, a move toward $0.30 would be a massive upside opportunity if buying pressure returns.
I believe larger holders may still have a reason to stay involved, especially while liquidity remains low. However, whale activity and market confirmation will be important to watch.
The big question is: will bears stay in control, or can bulls surprise the market?
Are you Team LONG or Team SHORT?
1
304
See translation
$AGT – I'M STILL LEANING BULLISH!
Most retail traders seem to be positioning for more downside, but I'm keeping my attention on the possibility of a bullish reversal.
With the price around $0.064, a move toward $0.30 would be a massive upside opportunity if buying pressure returns.
I believe larger holders may still have a reason to stay involved, especially while liquidity remains low. However, whale activity and market confirmation will be important to watch.
The big question is: will bears stay in control, or can bulls surprise the market?
Are you Team LONG or Team SHORT?
{future}(AGTUSDT)
$AGT – I'M STILL LEANING BULLISH!
Most retail traders seem to be positioning for more downside, but I'm keeping my attention on the possibility of a bullish reversal.
With the price around $0.064, a move toward $0.30 would be a massive upside opportunity if buying pressure returns.
I believe larger holders may still have a reason to stay involved, especially while liquidity remains low. However, whale activity and market confirmation will be important to watch.
The big question is: will bears stay in control, or can bulls surprise the market?
Are you Team LONG or Team SHORT?
Most retail traders seem to be positioning for more downside, but I'm keeping my attention on the possibility of a bullish reversal.
With the price around $0.064, a move toward $0.30 would be a massive upside opportunity if buying pressure returns.
I believe larger holders may still have a reason to stay involved, especially while liquidity remains low. However, whale activity and market confirmation will be important to watch.
The big question is: will bears stay in control, or can bulls surprise the market?
Are you Team LONG or Team SHORT?
1
33
·
--
Bearish
Partly True
See translation
$XAU – WATCHING A POTENTIAL FINAL DIP
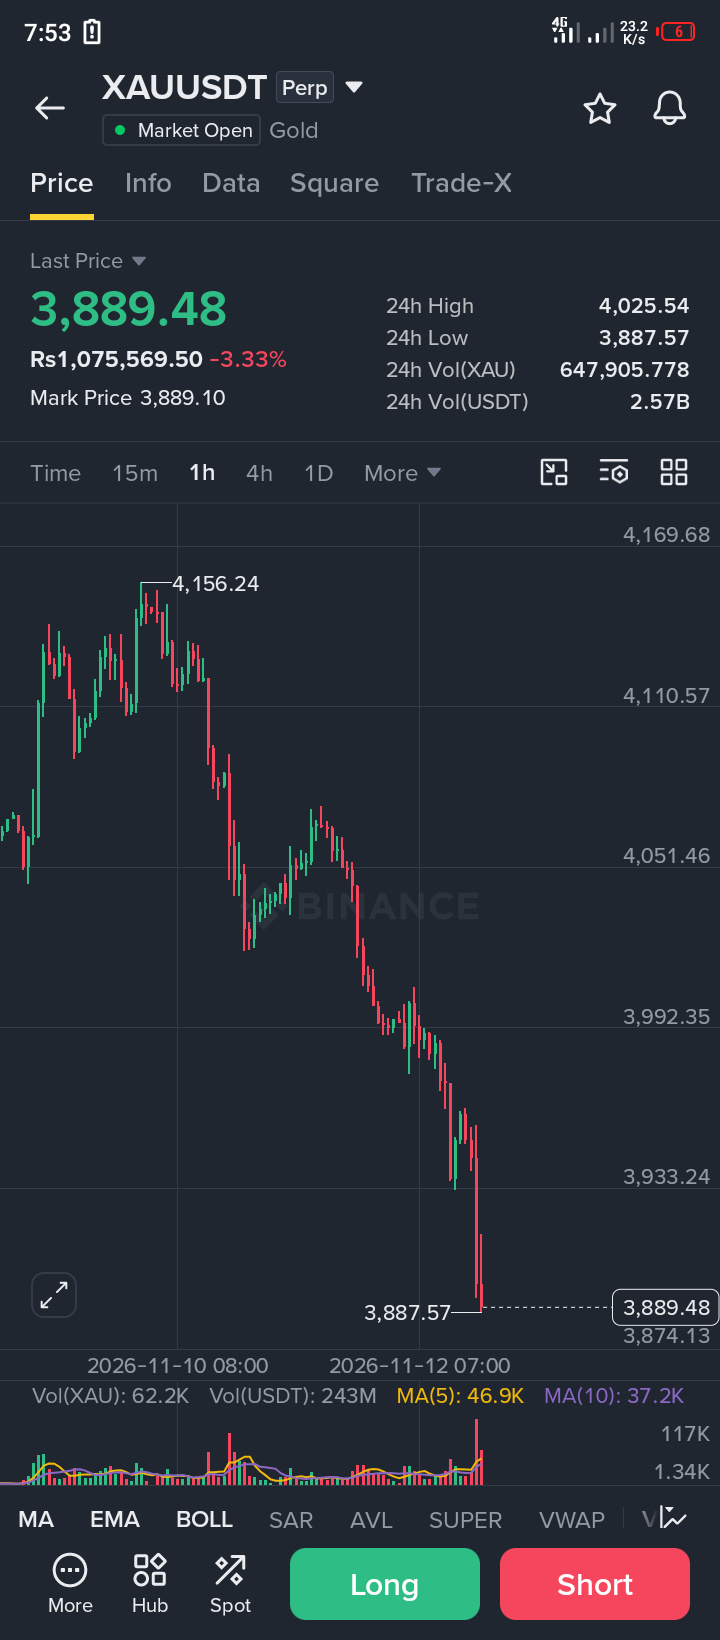
Gold is trading around $3,900, sitting close to the $3,885–$3,904 support zone.
A final liquidity sweep toward lower levels could happen before buyers attempt another strong move upward.
Key downside levels:
$3,800
$3,700
$3,555–$3,600
On the upside, $4,155 and $4,700 are previous levels cleared during this pullback, while $5,000 remains the bigger target.
This correction could create a base for another bullish move, but confirmation is important. Watch support carefully and manage risk.
Trade $XAUT Here
{future}(XAUTUSDT)
$XAU – WATCHING A POTENTIAL FINAL DIP
Gold is trading around $3,900, sitting close to the $3,885–$3,904 support zone.
A final liquidity sweep toward lower levels could happen before buyers attempt another strong move upward.
Key downside levels:
$3,800
$3,700
$3,555–$3,600
On the upside, $4,155 and $4,700 are previous levels cleared during this pullback, while $5,000 remains the bigger target.
This correction could create a base for another bullish move, but confirmation is important. Watch support carefully and manage risk.
Trade $XAUT Here
Gold is trading around $3,900, sitting close to the $3,885–$3,904 support zone.
A final liquidity sweep toward lower levels could happen before buyers attempt another strong move upward.
Key downside levels:
$3,800
$3,700
$3,555–$3,600
On the upside, $4,155 and $4,700 are previous levels cleared during this pullback, while $5,000 remains the bigger target.
This correction could create a base for another bullish move, but confirmation is important. Watch support carefully and manage risk.
Trade $XAUT Here
Danish Trader DT
·
--
Bearish$XAU – SHORT
Entry: 3,956.13 – 3,975.91
TP1: 3,773.14
TP2: 3,618.84
SL: 4,095.19
Gold's recent bounce looks weak, and sellers may be preparing for another move down. The bearish outlook remains in focus as long as price stays below the resistance zone.
Be careful: Strong short-covering could push price above 3,970 and weaken the immediate bearish setup. Wait for confirmation before entering.
Never go all-in. Use a position size that fits your own account.
Trade $XAU Here
Entry: 3,956.13 – 3,975.91
TP1: 3,773.14
TP2: 3,618.84
SL: 4,095.19
Gold's recent bounce looks weak, and sellers may be preparing for another move down. The bearish outlook remains in focus as long as price stays below the resistance zone.
Be careful: Strong short-covering could push price above 3,970 and weaken the immediate bearish setup. Wait for confirmation before entering.
Never go all-in. Use a position size that fits your own account.
Trade $XAU Here
1
690
·
--
Bullish
See translation
$QNT – LONG SETUP
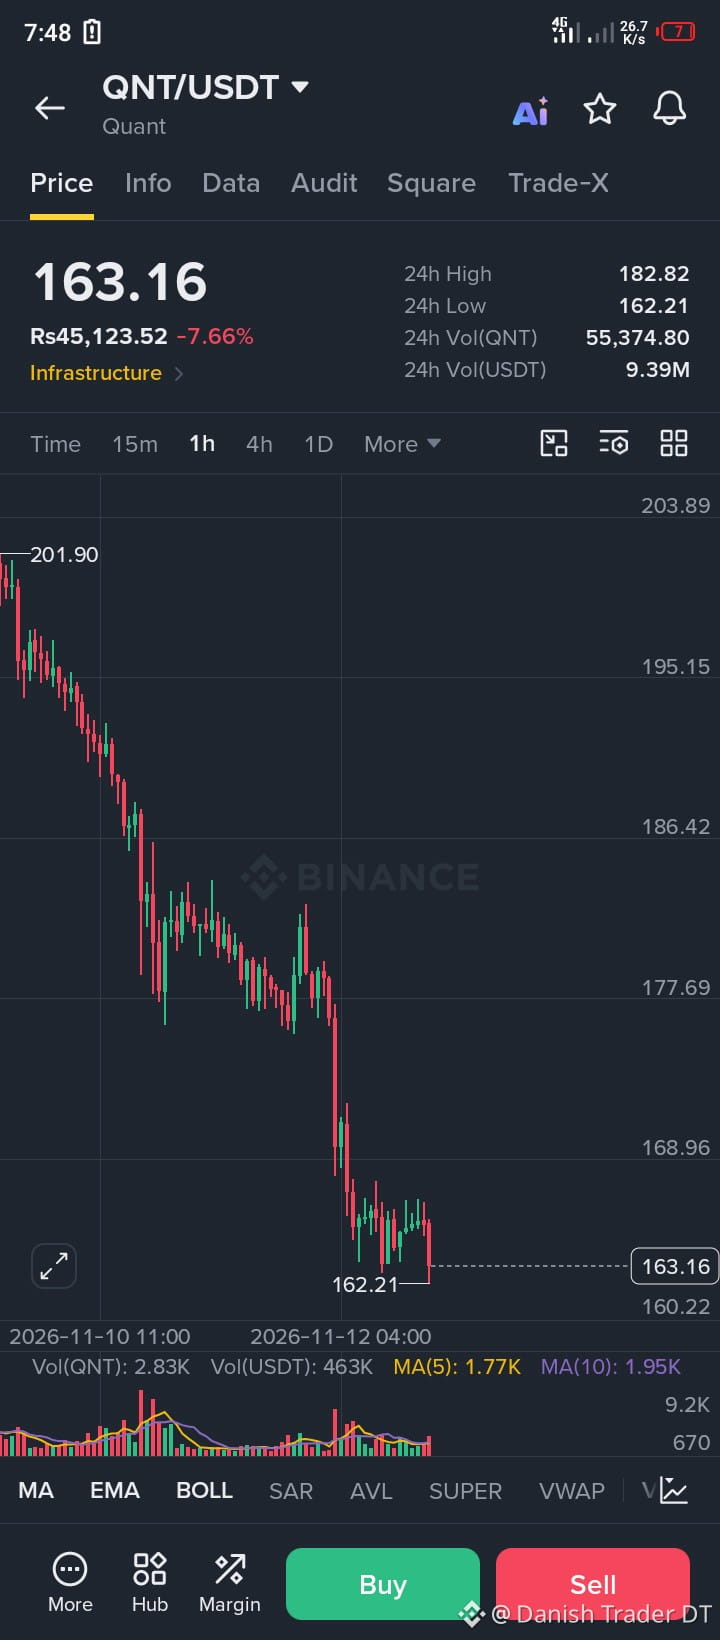
TP1: 168.8
SL: 155.8
$QNT is showing signs of recovery after recent selling pressure. Buyers may be starting to step in, but the real test is whether this momentum can continue.
I'll be watching closely for further strength before making any move.
Never go all-in. Use a position size that fits your own account.
Trade $QNT Here
{future}(QNTUSDT)
$QNT – LONG SETUP
TP1: 168.8
SL: 155.8
$QNT is showing signs of recovery after recent selling pressure. Buyers may be starting to step in, but the real test is whether this momentum can continue.
I'll be watching closely for further strength before making any move.
Never go all-in. Use a position size that fits your own account.
Trade $QNT Here
TP1: 168.8
SL: 155.8
$QNT is showing signs of recovery after recent selling pressure. Buyers may be starting to step in, but the real test is whether this momentum can continue.
I'll be watching closely for further strength before making any move.
Never go all-in. Use a position size that fits your own account.
Trade $QNT Here
Danish Trader DT
·
--
Bearish$QNT – SHORT
Entry: 164 - 167
TP1: 158.48
TP2: 152.86
SL: 172.01
QNT is struggling to hold its support, and continued selling pressure could lead to a breakdown toward the next downside targets. However, deeply oversold 1H RSI conditions increase the risk of a sharp but temporary relief bounce. Watch the support reaction carefully.
Never go all-in. Use a position size that fits your own account.
Trade $QNT Here
Entry: 164 - 167
TP1: 158.48
TP2: 152.86
SL: 172.01
QNT is struggling to hold its support, and continued selling pressure could lead to a breakdown toward the next downside targets. However, deeply oversold 1H RSI conditions increase the risk of a sharp but temporary relief bounce. Watch the support reaction carefully.
Never go all-in. Use a position size that fits your own account.
Trade $QNT Here
1
298
·
--
Bearish
See translation
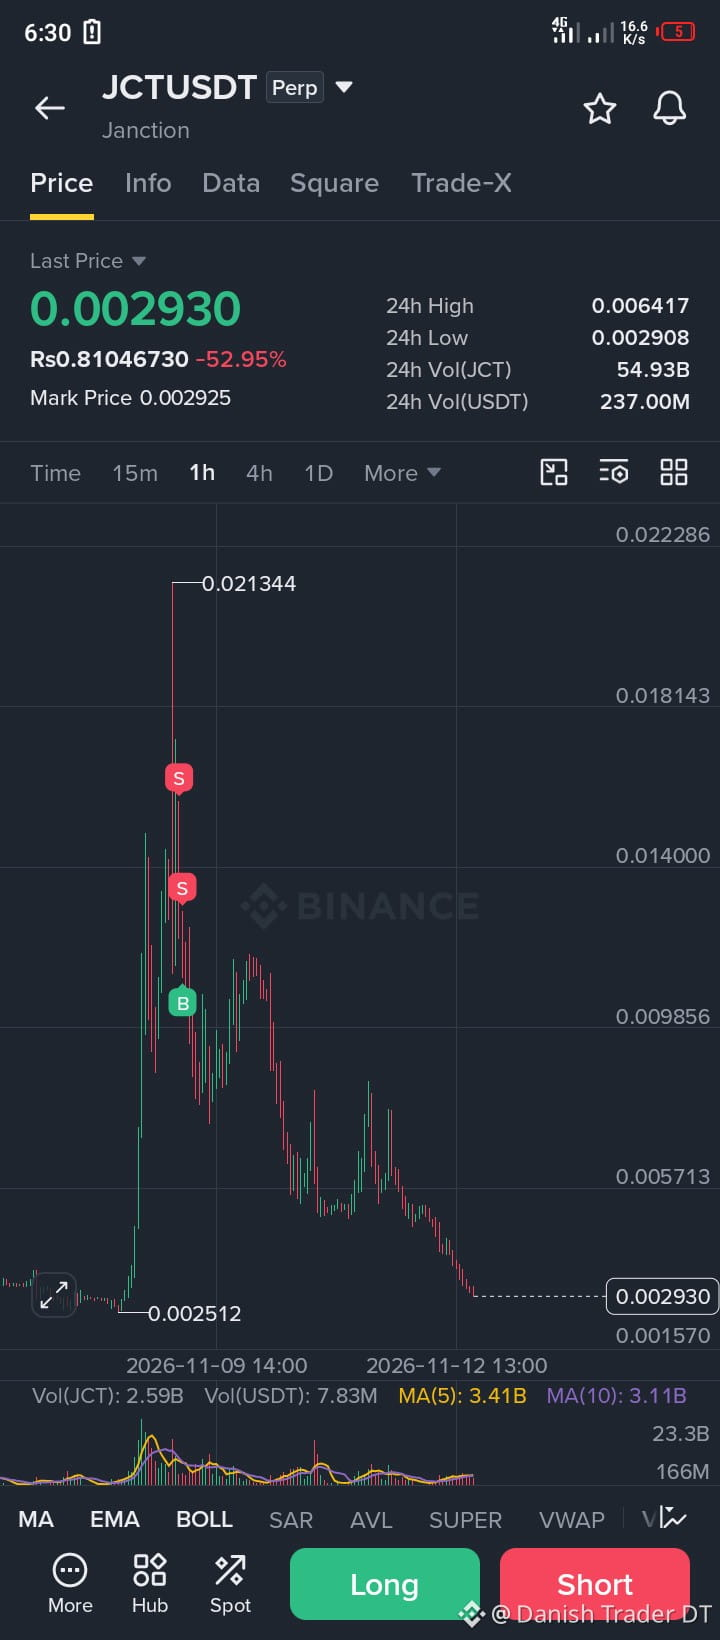
$JCT – SHORT
Entry: 0.002996 - 0.003062
TP1: 0.002720
TP2: 0.00247
SL: 0.003263
$JCT is showing continued weakness near its lows, with sellers still putting pressure on the price. A further decline is possible if bearish momentum continues.
However, RSI is deeply oversold, so a sudden bounce or short squeeze cannot be ignored. Manage your risk carefully.
Never go all-in. Use a position size that fits your own account.
Trade $JCT Here
{future}(JCTUSDT)
$JCT – SHORT
Entry: 0.002996 - 0.003062
TP1: 0.002720
TP2: 0.00247
SL: 0.003263
$JCT is showing continued weakness near its lows, with sellers still putting pressure on the price. A further decline is possible if bearish momentum continues.
However, RSI is deeply oversold, so a sudden bounce or short squeeze cannot be ignored. Manage your risk carefully.
Never go all-in. Use a position size that fits your own account.
Trade $JCT Here
Entry: 0.002996 - 0.003062
TP1: 0.002720
TP2: 0.00247
SL: 0.003263
$JCT is showing continued weakness near its lows, with sellers still putting pressure on the price. A further decline is possible if bearish momentum continues.
However, RSI is deeply oversold, so a sudden bounce or short squeeze cannot be ignored. Manage your risk carefully.
Never go all-in. Use a position size that fits your own account.
Trade $JCT Here
1
18
See translation
$SOL – KEY SUPPORT IN FOCUS
SOL is currently holding near the $82.48 support zone, where a potential double-bottom pattern may be developing.
The next move is important. A strong bounce could open the door to recovery, while a breakdown below support may bring further downside pressure.
I'm waiting for clear confirmation before considering an entry. No need to rush into the market.
Stay patient and watch the reaction around this level.
Trade $SOL Here
{future}(SOLUSDT)
$SOL – KEY SUPPORT IN FOCUS
SOL is currently holding near the $82.48 support zone, where a potential double-bottom pattern may be developing.
The next move is important. A strong bounce could open the door to recovery, while a breakdown below support may bring further downside pressure.
I'm waiting for clear confirmation before considering an entry. No need to rush into the market.
Stay patient and watch the reaction around this level.
Trade $SOL Here
SOL is currently holding near the $82.48 support zone, where a potential double-bottom pattern may be developing.
The next move is important. A strong bounce could open the door to recovery, while a breakdown below support may bring further downside pressure.
I'm waiting for clear confirmation before considering an entry. No need to rush into the market.
Stay patient and watch the reaction around this level.
Trade $SOL Here
1
33
·
--
Bullish
See translation
$MAGMA – LONG SETUP
MAGMA is showing an interesting opportunity at the current price. I'm watching for a possible upward move from here.
Entry: 0.2927
TP1: 0.3267
TP2: 0.3500
SL: 0.2400
Keep your risk under control and avoid entering with more than you can afford to lose.
Trade $MAGMA Here
{future}(MAGMAUSDT)
$MAGMA – LONG SETUP
MAGMA is showing an interesting opportunity at the current price. I'm watching for a possible upward move from here.
Entry: 0.2927
TP1: 0.3267
TP2: 0.3500
SL: 0.2400
Keep your risk under control and avoid entering with more than you can afford to lose.
Trade $MAGMA Here
MAGMA is showing an interesting opportunity at the current price. I'm watching for a possible upward move from here.
Entry: 0.2927
TP1: 0.3267
TP2: 0.3500
SL: 0.2400
Keep your risk under control and avoid entering with more than you can afford to lose.
Trade $MAGMA Here
1
1
30
·
--
Bullish
See translation
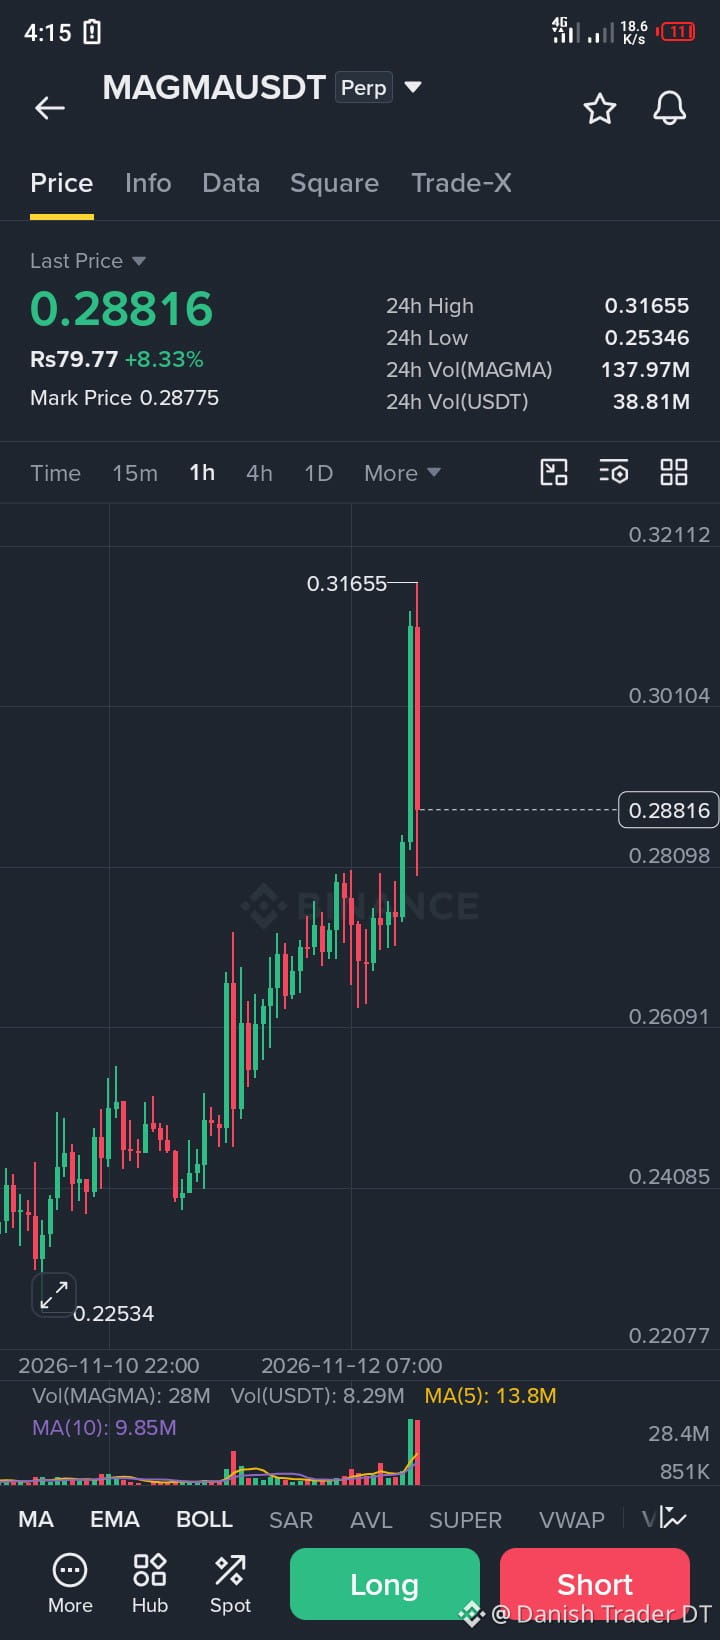
$MAGMA – LONG
Entry: 0.2980 - 0.3070
TP1: 0.3150
TP2: 0.3250
TP3: 0.3380
TP4: 0.3550
SL: 0.2880
$MAGMA is on my watchlist for a potential upside move. I'm watching the entry zone closely, with multiple targets above it.
Never go all-in. Use a position size that fits your own account.
Trade $MAGMA Here
{future}(MAGMAUSDT)
$MAGMA – LONG
Entry: 0.2980 - 0.3070
TP1: 0.3150
TP2: 0.3250
TP3: 0.3380
TP4: 0.3550
SL: 0.2880
$MAGMA is on my watchlist for a potential upside move. I'm watching the entry zone closely, with multiple targets above it.
Never go all-in. Use a position size that fits your own account.
Trade $MAGMA Here
Entry: 0.2980 - 0.3070
TP1: 0.3150
TP2: 0.3250
TP3: 0.3380
TP4: 0.3550
SL: 0.2880
$MAGMA is on my watchlist for a potential upside move. I'm watching the entry zone closely, with multiple targets above it.
Never go all-in. Use a position size that fits your own account.
Trade $MAGMA Here
Danish Trader DT
·
--
Bearish$MEGA – SHORT
Entry: 0.0439 – 0.0449
TP1: 0.0418
TP2: 0.0397
SL: 0.0467
MEGA remains under strong bearish pressure, making the current rejection a potential short opportunity. However, extremely oversold RSI conditions could trigger a sharp short-squeeze bounce, so manage risk carefully.
Never go all-in. Use a position size that fits your account.
Trade $MEGA Here
Entry: 0.0439 – 0.0449
TP1: 0.0418
TP2: 0.0397
SL: 0.0467
MEGA remains under strong bearish pressure, making the current rejection a potential short opportunity. However, extremely oversold RSI conditions could trigger a sharp short-squeeze bounce, so manage risk carefully.
Never go all-in. Use a position size that fits your account.
Trade $MEGA Here
1
10
·
--
Bullish
See translation
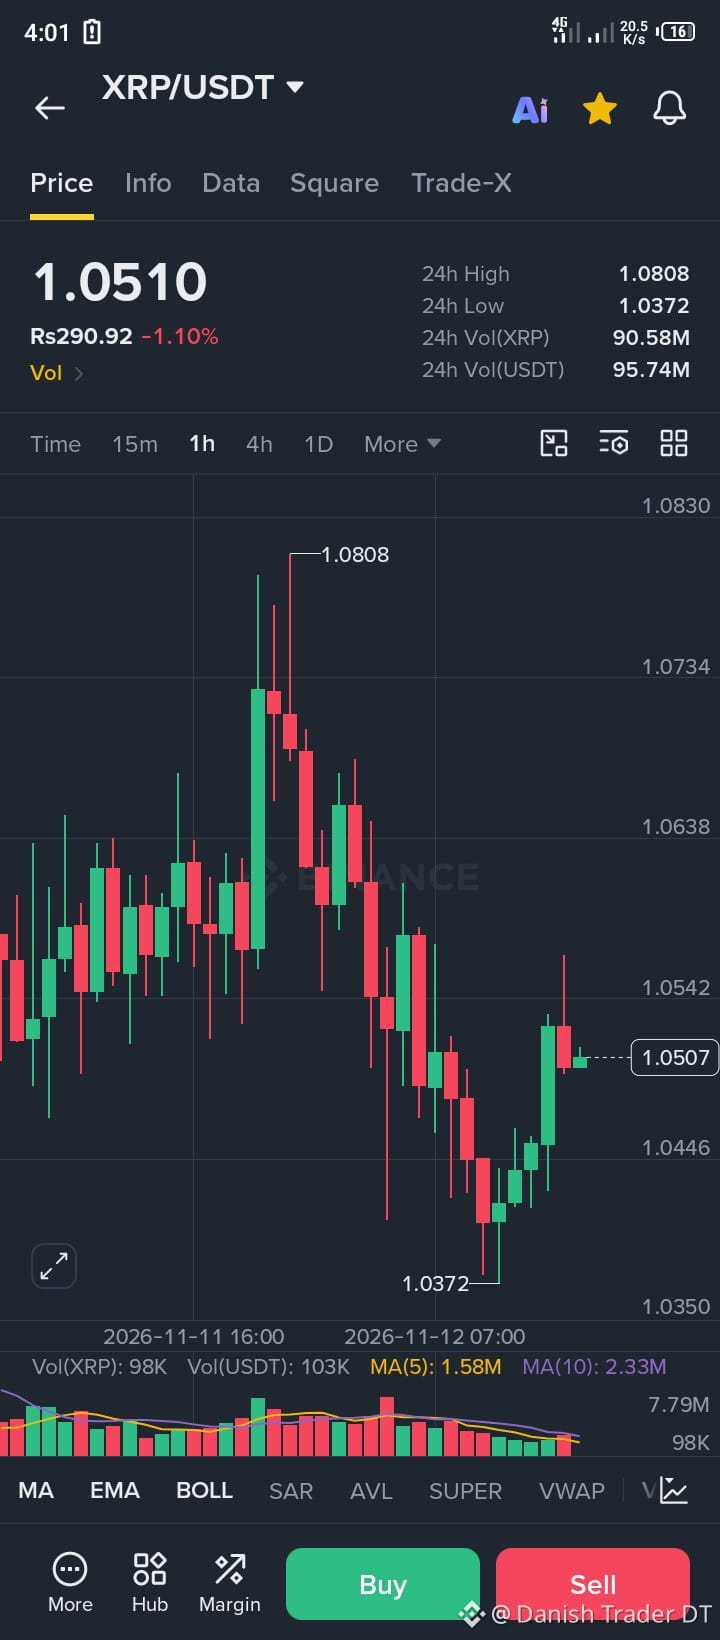
$XRP – LONG
TP1: 1.1007
SL: 1.0159
XRP is finally showing some strength above the moving averages. Buyers are starting to gain momentum, but the real test is whether price can hold above these levels.
If bullish momentum continues, XRP could push toward 1.1007. However, losing support near 1.0159 would weaken the bullish outlook.
Never go all-in. Use a position size that fits your own account.
Trade XRP Here
{future}(XRPUSDT)
Hot coins:
$SKHYNIX : Current Price 944.47 - 24h Change: -2.48%
{future}(SKHYNIXUSDT)
$ERA : Current Price 0.09576 - 24h Change: +13.09%
{stock_us}(EARN.US)
$XRP – LONG
TP1: 1.1007
SL: 1.0159
XRP is finally showing some strength above the moving averages. Buyers are starting to gain momentum, but the real test is whether price can hold above these levels.
If bullish momentum continues, XRP could push toward 1.1007. However, losing support near 1.0159 would weaken the bullish outlook.
Never go all-in. Use a position size that fits your own account.
Trade XRP Here
Hot coins:
$SKHYNIX : Current Price 944.47 - 24h Change: -2.48%
$ERA : Current Price 0.09576 - 24h Change: +13.09%
TP1: 1.1007
SL: 1.0159
XRP is finally showing some strength above the moving averages. Buyers are starting to gain momentum, but the real test is whether price can hold above these levels.
If bullish momentum continues, XRP could push toward 1.1007. However, losing support near 1.0159 would weaken the bullish outlook.
Never go all-in. Use a position size that fits your own account.
Trade XRP Here
Hot coins:
$SKHYNIX : Current Price 944.47 - 24h Change: -2.48%
$ERA : Current Price 0.09576 - 24h Change: +13.09%
1
35
·
--
Bearish
See translation
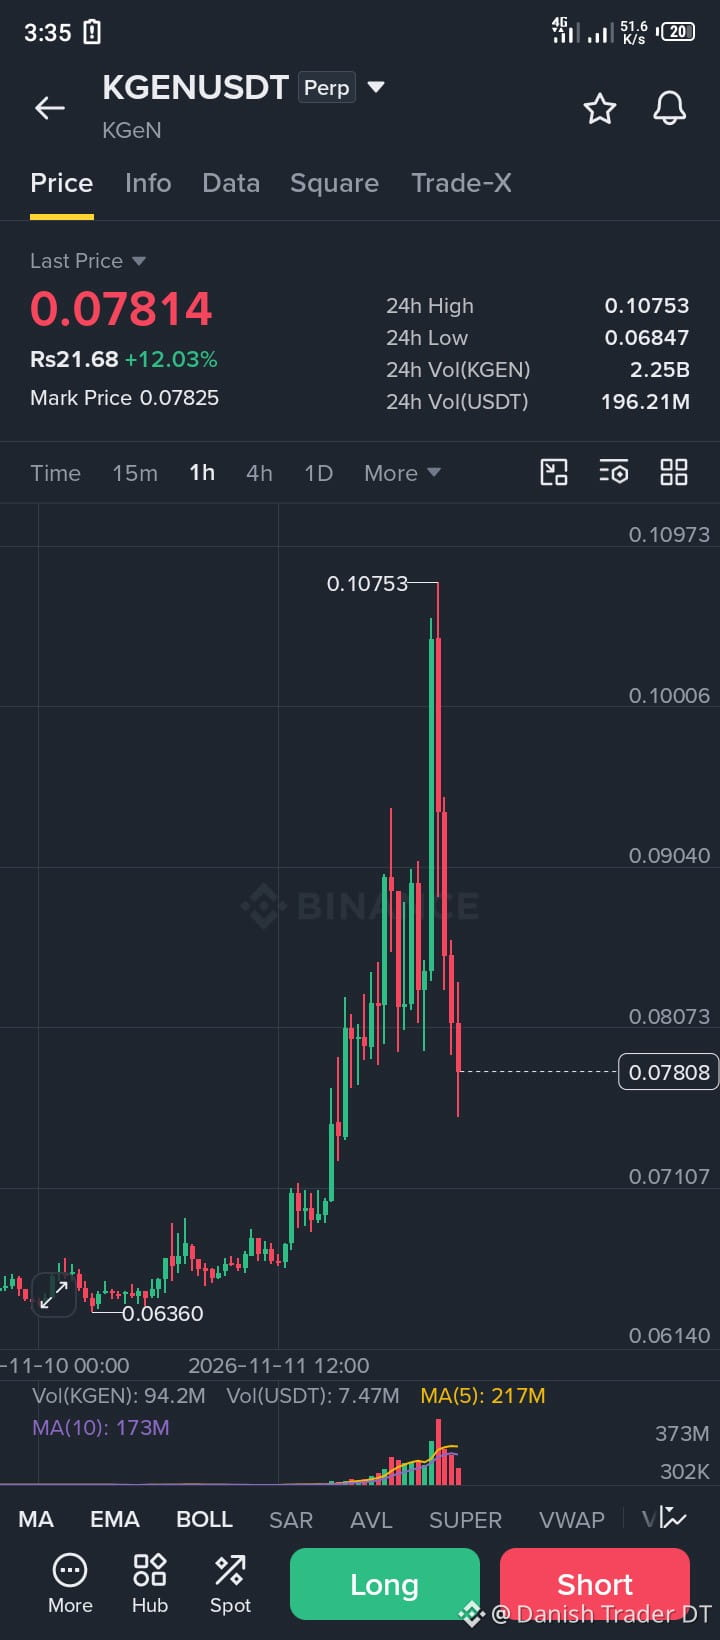
$KGEN – SHORT
Entry: 0.07852 – 0.08025
TP1: 0.0715
TP2: 0.0652
SL: 0.08346
$KGEN is showing strong selling pressure and continues to move lower. The bearish trend remains in focus, but waiting for price to approach the 1H MA99 could help avoid entering too early.
Be careful: Oversold 15m RSI may trigger a sharp bounce. A move above 0.08346 would invalidate this short setup.
Never go all-in. Use a position size that fits your own account.
Trade $KGEN Here
{future}(KGENUSDT)
$KGEN – SHORT
Entry: 0.07852 – 0.08025
TP1: 0.0715
TP2: 0.0652
SL: 0.08346
$KGEN is showing strong selling pressure and continues to move lower. The bearish trend remains in focus, but waiting for price to approach the 1H MA99 could help avoid entering too early.
Be careful: Oversold 15m RSI may trigger a sharp bounce. A move above 0.08346 would invalidate this short setup.
Never go all-in. Use a position size that fits your own account.
Trade $KGEN Here
Entry: 0.07852 – 0.08025
TP1: 0.0715
TP2: 0.0652
SL: 0.08346
$KGEN is showing strong selling pressure and continues to move lower. The bearish trend remains in focus, but waiting for price to approach the 1H MA99 could help avoid entering too early.
Be careful: Oversold 15m RSI may trigger a sharp bounce. A move above 0.08346 would invalidate this short setup.
Never go all-in. Use a position size that fits your own account.
Trade $KGEN Here
1
20
·
--
Bearish
See translation
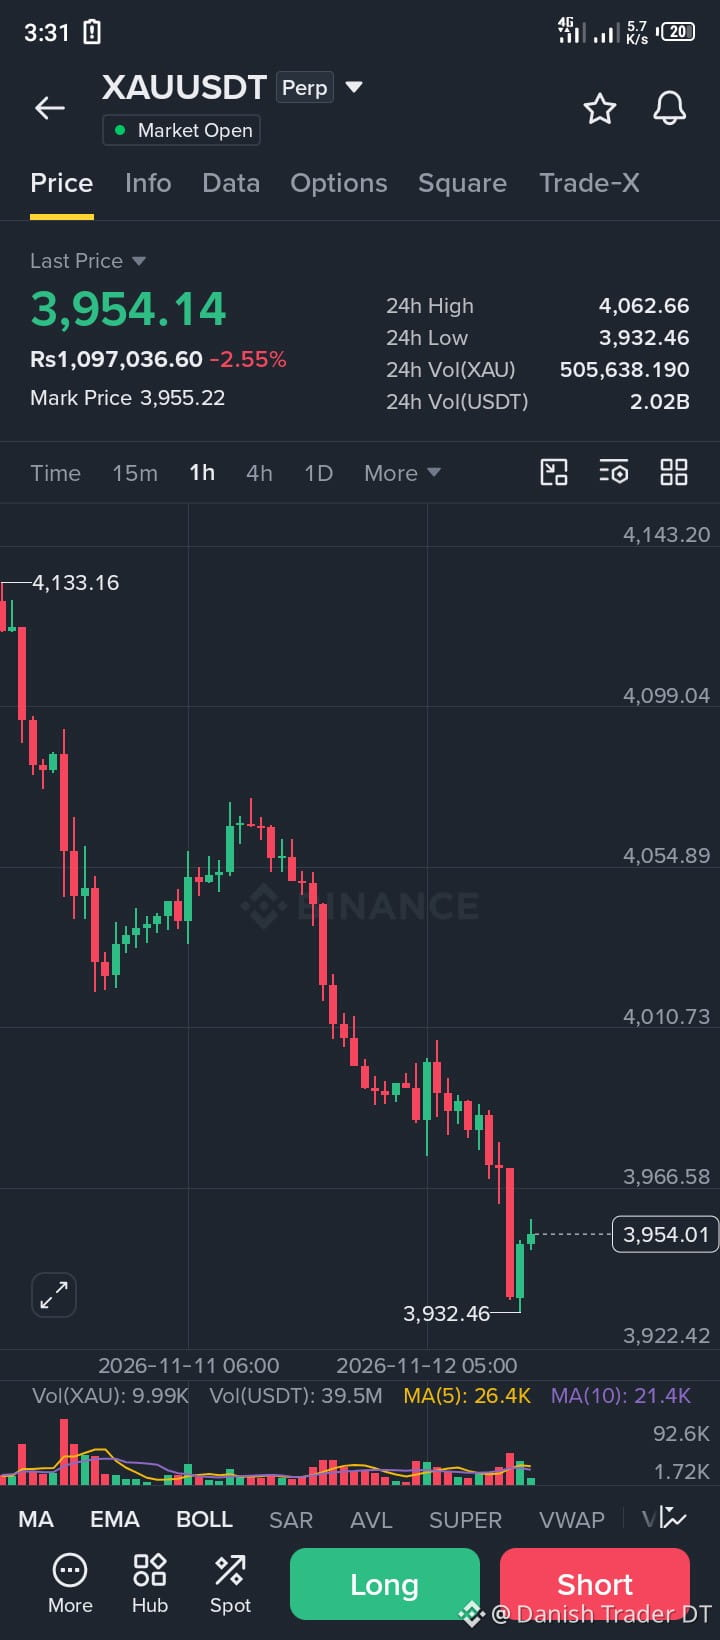
$XAU – SHORT
Entry: 3,956.13 – 3,975.91
TP1: 3,773.14
TP2: 3,618.84
SL: 4,095.19
Gold's recent bounce looks weak, and sellers may be preparing for another move down. The bearish outlook remains in focus as long as price stays below the resistance zone.
Be careful: Strong short-covering could push price above 3,970 and weaken the immediate bearish setup. Wait for confirmation before entering.
Never go all-in. Use a position size that fits your own account.
Trade $XAU Here
{future}(XAUUSDT)
$XAU – SHORT
Entry: 3,956.13 – 3,975.91
TP1: 3,773.14
TP2: 3,618.84
SL: 4,095.19
Gold's recent bounce looks weak, and sellers may be preparing for another move down. The bearish outlook remains in focus as long as price stays below the resistance zone.
Be careful: Strong short-covering could push price above 3,970 and weaken the immediate bearish setup. Wait for confirmation before entering.
Never go all-in. Use a position size that fits your own account.
Trade $XAU Here
Entry: 3,956.13 – 3,975.91
TP1: 3,773.14
TP2: 3,618.84
SL: 4,095.19
Gold's recent bounce looks weak, and sellers may be preparing for another move down. The bearish outlook remains in focus as long as price stays below the resistance zone.
Be careful: Strong short-covering could push price above 3,970 and weaken the immediate bearish setup. Wait for confirmation before entering.
Never go all-in. Use a position size that fits your own account.
Trade $XAU Here
1
1
60
·
--
Bullish
See translation
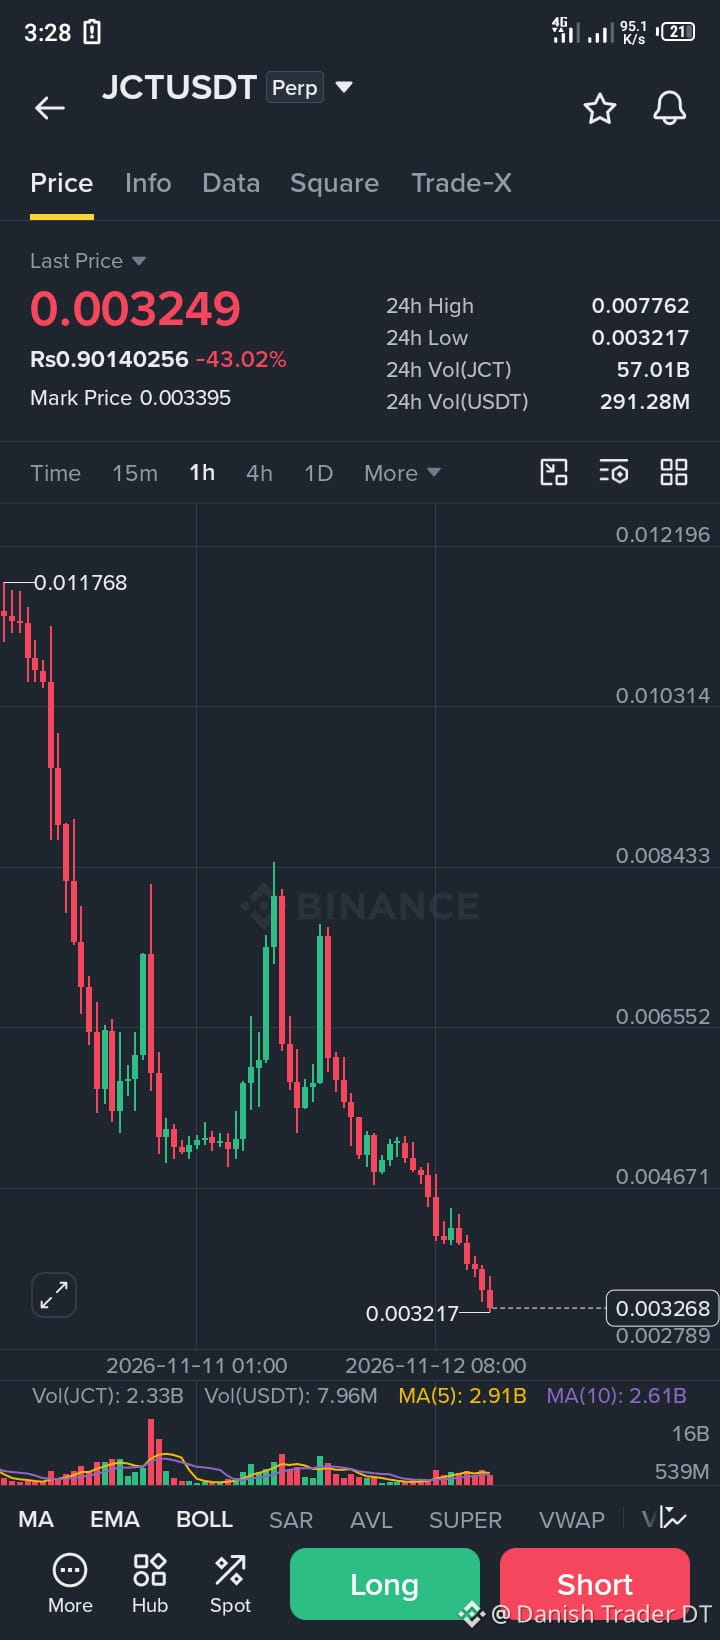
$JCT – LONG
TP1: 0.003850
SL: 0.00331
JCT is finally showing some upside movement after continued weakness. Buyers are starting to step in, but it's still too early to call a full trend reversal.
A move toward 0.003850 could bring some recovery. Keep an eye on momentum, as losing support near 0.00331 would weaken the bullish outlook.
Never go all-in. Use a position size that fits your own account.
Trade JCT Here
{future}(JCTUSDT)
Around the market:
$BTC : Current Price 73,387.4 - 24h Change: -0.43%
{future}(BTCUSDT)
$AGT : Current Price 0.07024 - 24h Change: +21.90%
{future}(AGTUSDT)
$JCT – LONG
TP1: 0.003850
SL: 0.00331
JCT is finally showing some upside movement after continued weakness. Buyers are starting to step in, but it's still too early to call a full trend reversal.
A move toward 0.003850 could bring some recovery. Keep an eye on momentum, as losing support near 0.00331 would weaken the bullish outlook.
Never go all-in. Use a position size that fits your own account.
Trade JCT Here
Around the market:
$BTC : Current Price 73,387.4 - 24h Change: -0.43%
$AGT : Current Price 0.07024 - 24h Change: +21.90%
TP1: 0.003850
SL: 0.00331
JCT is finally showing some upside movement after continued weakness. Buyers are starting to step in, but it's still too early to call a full trend reversal.
A move toward 0.003850 could bring some recovery. Keep an eye on momentum, as losing support near 0.00331 would weaken the bullish outlook.
Never go all-in. Use a position size that fits your own account.
Trade JCT Here
Around the market:
$BTC : Current Price 73,387.4 - 24h Change: -0.43%
$AGT : Current Price 0.07024 - 24h Change: +21.90%
1
42
Log in to explore more content
Join global crypto users on Binance Square
⚡️ Get latest and useful information about crypto.
💬 Trusted by the world’s largest crypto exchange.
👍 Discover real insights from verified creators.
Email / Phone number
Trending Topics
HuangExitNvidiaStrategyInFocus
59,770 views
784 Discussing
STOCKS | Nvidia’s Jensen Huang Resigns, Colette Kress Named as Interim CEO
Binance News
·20 Likes
·29.4k views
AnthropicRejectsIPODelayValuationinQuestion
647,920 views
5,070 Discussing
BitMineReports$6.3BNetLossForFiscal2026
7,143 views
96 Discussing