

AllInWeb3
930 Posts

AllInWeb3
Report
Block User
Open Trade

BNB Holder
High-Frequency Trader
5.5 Years
61 Following
125 Followers
392 Liked
Posts
Portfolio
All
Quotes
·
--
【$AIN spikes up then sharply drops: the retracement hasn’t been reclaimed; still observing and not chasing longs】
As of 2026-10-04 06:24 (Beijing time), a full scan covering 526/526 is complete. On AINUSDT, the 24-hour gain ranks #1: +74.863%. Scan price: 0.04160. The USDT-quoted成交額 is approximately $300.6 million. Compared with the scan price of 0.05028 used in my analysis posted at 04:12, the current price is about 17.3% lower. The rolling 24-hour gain is not the return achieved over just these two hours.
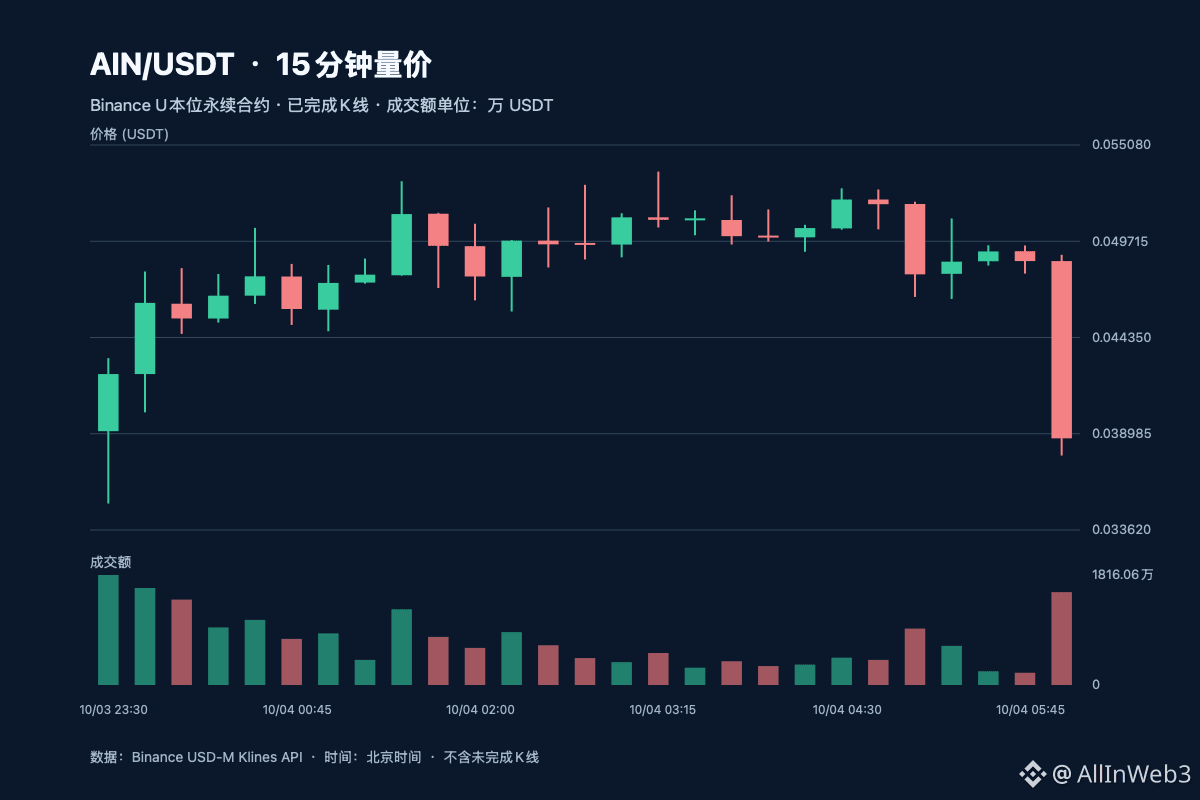
The incremental move is within a short-cycle structure: 04:00—05:00 closed at 0.05178, and 05:00—06:00 closed at 0.04861, a pullback of about 6.1%. The 06:00—07:00 hour is not finished yet. The Binance 15-minute chart shows that 06:00—06:15 closed at 0.03873; afterward, this incomplete 15-minute candle reached as high as 0.03560 at 06:19, then bounced back to 0.04158. At 06:24, the market-wide scan price is 0.04160. This retracement is large, but it cannot replace confirmation from a full-hour close. The chart only draws completed 15-minute candles.
Derivatives also need to be checked by time: OI historical samples show about 396.3 million AIN at 01:00 and about 403.8 million at 06:00; during that interval, it increased first. At 06:19, the real-time OI is about 384.2 million; after the sharp drop, it is again below that sample. OI does not distinguish long vs. short, and the sampling timestamps differ between interfaces—so it cannot be interpreted as net long positions. The already-settled funding rate at 04:00 is +0.330888% per 4 hours; the next-period estimate provided by the interface at 06:19 is +0.306030%. It’s expected that before the 08:00 settlement, it will still be around there. The last completed 4-hour成交额 is about $116.8 million, roughly equal to the prior block; the 04:00—08:00 block hasn’t finished yet.
In this round, I haven’t found any newly released official AIN announcement that could explain the spike up or the sudden drop. My view remains high-volatility observation: whether the subsequent full hour can reclaim 0.04861 has more informational value than the retracement of an unfinished hour. If price moves again near 0.03560, first check whether complete candles and OI/funding rates change in sync. These are conditions for verification—not an entry price, target price, or stop-loss instruction.
【$AIN spikes up then sharply drops: the retracement hasn’t been reclaimed; still observing and not chasing longs】
As of 2026-10-04 06:24 (Beijing time), a full scan covering 526/526 is complete. On AINUSDT, the 24-hour gain ranks #1: +74.863%. Scan price: 0.04160. The USDT-quoted成交額 is approximately $300.6 million. Compared with the scan price of 0.05028 used in my analysis posted at 04:12, the current price is about 17.3% lower. The rolling 24-hour gain is not the return achieved over just these two hours.
The incremental move is within a short-cycle structure: 04:00—05:00 closed at 0.05178, and 05:00—06:00 closed at 0.04861, a pullback of about 6.1%. The 06:00—07:00 hour is not finished yet. The Binance 15-minute chart shows that 06:00—06:15 closed at 0.03873; afterward, this incomplete 15-minute candle reached as high as 0.03560 at 06:19, then bounced back to 0.04158. At 06:24, the market-wide scan price is 0.04160. This retracement is large, but it cannot replace confirmation from a full-hour close. The chart only draws completed 15-minute candles.
Derivatives also need to be checked by time: OI historical samples show about 396.3 million AIN at 01:00 and about 403.8 million at 06:00; during that interval, it increased first. At 06:19, the real-time OI is about 384.2 million; after the sharp drop, it is again below that sample. OI does not distinguish long vs. short, and the sampling timestamps differ between interfaces—so it cannot be interpreted as net long positions. The already-settled funding rate at 04:00 is +0.330888% per 4 hours; the next-period estimate provided by the interface at 06:19 is +0.306030%. It’s expected that before the 08:00 settlement, it will still be around there. The last completed 4-hour成交额 is about $116.8 million, roughly equal to the prior block; the 04:00—08:00 block hasn’t finished yet.
In this round, I haven’t found any newly released official AIN announcement that could explain the spike up or the sudden drop. My view remains high-volatility observation: whether the subsequent full hour can reclaim 0.04861 has more informational value than the retracement of an unfinished hour. If price moves again near 0.03560, first check whether complete candles and OI/funding rates change in sync. These are conditions for verification—not an entry price, target price, or stop-loss instruction.
As of 2026-10-04 06:24 (Beijing time), a full scan covering 526/526 is complete. On AINUSDT, the 24-hour gain ranks #1: +74.863%. Scan price: 0.04160. The USDT-quoted成交額 is approximately $300.6 million. Compared with the scan price of 0.05028 used in my analysis posted at 04:12, the current price is about 17.3% lower. The rolling 24-hour gain is not the return achieved over just these two hours.
The incremental move is within a short-cycle structure: 04:00—05:00 closed at 0.05178, and 05:00—06:00 closed at 0.04861, a pullback of about 6.1%. The 06:00—07:00 hour is not finished yet. The Binance 15-minute chart shows that 06:00—06:15 closed at 0.03873; afterward, this incomplete 15-minute candle reached as high as 0.03560 at 06:19, then bounced back to 0.04158. At 06:24, the market-wide scan price is 0.04160. This retracement is large, but it cannot replace confirmation from a full-hour close. The chart only draws completed 15-minute candles.
Derivatives also need to be checked by time: OI historical samples show about 396.3 million AIN at 01:00 and about 403.8 million at 06:00; during that interval, it increased first. At 06:19, the real-time OI is about 384.2 million; after the sharp drop, it is again below that sample. OI does not distinguish long vs. short, and the sampling timestamps differ between interfaces—so it cannot be interpreted as net long positions. The already-settled funding rate at 04:00 is +0.330888% per 4 hours; the next-period estimate provided by the interface at 06:19 is +0.306030%. It’s expected that before the 08:00 settlement, it will still be around there. The last completed 4-hour成交额 is about $116.8 million, roughly equal to the prior block; the 04:00—08:00 block hasn’t finished yet.
In this round, I haven’t found any newly released official AIN announcement that could explain the spike up or the sudden drop. My view remains high-volatility observation: whether the subsequent full hour can reclaim 0.04861 has more informational value than the retracement of an unfinished hour. If price moves again near 0.03560, first check whether complete candles and OI/funding rates change in sync. These are conditions for verification—not an entry price, target price, or stop-loss instruction.
32
·
--
【ZEC ETF week outflow report and public trading-day table discrepancy: $15.96 million; statistical methodology pending verification】
Binance Square’s current hot list ranks “Zcash spot ETF’s first weekly net outflow of $93.60 million” at #1, but when you cross-check the public trading-day flow table, there is a gap that can’t be ignored.
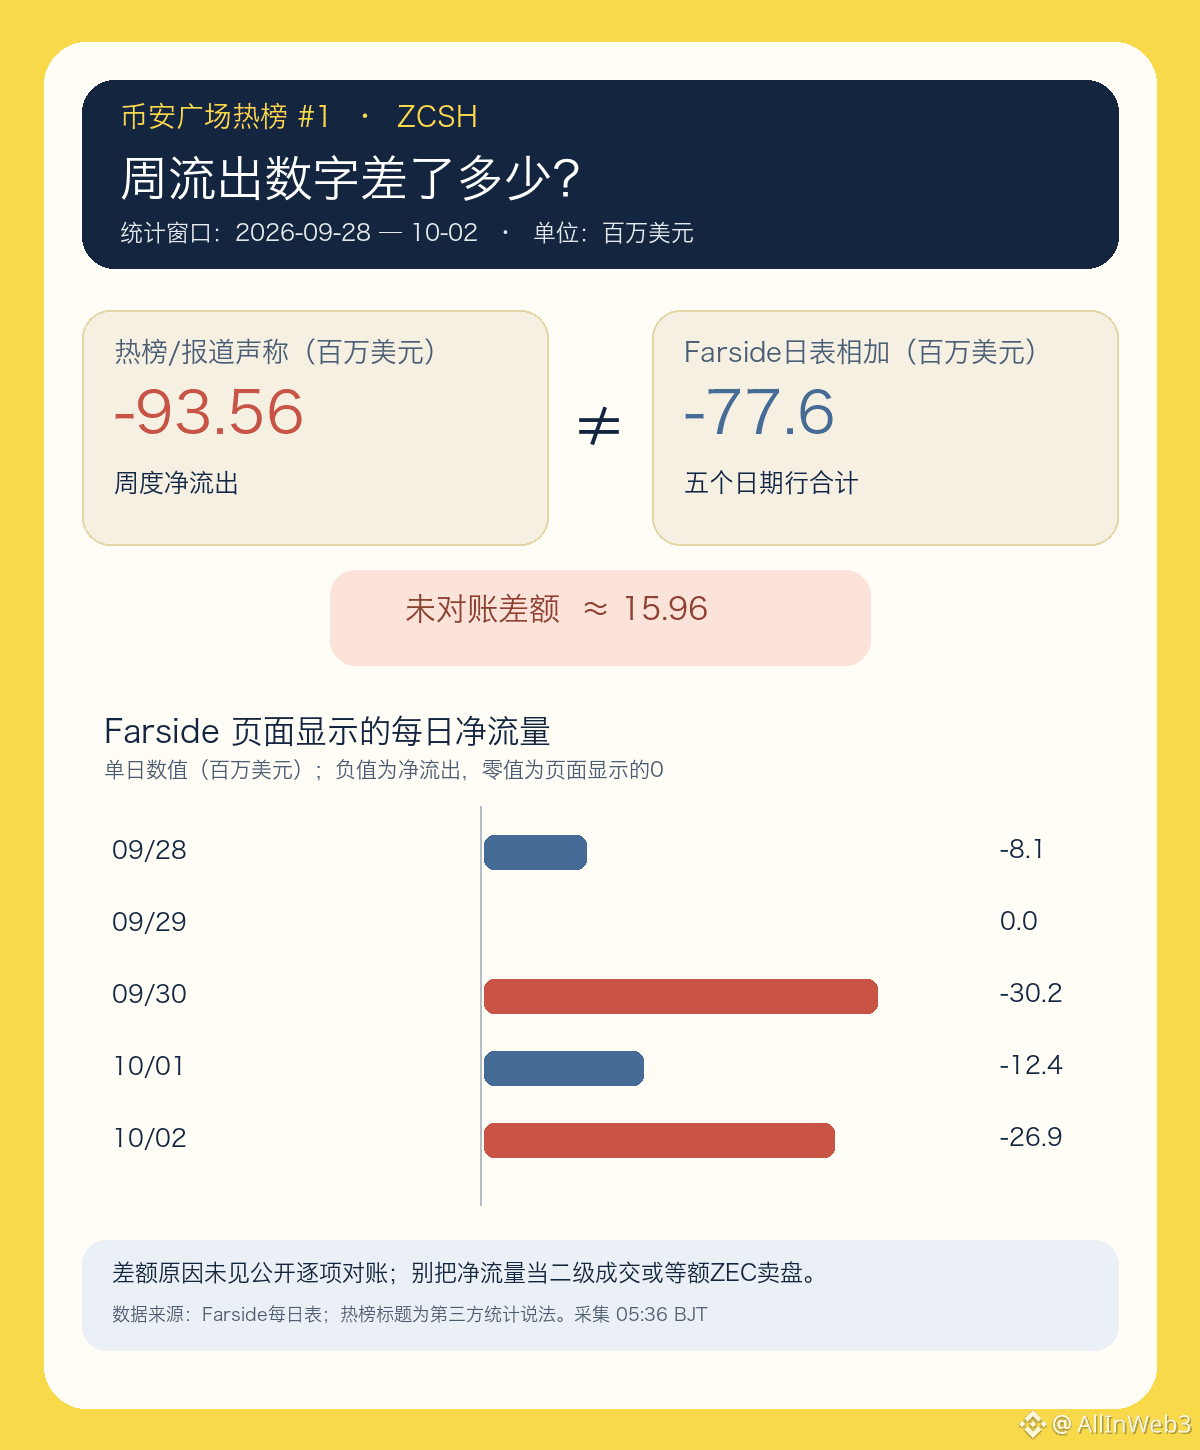
Farside’s ZEC ETF table shows: net outflow of $8.10 million on September 28; $0 on September 29; outflow of $30.20 million on September 30; outflow of $12.40 million on October 1; and outflow of $26.90 million on October 2. Summing the one-decimal-place figures already rounded in the table gives approximately $77.60 million; this differs from the $93.56 million claimed in the hot-list headline by about $15.96 million. The table notes that the data are automatically generated and cautions that errors may exist.
This still isn’t enough to prove that either set of numbers is wrong. The two sides may use different reporting weeks, estimation methods, or later revisions, but the currently visible material does not provide a line-by-line reconciliation. The more rigorous phrasing is: it has been reported that the weekly net outflow was $93.56 million, while the five rows in the public trading-day table total approximately $77.60 million; the difference remains to be explained. The $93.6 million figure should not be written as a verified official constant.
Breaking the daily table down, the two days of September 30 and October 2 combined for roughly $57.10 million in outflows (based on the displayed values), accounting for about 74% of the net outflow across those five rows. The concentration of flow on two dates is structural information worth tracking; however, it still cannot prove that those two days involved equal spot selling, nor can it independently explain changes in the ZEC price. The Farside page indicates the data are automatically generated and the displayed figures have been rounded, so the aggregation here is only used to highlight the discrepancy between the visible data.
Another important boundary condition: ETF net flow statistics are not the same metric as secondary-market trading value, so you cannot directly infer that an equivalent amount of ZEC has been sold onto exchanges, and you also cannot conclude—based solely on a week of outflows—that the coin price fell as a result. The public Grayscale product page can be used to verify shares, holdings, and NAV, but the current page does not provide a line-by-line explanation for that week’s flow figures; even the SEC search did not find any document containing the weekly number. The next step requires the data provider to explain the reporting period and methodology, and then cross-check with changes in fund shares, ZEC holdings, and NAV. Until then, this trending item is more suitable as a methodology/metric audit than as a basis for directional judgment on ZEC. #ZEC
【ZEC ETF week outflow report and public trading-day table discrepancy: $15.96 million; statistical methodology pending verification】
Binance Square’s current hot list ranks “Zcash spot ETF’s first weekly net outflow of $93.60 million” at #1, but when you cross-check the public trading-day flow table, there is a gap that can’t be ignored.
Farside’s ZEC ETF table shows: net outflow of $8.10 million on September 28; $0 on September 29; outflow of $30.20 million on September 30; outflow of $12.40 million on October 1; and outflow of $26.90 million on October 2. Summing the one-decimal-place figures already rounded in the table gives approximately $77.60 million; this differs from the $93.56 million claimed in the hot-list headline by about $15.96 million. The table notes that the data are automatically generated and cautions that errors may exist.
This still isn’t enough to prove that either set of numbers is wrong. The two sides may use different reporting weeks, estimation methods, or later revisions, but the currently visible material does not provide a line-by-line reconciliation. The more rigorous phrasing is: it has been reported that the weekly net outflow was $93.56 million, while the five rows in the public trading-day table total approximately $77.60 million; the difference remains to be explained. The $93.6 million figure should not be written as a verified official constant.
Breaking the daily table down, the two days of September 30 and October 2 combined for roughly $57.10 million in outflows (based on the displayed values), accounting for about 74% of the net outflow across those five rows. The concentration of flow on two dates is structural information worth tracking; however, it still cannot prove that those two days involved equal spot selling, nor can it independently explain changes in the ZEC price. The Farside page indicates the data are automatically generated and the displayed figures have been rounded, so the aggregation here is only used to highlight the discrepancy between the visible data.
Another important boundary condition: ETF net flow statistics are not the same metric as secondary-market trading value, so you cannot directly infer that an equivalent amount of ZEC has been sold onto exchanges, and you also cannot conclude—based solely on a week of outflows—that the coin price fell as a result. The public Grayscale product page can be used to verify shares, holdings, and NAV, but the current page does not provide a line-by-line explanation for that week’s flow figures; even the SEC search did not find any document containing the weekly number. The next step requires the data provider to explain the reporting period and methodology, and then cross-check with changes in fund shares, ZEC holdings, and NAV. Until then, this trending item is more suitable as a methodology/metric audit than as a basis for directional judgment on ZEC. #ZEC
Binance Square’s current hot list ranks “Zcash spot ETF’s first weekly net outflow of $93.60 million” at #1, but when you cross-check the public trading-day flow table, there is a gap that can’t be ignored.
Farside’s ZEC ETF table shows: net outflow of $8.10 million on September 28; $0 on September 29; outflow of $30.20 million on September 30; outflow of $12.40 million on October 1; and outflow of $26.90 million on October 2. Summing the one-decimal-place figures already rounded in the table gives approximately $77.60 million; this differs from the $93.56 million claimed in the hot-list headline by about $15.96 million. The table notes that the data are automatically generated and cautions that errors may exist.
This still isn’t enough to prove that either set of numbers is wrong. The two sides may use different reporting weeks, estimation methods, or later revisions, but the currently visible material does not provide a line-by-line reconciliation. The more rigorous phrasing is: it has been reported that the weekly net outflow was $93.56 million, while the five rows in the public trading-day table total approximately $77.60 million; the difference remains to be explained. The $93.6 million figure should not be written as a verified official constant.
Breaking the daily table down, the two days of September 30 and October 2 combined for roughly $57.10 million in outflows (based on the displayed values), accounting for about 74% of the net outflow across those five rows. The concentration of flow on two dates is structural information worth tracking; however, it still cannot prove that those two days involved equal spot selling, nor can it independently explain changes in the ZEC price. The Farside page indicates the data are automatically generated and the displayed figures have been rounded, so the aggregation here is only used to highlight the discrepancy between the visible data.
Another important boundary condition: ETF net flow statistics are not the same metric as secondary-market trading value, so you cannot directly infer that an equivalent amount of ZEC has been sold onto exchanges, and you also cannot conclude—based solely on a week of outflows—that the coin price fell as a result. The public Grayscale product page can be used to verify shares, holdings, and NAV, but the current page does not provide a line-by-line explanation for that week’s flow figures; even the SEC search did not find any document containing the weekly number. The next step requires the data provider to explain the reporting period and methodology, and then cross-check with changes in fund shares, ZEC holdings, and NAV. Until then, this trending item is more suitable as a methodology/metric audit than as a basis for directional judgment on ZEC. #ZEC
205
·
--
【$AINUSDT surged to a new high but then pulled back; the funding settlement rate rose to +0.330888%: I still won’t chase the long】
The complete order book rescan at 04:12:01 (Beijing time) covered 526/526 normal USDT-margined perpetual contracts. AINUSDT still ranks #1 in the last 24-hour gain: +112.511%, scan price 0.05028, with about $236.9M in quoted成交 value. Compared with the initial scan at 04:02 ( +113.899% ), it has already eased back; these two rolling 24-hour snapshots are at different tally timestamps and should not be written as a ten-minute drop.
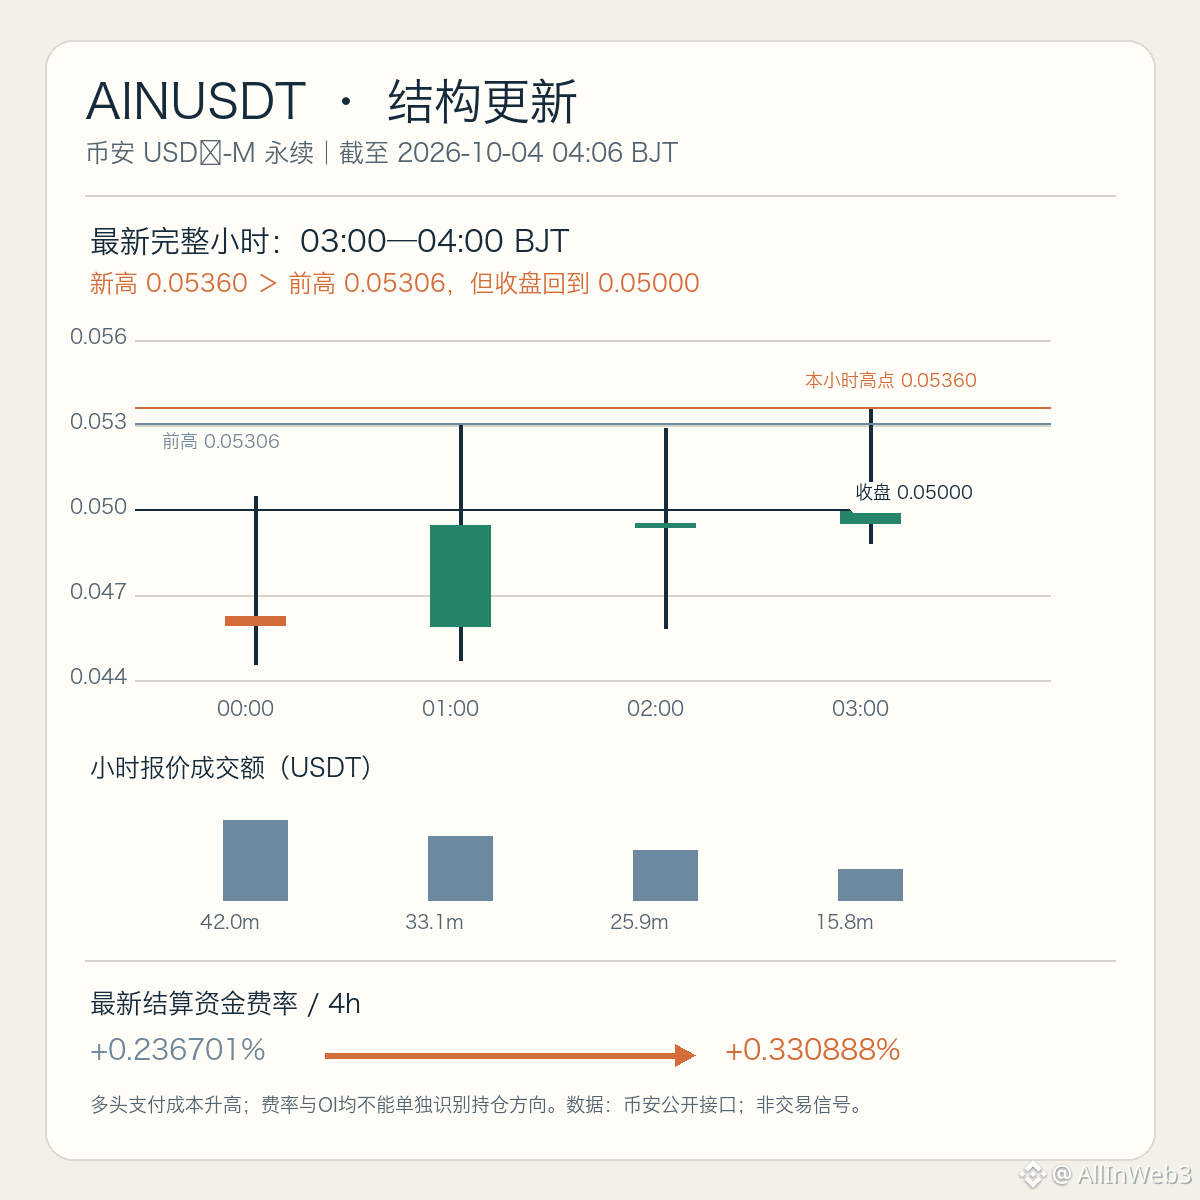
Compared with the previous post published at 03:16 on this account (post ID 373406829338395), the newly added full hour from 03:00 to 04:00 provides the more critical structure: price briefly reached 0.05360, exceeding the prior hour high of 0.05306, but it closed back at 0.05000—about 6.7% below the new high, and it also didn’t hold the old high. This “intra-day breakout, hourly pullback” is evidence of heavier sell pressure overhead, but it’s still not enough to confirm a reversal; a single upper wick also can’t tell us who is selling.
The trade confirmation is relatively weak: the USDT quoted成交 value of this hourly candle is about $15.83M, down 38.8% from the $25.88M during 02:00—03:00. In the same OI (open interest) interface sample, it rose only slightly from about 399.6M AIN at 03:00 to about 400.6M at 04:00 (+0.25%). OI is open interest size and doesn’t separate longs vs. shorts, so a small increase can’t be interpreted as net longs continuing to add.
Another newly observed change is the funding settlement rate: at 00:00 it was +0.236701% per 4 hours, and at 04:00 it increased to +0.330888%. A positive funding rate means longs pay shorts, so the cost of holding longs is higher. It’s not a reversal timer and can’t, by itself, prove that longs are crowded. Although the rolling 24-hour gain is very large, this round of verification didn’t find any same-day announcement that could explain this surge; old listings/brand information shouldn’t be used as a “new catalyst.”
My view is high-volatility watch; I won’t treat the #1 ranking as a buy signal. Only if the next full hour closes above 0.05360 and the成交 value picks up again would the breakout be confirmed. If it first breaks below the recent full-hour low of 0.04882, the short-term structure would be weaker. Either way, these are only verification conditions—not an entry price, target price, or guarantee. If the funding rate stays high, chasing longs still needs to factor in your holding cost.
【$AINUSDT surged to a new high but then pulled back; the funding settlement rate rose to +0.330888%: I still won’t chase the long】
The complete order book rescan at 04:12:01 (Beijing time) covered 526/526 normal USDT-margined perpetual contracts. AINUSDT still ranks #1 in the last 24-hour gain: +112.511%, scan price 0.05028, with about $236.9M in quoted成交 value. Compared with the initial scan at 04:02 ( +113.899% ), it has already eased back; these two rolling 24-hour snapshots are at different tally timestamps and should not be written as a ten-minute drop.
Compared with the previous post published at 03:16 on this account (post ID 373406829338395), the newly added full hour from 03:00 to 04:00 provides the more critical structure: price briefly reached 0.05360, exceeding the prior hour high of 0.05306, but it closed back at 0.05000—about 6.7% below the new high, and it also didn’t hold the old high. This “intra-day breakout, hourly pullback” is evidence of heavier sell pressure overhead, but it’s still not enough to confirm a reversal; a single upper wick also can’t tell us who is selling.
The trade confirmation is relatively weak: the USDT quoted成交 value of this hourly candle is about $15.83M, down 38.8% from the $25.88M during 02:00—03:00. In the same OI (open interest) interface sample, it rose only slightly from about 399.6M AIN at 03:00 to about 400.6M at 04:00 (+0.25%). OI is open interest size and doesn’t separate longs vs. shorts, so a small increase can’t be interpreted as net longs continuing to add.
Another newly observed change is the funding settlement rate: at 00:00 it was +0.236701% per 4 hours, and at 04:00 it increased to +0.330888%. A positive funding rate means longs pay shorts, so the cost of holding longs is higher. It’s not a reversal timer and can’t, by itself, prove that longs are crowded. Although the rolling 24-hour gain is very large, this round of verification didn’t find any same-day announcement that could explain this surge; old listings/brand information shouldn’t be used as a “new catalyst.”
My view is high-volatility watch; I won’t treat the #1 ranking as a buy signal. Only if the next full hour closes above 0.05360 and the成交 value picks up again would the breakout be confirmed. If it first breaks below the recent full-hour low of 0.04882, the short-term structure would be weaker. Either way, these are only verification conditions—not an entry price, target price, or guarantee. If the funding rate stays high, chasing longs still needs to factor in your holding cost.
The complete order book rescan at 04:12:01 (Beijing time) covered 526/526 normal USDT-margined perpetual contracts. AINUSDT still ranks #1 in the last 24-hour gain: +112.511%, scan price 0.05028, with about $236.9M in quoted成交 value. Compared with the initial scan at 04:02 ( +113.899% ), it has already eased back; these two rolling 24-hour snapshots are at different tally timestamps and should not be written as a ten-minute drop.
Compared with the previous post published at 03:16 on this account (post ID 373406829338395), the newly added full hour from 03:00 to 04:00 provides the more critical structure: price briefly reached 0.05360, exceeding the prior hour high of 0.05306, but it closed back at 0.05000—about 6.7% below the new high, and it also didn’t hold the old high. This “intra-day breakout, hourly pullback” is evidence of heavier sell pressure overhead, but it’s still not enough to confirm a reversal; a single upper wick also can’t tell us who is selling.
The trade confirmation is relatively weak: the USDT quoted成交 value of this hourly candle is about $15.83M, down 38.8% from the $25.88M during 02:00—03:00. In the same OI (open interest) interface sample, it rose only slightly from about 399.6M AIN at 03:00 to about 400.6M at 04:00 (+0.25%). OI is open interest size and doesn’t separate longs vs. shorts, so a small increase can’t be interpreted as net longs continuing to add.
Another newly observed change is the funding settlement rate: at 00:00 it was +0.236701% per 4 hours, and at 04:00 it increased to +0.330888%. A positive funding rate means longs pay shorts, so the cost of holding longs is higher. It’s not a reversal timer and can’t, by itself, prove that longs are crowded. Although the rolling 24-hour gain is very large, this round of verification didn’t find any same-day announcement that could explain this surge; old listings/brand information shouldn’t be used as a “new catalyst.”
My view is high-volatility watch; I won’t treat the #1 ranking as a buy signal. Only if the next full hour closes above 0.05360 and the成交 value picks up again would the breakout be confirmed. If it first breaks below the recent full-hour low of 0.04882, the short-term structure would be weaker. Either way, these are only verification conditions—not an entry price, target price, or guarantee. If the funding rate stays high, chasing longs still needs to factor in your holding cost.
13
·
--
【$AINUSDT surged sharply but failed to make new highs: the latest 1-hour range has narrowed, I won't chase the long】
03:13 BJT Binance USD-M complete scan covered 526/526 qualifying USDT-margined perpetuals. AINUSDT still ranks #1 by percentage gain, +116.109% over 24 hours, scan price 0.05098, with quoted成交 amount of about $222.2 million. Compared with the 02:15 scan used in the most recent post (+103.882%, 0.04832, $199.7 million), the gain is up by 12.227 percentage points and the price is about 5.51% higher, with成交 amount higher by about 11.3%. The 03:06 single-coin ticker returned +109.679%, and the rolling-window readings fluctuated; you can't treat a top spot on the gainers list as a continuation guarantee.
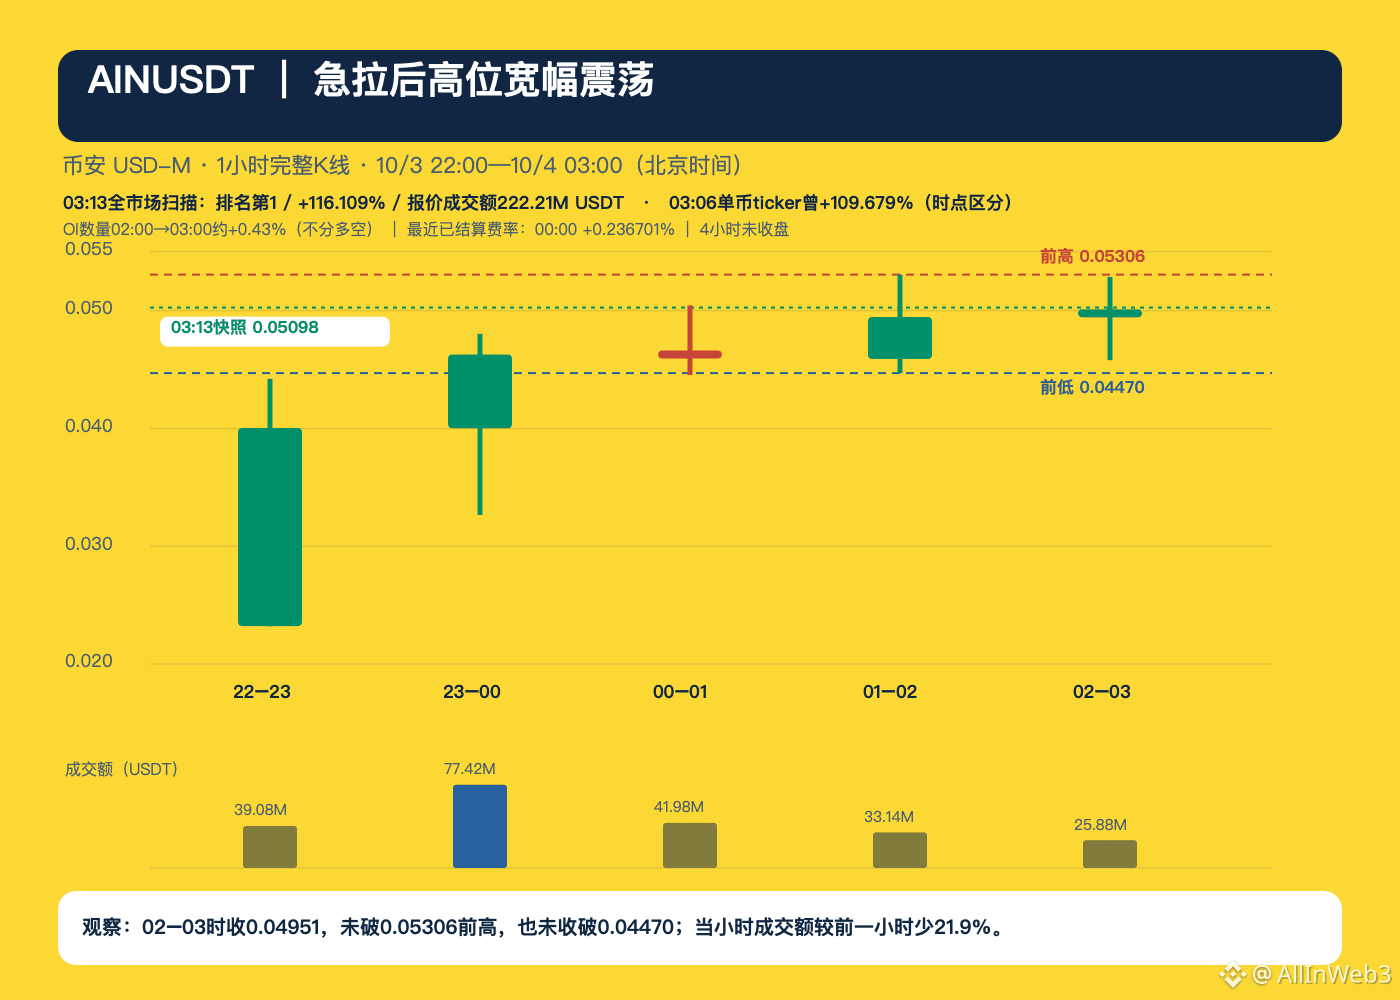
The key new node is the fully closed 02:00–03:00 hourly candle after the previous post: open 0.04944, high 0.05286, low 0.04580, close 0.04951, quoted成交 amount $25.88 million, down about 21.9% versus the prior hour's $33.14 million. The close is nearly flat—it neither broke above the earlier high of 0.05306 nor closed below 0.04470. This shows that the high area is still a wide-range pull-and-tug, not a confirmed new breakout. The rolling成交 amount on the leaderboard is the total matched buy-and-sell amount and does not represent net inflow. The latest fully closed 4-hour candle is still earlier than this hourly candle, so the short-term direction hasn't yet been confirmed on the 4H.
The number of positions from 02:00 to 03:00 increased by only about 0.43%—limited in magnitude—and OI doesn't distinguish long vs. short. The most recent settled funding rate is still +0.236701% from 00:00, meaning longs paid shorts at that settlement time; that doesn't necessarily mean the next settlement will be the same. The current 4-hour K-line hasn't finished yet, so you can't use intraday movement to replace a close-based judgment.
The old-brand upgrade/code-change arrangements I found in this round are not used to explain this sudden pump. I couldn't find any same-day project announcement sufficient to attribute it. My view remains: high-volatility observation, not chasing the spike. Next, we should watch whether the full hourly candle closes with volume above 0.05286–0.05306, or whether price falls and closes below 0.04580–0.04470. Until one of these confirmations appears, being #1 on the gainers list is not an entry signal.
【$AINUSDT surged sharply but failed to make new highs: the latest 1-hour range has narrowed, I won't chase the long】
03:13 BJT Binance USD-M complete scan covered 526/526 qualifying USDT-margined perpetuals. AINUSDT still ranks #1 by percentage gain, +116.109% over 24 hours, scan price 0.05098, with quoted成交 amount of about $222.2 million. Compared with the 02:15 scan used in the most recent post (+103.882%, 0.04832, $199.7 million), the gain is up by 12.227 percentage points and the price is about 5.51% higher, with成交 amount higher by about 11.3%. The 03:06 single-coin ticker returned +109.679%, and the rolling-window readings fluctuated; you can't treat a top spot on the gainers list as a continuation guarantee.
The key new node is the fully closed 02:00–03:00 hourly candle after the previous post: open 0.04944, high 0.05286, low 0.04580, close 0.04951, quoted成交 amount $25.88 million, down about 21.9% versus the prior hour's $33.14 million. The close is nearly flat—it neither broke above the earlier high of 0.05306 nor closed below 0.04470. This shows that the high area is still a wide-range pull-and-tug, not a confirmed new breakout. The rolling成交 amount on the leaderboard is the total matched buy-and-sell amount and does not represent net inflow. The latest fully closed 4-hour candle is still earlier than this hourly candle, so the short-term direction hasn't yet been confirmed on the 4H.
The number of positions from 02:00 to 03:00 increased by only about 0.43%—limited in magnitude—and OI doesn't distinguish long vs. short. The most recent settled funding rate is still +0.236701% from 00:00, meaning longs paid shorts at that settlement time; that doesn't necessarily mean the next settlement will be the same. The current 4-hour K-line hasn't finished yet, so you can't use intraday movement to replace a close-based judgment.
The old-brand upgrade/code-change arrangements I found in this round are not used to explain this sudden pump. I couldn't find any same-day project announcement sufficient to attribute it. My view remains: high-volatility observation, not chasing the spike. Next, we should watch whether the full hourly candle closes with volume above 0.05286–0.05306, or whether price falls and closes below 0.04580–0.04470. Until one of these confirmations appears, being #1 on the gainers list is not an entry signal.
03:13 BJT Binance USD-M complete scan covered 526/526 qualifying USDT-margined perpetuals. AINUSDT still ranks #1 by percentage gain, +116.109% over 24 hours, scan price 0.05098, with quoted成交 amount of about $222.2 million. Compared with the 02:15 scan used in the most recent post (+103.882%, 0.04832, $199.7 million), the gain is up by 12.227 percentage points and the price is about 5.51% higher, with成交 amount higher by about 11.3%. The 03:06 single-coin ticker returned +109.679%, and the rolling-window readings fluctuated; you can't treat a top spot on the gainers list as a continuation guarantee.
The key new node is the fully closed 02:00–03:00 hourly candle after the previous post: open 0.04944, high 0.05286, low 0.04580, close 0.04951, quoted成交 amount $25.88 million, down about 21.9% versus the prior hour's $33.14 million. The close is nearly flat—it neither broke above the earlier high of 0.05306 nor closed below 0.04470. This shows that the high area is still a wide-range pull-and-tug, not a confirmed new breakout. The rolling成交 amount on the leaderboard is the total matched buy-and-sell amount and does not represent net inflow. The latest fully closed 4-hour candle is still earlier than this hourly candle, so the short-term direction hasn't yet been confirmed on the 4H.
The number of positions from 02:00 to 03:00 increased by only about 0.43%—limited in magnitude—and OI doesn't distinguish long vs. short. The most recent settled funding rate is still +0.236701% from 00:00, meaning longs paid shorts at that settlement time; that doesn't necessarily mean the next settlement will be the same. The current 4-hour K-line hasn't finished yet, so you can't use intraday movement to replace a close-based judgment.
The old-brand upgrade/code-change arrangements I found in this round are not used to explain this sudden pump. I couldn't find any same-day project announcement sufficient to attribute it. My view remains: high-volatility observation, not chasing the spike. Next, we should watch whether the full hourly candle closes with volume above 0.05286–0.05306, or whether price falls and closes below 0.04580–0.04470. Until one of these confirmations appears, being #1 on the gainers list is not an entry signal.
18
·
--
【$AINUSDT复扫仍居涨幅第1,但盘中回吐提醒我不追急拉】
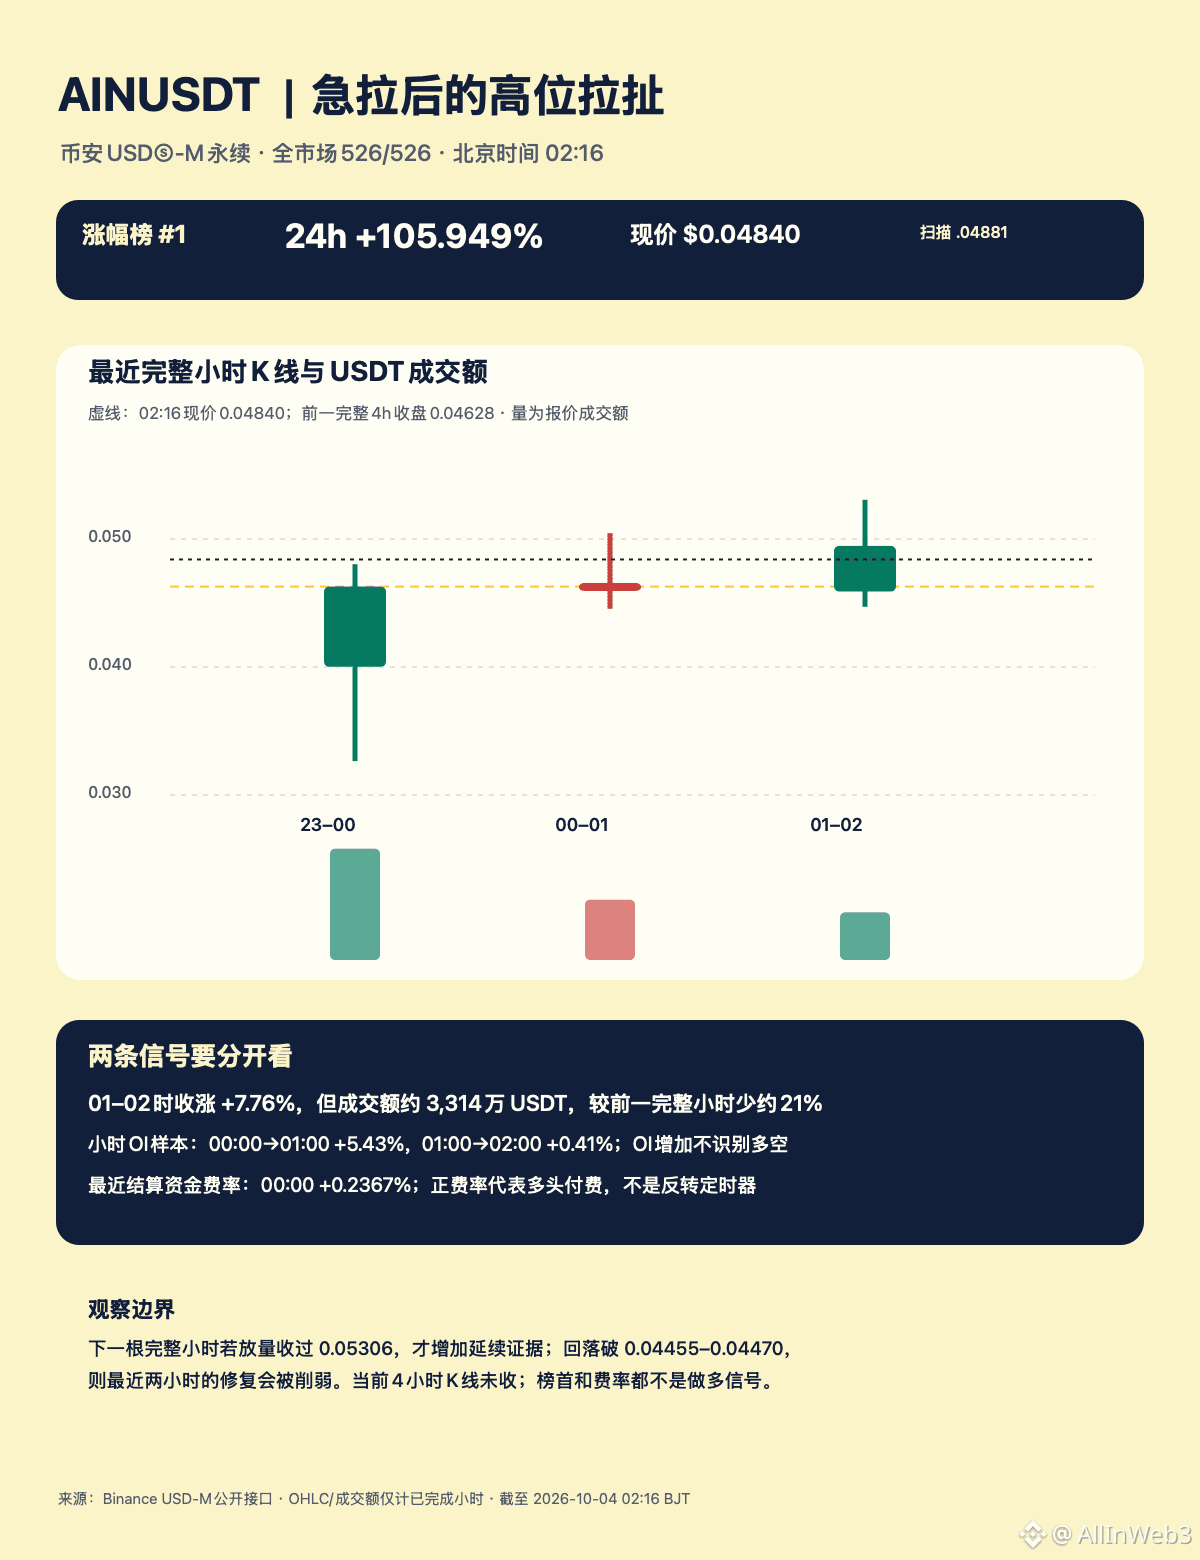
02:15 BJT re-scan fully covers 526 qualifying USDT-margined perpetual contracts, with AIN/USDT still ranked #1: 24-hour price increase +103.882%, scan price 0.04832, and quoted trade volume of about $199.7 million; at 02:16 the single-coin ticker is 0.04840, with 24-hour increase +104.392%. Compared with the previous post on this feed at 00:09 ( +92.983%, 0.04593, trade volume about $128.8 million), the current scan gain is higher by 10.899 percentage points and the price is about 5.2% higher, with trade volume about 55% more. However, compared with the initial scan at 02:01 (+110.495%), it has fallen by 6.613 percentage points, and the scan price is about 2.9% lower, suggesting it’s not a straight-line surge. The ranking only determines the research order; it is not a signal to go long.
Two newly completed hourly candles show divergence: 00:00—01:00 opened at 0.04623 and closed at 0.04594, down about 0.63%, with trade volume $41.98 million; 01:00—02:00 opened at 0.04590, spiked to 0.05306, then closed at 0.04946, up about 7.76%, with trade volume $33.14 million, roughly 21% less than the prior hour. Even though the latter closed up, the long upper wicks and reduced volume still indicate supply-demand tussling at elevated levels; for 02:00—03:00 the hour has not closed yet, so intraday fluctuations can’t be treated as confirmation.
In OI samples, from 00:00 to 01:00 it increased by about 5.43%, while from 01:00 to 02:00 it rose only about 0.41%; an increase in open interest doesn’t equal net long positions. The most recent settlement funding rate is +0.2367% from 00:00, meaning longs are paying and the cost of chasing positions is relatively high, but it’s not a reversal forecast. Within the current verification scope, no project announcements for the day were found that could explain this sudden surge; old listings or brand-upgrade news can’t serve as a new catalyst.
My stance remains: observe high volatility, and don’t chase longs. Only if the next fully completed hourly candle closes above 0.05306 with volume would I add evidence for continuation. If it breaks below the 0.04455—0.04470 range, then the repair seen over the last two hours would be weakened. The current 4-hour K-line hasn’t closed; these are verification levels—not an entry price or target price.
【$AINUSDT复扫仍居涨幅第1,但盘中回吐提醒我不追急拉】
02:15 BJT re-scan fully covers 526 qualifying USDT-margined perpetual contracts, with AIN/USDT still ranked #1: 24-hour price increase +103.882%, scan price 0.04832, and quoted trade volume of about $199.7 million; at 02:16 the single-coin ticker is 0.04840, with 24-hour increase +104.392%. Compared with the previous post on this feed at 00:09 ( +92.983%, 0.04593, trade volume about $128.8 million), the current scan gain is higher by 10.899 percentage points and the price is about 5.2% higher, with trade volume about 55% more. However, compared with the initial scan at 02:01 (+110.495%), it has fallen by 6.613 percentage points, and the scan price is about 2.9% lower, suggesting it’s not a straight-line surge. The ranking only determines the research order; it is not a signal to go long.
Two newly completed hourly candles show divergence: 00:00—01:00 opened at 0.04623 and closed at 0.04594, down about 0.63%, with trade volume $41.98 million; 01:00—02:00 opened at 0.04590, spiked to 0.05306, then closed at 0.04946, up about 7.76%, with trade volume $33.14 million, roughly 21% less than the prior hour. Even though the latter closed up, the long upper wicks and reduced volume still indicate supply-demand tussling at elevated levels; for 02:00—03:00 the hour has not closed yet, so intraday fluctuations can’t be treated as confirmation.
In OI samples, from 00:00 to 01:00 it increased by about 5.43%, while from 01:00 to 02:00 it rose only about 0.41%; an increase in open interest doesn’t equal net long positions. The most recent settlement funding rate is +0.2367% from 00:00, meaning longs are paying and the cost of chasing positions is relatively high, but it’s not a reversal forecast. Within the current verification scope, no project announcements for the day were found that could explain this sudden surge; old listings or brand-upgrade news can’t serve as a new catalyst.
My stance remains: observe high volatility, and don’t chase longs. Only if the next fully completed hourly candle closes above 0.05306 with volume would I add evidence for continuation. If it breaks below the 0.04455—0.04470 range, then the repair seen over the last two hours would be weakened. The current 4-hour K-line hasn’t closed; these are verification levels—not an entry price or target price.
02:15 BJT re-scan fully covers 526 qualifying USDT-margined perpetual contracts, with AIN/USDT still ranked #1: 24-hour price increase +103.882%, scan price 0.04832, and quoted trade volume of about $199.7 million; at 02:16 the single-coin ticker is 0.04840, with 24-hour increase +104.392%. Compared with the previous post on this feed at 00:09 ( +92.983%, 0.04593, trade volume about $128.8 million), the current scan gain is higher by 10.899 percentage points and the price is about 5.2% higher, with trade volume about 55% more. However, compared with the initial scan at 02:01 (+110.495%), it has fallen by 6.613 percentage points, and the scan price is about 2.9% lower, suggesting it’s not a straight-line surge. The ranking only determines the research order; it is not a signal to go long.
Two newly completed hourly candles show divergence: 00:00—01:00 opened at 0.04623 and closed at 0.04594, down about 0.63%, with trade volume $41.98 million; 01:00—02:00 opened at 0.04590, spiked to 0.05306, then closed at 0.04946, up about 7.76%, with trade volume $33.14 million, roughly 21% less than the prior hour. Even though the latter closed up, the long upper wicks and reduced volume still indicate supply-demand tussling at elevated levels; for 02:00—03:00 the hour has not closed yet, so intraday fluctuations can’t be treated as confirmation.
In OI samples, from 00:00 to 01:00 it increased by about 5.43%, while from 01:00 to 02:00 it rose only about 0.41%; an increase in open interest doesn’t equal net long positions. The most recent settlement funding rate is +0.2367% from 00:00, meaning longs are paying and the cost of chasing positions is relatively high, but it’s not a reversal forecast. Within the current verification scope, no project announcements for the day were found that could explain this sudden surge; old listings or brand-upgrade news can’t serve as a new catalyst.
My stance remains: observe high volatility, and don’t chase longs. Only if the next fully completed hourly candle closes above 0.05306 with volume would I add evidence for continuation. If it breaks below the 0.04455—0.04470 range, then the repair seen over the last two hours would be weakened. The current 4-hour K-line hasn’t closed; these are verification levels—not an entry price or target price.
22
·
--
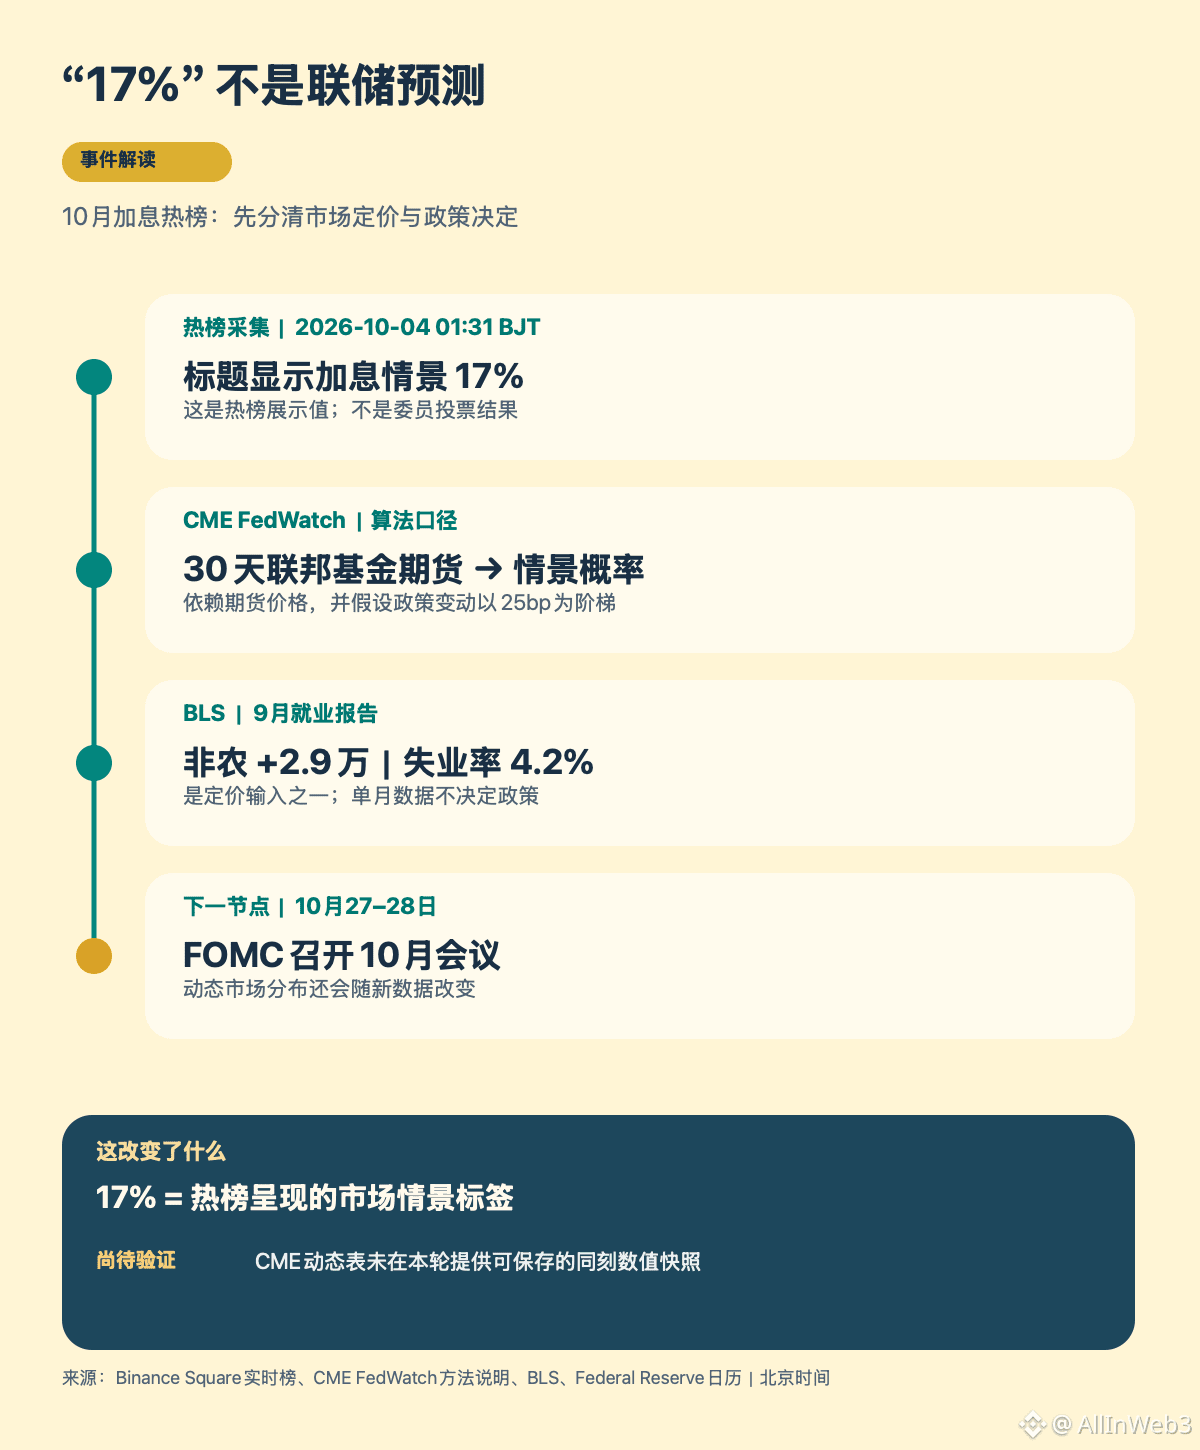
#The Fed’s October hike “17%”: first, see what probability this actually is. The Binance Square Trending Topic title gives 17%, but it’s not a forecast published by the FOMC itself, nor the result of a committee vote.
CME FedWatch’s explanation is very clear: the meeting probability is inferred from the 30-day Federal Funds futures price for the corresponding month. The method breaks policy-rate changes into scenarios in 25-basis-point steps, then maps the futures-implied effective rate into possible outcomes. What it expresses is the distribution of market prices under the model’s assumptions—not “17% of committee members support a rate hike,” and not a guarantee of how the Fed will act.
This topic has been heating up alongside the U.S. September employment data. The BLS reported nonfarm payrolls up by 290,000 and unemployment at 4.2%; meanwhile, it revised the combined total for July and August downward by 60,000. Weak hiring can change how short-term futures are priced, but a single report isn’t enough to determine the policy path. The Fed still needs to weigh inflation, subsequent employment, and financial conditions. The October meeting listed on the official calendar is 27–28, leaving time before any decision is made; market probabilities will also move with new information.
There’s also an easy place to misread it: you can’t look only at the scenario distribution and then reverse “a 17% hike” into “83% of the time they won’t do anything.” FedWatch presents multiple target-rate outcomes, and how probabilities are aggregated depends on the meeting and scenarios you choose. This trending topic indeed shows 17%, but the embedded dynamic table on the CME page does not present a value snapshot that can be saved from this run; I can verify the algorithm methodology, but I can’t claim to independently recheck this real-time percentage. Therefore, treat it as the market label from the trending-topic collection—not as a fixed quote for the present moment. The next step is to cross-check the FedWatch distribution for the same meeting and the new macro data; it’s not a directional signal for BTC or other crypto assets by itself. You also need to watch the horizon: the single-scenario probability for an October meeting can’t be directly extrapolated to the full-year path through year-end. CME’s guide also separates futures-implied probabilities from the Fed’s dot plot— the latter is committee members’ forecasts for future rates. The two must not be blended into a single “Fed consensus.” The minutes of the September meeting, released on October 7, can add context about the conditions discussed by decision-makers at the time, but the minutes also can’t replace the actual vote at the next meeting.
#The Fed’s October hike “17%”: first, see what probability this actually is. The Binance Square Trending Topic title gives 17%, but it’s not a forecast published by the FOMC itself, nor the result of a committee vote.
CME FedWatch’s explanation is very clear: the meeting probability is inferred from the 30-day Federal Funds futures price for the corresponding month. The method breaks policy-rate changes into scenarios in 25-basis-point steps, then maps the futures-implied effective rate into possible outcomes. What it expresses is the distribution of market prices under the model’s assumptions—not “17% of committee members support a rate hike,” and not a guarantee of how the Fed will act.
This topic has been heating up alongside the U.S. September employment data. The BLS reported nonfarm payrolls up by 290,000 and unemployment at 4.2%; meanwhile, it revised the combined total for July and August downward by 60,000. Weak hiring can change how short-term futures are priced, but a single report isn’t enough to determine the policy path. The Fed still needs to weigh inflation, subsequent employment, and financial conditions. The October meeting listed on the official calendar is 27–28, leaving time before any decision is made; market probabilities will also move with new information.
There’s also an easy place to misread it: you can’t look only at the scenario distribution and then reverse “a 17% hike” into “83% of the time they won’t do anything.” FedWatch presents multiple target-rate outcomes, and how probabilities are aggregated depends on the meeting and scenarios you choose. This trending topic indeed shows 17%, but the embedded dynamic table on the CME page does not present a value snapshot that can be saved from this run; I can verify the algorithm methodology, but I can’t claim to independently recheck this real-time percentage. Therefore, treat it as the market label from the trending-topic collection—not as a fixed quote for the present moment. The next step is to cross-check the FedWatch distribution for the same meeting and the new macro data; it’s not a directional signal for BTC or other crypto assets by itself. You also need to watch the horizon: the single-scenario probability for an October meeting can’t be directly extrapolated to the full-year path through year-end. CME’s guide also separates futures-implied probabilities from the Fed’s dot plot— the latter is committee members’ forecasts for future rates. The two must not be blended into a single “Fed consensus.” The minutes of the September meeting, released on October 7, can add context about the conditions discussed by decision-makers at the time, but the minutes also can’t replace the actual vote at the next meeting.
CME FedWatch’s explanation is very clear: the meeting probability is inferred from the 30-day Federal Funds futures price for the corresponding month. The method breaks policy-rate changes into scenarios in 25-basis-point steps, then maps the futures-implied effective rate into possible outcomes. What it expresses is the distribution of market prices under the model’s assumptions—not “17% of committee members support a rate hike,” and not a guarantee of how the Fed will act.
This topic has been heating up alongside the U.S. September employment data. The BLS reported nonfarm payrolls up by 290,000 and unemployment at 4.2%; meanwhile, it revised the combined total for July and August downward by 60,000. Weak hiring can change how short-term futures are priced, but a single report isn’t enough to determine the policy path. The Fed still needs to weigh inflation, subsequent employment, and financial conditions. The October meeting listed on the official calendar is 27–28, leaving time before any decision is made; market probabilities will also move with new information.
There’s also an easy place to misread it: you can’t look only at the scenario distribution and then reverse “a 17% hike” into “83% of the time they won’t do anything.” FedWatch presents multiple target-rate outcomes, and how probabilities are aggregated depends on the meeting and scenarios you choose. This trending topic indeed shows 17%, but the embedded dynamic table on the CME page does not present a value snapshot that can be saved from this run; I can verify the algorithm methodology, but I can’t claim to independently recheck this real-time percentage. Therefore, treat it as the market label from the trending-topic collection—not as a fixed quote for the present moment. The next step is to cross-check the FedWatch distribution for the same meeting and the new macro data; it’s not a directional signal for BTC or other crypto assets by itself. You also need to watch the horizon: the single-scenario probability for an October meeting can’t be directly extrapolated to the full-year path through year-end. CME’s guide also separates futures-implied probabilities from the Fed’s dot plot— the latter is committee members’ forecasts for future rates. The two must not be blended into a single “Fed consensus.” The minutes of the September meeting, released on October 7, can add context about the conditions discussed by decision-makers at the time, but the minutes also can’t replace the actual vote at the next meeting.
4
·
--
【Lobster USDT: Rebound and regain; volume still needs confirmation】
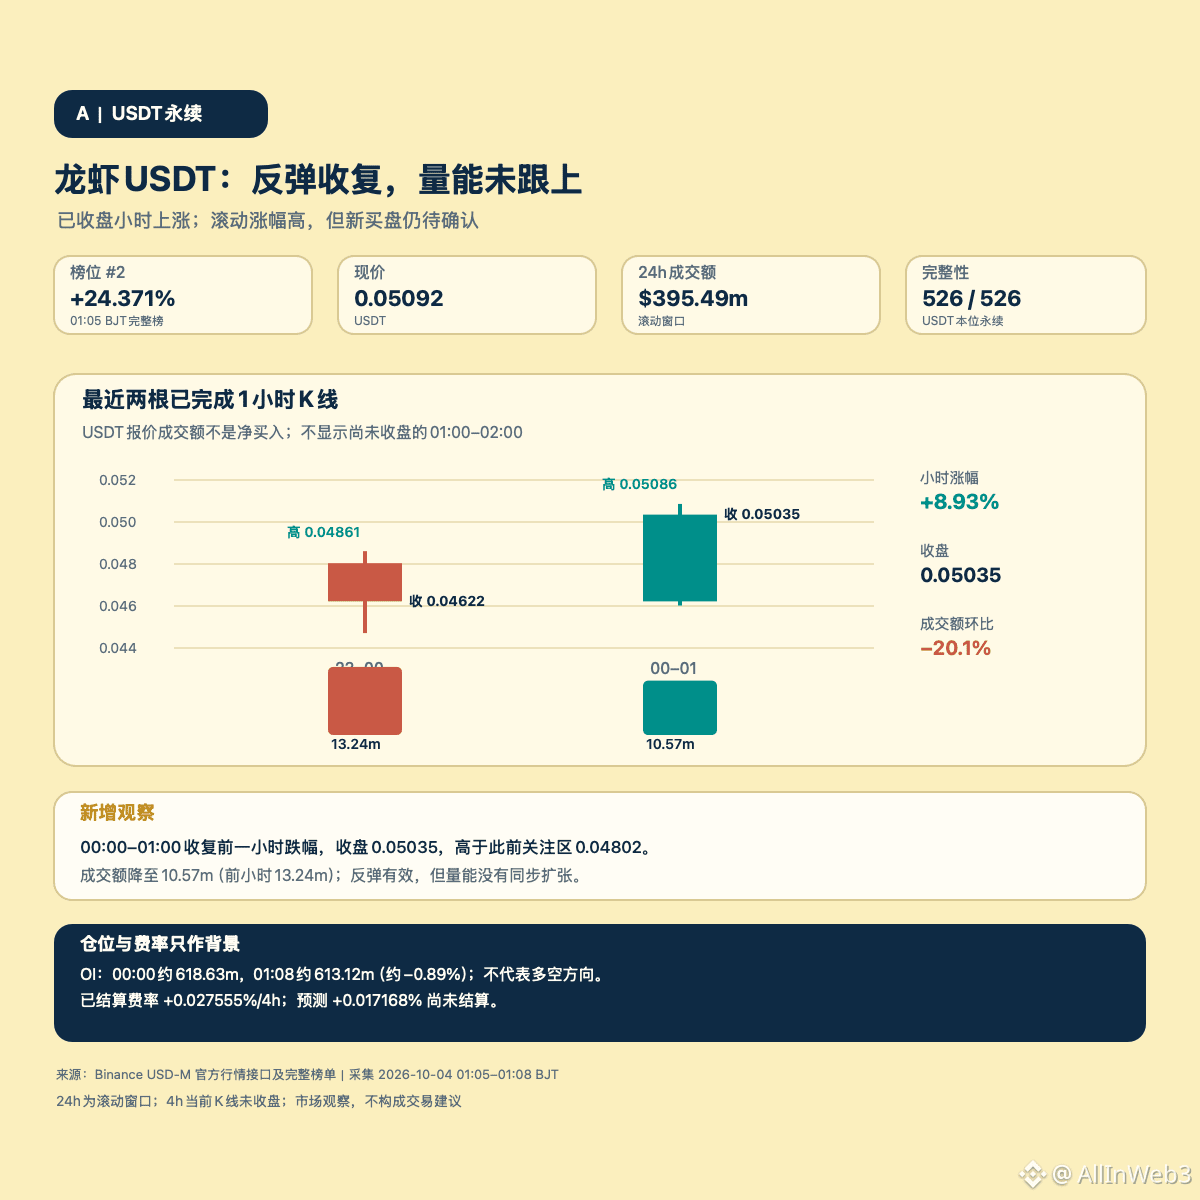
Short-term conclusion: Don’t chase the price; wait for a complete hourly confirmation. A full scan of Binance USDT coin-margined perpetual contracts at 01:05 Beijing time covered 526/526 contracts. The Lobster USDT ranked 2nd by percentage gain, with a rolling 24-hour change of +25.141%. Price: 0.05092. Trading value: about $395.5 million. AIN topped the list for two consecutive rounds; this round, based on the rotation rules, it’s the 2nd place. Compared with this author’s earlier post before 16:18 (ID 373246300394017, price 0.04683), the scanned price is about 8.7% higher, but the rolling 24-hour gain isn’t simply the profit from this time window—the statistics window has been moving. In the complete re-scan published before 01:11, it had already dropped to 4th place (+19.447%, 0.05012). Therefore, this article only reviews the already-completed hourly structure and does not write the earlier 2nd place as the current ranking.
The key addition in this piece is the already-closed hour from 00:00 to 01:00: open 0.04622, high 0.05086, low 0.04602, close 0.05035. This is about +8.93% versus the open, and it has reclaimed the previously watched 0.04802 area. It changes the short-term structure described in the pre-16:18 post—after the failed pullback, it was still falling. However, the trading value is about $10.57 million, roughly 20% less than the $13.24 million in the 23:00–00:00 hour. The rebound is valid, but trading volume hasn’t expanded in sync, so it can’t be directly treated as confirmation of new buying. The 24-hour high at 0.05499 remains the higher observation zone and does not represent the target price.
Position readings are a bit cautious: Binance hourly OI sample is about 618.6 million at 00:00 and about 614.7 million at 01:00. At 01:08, current OI is about 613.1 million, down about 0.89% versus 00:00. OI only indicates the number of open contracts; a decrease cannot prove shorts are covering, and it also can’t distinguish long vs. short. The latest settled funding rate is +0.027555% per 4 hours. The 01:08 interface prediction for the next period is about +0.017168%, not yet settled; a positive value means longs are paying shorts, which is a holding cost—not a directional signal. The 01:00–02:00 hour hasn’t closed yet, so you can’t take the intrahour high as confirmation.
Binance’s official materials describe the lobster as a BNB Chain Chinese meme coin; the contract launched in March. In this round’s announcement verification, no same-day project catalyst was found that could explain this rebound. Going forward, observe whether the full hour can hold 0.04802 and close above 0.05086, alongside a recovery in trading value. If it falls below 0.04602, then the low of the most recent rebound hour is broken. The above is the boundary for structural observation, not an entry or stop-loss instruction. #Lobster USDT
【Lobster USDT: Rebound and regain; volume still needs confirmation】
Short-term conclusion: Don’t chase the price; wait for a complete hourly confirmation. A full scan of Binance USDT coin-margined perpetual contracts at 01:05 Beijing time covered 526/526 contracts. The Lobster USDT ranked 2nd by percentage gain, with a rolling 24-hour change of +25.141%. Price: 0.05092. Trading value: about $395.5 million. AIN topped the list for two consecutive rounds; this round, based on the rotation rules, it’s the 2nd place. Compared with this author’s earlier post before 16:18 (ID 373246300394017, price 0.04683), the scanned price is about 8.7% higher, but the rolling 24-hour gain isn’t simply the profit from this time window—the statistics window has been moving. In the complete re-scan published before 01:11, it had already dropped to 4th place (+19.447%, 0.05012). Therefore, this article only reviews the already-completed hourly structure and does not write the earlier 2nd place as the current ranking.
The key addition in this piece is the already-closed hour from 00:00 to 01:00: open 0.04622, high 0.05086, low 0.04602, close 0.05035. This is about +8.93% versus the open, and it has reclaimed the previously watched 0.04802 area. It changes the short-term structure described in the pre-16:18 post—after the failed pullback, it was still falling. However, the trading value is about $10.57 million, roughly 20% less than the $13.24 million in the 23:00–00:00 hour. The rebound is valid, but trading volume hasn’t expanded in sync, so it can’t be directly treated as confirmation of new buying. The 24-hour high at 0.05499 remains the higher observation zone and does not represent the target price.
Position readings are a bit cautious: Binance hourly OI sample is about 618.6 million at 00:00 and about 614.7 million at 01:00. At 01:08, current OI is about 613.1 million, down about 0.89% versus 00:00. OI only indicates the number of open contracts; a decrease cannot prove shorts are covering, and it also can’t distinguish long vs. short. The latest settled funding rate is +0.027555% per 4 hours. The 01:08 interface prediction for the next period is about +0.017168%, not yet settled; a positive value means longs are paying shorts, which is a holding cost—not a directional signal. The 01:00–02:00 hour hasn’t closed yet, so you can’t take the intrahour high as confirmation.
Binance’s official materials describe the lobster as a BNB Chain Chinese meme coin; the contract launched in March. In this round’s announcement verification, no same-day project catalyst was found that could explain this rebound. Going forward, observe whether the full hour can hold 0.04802 and close above 0.05086, alongside a recovery in trading value. If it falls below 0.04602, then the low of the most recent rebound hour is broken. The above is the boundary for structural observation, not an entry or stop-loss instruction. #Lobster USDT
Short-term conclusion: Don’t chase the price; wait for a complete hourly confirmation. A full scan of Binance USDT coin-margined perpetual contracts at 01:05 Beijing time covered 526/526 contracts. The Lobster USDT ranked 2nd by percentage gain, with a rolling 24-hour change of +25.141%. Price: 0.05092. Trading value: about $395.5 million. AIN topped the list for two consecutive rounds; this round, based on the rotation rules, it’s the 2nd place. Compared with this author’s earlier post before 16:18 (ID 373246300394017, price 0.04683), the scanned price is about 8.7% higher, but the rolling 24-hour gain isn’t simply the profit from this time window—the statistics window has been moving. In the complete re-scan published before 01:11, it had already dropped to 4th place (+19.447%, 0.05012). Therefore, this article only reviews the already-completed hourly structure and does not write the earlier 2nd place as the current ranking.
The key addition in this piece is the already-closed hour from 00:00 to 01:00: open 0.04622, high 0.05086, low 0.04602, close 0.05035. This is about +8.93% versus the open, and it has reclaimed the previously watched 0.04802 area. It changes the short-term structure described in the pre-16:18 post—after the failed pullback, it was still falling. However, the trading value is about $10.57 million, roughly 20% less than the $13.24 million in the 23:00–00:00 hour. The rebound is valid, but trading volume hasn’t expanded in sync, so it can’t be directly treated as confirmation of new buying. The 24-hour high at 0.05499 remains the higher observation zone and does not represent the target price.
Position readings are a bit cautious: Binance hourly OI sample is about 618.6 million at 00:00 and about 614.7 million at 01:00. At 01:08, current OI is about 613.1 million, down about 0.89% versus 00:00. OI only indicates the number of open contracts; a decrease cannot prove shorts are covering, and it also can’t distinguish long vs. short. The latest settled funding rate is +0.027555% per 4 hours. The 01:08 interface prediction for the next period is about +0.017168%, not yet settled; a positive value means longs are paying shorts, which is a holding cost—not a directional signal. The 01:00–02:00 hour hasn’t closed yet, so you can’t take the intrahour high as confirmation.
Binance’s official materials describe the lobster as a BNB Chain Chinese meme coin; the contract launched in March. In this round’s announcement verification, no same-day project catalyst was found that could explain this rebound. Going forward, observe whether the full hour can hold 0.04802 and close above 0.05086, alongside a recovery in trading value. If it falls below 0.04602, then the low of the most recent rebound hour is broken. The above is the boundary for structural observation, not an entry or stop-loss instruction. #Lobster USDT
6
·
--
[“$AINUSDT surged sharply into a high zone and switched hands: don’t treat the #1 spot on the board as a buy signal”】
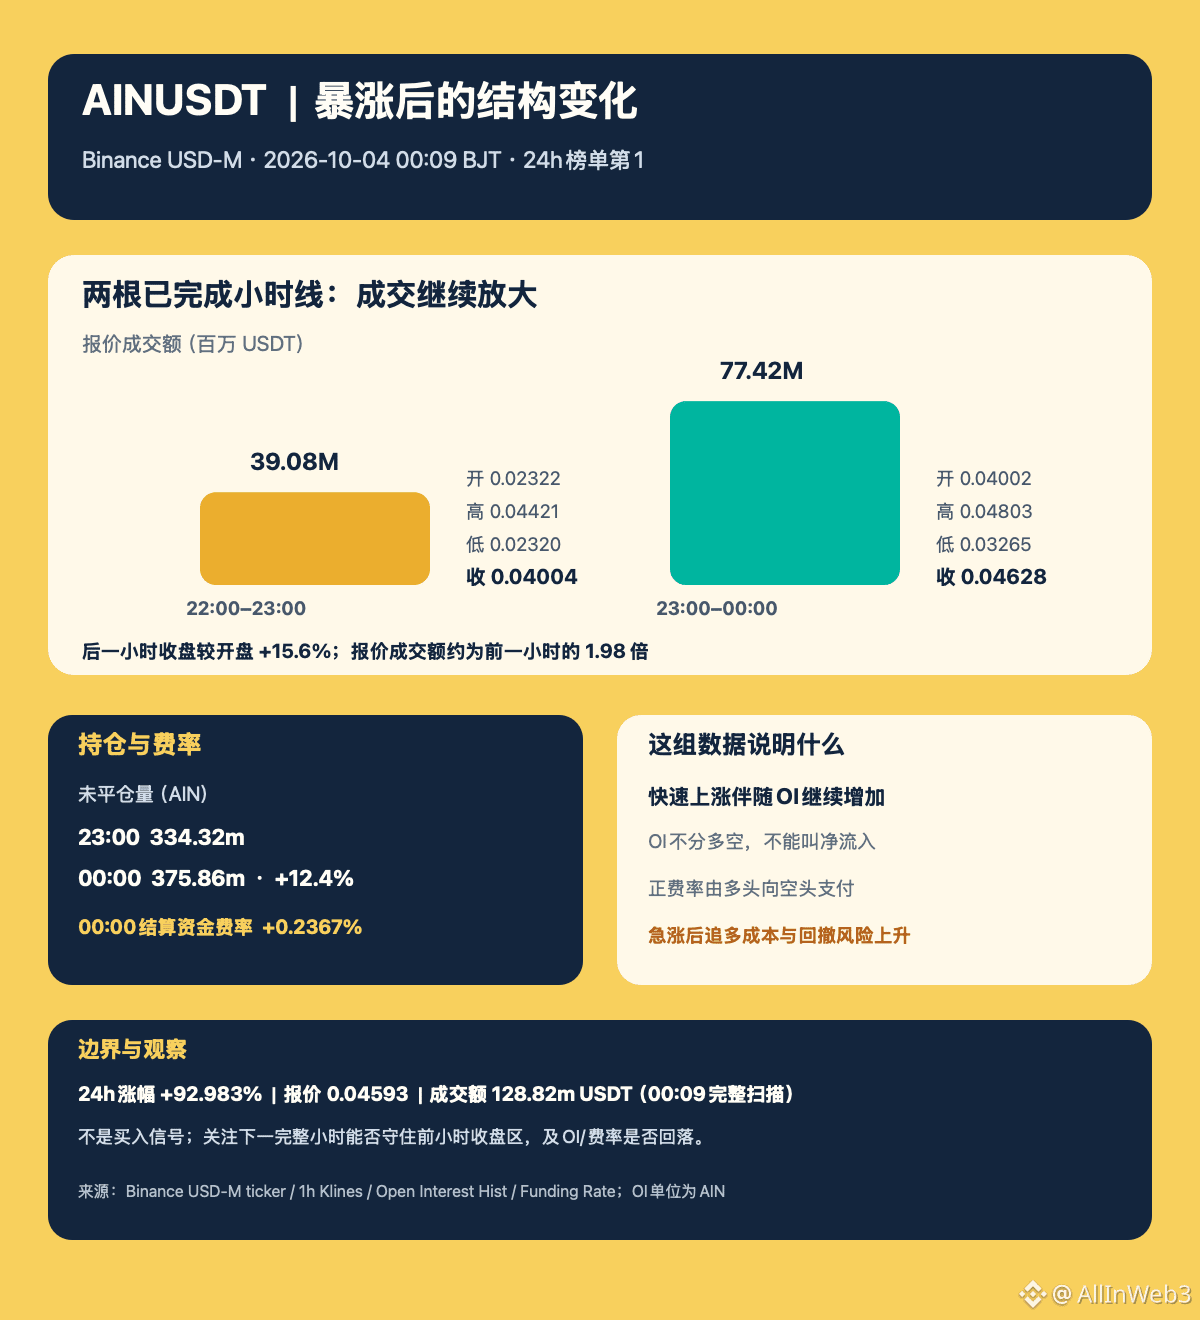
For short-term trading, watch and wait—don’t chase the sudden rally. A full scan at 00:09 of Binance USD-M covering 526 USDT-margined perpetual contracts within the specified range shows AINUSDT leading with a +92.983% gain, priced at 0.04593, with about $128.8M in rolling 24-hour trading value. Compared with my previous post (23:20 scan: +45.828%, 0.03478, trading value 73.63M), about 49 minutes later the price is up roughly 32.1%, the 24-hour gain has increased by 47.155 percentage points, and trading value is up by about 75%. This change far exceeds the board’s threshold, but it doesn’t mean there will be equal upside room later—this is still high volatility.
The new structural evidence comes from the completed 23:00–00:00 hourly candlestick: open 0.04002, high 0.04803, low 0.03265, close 0.04628, hourly up 15.6%. The USDT quoted trading value was 77.42M, about 1.98x the previous hour’s 39.08M. While the price was pushed up, large pullback wicks also appeared—indicating wide intrahour fluctuation. Total trading value reflects both buy and sell activity, not net buying.
Positions are expanding too: the Binance 1-hour OI sample increased from 334.3M AIN at 23:00 to 375.9M AIN at 00:00, up about 12.4%. The 00:04 single-point OI was around 383.7M AIN. This only indicates an increase in open contracts; it can’t distinguish long vs. short, and it can’t be used to directly call it capital inflow. The funding side is more worth worrying about: the latest settlement funding rate at 00:00 is +0.2367%, compared with the previous settlement record at 20:00 of +0.0120%. A positive rate means longs are paying shorts; a higher rate increases the cost of holding positions and also signals the risk of overcrowding among longs—but it doesn’t, by itself, foretell a reversal.
The old Binance announcements I found only confirm the background of AIN related to Infinity Ground and the contract listing. In this round, I couldn’t find a verifiable primary project announcement that explains this sudden surge. Compared with the previous post, the new information isn’t just a re-description of the big breakout candle at 22:00; instead, after 23:00 the hour still closed up, trading was close to doubling, OI increased again, and the funding rate jumped. Next, observe whether the next complete hour can hold around 0.04628, and whether OI and the settlement funding rate continue to rise. Incomplete candles and intraday prices are not treated as confirmation. This looks more like a high-volatility observation than a buy-chase recommendation.
[“$AINUSDT surged sharply into a high zone and switched hands: don’t treat the #1 spot on the board as a buy signal”】
For short-term trading, watch and wait—don’t chase the sudden rally. A full scan at 00:09 of Binance USD-M covering 526 USDT-margined perpetual contracts within the specified range shows AINUSDT leading with a +92.983% gain, priced at 0.04593, with about $128.8M in rolling 24-hour trading value. Compared with my previous post (23:20 scan: +45.828%, 0.03478, trading value 73.63M), about 49 minutes later the price is up roughly 32.1%, the 24-hour gain has increased by 47.155 percentage points, and trading value is up by about 75%. This change far exceeds the board’s threshold, but it doesn’t mean there will be equal upside room later—this is still high volatility.
The new structural evidence comes from the completed 23:00–00:00 hourly candlestick: open 0.04002, high 0.04803, low 0.03265, close 0.04628, hourly up 15.6%. The USDT quoted trading value was 77.42M, about 1.98x the previous hour’s 39.08M. While the price was pushed up, large pullback wicks also appeared—indicating wide intrahour fluctuation. Total trading value reflects both buy and sell activity, not net buying.
Positions are expanding too: the Binance 1-hour OI sample increased from 334.3M AIN at 23:00 to 375.9M AIN at 00:00, up about 12.4%. The 00:04 single-point OI was around 383.7M AIN. This only indicates an increase in open contracts; it can’t distinguish long vs. short, and it can’t be used to directly call it capital inflow. The funding side is more worth worrying about: the latest settlement funding rate at 00:00 is +0.2367%, compared with the previous settlement record at 20:00 of +0.0120%. A positive rate means longs are paying shorts; a higher rate increases the cost of holding positions and also signals the risk of overcrowding among longs—but it doesn’t, by itself, foretell a reversal.
The old Binance announcements I found only confirm the background of AIN related to Infinity Ground and the contract listing. In this round, I couldn’t find a verifiable primary project announcement that explains this sudden surge. Compared with the previous post, the new information isn’t just a re-description of the big breakout candle at 22:00; instead, after 23:00 the hour still closed up, trading was close to doubling, OI increased again, and the funding rate jumped. Next, observe whether the next complete hour can hold around 0.04628, and whether OI and the settlement funding rate continue to rise. Incomplete candles and intraday prices are not treated as confirmation. This looks more like a high-volatility observation than a buy-chase recommendation.
For short-term trading, watch and wait—don’t chase the sudden rally. A full scan at 00:09 of Binance USD-M covering 526 USDT-margined perpetual contracts within the specified range shows AINUSDT leading with a +92.983% gain, priced at 0.04593, with about $128.8M in rolling 24-hour trading value. Compared with my previous post (23:20 scan: +45.828%, 0.03478, trading value 73.63M), about 49 minutes later the price is up roughly 32.1%, the 24-hour gain has increased by 47.155 percentage points, and trading value is up by about 75%. This change far exceeds the board’s threshold, but it doesn’t mean there will be equal upside room later—this is still high volatility.
The new structural evidence comes from the completed 23:00–00:00 hourly candlestick: open 0.04002, high 0.04803, low 0.03265, close 0.04628, hourly up 15.6%. The USDT quoted trading value was 77.42M, about 1.98x the previous hour’s 39.08M. While the price was pushed up, large pullback wicks also appeared—indicating wide intrahour fluctuation. Total trading value reflects both buy and sell activity, not net buying.
Positions are expanding too: the Binance 1-hour OI sample increased from 334.3M AIN at 23:00 to 375.9M AIN at 00:00, up about 12.4%. The 00:04 single-point OI was around 383.7M AIN. This only indicates an increase in open contracts; it can’t distinguish long vs. short, and it can’t be used to directly call it capital inflow. The funding side is more worth worrying about: the latest settlement funding rate at 00:00 is +0.2367%, compared with the previous settlement record at 20:00 of +0.0120%. A positive rate means longs are paying shorts; a higher rate increases the cost of holding positions and also signals the risk of overcrowding among longs—but it doesn’t, by itself, foretell a reversal.
The old Binance announcements I found only confirm the background of AIN related to Infinity Ground and the contract listing. In this round, I couldn’t find a verifiable primary project announcement that explains this sudden surge. Compared with the previous post, the new information isn’t just a re-description of the big breakout candle at 22:00; instead, after 23:00 the hour still closed up, trading was close to doubling, OI increased again, and the funding rate jumped. Next, observe whether the next complete hour can hold around 0.04628, and whether OI and the settlement funding rate continue to rise. Incomplete candles and intraday prices are not treated as confirmation. This looks more like a high-volatility observation than a buy-chase recommendation.
412
·
--
【$AINUSDT surged 72% in one hour, then spiked and pulled back】
Conclusion upfront: stay on the sidelines for now, don’t chase. A complete scan covering 526 Binance USDT-margined perpetual futures as of 23:20:23 Beijing time shows AINUSDT still ranks #1 by percentage gain. The rolling 24-hour increase is +45.828%, quoted at 0.03478, with trading volume of about $73.63 million. Compared with the 23:11:30 snapshot at 0.04364, the current price is about 20.3% lower. These two timestamps’ rolling 24-hour gains are also affected by changes in the statistics window, so they can’t be used to judge short-term returns.
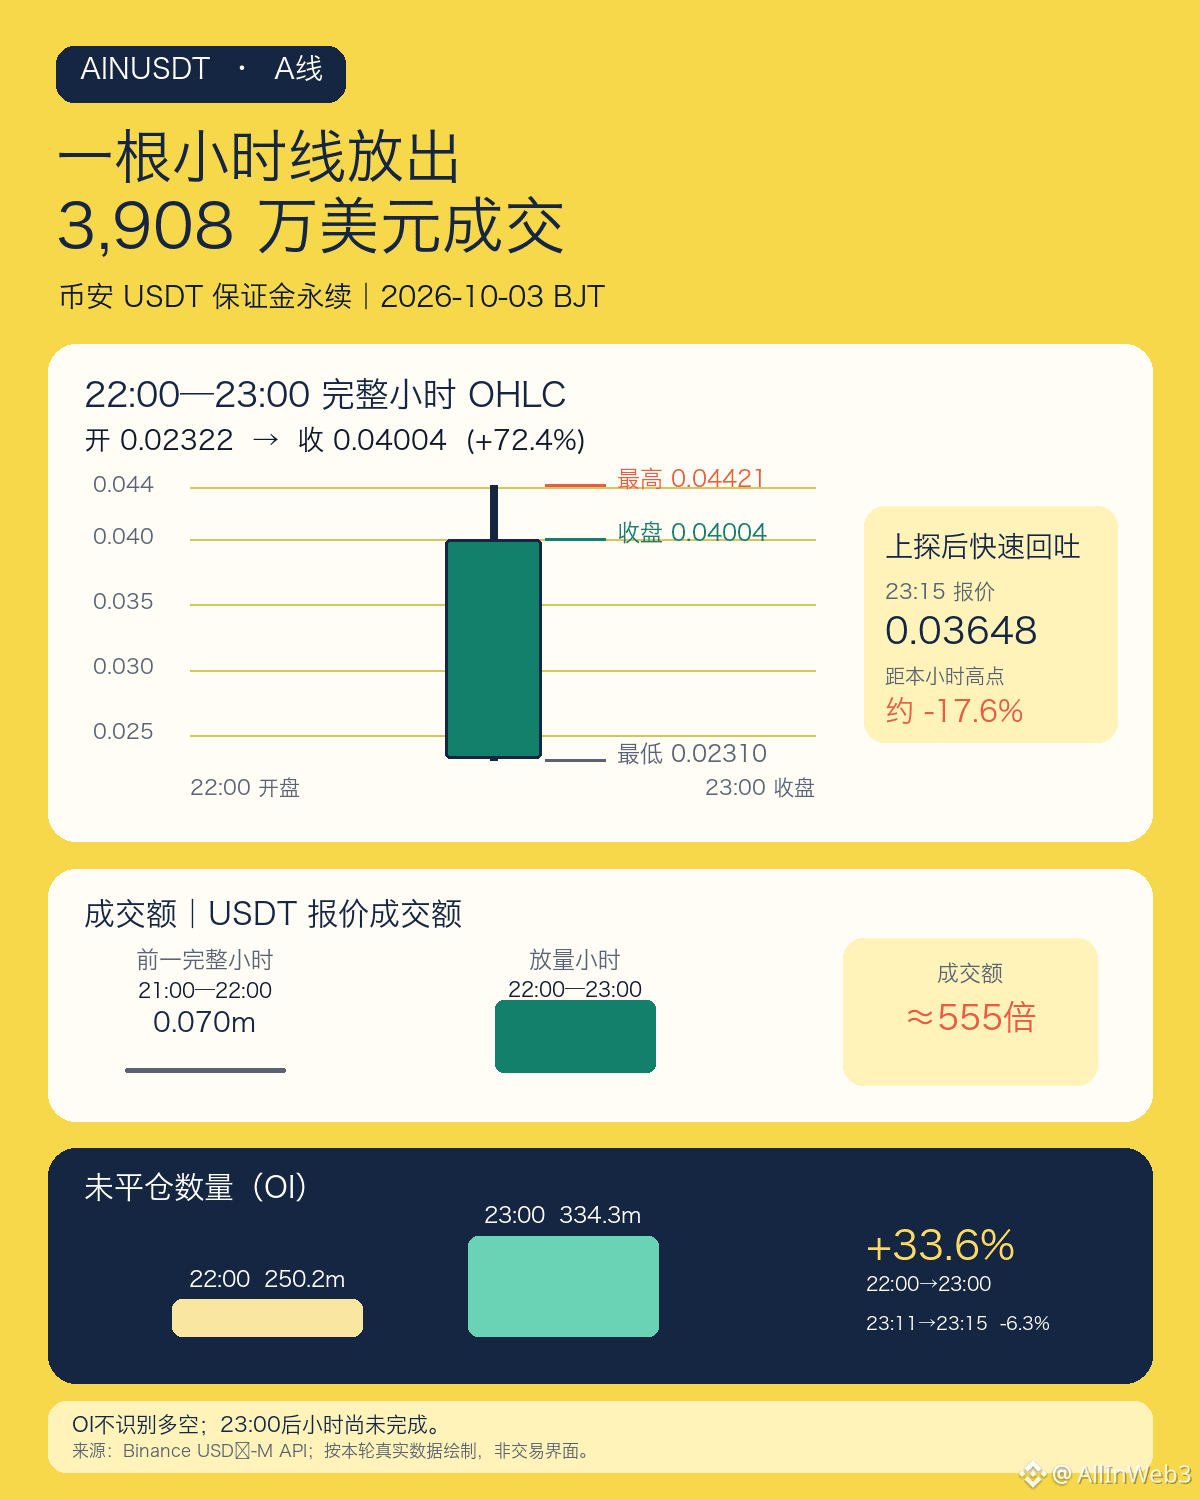
The activity start is concentrated in the full 1-hour candle from 22:00 to 23:00: open 0.02322, intraday high 0.04421, low 0.02310, and it closed at 0.04004—up about 72.4% from the open. The USDT-quoted trading volume for that hour is about $39.08 million, which is 555 times the previous full hour’s roughly $70.4 thousand. After that, the single-coin quote briefly reached 0.04372 and the high was 0.04426; at 23:20 the single-coin quote was 0.03496, about 21.0% below the peak. The later hour after 23:00 has not closed yet—this pullback reflects fast price changes, not confirmation by a completed hour.
Open interest expanded first, then fell: the open contract count sample was about 250.2 million AIN at 22:00, rising to about 334.3 million at 23:00—an increase of roughly 33.6%. Current OI interface samples are about 352.8 million at 23:11, 330.6 million at 23:15, and 334.0 million at 23:20. The sample indicates the open interest size swung quickly, but it can’t distinguish long vs. short direction—so it also can’t be used to claim liquidation or net outflows. The share of actively bought trade value from 22:00 to 23:00 is about 49.95%, and there’s also no evidence of an overwhelming one-sided buyer.
On fees: the latest settlement record and the mark price interface readings don’t match, so I won’t use that to judge whether the market is crowded on the long or short side. Recheck once the same settlement window is aligned in the same reporting format. Binance’s old announcement listed AIN as Infinity Ground and confirmed that the perpetuals were already live; in this round, I didn’t find any same-day project announcement that could explain this repricing.
My view is to wait first and not chase the sudden rally. Whether the next completed full hour can reclaim and hold around 0.040, and whether during the pullback the trading volume and OI keep contracting, should be more informative than the leaderboard rank; the post-23:00 hour is still not finished yet.
【$AINUSDT surged 72% in one hour, then spiked and pulled back】
Conclusion upfront: stay on the sidelines for now, don’t chase. A complete scan covering 526 Binance USDT-margined perpetual futures as of 23:20:23 Beijing time shows AINUSDT still ranks #1 by percentage gain. The rolling 24-hour increase is +45.828%, quoted at 0.03478, with trading volume of about $73.63 million. Compared with the 23:11:30 snapshot at 0.04364, the current price is about 20.3% lower. These two timestamps’ rolling 24-hour gains are also affected by changes in the statistics window, so they can’t be used to judge short-term returns.
The activity start is concentrated in the full 1-hour candle from 22:00 to 23:00: open 0.02322, intraday high 0.04421, low 0.02310, and it closed at 0.04004—up about 72.4% from the open. The USDT-quoted trading volume for that hour is about $39.08 million, which is 555 times the previous full hour’s roughly $70.4 thousand. After that, the single-coin quote briefly reached 0.04372 and the high was 0.04426; at 23:20 the single-coin quote was 0.03496, about 21.0% below the peak. The later hour after 23:00 has not closed yet—this pullback reflects fast price changes, not confirmation by a completed hour.
Open interest expanded first, then fell: the open contract count sample was about 250.2 million AIN at 22:00, rising to about 334.3 million at 23:00—an increase of roughly 33.6%. Current OI interface samples are about 352.8 million at 23:11, 330.6 million at 23:15, and 334.0 million at 23:20. The sample indicates the open interest size swung quickly, but it can’t distinguish long vs. short direction—so it also can’t be used to claim liquidation or net outflows. The share of actively bought trade value from 22:00 to 23:00 is about 49.95%, and there’s also no evidence of an overwhelming one-sided buyer.
On fees: the latest settlement record and the mark price interface readings don’t match, so I won’t use that to judge whether the market is crowded on the long or short side. Recheck once the same settlement window is aligned in the same reporting format. Binance’s old announcement listed AIN as Infinity Ground and confirmed that the perpetuals were already live; in this round, I didn’t find any same-day project announcement that could explain this repricing.
My view is to wait first and not chase the sudden rally. Whether the next completed full hour can reclaim and hold around 0.040, and whether during the pullback the trading volume and OI keep contracting, should be more informative than the leaderboard rank; the post-23:00 hour is still not finished yet.
Conclusion upfront: stay on the sidelines for now, don’t chase. A complete scan covering 526 Binance USDT-margined perpetual futures as of 23:20:23 Beijing time shows AINUSDT still ranks #1 by percentage gain. The rolling 24-hour increase is +45.828%, quoted at 0.03478, with trading volume of about $73.63 million. Compared with the 23:11:30 snapshot at 0.04364, the current price is about 20.3% lower. These two timestamps’ rolling 24-hour gains are also affected by changes in the statistics window, so they can’t be used to judge short-term returns.
The activity start is concentrated in the full 1-hour candle from 22:00 to 23:00: open 0.02322, intraday high 0.04421, low 0.02310, and it closed at 0.04004—up about 72.4% from the open. The USDT-quoted trading volume for that hour is about $39.08 million, which is 555 times the previous full hour’s roughly $70.4 thousand. After that, the single-coin quote briefly reached 0.04372 and the high was 0.04426; at 23:20 the single-coin quote was 0.03496, about 21.0% below the peak. The later hour after 23:00 has not closed yet—this pullback reflects fast price changes, not confirmation by a completed hour.
Open interest expanded first, then fell: the open contract count sample was about 250.2 million AIN at 22:00, rising to about 334.3 million at 23:00—an increase of roughly 33.6%. Current OI interface samples are about 352.8 million at 23:11, 330.6 million at 23:15, and 334.0 million at 23:20. The sample indicates the open interest size swung quickly, but it can’t distinguish long vs. short direction—so it also can’t be used to claim liquidation or net outflows. The share of actively bought trade value from 22:00 to 23:00 is about 49.95%, and there’s also no evidence of an overwhelming one-sided buyer.
On fees: the latest settlement record and the mark price interface readings don’t match, so I won’t use that to judge whether the market is crowded on the long or short side. Recheck once the same settlement window is aligned in the same reporting format. Binance’s old announcement listed AIN as Infinity Ground and confirmed that the perpetuals were already live; in this round, I didn’t find any same-day project announcement that could explain this repricing.
My view is to wait first and not chase the sudden rally. Whether the next completed full hour can reclaim and hold around 0.040, and whether during the pullback the trading volume and OI keep contracting, should be more informative than the leaderboard rank; the post-23:00 hour is still not finished yet.
261
·
--
The 87K topic of #BTC —this round’s increase isn’t a rehash of the pump-and-dump followed by a pullback; instead, it’s already been confirmed by the $85,000 hourly close check left in the previous post.
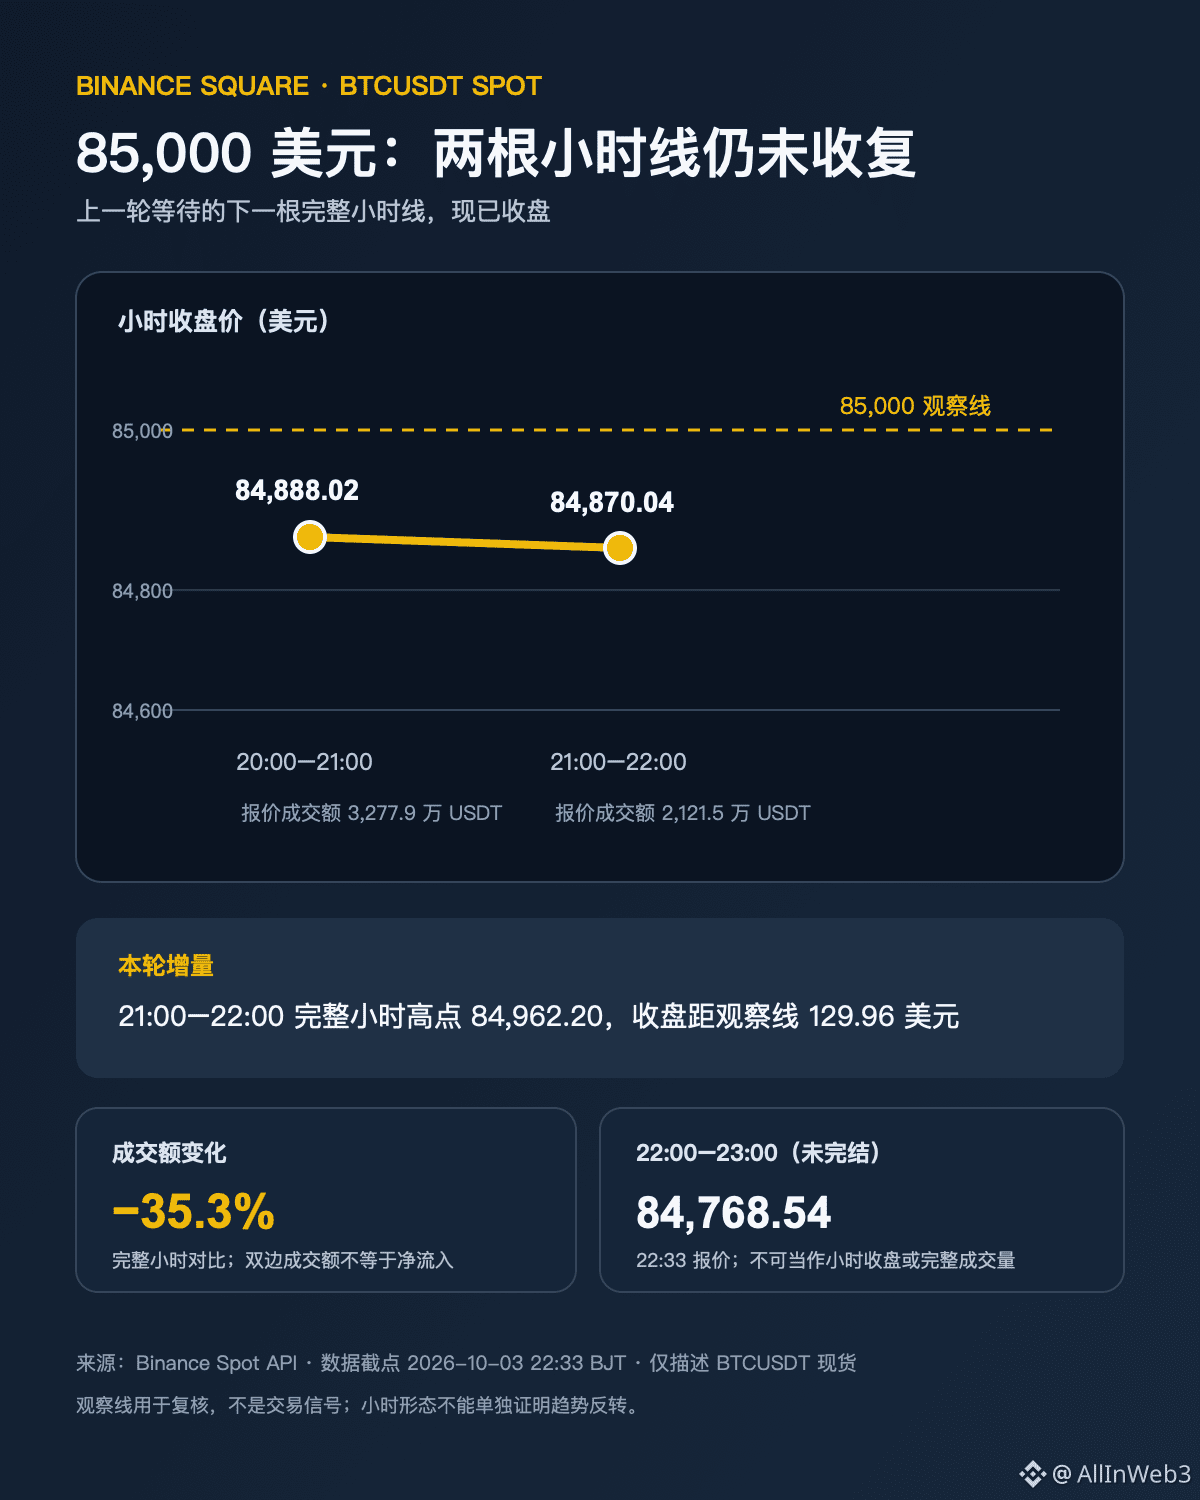
Binance spot BTCUSDT closed at $84,888.02 in the 20:00–21:00 BJT window; the next complete hour (21:00–22:00) opened at $84,888.02, with a high of $84,962.20 and a low of $84,770.35, and ultimately closed at $84,870.04. In other words, this hourly candle didn’t even touch $85,000, and the close remained $129.96 below it. The previous post with ID 373325098375454 was still waiting for this candle to close; this time it only fills in this pending, to-be-verified checkpoint.
Trading volume also provides a second boundary: the 20:00 hour’s quoted trade value was about $32.779 million USDT, while the 21:00 hour was about $21.215 million—down by roughly 35.3%. The close was also only slightly down versus the previous hour, about 0.02%. However, quoted trade value is the total matched amount between buy and sell orders; it does not equal net inflow. A drop in single-hour traded value also cannot, by itself, be used to conclude that selling pressure has already been exhausted.
As of 22:33, the 22:00–23:00 hour hasn’t finished yet. The latest quoted price is $84,768.54, and the current rolling 24-hour range is $83,888–$86,056, down about 1.35%. This is a different observation window from the earlier short-term high at 87,220. This chart does not treat an incomplete hour as a close, nor does it use the price pullback to explain causality or a trend reversal. Next, we only observe whether, in complete hours, it can close back above $85,000, and whether the成交 structure changes during any pullback. If subsequent complete hours show higher volume and close above $85,000, then that condition is considered verified; a brief intraday wick below with a close back above the line still doesn’t count as confirmation. Short-term highs, trade value, and hourly closes measure different information and can’t substitute for one another. This post also does not extrapolate a single-hour structure into a mid-term trend assessment. Price levels are the recheck condition, not a prediction or a trading signal. Data timestamp: 2026-10-03 22:33 BJT. Source: Binance Spot BTCUSDT 1-hour candlesticks and 24-hour ticker.
The 87K topic of #BTC —this round’s increase isn’t a rehash of the pump-and-dump followed by a pullback; instead, it’s already been confirmed by the $85,000 hourly close check left in the previous post.
Binance spot BTCUSDT closed at $84,888.02 in the 20:00–21:00 BJT window; the next complete hour (21:00–22:00) opened at $84,888.02, with a high of $84,962.20 and a low of $84,770.35, and ultimately closed at $84,870.04. In other words, this hourly candle didn’t even touch $85,000, and the close remained $129.96 below it. The previous post with ID 373325098375454 was still waiting for this candle to close; this time it only fills in this pending, to-be-verified checkpoint.
Trading volume also provides a second boundary: the 20:00 hour’s quoted trade value was about $32.779 million USDT, while the 21:00 hour was about $21.215 million—down by roughly 35.3%. The close was also only slightly down versus the previous hour, about 0.02%. However, quoted trade value is the total matched amount between buy and sell orders; it does not equal net inflow. A drop in single-hour traded value also cannot, by itself, be used to conclude that selling pressure has already been exhausted.
As of 22:33, the 22:00–23:00 hour hasn’t finished yet. The latest quoted price is $84,768.54, and the current rolling 24-hour range is $83,888–$86,056, down about 1.35%. This is a different observation window from the earlier short-term high at 87,220. This chart does not treat an incomplete hour as a close, nor does it use the price pullback to explain causality or a trend reversal. Next, we only observe whether, in complete hours, it can close back above $85,000, and whether the成交 structure changes during any pullback. If subsequent complete hours show higher volume and close above $85,000, then that condition is considered verified; a brief intraday wick below with a close back above the line still doesn’t count as confirmation. Short-term highs, trade value, and hourly closes measure different information and can’t substitute for one another. This post also does not extrapolate a single-hour structure into a mid-term trend assessment. Price levels are the recheck condition, not a prediction or a trading signal. Data timestamp: 2026-10-03 22:33 BJT. Source: Binance Spot BTCUSDT 1-hour candlesticks and 24-hour ticker.
Binance spot BTCUSDT closed at $84,888.02 in the 20:00–21:00 BJT window; the next complete hour (21:00–22:00) opened at $84,888.02, with a high of $84,962.20 and a low of $84,770.35, and ultimately closed at $84,870.04. In other words, this hourly candle didn’t even touch $85,000, and the close remained $129.96 below it. The previous post with ID 373325098375454 was still waiting for this candle to close; this time it only fills in this pending, to-be-verified checkpoint.
Trading volume also provides a second boundary: the 20:00 hour’s quoted trade value was about $32.779 million USDT, while the 21:00 hour was about $21.215 million—down by roughly 35.3%. The close was also only slightly down versus the previous hour, about 0.02%. However, quoted trade value is the total matched amount between buy and sell orders; it does not equal net inflow. A drop in single-hour traded value also cannot, by itself, be used to conclude that selling pressure has already been exhausted.
As of 22:33, the 22:00–23:00 hour hasn’t finished yet. The latest quoted price is $84,768.54, and the current rolling 24-hour range is $83,888–$86,056, down about 1.35%. This is a different observation window from the earlier short-term high at 87,220. This chart does not treat an incomplete hour as a close, nor does it use the price pullback to explain causality or a trend reversal. Next, we only observe whether, in complete hours, it can close back above $85,000, and whether the成交 structure changes during any pullback. If subsequent complete hours show higher volume and close above $85,000, then that condition is considered verified; a brief intraday wick below with a close back above the line still doesn’t count as confirmation. Short-term highs, trade value, and hourly closes measure different information and can’t substitute for one another. This post also does not extrapolate a single-hour structure into a mid-term trend assessment. Price levels are the recheck condition, not a prediction or a trading signal. Data timestamp: 2026-10-03 22:33 BJT. Source: Binance Spot BTCUSDT 1-hour candlesticks and 24-hour ticker.
14
·
--
Partly True
$PUMPBTCUSDT is still leading the top gainers over the past 24 hours, but the latest fully reported hourly signal is cautious: the price closed lower, the trading volume is nearly halved, and open interest expansion is starting to unwind. A high percentage gain alone cannot prove that the long side is still being actively followed.
At 22:02 BJT, the market’s initial scan covered 526 normal USDT-margined perpetual contracts. PUMPBTCUSDT ranked 1 at that time: +24.846% over rolling 24 hours, quote 0.01015, and trading volume of about $30.39 million. After the second pre-release scan at 22:10, it became rank 2: +23.114%, quote 0.01012, and trading volume of about $31.16 million. Since the snapshot timestamps differ, they cannot be mixed into a single fixed price. The hourly candles below run up to 22:03, and the last fully completed hour is 21:00–22:00.
Looking at the full hours: 20:00–21:00 closed at 0.01039; trading volume was about $10.357 million. 21:00–22:00 opened at 0.01040, had a high of 0.01057, a low of 0.00976, and closed at 0.01017. The close is down about 2.1%, and trading volume dropped to about $5.24 million, which is 49.4% less than the prior hour. This looks more like a pullback and cooling off after a spike, and you cannot infer net selling just from two-sided trading volume.
The OI sample rose from about 277 million at 20:00 to 305.4 million at 21:00, an increase of about 10.2%. By 22:00 it fell back to 297 million, down about 2.7% from the previous hour. This suggests that the open interest increased first and then shrank, but OI does not distinguish between longs and shorts, so you cannot conclude that all newly added positions are longs. The latest settled funding rate at 20:00 was +0.1529% per 4 hours. The next period’s estimate at 22:03 is +0.2062% and is still not settled; the actual number may change. Be mindful of both chasing-cost and adverse price swings.
Don’t miss the risk schedule: Binance’s Oct 1 announcement states that the PUMPBTCUSDT perpetual will be automatically settled and delisted at 17:00 BJT on Oct 5, and starting 16:30 no new non-reducing orders will be accepted. This applies to the contract, not to whether PumpBTC spot tokens are delisted; the announcement also cannot explain the cause of this round of the rally.
I won’t take the #1 ranking or rising OI as confirmation to go long. Going forward, first see whether the full hour can reclaim the prior hour’s close of 0.01039, then watch around 0.01057. If it breaks below 0.00976, the pullback structure of this move is still intact. With it getting close to automatic settlement and the estimated funding rate being on the high side, we should observe risk levels above the impulse to chase.
Data as of 22:03 BJT—only analyzing this perpetual contract; this does not constitute trading or order placement advice.
$PUMPBTCUSDT is still leading the top gainers over the past 24 hours, but the latest fully reported hourly signal is cautious: the price closed lower, the trading volume is nearly halved, and open interest expansion is starting to unwind. A high percentage gain alone cannot prove that the long side is still being actively followed.
At 22:02 BJT, the market’s initial scan covered 526 normal USDT-margined perpetual contracts. PUMPBTCUSDT ranked 1 at that time: +24.846% over rolling 24 hours, quote 0.01015, and trading volume of about $30.39 million. After the second pre-release scan at 22:10, it became rank 2: +23.114%, quote 0.01012, and trading volume of about $31.16 million. Since the snapshot timestamps differ, they cannot be mixed into a single fixed price. The hourly candles below run up to 22:03, and the last fully completed hour is 21:00–22:00.
Looking at the full hours: 20:00–21:00 closed at 0.01039; trading volume was about $10.357 million. 21:00–22:00 opened at 0.01040, had a high of 0.01057, a low of 0.00976, and closed at 0.01017. The close is down about 2.1%, and trading volume dropped to about $5.24 million, which is 49.4% less than the prior hour. This looks more like a pullback and cooling off after a spike, and you cannot infer net selling just from two-sided trading volume.
The OI sample rose from about 277 million at 20:00 to 305.4 million at 21:00, an increase of about 10.2%. By 22:00 it fell back to 297 million, down about 2.7% from the previous hour. This suggests that the open interest increased first and then shrank, but OI does not distinguish between longs and shorts, so you cannot conclude that all newly added positions are longs. The latest settled funding rate at 20:00 was +0.1529% per 4 hours. The next period’s estimate at 22:03 is +0.2062% and is still not settled; the actual number may change. Be mindful of both chasing-cost and adverse price swings.
Don’t miss the risk schedule: Binance’s Oct 1 announcement states that the PUMPBTCUSDT perpetual will be automatically settled and delisted at 17:00 BJT on Oct 5, and starting 16:30 no new non-reducing orders will be accepted. This applies to the contract, not to whether PumpBTC spot tokens are delisted; the announcement also cannot explain the cause of this round of the rally.
I won’t take the #1 ranking or rising OI as confirmation to go long. Going forward, first see whether the full hour can reclaim the prior hour’s close of 0.01039, then watch around 0.01057. If it breaks below 0.00976, the pullback structure of this move is still intact. With it getting close to automatic settlement and the estimated funding rate being on the high side, we should observe risk levels above the impulse to chase.
Data as of 22:03 BJT—only analyzing this perpetual contract; this does not constitute trading or order placement advice.
At 22:02 BJT, the market’s initial scan covered 526 normal USDT-margined perpetual contracts. PUMPBTCUSDT ranked 1 at that time: +24.846% over rolling 24 hours, quote 0.01015, and trading volume of about $30.39 million. After the second pre-release scan at 22:10, it became rank 2: +23.114%, quote 0.01012, and trading volume of about $31.16 million. Since the snapshot timestamps differ, they cannot be mixed into a single fixed price. The hourly candles below run up to 22:03, and the last fully completed hour is 21:00–22:00.
Looking at the full hours: 20:00–21:00 closed at 0.01039; trading volume was about $10.357 million. 21:00–22:00 opened at 0.01040, had a high of 0.01057, a low of 0.00976, and closed at 0.01017. The close is down about 2.1%, and trading volume dropped to about $5.24 million, which is 49.4% less than the prior hour. This looks more like a pullback and cooling off after a spike, and you cannot infer net selling just from two-sided trading volume.
The OI sample rose from about 277 million at 20:00 to 305.4 million at 21:00, an increase of about 10.2%. By 22:00 it fell back to 297 million, down about 2.7% from the previous hour. This suggests that the open interest increased first and then shrank, but OI does not distinguish between longs and shorts, so you cannot conclude that all newly added positions are longs. The latest settled funding rate at 20:00 was +0.1529% per 4 hours. The next period’s estimate at 22:03 is +0.2062% and is still not settled; the actual number may change. Be mindful of both chasing-cost and adverse price swings.
Don’t miss the risk schedule: Binance’s Oct 1 announcement states that the PUMPBTCUSDT perpetual will be automatically settled and delisted at 17:00 BJT on Oct 5, and starting 16:30 no new non-reducing orders will be accepted. This applies to the contract, not to whether PumpBTC spot tokens are delisted; the announcement also cannot explain the cause of this round of the rally.
I won’t take the #1 ranking or rising OI as confirmation to go long. Going forward, first see whether the full hour can reclaim the prior hour’s close of 0.01039, then watch around 0.01057. If it breaks below 0.00976, the pullback structure of this move is still intact. With it getting close to automatic settlement and the estimated funding rate being on the high side, we should observe risk levels above the impulse to chase.
Data as of 22:03 BJT—only analyzing this perpetual contract; this does not constitute trading or order placement advice.
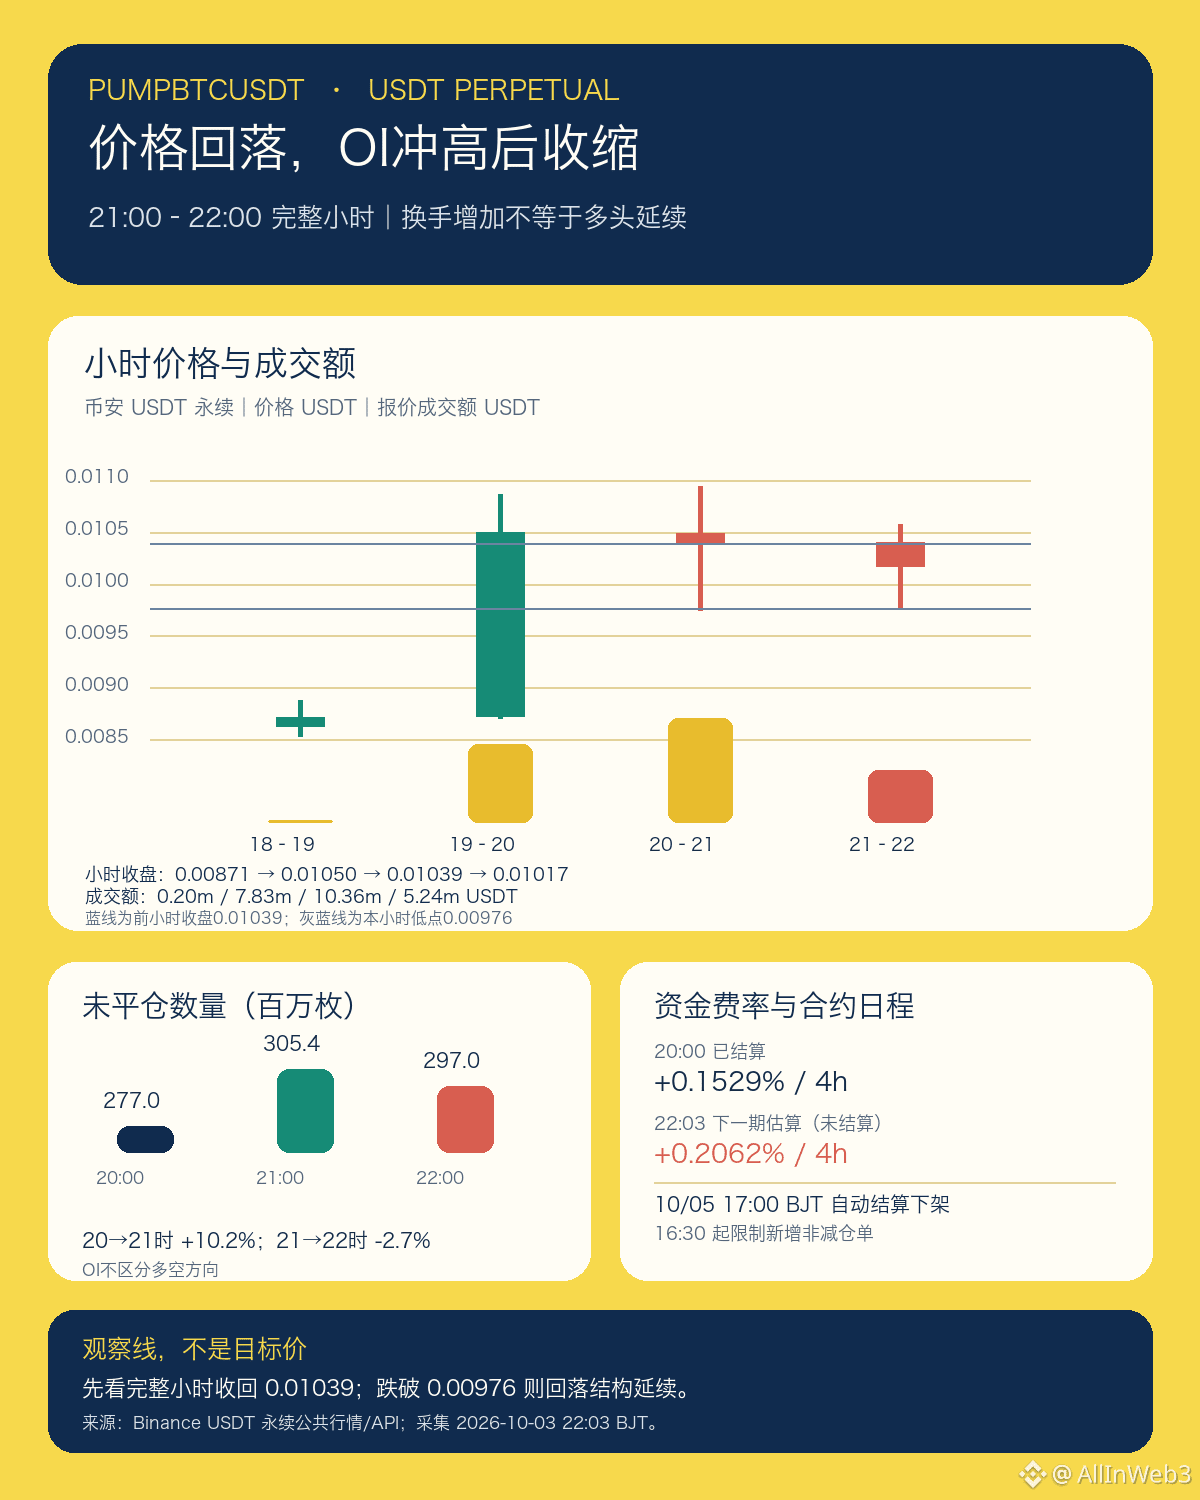
241
·
--
After BTC gave back from $87,220, the previous 16:42 BJT observation was that it stalled at $84,620, below $85,000. Now there is a limited new datapoint: Binance spot BTCUSDT completed the full 20:00–21:00 hour with a close at $84,888.02, up about 0.26% from the 19:00–20:00 close of $84,672.01. The traded notional for that hour was about $32.779 million, which is 2.06x the $15.917 million of the prior hour. The buy-initiated notional accounted for roughly 54.8% of that hour. The hour’s high reached $84,926.47 at 20:00, still $73.53 below $85,000; the gap at the close widened further to $111.98. “Near” does not equal “reclaim.”
This suggests the rebound produced a more actively traded full hour, but the magnitude isn’t large, and the close still did not cross above $85,000. Total turnover comes from two-sided matching; buy-initiated volume reflects the buy-side initiated trade reporting, not net inflow, and cannot by itself prove a trend reversal. With only a single hourly candle, it’s also insufficient to label the bounce as sustained buying.
At 21:35 BJT, the instantaneous price is $84,962.19, about $38 away from $85,000; however, the 21:00 hour is not yet complete, so intraday touches can’t be treated as close-confirmation. The rolling 24-hour range remains $83,888–$87,150, and it’s still about 2.5% below the range high; the 24-hour drop is 2.396%. Compared with the previous entry, the added detail here is the first high-volume rebound hour after the pullback—updating the conditions for observing whether $85,000 can be reclaimed, not rehashing the push up to 87K.
Next, watch whether the full 21:00 hour closes above $85,000, and then whether subsequent pullbacks hold. If the close remains below it, or if it tests the lower edge near $83,888 again, this high-volume rebound will still be only a range-based bounce. The key is validating the conditions, not chasing the target price. Data as of 2026-10-03 21:35 BJT. Source: Binance BTCUSDT spot hourly candles and the 24-hour market report. A rolling 24-hour change is not the same as single-day performance, and this cycle only describes the BTCUSDT spot market—it does not represent the direction of capital flow across the entire market.
After BTC gave back from $87,220, the previous 16:42 BJT observation was that it stalled at $84,620, below $85,000. Now there is a limited new datapoint: Binance spot BTCUSDT completed the full 20:00–21:00 hour with a close at $84,888.02, up about 0.26% from the 19:00–20:00 close of $84,672.01. The traded notional for that hour was about $32.779 million, which is 2.06x the $15.917 million of the prior hour. The buy-initiated notional accounted for roughly 54.8% of that hour. The hour’s high reached $84,926.47 at 20:00, still $73.53 below $85,000; the gap at the close widened further to $111.98. “Near” does not equal “reclaim.”
This suggests the rebound produced a more actively traded full hour, but the magnitude isn’t large, and the close still did not cross above $85,000. Total turnover comes from two-sided matching; buy-initiated volume reflects the buy-side initiated trade reporting, not net inflow, and cannot by itself prove a trend reversal. With only a single hourly candle, it’s also insufficient to label the bounce as sustained buying.
At 21:35 BJT, the instantaneous price is $84,962.19, about $38 away from $85,000; however, the 21:00 hour is not yet complete, so intraday touches can’t be treated as close-confirmation. The rolling 24-hour range remains $83,888–$87,150, and it’s still about 2.5% below the range high; the 24-hour drop is 2.396%. Compared with the previous entry, the added detail here is the first high-volume rebound hour after the pullback—updating the conditions for observing whether $85,000 can be reclaimed, not rehashing the push up to 87K.
Next, watch whether the full 21:00 hour closes above $85,000, and then whether subsequent pullbacks hold. If the close remains below it, or if it tests the lower edge near $83,888 again, this high-volume rebound will still be only a range-based bounce. The key is validating the conditions, not chasing the target price. Data as of 2026-10-03 21:35 BJT. Source: Binance BTCUSDT spot hourly candles and the 24-hour market report. A rolling 24-hour change is not the same as single-day performance, and this cycle only describes the BTCUSDT spot market—it does not represent the direction of capital flow across the entire market.
This suggests the rebound produced a more actively traded full hour, but the magnitude isn’t large, and the close still did not cross above $85,000. Total turnover comes from two-sided matching; buy-initiated volume reflects the buy-side initiated trade reporting, not net inflow, and cannot by itself prove a trend reversal. With only a single hourly candle, it’s also insufficient to label the bounce as sustained buying.
At 21:35 BJT, the instantaneous price is $84,962.19, about $38 away from $85,000; however, the 21:00 hour is not yet complete, so intraday touches can’t be treated as close-confirmation. The rolling 24-hour range remains $83,888–$87,150, and it’s still about 2.5% below the range high; the 24-hour drop is 2.396%. Compared with the previous entry, the added detail here is the first high-volume rebound hour after the pullback—updating the conditions for observing whether $85,000 can be reclaimed, not rehashing the push up to 87K.
Next, watch whether the full 21:00 hour closes above $85,000, and then whether subsequent pullbacks hold. If the close remains below it, or if it tests the lower edge near $83,888 again, this high-volume rebound will still be only a range-based bounce. The key is validating the conditions, not chasing the target price. Data as of 2026-10-03 21:35 BJT. Source: Binance BTCUSDT spot hourly candles and the 24-hour market report. A rolling 24-hour change is not the same as single-day performance, and this cycle only describes the BTCUSDT spot market—it does not represent the direction of capital flow across the entire market.
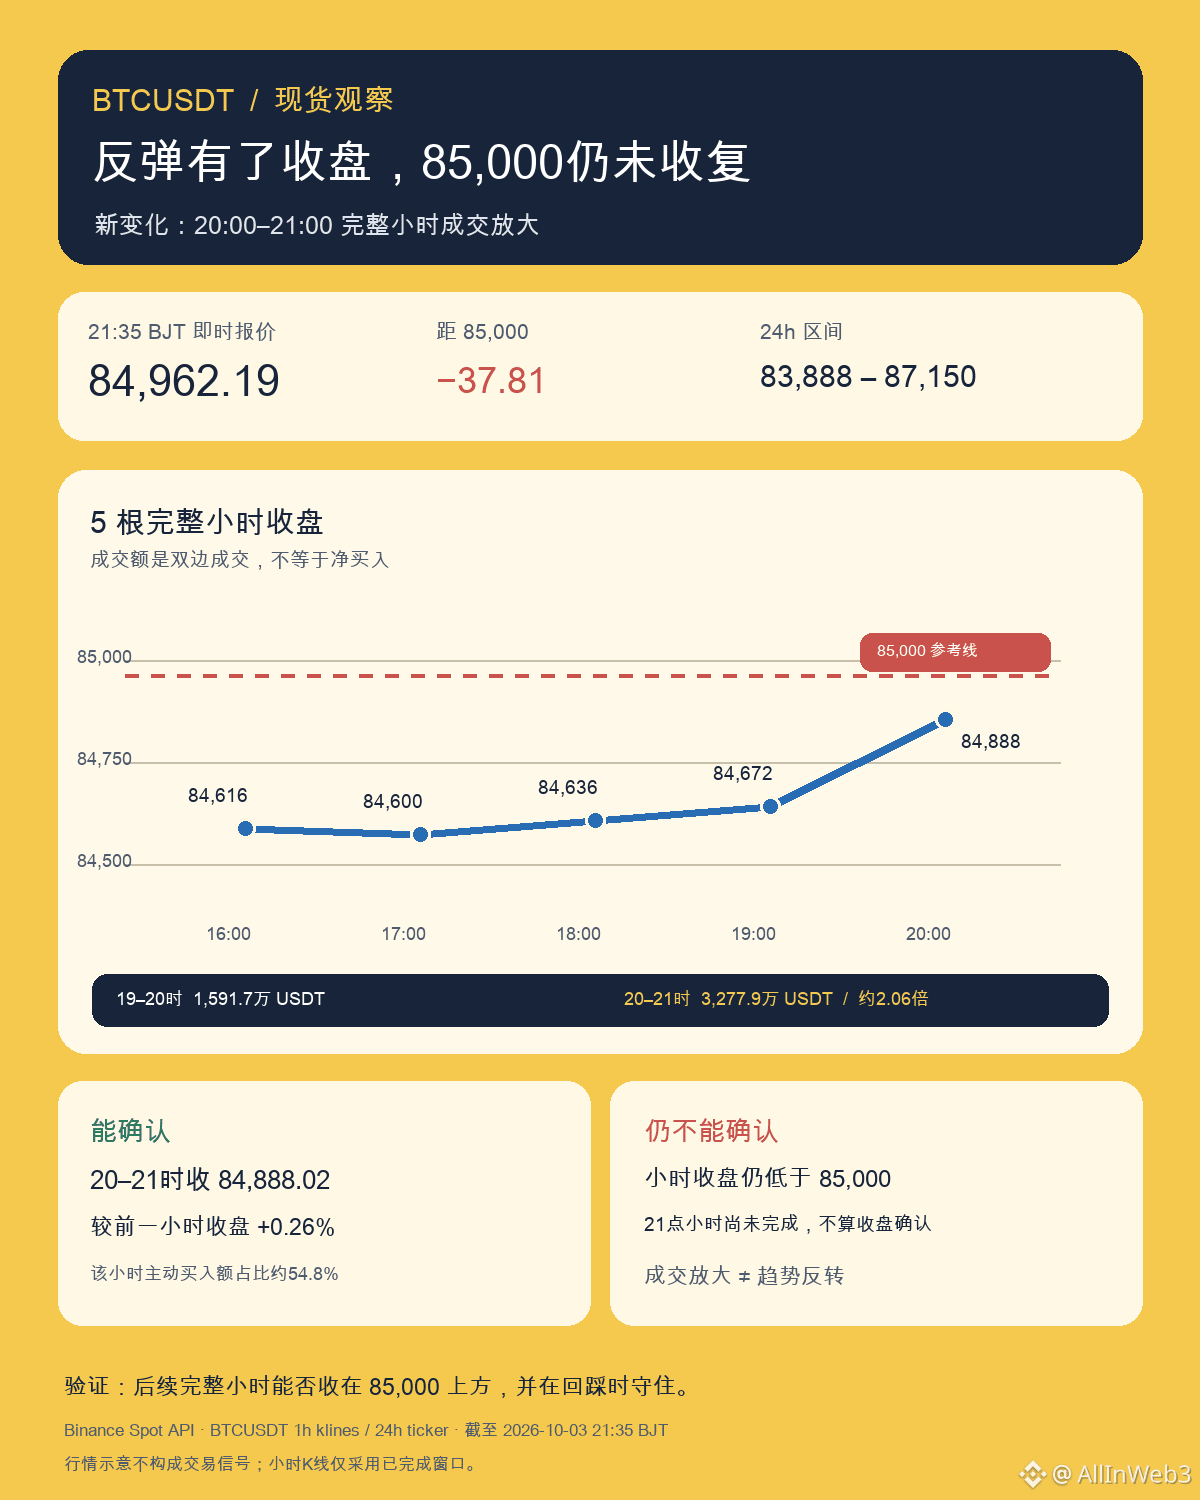
101
·
--
$PUMPBTCUSDT I’m not chasing longs for now: the latest complete hour after heavy trading saw a drop from 0.01094 to 0.01039, without turning the spike into a higher closing price. A full scan of the entire Binance USDT-margined perpetual futures market (covers 526 normal trading contracts) at 21:00 Beijing time shows PUMPBTCUSDT ranked #2 by price increase; over the rolling past 24 hours it is up +26.239%, price at 0.01044, and turnover around $25.276 million. At 21:02 the single-coin ticker updated to 0.01048. The full re-scan at 21:10 still ranks #2; price returns to 0.01017 and the gain falls to +23.123%. The re-scan at 21:13 still ranks #2; quote 0.01010, gain +22.573%. The latest scan at 21:16 still ranks #2; quote 0.01015, gain +22.881%, with rolling turnover about $27.284 million. Different time slices cannot be mixed into one execution price.
The new structure first looks at the complete hour 20:00–21:00: open 0.01049, high 0.01094, low 0.00975, last/close 0.01039, turnover about $10.357 million; active buy value about $5.051 million, accounting for about 48.8% of that hour’s quoted trade turnover. Volume is large, but the close is below the open, and there’s a clear drop from the high—so for now there’s no evidence of sustained buying pressure overwhelming sellers. The previous candle 19:00–20:00 closed at 0.01050; the latest hour did not continue the upside.
The four-hour window also suggests “turnover ≠ breakout”: 16:00–20:00 closed at 0.01050, nearly the same as the prior 12:00–16:00 close, but quoted trading turnover rose from about $8.352 million to $10.583 million, an increase of ~26.7%. Binance’s available OI sample is up to 20:00: from 19:00 to 20:00, open interest increased by about 48%. This only indicates a larger open-interest scale; it cannot tell whether the added positions are longs or shorts. The funding rate for positions settled at 20:00 is +0.1529% per 4 hours; the next period estimated at 21:02 is +0.1914%, not yet settled. Leverage demand looks crowded, so the risk of pullbacks when chasing longs rises accordingly.
Also put the contract schedule alongside: Binance’s Oct 1 announcement states that the PUMPBTCUSDT perpetual will be automatically settled and delisted on Oct 5 at 17:00, and starting from 16:30 it will not accept new orders that are non–position-reducing. This is a contract-processing arrangement; it does not mean the PUMPBTC spot token is delisted simultaneously. The announcement was released earlier than this round of volatility, so it cannot be used to conclude it caused the rise.
Going forward, watch whether price can re-stand above 0.01050 using the complete hour level and stabilize, rather than only spiking intrahour to 0.01094. If it breaks below this hour’s low of 0.00975 again, then the lower boundary of the current range is lost. Both are validation lines, not target prices or guarantees. In the chart, K-line, OI, and funding data are respectively through 21:02 and 20:00; the complete pre-published ranking list is through 21:16 BJT, and the funding-rate estimate is not a settled value. #PUMPBTC
$PUMPBTCUSDT I’m not chasing longs for now: the latest complete hour after heavy trading saw a drop from 0.01094 to 0.01039, without turning the spike into a higher closing price. A full scan of the entire Binance USDT-margined perpetual futures market (covers 526 normal trading contracts) at 21:00 Beijing time shows PUMPBTCUSDT ranked #2 by price increase; over the rolling past 24 hours it is up +26.239%, price at 0.01044, and turnover around $25.276 million. At 21:02 the single-coin ticker updated to 0.01048. The full re-scan at 21:10 still ranks #2; price returns to 0.01017 and the gain falls to +23.123%. The re-scan at 21:13 still ranks #2; quote 0.01010, gain +22.573%. The latest scan at 21:16 still ranks #2; quote 0.01015, gain +22.881%, with rolling turnover about $27.284 million. Different time slices cannot be mixed into one execution price.
The new structure first looks at the complete hour 20:00–21:00: open 0.01049, high 0.01094, low 0.00975, last/close 0.01039, turnover about $10.357 million; active buy value about $5.051 million, accounting for about 48.8% of that hour’s quoted trade turnover. Volume is large, but the close is below the open, and there’s a clear drop from the high—so for now there’s no evidence of sustained buying pressure overwhelming sellers. The previous candle 19:00–20:00 closed at 0.01050; the latest hour did not continue the upside.
The four-hour window also suggests “turnover ≠ breakout”: 16:00–20:00 closed at 0.01050, nearly the same as the prior 12:00–16:00 close, but quoted trading turnover rose from about $8.352 million to $10.583 million, an increase of ~26.7%. Binance’s available OI sample is up to 20:00: from 19:00 to 20:00, open interest increased by about 48%. This only indicates a larger open-interest scale; it cannot tell whether the added positions are longs or shorts. The funding rate for positions settled at 20:00 is +0.1529% per 4 hours; the next period estimated at 21:02 is +0.1914%, not yet settled. Leverage demand looks crowded, so the risk of pullbacks when chasing longs rises accordingly.
Also put the contract schedule alongside: Binance’s Oct 1 announcement states that the PUMPBTCUSDT perpetual will be automatically settled and delisted on Oct 5 at 17:00, and starting from 16:30 it will not accept new orders that are non–position-reducing. This is a contract-processing arrangement; it does not mean the PUMPBTC spot token is delisted simultaneously. The announcement was released earlier than this round of volatility, so it cannot be used to conclude it caused the rise.
Going forward, watch whether price can re-stand above 0.01050 using the complete hour level and stabilize, rather than only spiking intrahour to 0.01094. If it breaks below this hour’s low of 0.00975 again, then the lower boundary of the current range is lost. Both are validation lines, not target prices or guarantees. In the chart, K-line, OI, and funding data are respectively through 21:02 and 20:00; the complete pre-published ranking list is through 21:16 BJT, and the funding-rate estimate is not a settled value. #PUMPBTC
The new structure first looks at the complete hour 20:00–21:00: open 0.01049, high 0.01094, low 0.00975, last/close 0.01039, turnover about $10.357 million; active buy value about $5.051 million, accounting for about 48.8% of that hour’s quoted trade turnover. Volume is large, but the close is below the open, and there’s a clear drop from the high—so for now there’s no evidence of sustained buying pressure overwhelming sellers. The previous candle 19:00–20:00 closed at 0.01050; the latest hour did not continue the upside.
The four-hour window also suggests “turnover ≠ breakout”: 16:00–20:00 closed at 0.01050, nearly the same as the prior 12:00–16:00 close, but quoted trading turnover rose from about $8.352 million to $10.583 million, an increase of ~26.7%. Binance’s available OI sample is up to 20:00: from 19:00 to 20:00, open interest increased by about 48%. This only indicates a larger open-interest scale; it cannot tell whether the added positions are longs or shorts. The funding rate for positions settled at 20:00 is +0.1529% per 4 hours; the next period estimated at 21:02 is +0.1914%, not yet settled. Leverage demand looks crowded, so the risk of pullbacks when chasing longs rises accordingly.
Also put the contract schedule alongside: Binance’s Oct 1 announcement states that the PUMPBTCUSDT perpetual will be automatically settled and delisted on Oct 5 at 17:00, and starting from 16:30 it will not accept new orders that are non–position-reducing. This is a contract-processing arrangement; it does not mean the PUMPBTC spot token is delisted simultaneously. The announcement was released earlier than this round of volatility, so it cannot be used to conclude it caused the rise.
Going forward, watch whether price can re-stand above 0.01050 using the complete hour level and stabilize, rather than only spiking intrahour to 0.01094. If it breaks below this hour’s low of 0.00975 again, then the lower boundary of the current range is lost. Both are validation lines, not target prices or guarantees. In the chart, K-line, OI, and funding data are respectively through 21:02 and 20:00; the complete pre-published ranking list is through 21:16 BJT, and the funding-rate estimate is not a settled value. #PUMPBTC
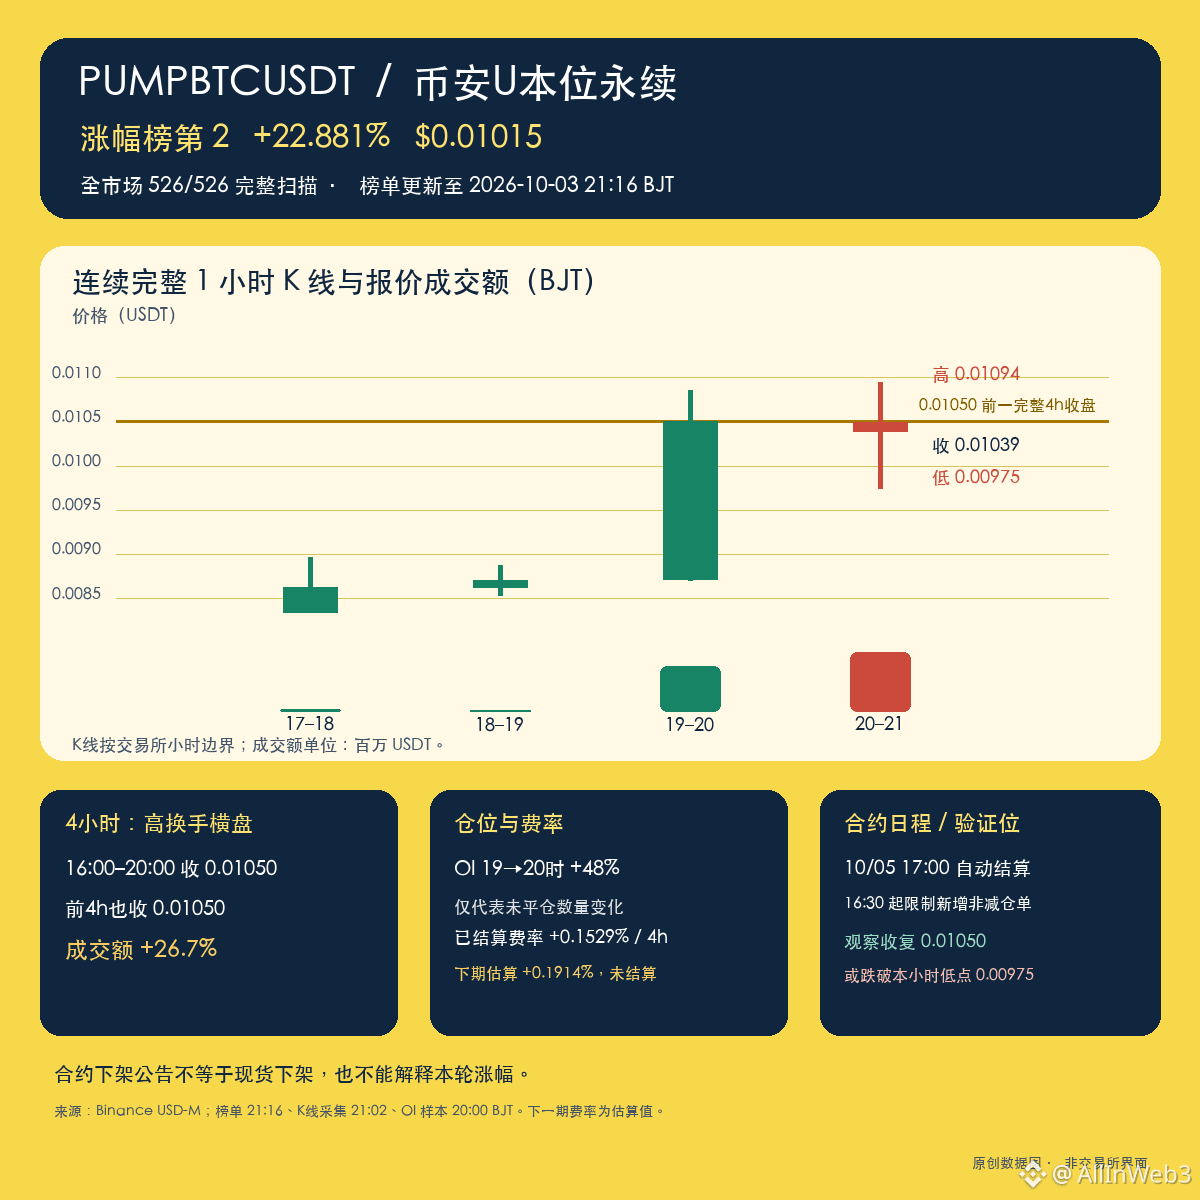
1
293
·
--
There is an important timing boundary in the PEPE ETF topic: Canary’s filing is a registration statement amendment, not SEC approval for the product to begin trading. The SEC EDGAR filing history shows that the Canary PEPE ETF submitted its initial S-1 on April 8, 2026. The latest S-1/A was dated October 2 (ET). The amendment was received at 21:12:55 ET on October 2, which converts to 09:12:55 Beijing time on October 3—about 11 hours before this round of the leaderboard.
The amended text still lists the proposed exchange as Cboe BZX, leaves the trading ticker blank, and states that there was previously no publicly traded version of that share class. It describes a proposed trust that would hold PEPE and be valued based on the CoinDesk benchmark. The filing also lists BitGo as the digital asset custodian. In other words, the incremental filing updates the issuer’s registration materials, but it does not demonstrate that the SEC has declared the registration effective, that the exchange has completed the listing process, or that investors can already buy shares.
This increment is tied to a new S-1/A registration checkpoint that appeared on October 2. Readers should next track three things separately: when the subsequent registration statement becomes effective, whether the exchange listing arrangements have been completed, and whether the ticker and the official start-of-trading date are published. If any one of these is missing, you cannot write “the ETF has been listed” based on a “submitted filing.”
If the product ultimately issues in the structure described by the filing, it would provide an indirect securities exposure to the PEPE price, and would still be affected by token volatility, benchmark pricing, and custody and trust fees. Holding shares is not the same as directly holding on-chain PEPE. At this stage, there is no basis from this amendment filing to infer new PEPE spot buy orders or to determine an exact listing date. #PEPE #ETF
Also note that shares are not the same asset as the token. If the trust is issued, holders buy and sell securities shares, and the designed price-tracking mechanism will be influenced by fees and by any market discount/premium. The on-chain PEPE spot price would still be set by the exchange and the wallet market. Even if the filing continues to move forward, you still cannot treat the expected fund holdings as PEPE purchases that have already happened. For this news, the most reliable follow-up confirmation is not social media speculation, but the SEC’s subsequent effectiveness order, the exchange’s official listing notification, and the issuer’s clearly stated ticker/date.
There is an important timing boundary in the PEPE ETF topic: Canary’s filing is a registration statement amendment, not SEC approval for the product to begin trading. The SEC EDGAR filing history shows that the Canary PEPE ETF submitted its initial S-1 on April 8, 2026. The latest S-1/A was dated October 2 (ET). The amendment was received at 21:12:55 ET on October 2, which converts to 09:12:55 Beijing time on October 3—about 11 hours before this round of the leaderboard.
The amended text still lists the proposed exchange as Cboe BZX, leaves the trading ticker blank, and states that there was previously no publicly traded version of that share class. It describes a proposed trust that would hold PEPE and be valued based on the CoinDesk benchmark. The filing also lists BitGo as the digital asset custodian. In other words, the incremental filing updates the issuer’s registration materials, but it does not demonstrate that the SEC has declared the registration effective, that the exchange has completed the listing process, or that investors can already buy shares.
This increment is tied to a new S-1/A registration checkpoint that appeared on October 2. Readers should next track three things separately: when the subsequent registration statement becomes effective, whether the exchange listing arrangements have been completed, and whether the ticker and the official start-of-trading date are published. If any one of these is missing, you cannot write “the ETF has been listed” based on a “submitted filing.”
If the product ultimately issues in the structure described by the filing, it would provide an indirect securities exposure to the PEPE price, and would still be affected by token volatility, benchmark pricing, and custody and trust fees. Holding shares is not the same as directly holding on-chain PEPE. At this stage, there is no basis from this amendment filing to infer new PEPE spot buy orders or to determine an exact listing date. #PEPE #ETF
Also note that shares are not the same asset as the token. If the trust is issued, holders buy and sell securities shares, and the designed price-tracking mechanism will be influenced by fees and by any market discount/premium. The on-chain PEPE spot price would still be set by the exchange and the wallet market. Even if the filing continues to move forward, you still cannot treat the expected fund holdings as PEPE purchases that have already happened. For this news, the most reliable follow-up confirmation is not social media speculation, but the SEC’s subsequent effectiveness order, the exchange’s official listing notification, and the issuer’s clearly stated ticker/date.
The amended text still lists the proposed exchange as Cboe BZX, leaves the trading ticker blank, and states that there was previously no publicly traded version of that share class. It describes a proposed trust that would hold PEPE and be valued based on the CoinDesk benchmark. The filing also lists BitGo as the digital asset custodian. In other words, the incremental filing updates the issuer’s registration materials, but it does not demonstrate that the SEC has declared the registration effective, that the exchange has completed the listing process, or that investors can already buy shares.
This increment is tied to a new S-1/A registration checkpoint that appeared on October 2. Readers should next track three things separately: when the subsequent registration statement becomes effective, whether the exchange listing arrangements have been completed, and whether the ticker and the official start-of-trading date are published. If any one of these is missing, you cannot write “the ETF has been listed” based on a “submitted filing.”
If the product ultimately issues in the structure described by the filing, it would provide an indirect securities exposure to the PEPE price, and would still be affected by token volatility, benchmark pricing, and custody and trust fees. Holding shares is not the same as directly holding on-chain PEPE. At this stage, there is no basis from this amendment filing to infer new PEPE spot buy orders or to determine an exact listing date. #PEPE #ETF
Also note that shares are not the same asset as the token. If the trust is issued, holders buy and sell securities shares, and the designed price-tracking mechanism will be influenced by fees and by any market discount/premium. The on-chain PEPE spot price would still be set by the exchange and the wallet market. Even if the filing continues to move forward, you still cannot treat the expected fund holdings as PEPE purchases that have already happened. For this news, the most reliable follow-up confirmation is not social media speculation, but the SEC’s subsequent effectiveness order, the exchange’s official listing notification, and the issuer’s clearly stated ticker/date.
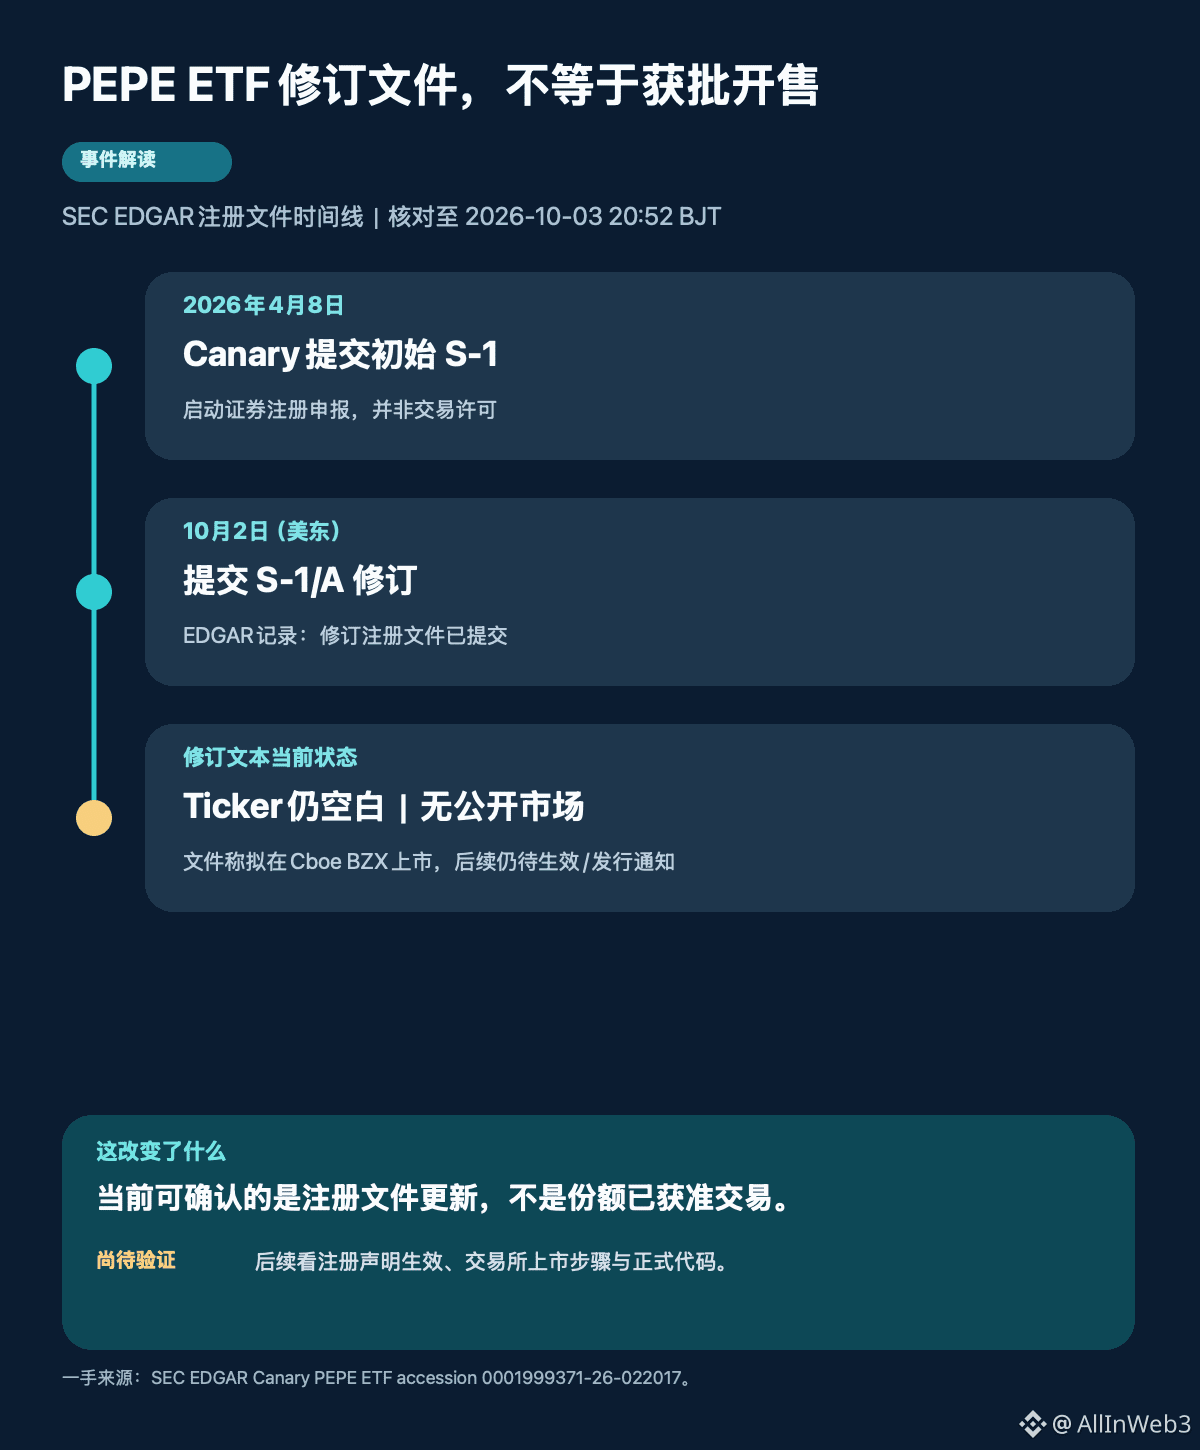
109
·
--
$NVDA hot-list posts “records broken, up 2.4%”—separate the intraday move from the close first. Nasdaq’s official historical quotes show that on October 2, 2026 (Friday), NVDA opened at $236.055, hit an intraday high of $237.88 and a low of $233.60, and closed at $233.95; the close on October 1 was $230.86. Therefore, Friday’s close rose by about 1.34% versus the prior close, not 2.4%; the 2.4% figure is closer to the intraday gain. The day’s trading volume was about 135.2 million shares.
This set of data can confirm the intraday high that day, but it cannot independently prove “a new all-time high.” The Nasdaq page shows a 52-week range upper bound of $236.54, with the page’s quote marked as of October 1; that figure is below October 2’s intraday high, but it is not the fully updated range statistics. To avoid treating the hot-list headline as evidence, this article only says “touched $237.88 intraday,” and does not write the entire historical record as independently verified. The fact that price topped out intraday and still closed at $233.95 also shows that the high point and the day’s closing position are not the same thing.
In the past ~24 hours, this account published reports on NVIDIA’s collaboration with OpenAI/Cerebras on compute; that discussion was about infrastructure news and the boundaries of its evidence—not this stock’s price path. What’s added here is daily OHLC and volume cross-checking, along with a breakdown of the hot-list “+2.4%/record” framing.
NVDA is a stock, not a crypto asset. Even if AI stocks are strong, whether RENDER, FET, or TAO move in sync still depends on each one’s on-chain demand, liquidity, and price structure; a single day’s stock action cannot prove capital inflows into AI tokens, nor does it constitute a buy signal. Data is as of the Nasdaq close on October 2.#NVDA #AI
Volume is also worth placing in the right context: on October 2, it was about 135.2 million shares, higher than the prior trading day’s ~98.59 million, an increase of roughly 37%. This indicates more active trading that day, but volume alone cannot confirm that a breakout is valid; the closing price was still below the day’s opening at $236.055. If later discussions ask whether it “holds after making new highs,” at minimum you should look at whether closes in the following trading days can stay above/within the breakout area, and you cannot treat a single intraday high as trend confirmation.
$NVDA hot-list posts “records broken, up 2.4%”—separate the intraday move from the close first. Nasdaq’s official historical quotes show that on October 2, 2026 (Friday), NVDA opened at $236.055, hit an intraday high of $237.88 and a low of $233.60, and closed at $233.95; the close on October 1 was $230.86. Therefore, Friday’s close rose by about 1.34% versus the prior close, not 2.4%; the 2.4% figure is closer to the intraday gain. The day’s trading volume was about 135.2 million shares.
This set of data can confirm the intraday high that day, but it cannot independently prove “a new all-time high.” The Nasdaq page shows a 52-week range upper bound of $236.54, with the page’s quote marked as of October 1; that figure is below October 2’s intraday high, but it is not the fully updated range statistics. To avoid treating the hot-list headline as evidence, this article only says “touched $237.88 intraday,” and does not write the entire historical record as independently verified. The fact that price topped out intraday and still closed at $233.95 also shows that the high point and the day’s closing position are not the same thing.
In the past ~24 hours, this account published reports on NVIDIA’s collaboration with OpenAI/Cerebras on compute; that discussion was about infrastructure news and the boundaries of its evidence—not this stock’s price path. What’s added here is daily OHLC and volume cross-checking, along with a breakdown of the hot-list “+2.4%/record” framing.
NVDA is a stock, not a crypto asset. Even if AI stocks are strong, whether RENDER, FET, or TAO move in sync still depends on each one’s on-chain demand, liquidity, and price structure; a single day’s stock action cannot prove capital inflows into AI tokens, nor does it constitute a buy signal. Data is as of the Nasdaq close on October 2.#NVDA #AI
Volume is also worth placing in the right context: on October 2, it was about 135.2 million shares, higher than the prior trading day’s ~98.59 million, an increase of roughly 37%. This indicates more active trading that day, but volume alone cannot confirm that a breakout is valid; the closing price was still below the day’s opening at $236.055. If later discussions ask whether it “holds after making new highs,” at minimum you should look at whether closes in the following trading days can stay above/within the breakout area, and you cannot treat a single intraday high as trend confirmation.
This set of data can confirm the intraday high that day, but it cannot independently prove “a new all-time high.” The Nasdaq page shows a 52-week range upper bound of $236.54, with the page’s quote marked as of October 1; that figure is below October 2’s intraday high, but it is not the fully updated range statistics. To avoid treating the hot-list headline as evidence, this article only says “touched $237.88 intraday,” and does not write the entire historical record as independently verified. The fact that price topped out intraday and still closed at $233.95 also shows that the high point and the day’s closing position are not the same thing.
In the past ~24 hours, this account published reports on NVIDIA’s collaboration with OpenAI/Cerebras on compute; that discussion was about infrastructure news and the boundaries of its evidence—not this stock’s price path. What’s added here is daily OHLC and volume cross-checking, along with a breakdown of the hot-list “+2.4%/record” framing.
NVDA is a stock, not a crypto asset. Even if AI stocks are strong, whether RENDER, FET, or TAO move in sync still depends on each one’s on-chain demand, liquidity, and price structure; a single day’s stock action cannot prove capital inflows into AI tokens, nor does it constitute a buy signal. Data is as of the Nasdaq close on October 2.#NVDA #AI
Volume is also worth placing in the right context: on October 2, it was about 135.2 million shares, higher than the prior trading day’s ~98.59 million, an increase of roughly 37%. This indicates more active trading that day, but volume alone cannot confirm that a breakout is valid; the closing price was still below the day’s opening at $236.055. If later discussions ask whether it “holds after making new highs,” at minimum you should look at whether closes in the following trading days can stay above/within the breakout area, and you cannot treat a single intraday high as trend confirmation.
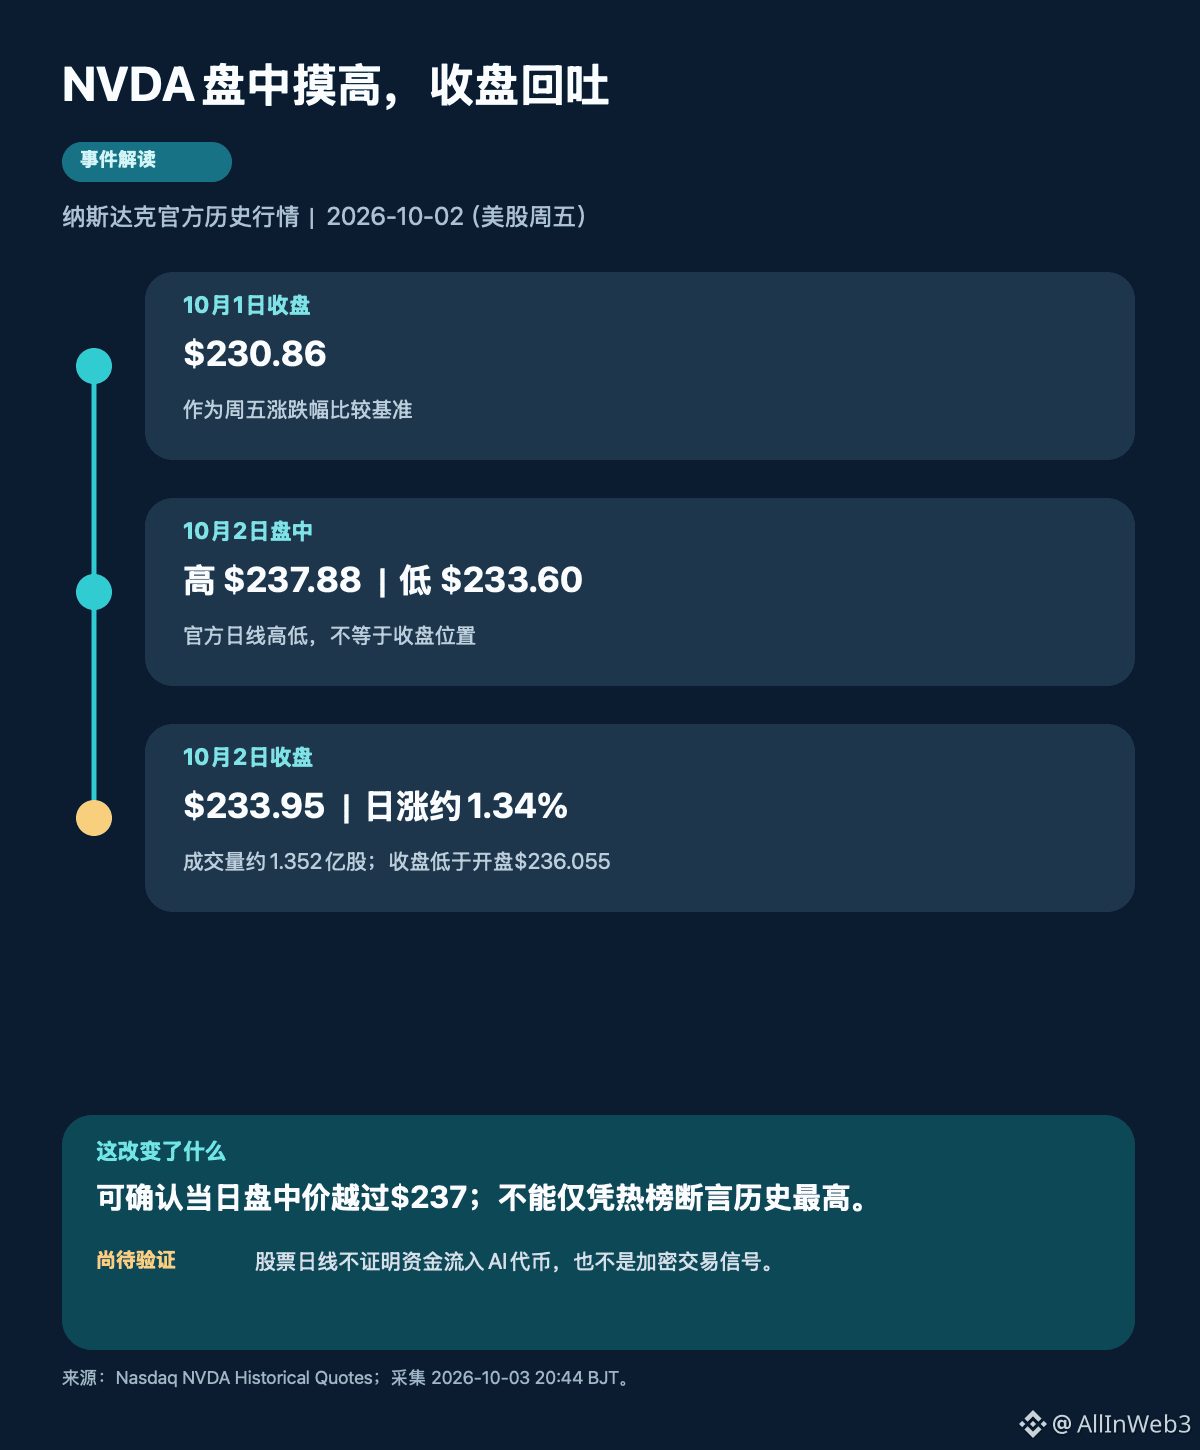
28
·
--
A report says Lukoil’s “multi-billion-dollar deal” involving overseas assets has entered U.S.-Russia negotiations, but the report does not mean approval has been granted, nor does it mean the deal has been closed. On October 3, Reuters, citing The New York Times, said that the U.S.-Russia talks involve a potential transaction that is contingent upon approval by the U.S. government and the Kremlin; as of the time of the report, the White House, the U.S. Treasury, and Lukoil had not responded. The buyer’s arrangements and negotiation details are still media-reported statements from sources, and cannot be written as already-signed facts.
The key boundary in this matter lies in sanctions licensing. Lukoil announced as early as October 27, 2025, that, due to restrictions implemented by some countries, it planned to sell its international assets and began considering potential buyer offers. OFAC’s FAQ 1224, updated on September 18, explains that General License 131J allows negotiations, due diligence, and signing conditional contracts related to the sale of Lukoil International GmbH and its majority-owned subsidiaries, with a deadline of October 22, 2026; however, it clearly does not authorize the actual sale, disposition, or transfer of assets. Any contract would require additional OFAC authorization.
So what’s new today is the reporting thread that “the deal topic has entered U.S.-Russia talks,” not that the sanctions gate is already open. Even if negotiations continue, it still depends on whether OFAC approves it, whether the transaction structure can sever the relationship between LIG and Lukoil, and how the sale proceeds are handled under the sanctions framework. Prior deal offers or buyer rumors cannot replace these conditions.
Next, three verifiable milestones should be monitored: whether the U.S. and Russia sides officially confirm the subject; whether OFAC issues authorization for the specific transaction; and whether Lukoil or the buyer announces the signing and closing. The three represent negotiations, regulatory licensing, and deal completion, respectively, and must not be conflated. For the oil market, even if the news is true, the impact chain is not simply that “the supply changes because assets are sold.” It also depends on the scope of the assets, operational continuity, the buyer’s control, how sale proceeds are frozen or handled, and the sanctions authorizations. Lukoil’s announcement confirms an intention to sell; OFAC documents define the limits of the license; and media reports provide negotiation leads, with different evidentiary standards. At present, there is not enough basis to judge when the transaction will be completed, nor can this be used to infer any one-directional trend in oil prices or related assets. #Lukoil #sanctions
A report says Lukoil’s “multi-billion-dollar deal” involving overseas assets has entered U.S.-Russia negotiations, but the report does not mean approval has been granted, nor does it mean the deal has been closed. On October 3, Reuters, citing The New York Times, said that the U.S.-Russia talks involve a potential transaction that is contingent upon approval by the U.S. government and the Kremlin; as of the time of the report, the White House, the U.S. Treasury, and Lukoil had not responded. The buyer’s arrangements and negotiation details are still media-reported statements from sources, and cannot be written as already-signed facts.
The key boundary in this matter lies in sanctions licensing. Lukoil announced as early as October 27, 2025, that, due to restrictions implemented by some countries, it planned to sell its international assets and began considering potential buyer offers. OFAC’s FAQ 1224, updated on September 18, explains that General License 131J allows negotiations, due diligence, and signing conditional contracts related to the sale of Lukoil International GmbH and its majority-owned subsidiaries, with a deadline of October 22, 2026; however, it clearly does not authorize the actual sale, disposition, or transfer of assets. Any contract would require additional OFAC authorization.
So what’s new today is the reporting thread that “the deal topic has entered U.S.-Russia talks,” not that the sanctions gate is already open. Even if negotiations continue, it still depends on whether OFAC approves it, whether the transaction structure can sever the relationship between LIG and Lukoil, and how the sale proceeds are handled under the sanctions framework. Prior deal offers or buyer rumors cannot replace these conditions.
Next, three verifiable milestones should be monitored: whether the U.S. and Russia sides officially confirm the subject; whether OFAC issues authorization for the specific transaction; and whether Lukoil or the buyer announces the signing and closing. The three represent negotiations, regulatory licensing, and deal completion, respectively, and must not be conflated. For the oil market, even if the news is true, the impact chain is not simply that “the supply changes because assets are sold.” It also depends on the scope of the assets, operational continuity, the buyer’s control, how sale proceeds are frozen or handled, and the sanctions authorizations. Lukoil’s announcement confirms an intention to sell; OFAC documents define the limits of the license; and media reports provide negotiation leads, with different evidentiary standards. At present, there is not enough basis to judge when the transaction will be completed, nor can this be used to infer any one-directional trend in oil prices or related assets. #Lukoil #sanctions
The key boundary in this matter lies in sanctions licensing. Lukoil announced as early as October 27, 2025, that, due to restrictions implemented by some countries, it planned to sell its international assets and began considering potential buyer offers. OFAC’s FAQ 1224, updated on September 18, explains that General License 131J allows negotiations, due diligence, and signing conditional contracts related to the sale of Lukoil International GmbH and its majority-owned subsidiaries, with a deadline of October 22, 2026; however, it clearly does not authorize the actual sale, disposition, or transfer of assets. Any contract would require additional OFAC authorization.
So what’s new today is the reporting thread that “the deal topic has entered U.S.-Russia talks,” not that the sanctions gate is already open. Even if negotiations continue, it still depends on whether OFAC approves it, whether the transaction structure can sever the relationship between LIG and Lukoil, and how the sale proceeds are handled under the sanctions framework. Prior deal offers or buyer rumors cannot replace these conditions.
Next, three verifiable milestones should be monitored: whether the U.S. and Russia sides officially confirm the subject; whether OFAC issues authorization for the specific transaction; and whether Lukoil or the buyer announces the signing and closing. The three represent negotiations, regulatory licensing, and deal completion, respectively, and must not be conflated. For the oil market, even if the news is true, the impact chain is not simply that “the supply changes because assets are sold.” It also depends on the scope of the assets, operational continuity, the buyer’s control, how sale proceeds are frozen or handled, and the sanctions authorizations. Lukoil’s announcement confirms an intention to sell; OFAC documents define the limits of the license; and media reports provide negotiation leads, with different evidentiary standards. At present, there is not enough basis to judge when the transaction will be completed, nor can this be used to infer any one-directional trend in oil prices or related assets. #Lukoil #sanctions
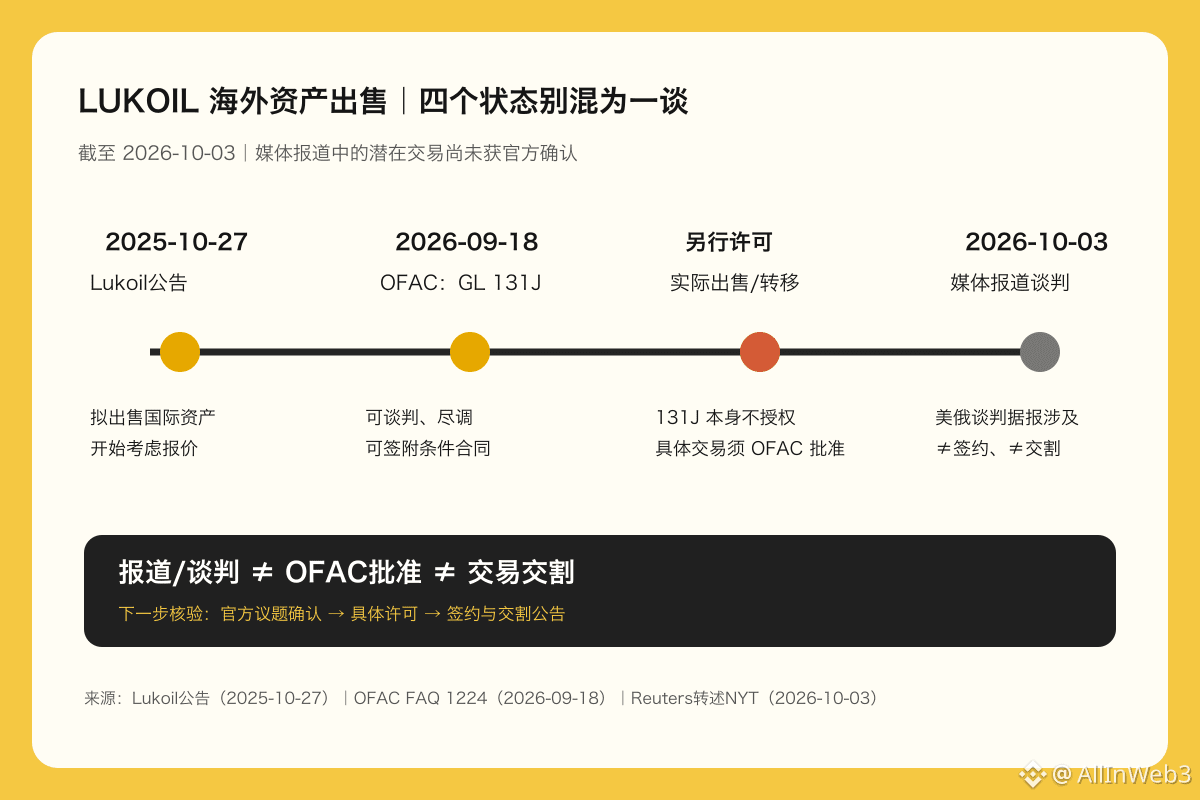
21
·
--
$VELVET squeezes into Binance’s top gainers list at #2. After a short-term pullback, it shows signs of repair, but we still can’t write it as a trend reversal. From my observation, I’m not going to chase longs.
At 19:09 Beijing time on October 3, Binance completed a full scan of 526 USDT perpetual contracts within the specified range. VELVETUSDT’s rolling 24-hour gain is +27.391%, the collection price is 0.08097, ranking #2. At 19:05, the single-coin market price is about 0.08112. Both time points are roughly 15% below the 24-hour high of 0.09569.
The ranking reflects the intensity of the move, not a long signal.
Compared with the previous observation at 17:07 on this account, the incremental update lies in two newly formed complete hourly candles. From 17:00 to 18:00, it opened at 0.08032, surged to 0.08268, then pulled back to close at 0.07620, with trades of about 7.157 million USDT. From 18:00 to 19:00, it dipped to a low of 0.07367, then recovered and closed at 0.08147. Over that single hour, the price rose about 6.93% from the open, and volume was about 8.001 million USDT—roughly 11.8% more than the prior hour. This suggests dip-side bids pulled the price back, but the close still hasn’t broken above the earlier hourly high at 0.08268. A single rebound candle can’t prove that selling pressure has ended.
Positioning and funding-rate boundaries also need to be considered. Binance’s 1-hour position-size sample increased from about 79.14 million coins at 18:00 to about 81.88 million at 19:00—up about 3.47%. OI growth only indicates that open positions have expanded; it doesn’t necessarily mean net long inflows. The most recently settled funding rate is +0.006532%, while the estimated next funding rate is about +0.016903%. The estimated value will change; a positive funding rate means the long side pays the funding cost and cannot be taken as confirmation of an upside move.
Structurally: the most recent four-hour candles from 12:00 to 16:00 closed at 0.07489, with a low at 0.06707. The current 16:00 to 20:00 four-hour candle hasn’t finished yet. The latest update currently visible on the project’s official blog is product integration information dated September 29. I haven’t found a new announcement that can be verified as the direct cause of this round of volatility, and the timing sequence alone can’t establish causality.
Next, we’ll first see whether a full hourly candle can stand above 0.08268. Then we’ll observe whether the reference four-hour high near 0.08398 is reclaimed and whether pullbacks have follow-through. If it falls back below 0.07367, then this repair must be downgraded. For now, it’s more suitable to wait for confirmation rather than chase longs based on the leaderboard. After changes in price, ranking, and unsettled funding rate, the observation points above must be recalculated. The market structure and position snapshot were collected at 19:05 on October 3; the full leaderboard was rechecked at 19:09 before publication. Data comes from Binance’s publicly available USD-M API.
$VELVET squeezes into Binance’s top gainers list at #2. After a short-term pullback, it shows signs of repair, but we still can’t write it as a trend reversal. From my observation, I’m not going to chase longs.
At 19:09 Beijing time on October 3, Binance completed a full scan of 526 USDT perpetual contracts within the specified range. VELVETUSDT’s rolling 24-hour gain is +27.391%, the collection price is 0.08097, ranking #2. At 19:05, the single-coin market price is about 0.08112. Both time points are roughly 15% below the 24-hour high of 0.09569.
The ranking reflects the intensity of the move, not a long signal.
Compared with the previous observation at 17:07 on this account, the incremental update lies in two newly formed complete hourly candles. From 17:00 to 18:00, it opened at 0.08032, surged to 0.08268, then pulled back to close at 0.07620, with trades of about 7.157 million USDT. From 18:00 to 19:00, it dipped to a low of 0.07367, then recovered and closed at 0.08147. Over that single hour, the price rose about 6.93% from the open, and volume was about 8.001 million USDT—roughly 11.8% more than the prior hour. This suggests dip-side bids pulled the price back, but the close still hasn’t broken above the earlier hourly high at 0.08268. A single rebound candle can’t prove that selling pressure has ended.
Positioning and funding-rate boundaries also need to be considered. Binance’s 1-hour position-size sample increased from about 79.14 million coins at 18:00 to about 81.88 million at 19:00—up about 3.47%. OI growth only indicates that open positions have expanded; it doesn’t necessarily mean net long inflows. The most recently settled funding rate is +0.006532%, while the estimated next funding rate is about +0.016903%. The estimated value will change; a positive funding rate means the long side pays the funding cost and cannot be taken as confirmation of an upside move.
Structurally: the most recent four-hour candles from 12:00 to 16:00 closed at 0.07489, with a low at 0.06707. The current 16:00 to 20:00 four-hour candle hasn’t finished yet. The latest update currently visible on the project’s official blog is product integration information dated September 29. I haven’t found a new announcement that can be verified as the direct cause of this round of volatility, and the timing sequence alone can’t establish causality.
Next, we’ll first see whether a full hourly candle can stand above 0.08268. Then we’ll observe whether the reference four-hour high near 0.08398 is reclaimed and whether pullbacks have follow-through. If it falls back below 0.07367, then this repair must be downgraded. For now, it’s more suitable to wait for confirmation rather than chase longs based on the leaderboard. After changes in price, ranking, and unsettled funding rate, the observation points above must be recalculated. The market structure and position snapshot were collected at 19:05 on October 3; the full leaderboard was rechecked at 19:09 before publication. Data comes from Binance’s publicly available USD-M API.
At 19:09 Beijing time on October 3, Binance completed a full scan of 526 USDT perpetual contracts within the specified range. VELVETUSDT’s rolling 24-hour gain is +27.391%, the collection price is 0.08097, ranking #2. At 19:05, the single-coin market price is about 0.08112. Both time points are roughly 15% below the 24-hour high of 0.09569.
The ranking reflects the intensity of the move, not a long signal.
Compared with the previous observation at 17:07 on this account, the incremental update lies in two newly formed complete hourly candles. From 17:00 to 18:00, it opened at 0.08032, surged to 0.08268, then pulled back to close at 0.07620, with trades of about 7.157 million USDT. From 18:00 to 19:00, it dipped to a low of 0.07367, then recovered and closed at 0.08147. Over that single hour, the price rose about 6.93% from the open, and volume was about 8.001 million USDT—roughly 11.8% more than the prior hour. This suggests dip-side bids pulled the price back, but the close still hasn’t broken above the earlier hourly high at 0.08268. A single rebound candle can’t prove that selling pressure has ended.
Positioning and funding-rate boundaries also need to be considered. Binance’s 1-hour position-size sample increased from about 79.14 million coins at 18:00 to about 81.88 million at 19:00—up about 3.47%. OI growth only indicates that open positions have expanded; it doesn’t necessarily mean net long inflows. The most recently settled funding rate is +0.006532%, while the estimated next funding rate is about +0.016903%. The estimated value will change; a positive funding rate means the long side pays the funding cost and cannot be taken as confirmation of an upside move.
Structurally: the most recent four-hour candles from 12:00 to 16:00 closed at 0.07489, with a low at 0.06707. The current 16:00 to 20:00 four-hour candle hasn’t finished yet. The latest update currently visible on the project’s official blog is product integration information dated September 29. I haven’t found a new announcement that can be verified as the direct cause of this round of volatility, and the timing sequence alone can’t establish causality.
Next, we’ll first see whether a full hourly candle can stand above 0.08268. Then we’ll observe whether the reference four-hour high near 0.08398 is reclaimed and whether pullbacks have follow-through. If it falls back below 0.07367, then this repair must be downgraded. For now, it’s more suitable to wait for confirmation rather than chase longs based on the leaderboard. After changes in price, ranking, and unsettled funding rate, the observation points above must be recalculated. The market structure and position snapshot were collected at 19:05 on October 3; the full leaderboard was rechecked at 19:09 before publication. Data comes from Binance’s publicly available USD-M API.
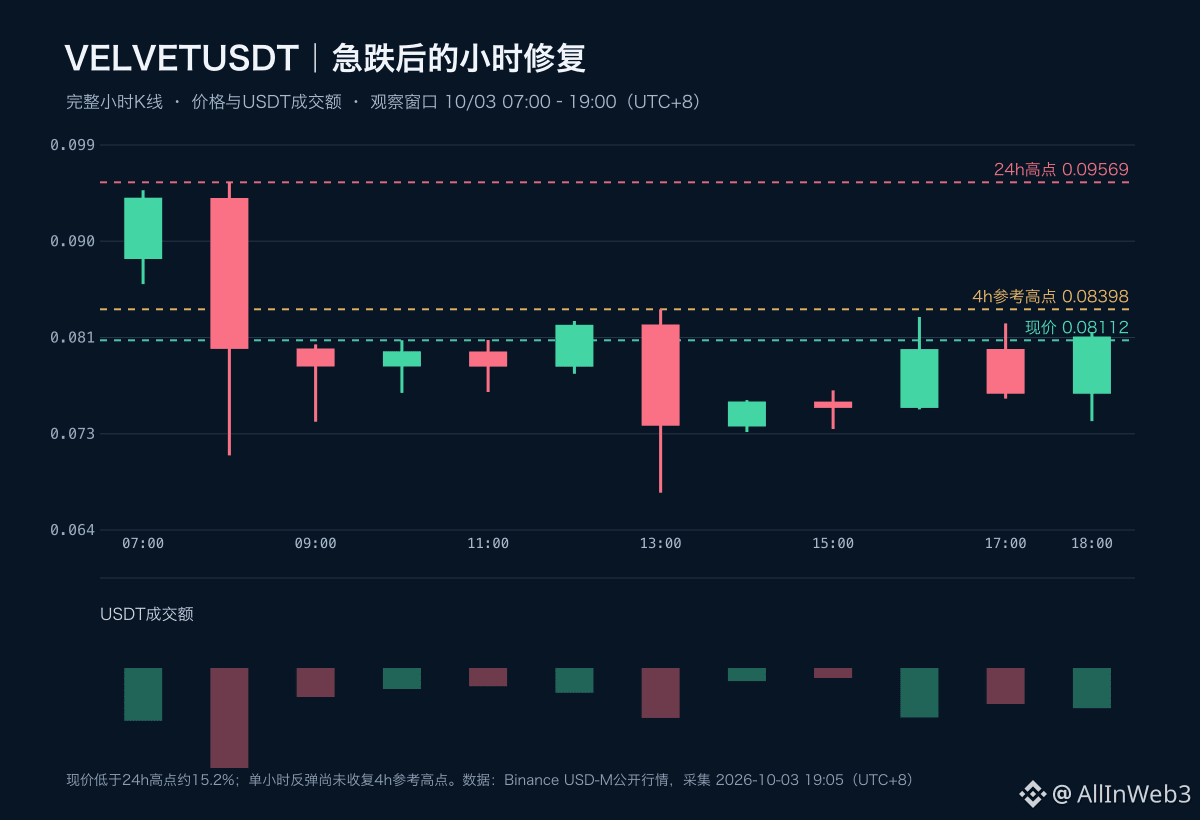
26
·
--
$SAND bounced back and then fell again; I won’t chase it for now. The key is whether the repair can achieve a full close and confirmed trading volume, not whether it is still listed near the front of the gainers.
At 18:14 Beijing time, a full scan covering 526/526 Binance USDT perpetuals shows SANDUSDT ranked #2, with a rolling 24-hour gain of +22.602% and a price of 0.07529; trading volume is about $1.349 billion. At 18:03 the single-coin quote was 0.07704; about 11 minutes later, the scan price was down 2.3%. The rolling gain is affected by the moving 24-hour window, so it can’t be treated as the actual drop over that period. Compared with the scan price of 0.08165 cited in this account’s 13:13 prior post, the scan has pulled back about 7.8%. The latest full hour from 17:00 to 18:00 closed at 0.07636, about 5.4% lower than the 12:00–13:00 close of 0.08070 in the prior post. The rolling 24-hour trading volume is up about 11% versus the prior post, but the flow is mixed active buying and selling, so it can’t be considered net buying.
The hourly path isn’t a one-way decline: the close fell from 0.07987 at 13:00 to 0.07346 at 17:00, then rebounded to 0.07636 from 17:00 to 18:00. However, the rebound hour’s trading volume was about $48.12 million, down about 27.7% from roughly $66.60 million in the prior hour. 0.07222 hasn’t yet been broken by a full hourly close, but the current price at 18:14 is already below the previous hour’s close. The 18:00–19:00 hour isn’t finished yet, so this is only a “in-the-moment” condition on the chart. The reference level from the prior post, 0.07754, is still below it; you can’t call an intrahour brief reclaim the “recovery” of a level that hasn’t closed.
Positioning and fee rates haven’t been given with a clear direction. The hourly OI sample fell from about 448 million coins at 13:00 to about 440 million at 18:00—down around 1.8% net—with a drop first and then a rebound in between. OI doesn’t distinguish long vs short. The funding rate that was settled at 16:00 is -0.4794%; the 00:00 interface forecast for the next period is about -0.2472%, and it hasn’t been settled yet. A negative funding rate means the shorts pay to longs in that period; it doesn’t mean shorts are crowded or a squeeze is imminent.
Coinone and Bithumb lifted the SAND trading warning and resumed deposits/withdrawals on October 2. That is confirmed background already verified in the prior post, not new news for this wave. I didn’t find any explanation for these particular new candles in the hourly chart. Next, we’ll see whether a full hourly close can reclaim 0.07754 alongside an increase in trading volume, and whether 0.07222 can hold near that level. If rebound volume continues to contract or if a full hourly close breaks below the low, then the “repair” assessment should be downgraded. The market moves fast; after 18:14, the evaluation needs to be recalculated with the new data. #SAND
$SAND bounced back and then fell again; I won’t chase it for now. The key is whether the repair can achieve a full close and confirmed trading volume, not whether it is still listed near the front of the gainers.
At 18:14 Beijing time, a full scan covering 526/526 Binance USDT perpetuals shows SANDUSDT ranked #2, with a rolling 24-hour gain of +22.602% and a price of 0.07529; trading volume is about $1.349 billion. At 18:03 the single-coin quote was 0.07704; about 11 minutes later, the scan price was down 2.3%. The rolling gain is affected by the moving 24-hour window, so it can’t be treated as the actual drop over that period. Compared with the scan price of 0.08165 cited in this account’s 13:13 prior post, the scan has pulled back about 7.8%. The latest full hour from 17:00 to 18:00 closed at 0.07636, about 5.4% lower than the 12:00–13:00 close of 0.08070 in the prior post. The rolling 24-hour trading volume is up about 11% versus the prior post, but the flow is mixed active buying and selling, so it can’t be considered net buying.
The hourly path isn’t a one-way decline: the close fell from 0.07987 at 13:00 to 0.07346 at 17:00, then rebounded to 0.07636 from 17:00 to 18:00. However, the rebound hour’s trading volume was about $48.12 million, down about 27.7% from roughly $66.60 million in the prior hour. 0.07222 hasn’t yet been broken by a full hourly close, but the current price at 18:14 is already below the previous hour’s close. The 18:00–19:00 hour isn’t finished yet, so this is only a “in-the-moment” condition on the chart. The reference level from the prior post, 0.07754, is still below it; you can’t call an intrahour brief reclaim the “recovery” of a level that hasn’t closed.
Positioning and fee rates haven’t been given with a clear direction. The hourly OI sample fell from about 448 million coins at 13:00 to about 440 million at 18:00—down around 1.8% net—with a drop first and then a rebound in between. OI doesn’t distinguish long vs short. The funding rate that was settled at 16:00 is -0.4794%; the 00:00 interface forecast for the next period is about -0.2472%, and it hasn’t been settled yet. A negative funding rate means the shorts pay to longs in that period; it doesn’t mean shorts are crowded or a squeeze is imminent.
Coinone and Bithumb lifted the SAND trading warning and resumed deposits/withdrawals on October 2. That is confirmed background already verified in the prior post, not new news for this wave. I didn’t find any explanation for these particular new candles in the hourly chart. Next, we’ll see whether a full hourly close can reclaim 0.07754 alongside an increase in trading volume, and whether 0.07222 can hold near that level. If rebound volume continues to contract or if a full hourly close breaks below the low, then the “repair” assessment should be downgraded. The market moves fast; after 18:14, the evaluation needs to be recalculated with the new data. #SAND
At 18:14 Beijing time, a full scan covering 526/526 Binance USDT perpetuals shows SANDUSDT ranked #2, with a rolling 24-hour gain of +22.602% and a price of 0.07529; trading volume is about $1.349 billion. At 18:03 the single-coin quote was 0.07704; about 11 minutes later, the scan price was down 2.3%. The rolling gain is affected by the moving 24-hour window, so it can’t be treated as the actual drop over that period. Compared with the scan price of 0.08165 cited in this account’s 13:13 prior post, the scan has pulled back about 7.8%. The latest full hour from 17:00 to 18:00 closed at 0.07636, about 5.4% lower than the 12:00–13:00 close of 0.08070 in the prior post. The rolling 24-hour trading volume is up about 11% versus the prior post, but the flow is mixed active buying and selling, so it can’t be considered net buying.
The hourly path isn’t a one-way decline: the close fell from 0.07987 at 13:00 to 0.07346 at 17:00, then rebounded to 0.07636 from 17:00 to 18:00. However, the rebound hour’s trading volume was about $48.12 million, down about 27.7% from roughly $66.60 million in the prior hour. 0.07222 hasn’t yet been broken by a full hourly close, but the current price at 18:14 is already below the previous hour’s close. The 18:00–19:00 hour isn’t finished yet, so this is only a “in-the-moment” condition on the chart. The reference level from the prior post, 0.07754, is still below it; you can’t call an intrahour brief reclaim the “recovery” of a level that hasn’t closed.
Positioning and fee rates haven’t been given with a clear direction. The hourly OI sample fell from about 448 million coins at 13:00 to about 440 million at 18:00—down around 1.8% net—with a drop first and then a rebound in between. OI doesn’t distinguish long vs short. The funding rate that was settled at 16:00 is -0.4794%; the 00:00 interface forecast for the next period is about -0.2472%, and it hasn’t been settled yet. A negative funding rate means the shorts pay to longs in that period; it doesn’t mean shorts are crowded or a squeeze is imminent.
Coinone and Bithumb lifted the SAND trading warning and resumed deposits/withdrawals on October 2. That is confirmed background already verified in the prior post, not new news for this wave. I didn’t find any explanation for these particular new candles in the hourly chart. Next, we’ll see whether a full hourly close can reclaim 0.07754 alongside an increase in trading volume, and whether 0.07222 can hold near that level. If rebound volume continues to contract or if a full hourly close breaks below the low, then the “repair” assessment should be downgraded. The market moves fast; after 18:14, the evaluation needs to be recalculated with the new data. #SAND
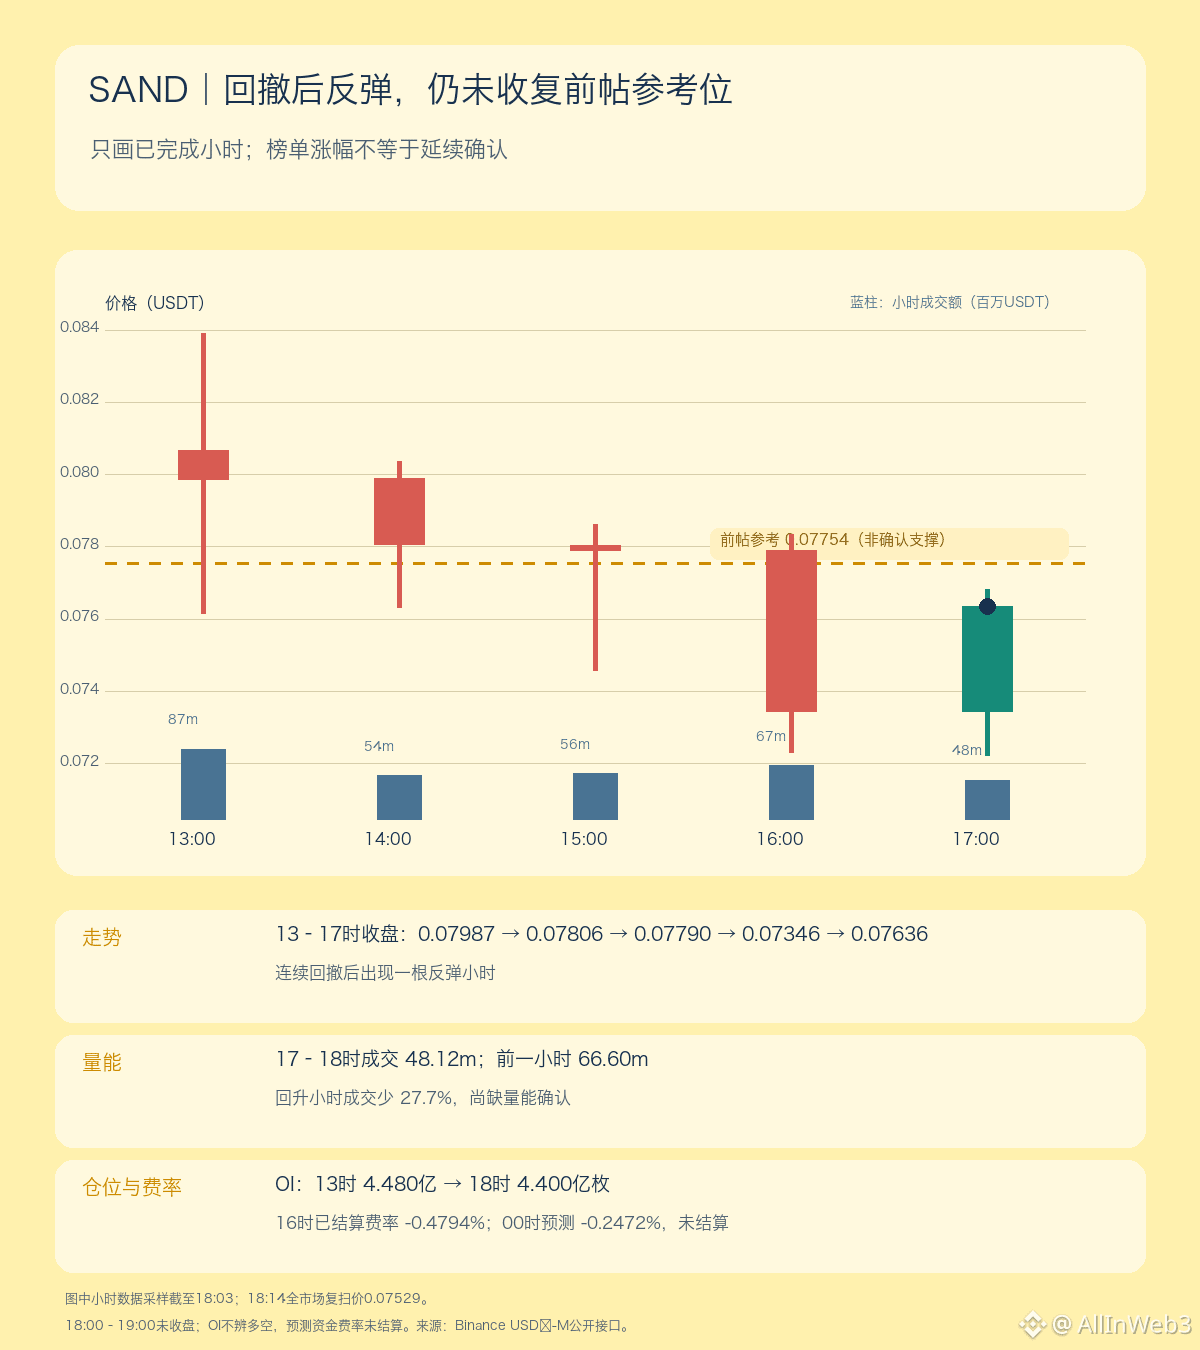
1
262
·
--
$VVV currently looks more like a weak rebound after a drop. I’ll watch for now and won’t directly equate the “annual emissions reduction” with a price reversal.
As of 17:17 Beijing time on October 3, the VVV/WETH pool on the Base chain Aerodrome is quoting around $27.57. Over the past rolling 24 hours, the pool is down 6.67%, with about $2.18 million in volume. The last 24 closed hourly candlesticks moved from roughly $29.84 to $27.55. In this segment, the high was $30.31 and the low was $27.14. The most recent complete hour closed slightly higher, but the price is still below the prior traded range around $28.19. This suggests there are signs that selling pressure has eased, but buyers have not yet reclaimed the key area.
Note: what’s quoted here is an on-chain pool, not Binance spot pricing. Trading volume within one pool alone can’t represent the whole market.
There’s a supply-side change worth tracking. Venice’s plan updated on August 5 states that VVV’s annualized emissions will fall from 2.5 million tokens to 2.0 million tokens starting October 1—about a 20% reduction. This is a reduction in issuance rate; it doesn’t mean the total supply will immediately contract, nor does it prove that the on-chain parameters have already switched on the day. You still need to verify actual emissions and subsequent circulating supply.
Another arrangement the project announced in July: for every $100 of API quota sold, $5 is used to buy and burn VVV. The real impact depends on the actual quota sales and burn records; you can’t write the rule as guaranteed buying demand.
VVV’s value thesis is tied to Venice AI usage demand. Official materials describe that by staking VVV, you can lock your staked share to mint DIEM; staking DIEM then grants daily API quota. This provides the token’s product utility, but ultimately it still comes down to whether user usage, lockups, and burns are enough to offset emissions and sell pressure. Just because the product mechanism exists doesn’t necessarily mean the token price must rise.
For the short term, I’ll watch two levels: 27.14 is the low observed on this hourly chart. If it breaks down and can’t be reclaimed, the weakness hasn’t been resolved yet. On the upside, I’ll look first at 28.19. At least a complete hourly close back above it is needed; only then can we judge whether a pullback can hold and whether volume keeps up—otherwise it’s still less like a true repair. Snapshot changes can happen quickly; these levels are only for observation and reference, not limit orders or profit guarantees.
$VVV currently looks more like a weak rebound after a drop. I’ll watch for now and won’t directly equate the “annual emissions reduction” with a price reversal.
As of 17:17 Beijing time on October 3, the VVV/WETH pool on the Base chain Aerodrome is quoting around $27.57. Over the past rolling 24 hours, the pool is down 6.67%, with about $2.18 million in volume. The last 24 closed hourly candlesticks moved from roughly $29.84 to $27.55. In this segment, the high was $30.31 and the low was $27.14. The most recent complete hour closed slightly higher, but the price is still below the prior traded range around $28.19. This suggests there are signs that selling pressure has eased, but buyers have not yet reclaimed the key area.
Note: what’s quoted here is an on-chain pool, not Binance spot pricing. Trading volume within one pool alone can’t represent the whole market.
There’s a supply-side change worth tracking. Venice’s plan updated on August 5 states that VVV’s annualized emissions will fall from 2.5 million tokens to 2.0 million tokens starting October 1—about a 20% reduction. This is a reduction in issuance rate; it doesn’t mean the total supply will immediately contract, nor does it prove that the on-chain parameters have already switched on the day. You still need to verify actual emissions and subsequent circulating supply.
Another arrangement the project announced in July: for every $100 of API quota sold, $5 is used to buy and burn VVV. The real impact depends on the actual quota sales and burn records; you can’t write the rule as guaranteed buying demand.
VVV’s value thesis is tied to Venice AI usage demand. Official materials describe that by staking VVV, you can lock your staked share to mint DIEM; staking DIEM then grants daily API quota. This provides the token’s product utility, but ultimately it still comes down to whether user usage, lockups, and burns are enough to offset emissions and sell pressure. Just because the product mechanism exists doesn’t necessarily mean the token price must rise.
For the short term, I’ll watch two levels: 27.14 is the low observed on this hourly chart. If it breaks down and can’t be reclaimed, the weakness hasn’t been resolved yet. On the upside, I’ll look first at 28.19. At least a complete hourly close back above it is needed; only then can we judge whether a pullback can hold and whether volume keeps up—otherwise it’s still less like a true repair. Snapshot changes can happen quickly; these levels are only for observation and reference, not limit orders or profit guarantees.
As of 17:17 Beijing time on October 3, the VVV/WETH pool on the Base chain Aerodrome is quoting around $27.57. Over the past rolling 24 hours, the pool is down 6.67%, with about $2.18 million in volume. The last 24 closed hourly candlesticks moved from roughly $29.84 to $27.55. In this segment, the high was $30.31 and the low was $27.14. The most recent complete hour closed slightly higher, but the price is still below the prior traded range around $28.19. This suggests there are signs that selling pressure has eased, but buyers have not yet reclaimed the key area.
Note: what’s quoted here is an on-chain pool, not Binance spot pricing. Trading volume within one pool alone can’t represent the whole market.
There’s a supply-side change worth tracking. Venice’s plan updated on August 5 states that VVV’s annualized emissions will fall from 2.5 million tokens to 2.0 million tokens starting October 1—about a 20% reduction. This is a reduction in issuance rate; it doesn’t mean the total supply will immediately contract, nor does it prove that the on-chain parameters have already switched on the day. You still need to verify actual emissions and subsequent circulating supply.
Another arrangement the project announced in July: for every $100 of API quota sold, $5 is used to buy and burn VVV. The real impact depends on the actual quota sales and burn records; you can’t write the rule as guaranteed buying demand.
VVV’s value thesis is tied to Venice AI usage demand. Official materials describe that by staking VVV, you can lock your staked share to mint DIEM; staking DIEM then grants daily API quota. This provides the token’s product utility, but ultimately it still comes down to whether user usage, lockups, and burns are enough to offset emissions and sell pressure. Just because the product mechanism exists doesn’t necessarily mean the token price must rise.
For the short term, I’ll watch two levels: 27.14 is the low observed on this hourly chart. If it breaks down and can’t be reclaimed, the weakness hasn’t been resolved yet. On the upside, I’ll look first at 28.19. At least a complete hourly close back above it is needed; only then can we judge whether a pullback can hold and whether volume keeps up—otherwise it’s still less like a true repair. Snapshot changes can happen quickly; these levels are only for observation and reference, not limit orders or profit guarantees.
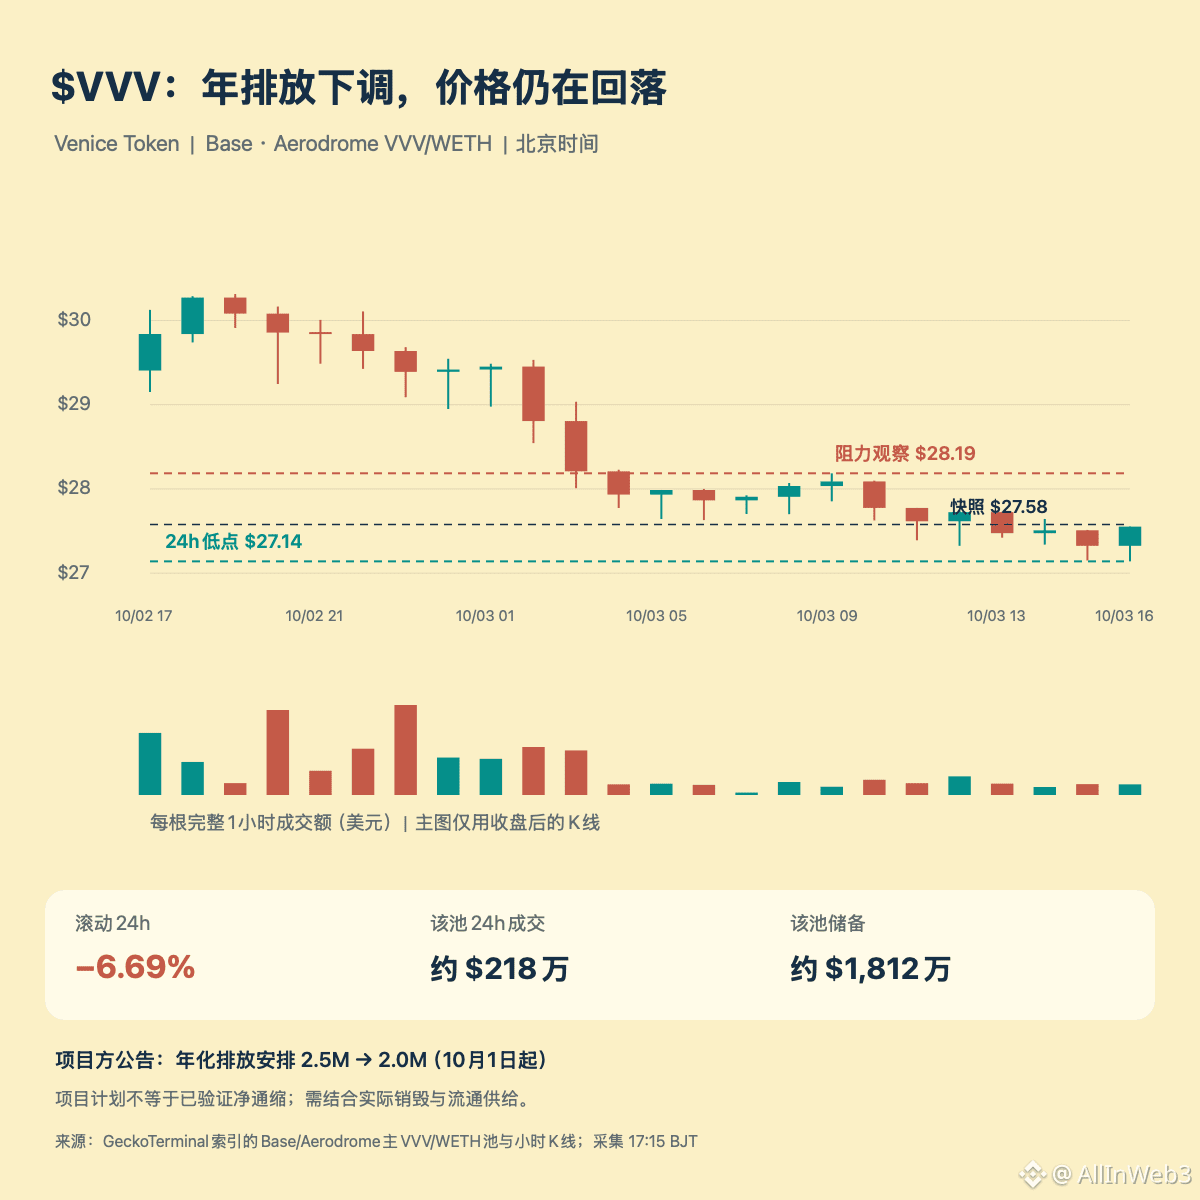
1
175
·
--
$VELVET has bounced strongly on increased volume, but we should still observe for now and not chase. On October 3 at 17:06 Beijing time, Binance’s Futures account scanned 526 USDT perpetual contracts that match the specified range in full. The rolling 24-hour percentage increase is 25.814%, ranking 2nd, with the scan price at 0.08076 USDT. Being near the top of the list does not mean it has already returned to the rising structure from this morning.
The post at 07:14 on this channel was an observation of continuous hourly volume-and-price lifting. Focus points were the prior high at 0.08880 and the prior low at 0.08091. After that, from 07:00 to 08:00 it did indeed close at 0.09427; however from 08:00 to 09:00 it surged to 0.09569 and then pulled back to close at 0.08033, breaking below the earlier observation level. Then from 13:00 to 14:00 it tested down to 0.06707. The key added this time is the repair after two clearly visible waves of retracement—so we cannot keep using the morning explanation of “continuous acceleration.”
The latest completed hour, 16:00 to 17:00, moved up from 0.07489 to 0.08031, an increase of about 7.24%. Trading volume was about 9.86 million USDT, which is 4.98 times the previous hour’s roughly 1.98 million. Compared with the 06:00 to 07:00 volume of about 7.33 million, the repair candle’s volume is larger, but the close is still about 9.4% lower. Increased activity is a valid new piece of information, but for the price to return to the original trend, that needs separate proof.
We also need to check where the repair occurred: the hour’s high was 0.08327, still lower than the 0.08398 high from 13:00 to 14:00. The four-hour candle that has completed from 12:00 to 16:00 ultimately still closed at 0.07489. The four-hour period from 16:00 to 20:00 has not closed yet, so we cannot directly write a one-hour bounce as a four-hour reversal, nor can we automatically explain the long lower wick as just a “shakeout.”
Positions have risen, but the strength is different from the price. In the OI quantity sample, from 16:00 to 17:00 it increased from about 76.39 million to 79.74 million coins, up about 4.39%. This only indicates that the scale of open contracts expanded; it does not mean a net inflow from longs. The 16:00 actual settlement funding rate is +0.006532% per 4 hours, lower than +0.026255% at 12:00. A decrease in the funding rate is not, by itself, a reason to justify buying; the next-period prediction should not be treated as a confirmed, settled result.
I rechecked Binance project announcements and Velvet’s official blog, and I still cannot verify any new catalyst that directly explains this-hour rebound. Updates to old products can only serve as background; they do not provide a strong reason that would fully account for this bullish candle.
Next, what’s more worth watching is the 0.08327–0.08398 area: we need subsequent full-hour closes above it, pullbacks that are met with acceptance, and trading activity that does not quickly fade—those would be evidence that the repair can continue. If it goes up on volume but still doesn’t rise for a long time, or if it loses the low of this hour again at 0.07475, then the current repair interpretation should be downgraded. These are structural observation levels, not guaranteed entry prices based on past signals; after price and window change, the calculation should be redone. Market conditions and position sources come from Binance’s public interface; single-coin evidence collection was at 17:03, and the accompanying chart only draws completed hours.
$VELVET has bounced strongly on increased volume, but we should still observe for now and not chase. On October 3 at 17:06 Beijing time, Binance’s Futures account scanned 526 USDT perpetual contracts that match the specified range in full. The rolling 24-hour percentage increase is 25.814%, ranking 2nd, with the scan price at 0.08076 USDT. Being near the top of the list does not mean it has already returned to the rising structure from this morning.
The post at 07:14 on this channel was an observation of continuous hourly volume-and-price lifting. Focus points were the prior high at 0.08880 and the prior low at 0.08091. After that, from 07:00 to 08:00 it did indeed close at 0.09427; however from 08:00 to 09:00 it surged to 0.09569 and then pulled back to close at 0.08033, breaking below the earlier observation level. Then from 13:00 to 14:00 it tested down to 0.06707. The key added this time is the repair after two clearly visible waves of retracement—so we cannot keep using the morning explanation of “continuous acceleration.”
The latest completed hour, 16:00 to 17:00, moved up from 0.07489 to 0.08031, an increase of about 7.24%. Trading volume was about 9.86 million USDT, which is 4.98 times the previous hour’s roughly 1.98 million. Compared with the 06:00 to 07:00 volume of about 7.33 million, the repair candle’s volume is larger, but the close is still about 9.4% lower. Increased activity is a valid new piece of information, but for the price to return to the original trend, that needs separate proof.
We also need to check where the repair occurred: the hour’s high was 0.08327, still lower than the 0.08398 high from 13:00 to 14:00. The four-hour candle that has completed from 12:00 to 16:00 ultimately still closed at 0.07489. The four-hour period from 16:00 to 20:00 has not closed yet, so we cannot directly write a one-hour bounce as a four-hour reversal, nor can we automatically explain the long lower wick as just a “shakeout.”
Positions have risen, but the strength is different from the price. In the OI quantity sample, from 16:00 to 17:00 it increased from about 76.39 million to 79.74 million coins, up about 4.39%. This only indicates that the scale of open contracts expanded; it does not mean a net inflow from longs. The 16:00 actual settlement funding rate is +0.006532% per 4 hours, lower than +0.026255% at 12:00. A decrease in the funding rate is not, by itself, a reason to justify buying; the next-period prediction should not be treated as a confirmed, settled result.
I rechecked Binance project announcements and Velvet’s official blog, and I still cannot verify any new catalyst that directly explains this-hour rebound. Updates to old products can only serve as background; they do not provide a strong reason that would fully account for this bullish candle.
Next, what’s more worth watching is the 0.08327–0.08398 area: we need subsequent full-hour closes above it, pullbacks that are met with acceptance, and trading activity that does not quickly fade—those would be evidence that the repair can continue. If it goes up on volume but still doesn’t rise for a long time, or if it loses the low of this hour again at 0.07475, then the current repair interpretation should be downgraded. These are structural observation levels, not guaranteed entry prices based on past signals; after price and window change, the calculation should be redone. Market conditions and position sources come from Binance’s public interface; single-coin evidence collection was at 17:03, and the accompanying chart only draws completed hours.
The post at 07:14 on this channel was an observation of continuous hourly volume-and-price lifting. Focus points were the prior high at 0.08880 and the prior low at 0.08091. After that, from 07:00 to 08:00 it did indeed close at 0.09427; however from 08:00 to 09:00 it surged to 0.09569 and then pulled back to close at 0.08033, breaking below the earlier observation level. Then from 13:00 to 14:00 it tested down to 0.06707. The key added this time is the repair after two clearly visible waves of retracement—so we cannot keep using the morning explanation of “continuous acceleration.”
The latest completed hour, 16:00 to 17:00, moved up from 0.07489 to 0.08031, an increase of about 7.24%. Trading volume was about 9.86 million USDT, which is 4.98 times the previous hour’s roughly 1.98 million. Compared with the 06:00 to 07:00 volume of about 7.33 million, the repair candle’s volume is larger, but the close is still about 9.4% lower. Increased activity is a valid new piece of information, but for the price to return to the original trend, that needs separate proof.
We also need to check where the repair occurred: the hour’s high was 0.08327, still lower than the 0.08398 high from 13:00 to 14:00. The four-hour candle that has completed from 12:00 to 16:00 ultimately still closed at 0.07489. The four-hour period from 16:00 to 20:00 has not closed yet, so we cannot directly write a one-hour bounce as a four-hour reversal, nor can we automatically explain the long lower wick as just a “shakeout.”
Positions have risen, but the strength is different from the price. In the OI quantity sample, from 16:00 to 17:00 it increased from about 76.39 million to 79.74 million coins, up about 4.39%. This only indicates that the scale of open contracts expanded; it does not mean a net inflow from longs. The 16:00 actual settlement funding rate is +0.006532% per 4 hours, lower than +0.026255% at 12:00. A decrease in the funding rate is not, by itself, a reason to justify buying; the next-period prediction should not be treated as a confirmed, settled result.
I rechecked Binance project announcements and Velvet’s official blog, and I still cannot verify any new catalyst that directly explains this-hour rebound. Updates to old products can only serve as background; they do not provide a strong reason that would fully account for this bullish candle.
Next, what’s more worth watching is the 0.08327–0.08398 area: we need subsequent full-hour closes above it, pullbacks that are met with acceptance, and trading activity that does not quickly fade—those would be evidence that the repair can continue. If it goes up on volume but still doesn’t rise for a long time, or if it loses the low of this hour again at 0.07475, then the current repair interpretation should be downgraded. These are structural observation levels, not guaranteed entry prices based on past signals; after price and window change, the calculation should be redone. Market conditions and position sources come from Binance’s public interface; single-coin evidence collection was at 17:03, and the accompanying chart only draws completed hours.
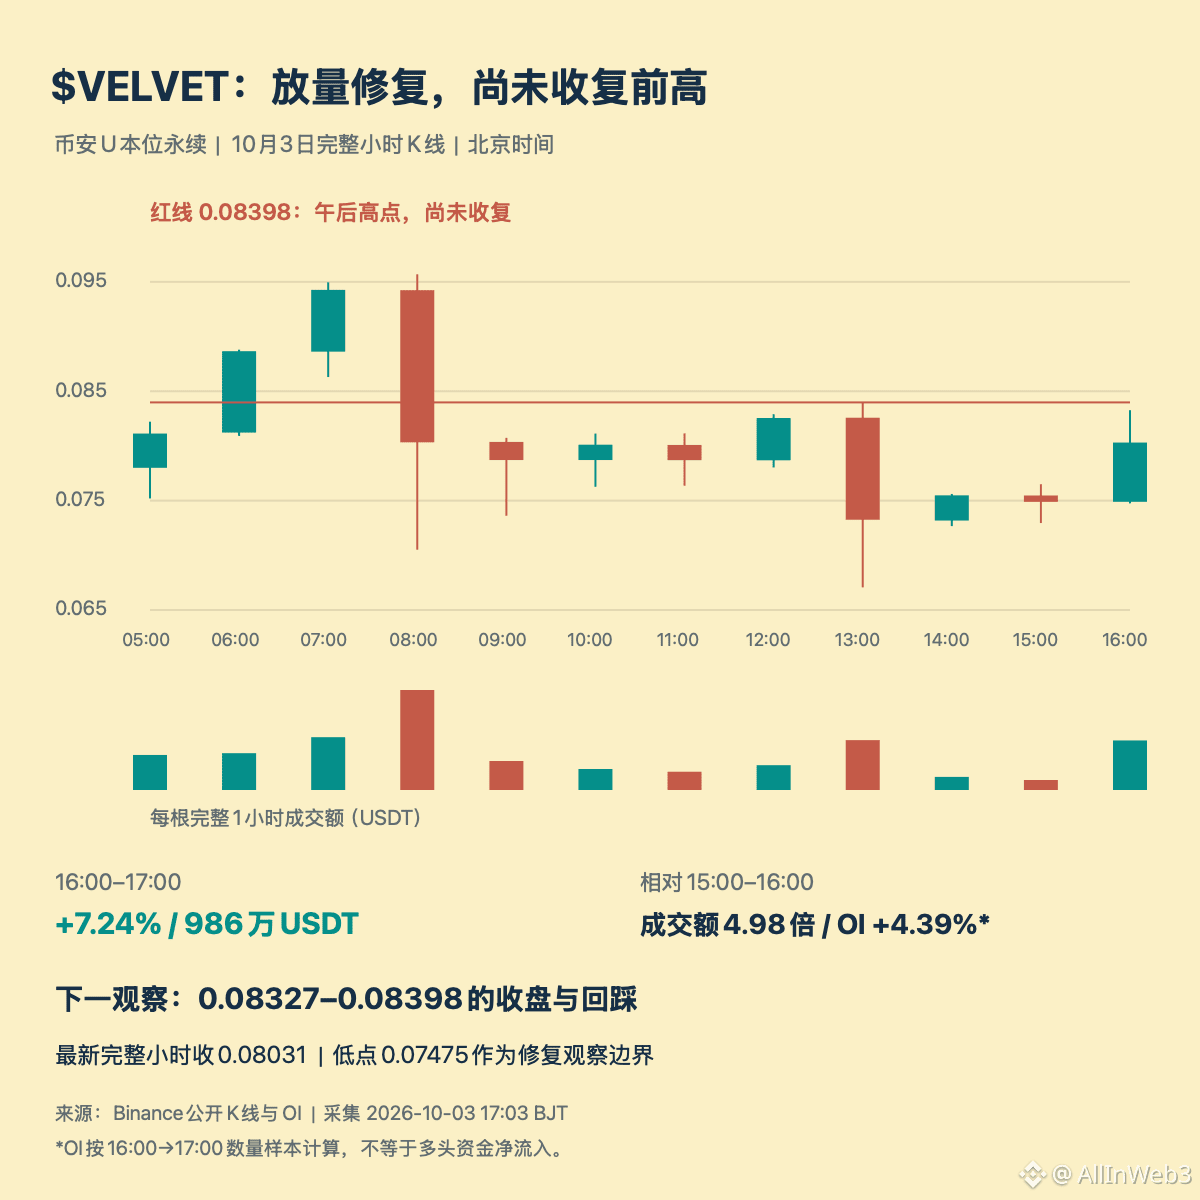
1
247
Log in to explore more content
Join global crypto users on Binance Square
⚡️ Get latest and useful information about crypto.
💬 Trusted by the world’s largest crypto exchange.
👍 Discover real insights from verified creators.
Email / Phone number
Trending Topics
ZcashETFPostsFirstWeeklyOutflow$93.6M
40,370 views
131 Discussing
#ZcashETFPostsFirstWeeklyOutflow$93.6M
🚨🚨🚨🚨🚨🚨🚨🚨🚨🚨🚨🚨🚨🚨✅ 🚨 ZCASH ETF FLOWS TURN NEGATIVE FOR THE FIRST TIME! 📉
$ZEC is facing a notable shift in institutional fund flows, with Zcash investment products recording their first weekly net outflow since launching in August.
According to fund-flow data, around $93.6M was withdrawn from Zcash products during the latest week, while ZEC price action also cooled significantly.
📊 WHAT HAPPENED?
• Weekly Zcash ETF outflow: $93.6M
• September 30 daily outflow: $30.25M
• ZCSH previously attracted around $98.2M in one week
• ZEC is trading near $1,300
• Recent high: around $1,690
• Weekly decline: roughly 17%+
🔍 LEVELS TO WATCH
🟢 Support: $1,280–$1,300
🔴 Resistance: $1,450–$1,500
The key question now is whether the $1,300 area can hold and attract fresh buyers.
Institutional flows will also be important. A return of consistent positive inflows could signal renewed confidence, while continued outflows may keep pressure on $ZEC .
👀 Is this simply profit-taking after ZEC’s huge rally, or could we see another deeper pullback before buyers return?
Share your view below. 👇
#Zcash #ZEC #ZcashETF #Crypto
#analysis
owhggwiohsjowve
·0 Likes
·184 views
GreekPoliceBustCryptoScamRingArrest17
97,270 views
782 Discussing
BitcoinRejectedAt$87K
132,301 views
190 Discussing