
Abo Crypto
1.2k Posts

Abo Crypto
Report
Block User
web3 creator | On-Chain Analyst | Whale Tracking | Decoding Smart Money Moves & Market behavior | Signals • Flows • Cyclrs
Open Trade
Frequent Trader
5.9 Years
45 Following
2.3K+ Followers
10.5K+ Liked
Posts
Portfolio
All
Quotes
Videos
PINNED
·
--
Bearish

13
1
33
23.6k
PINNED
·
--
Bearish
See translation
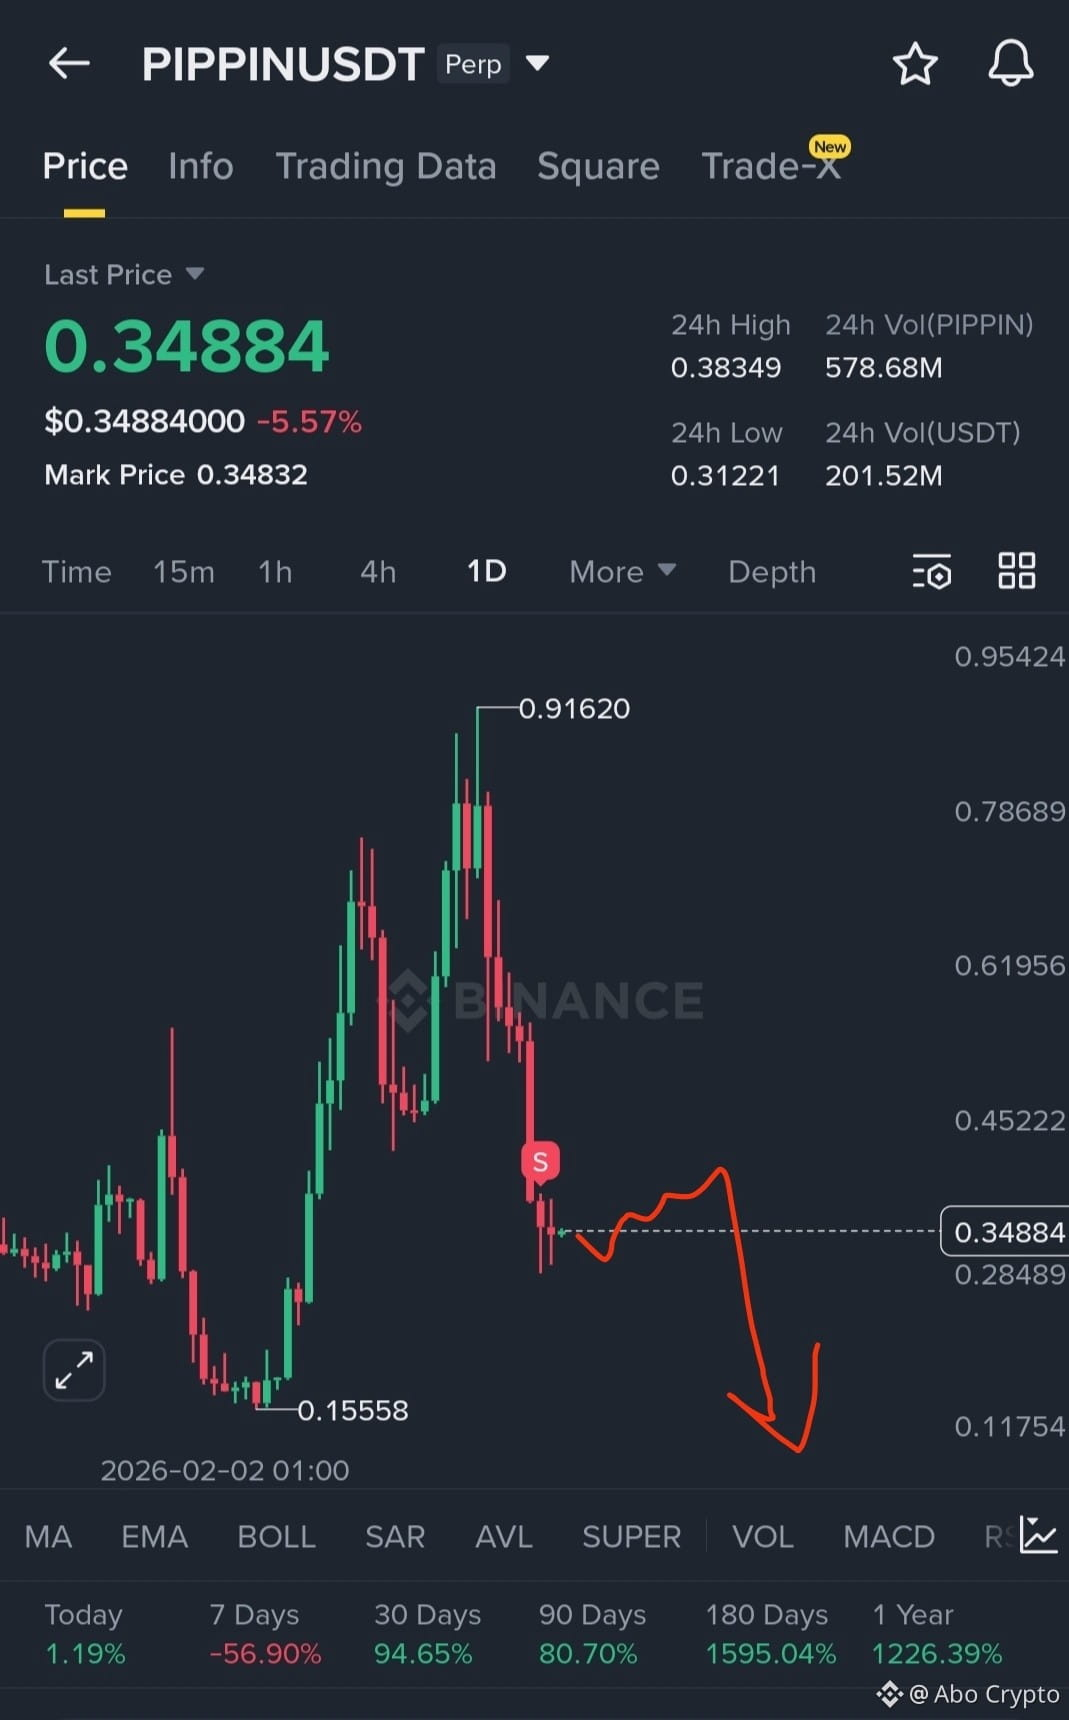
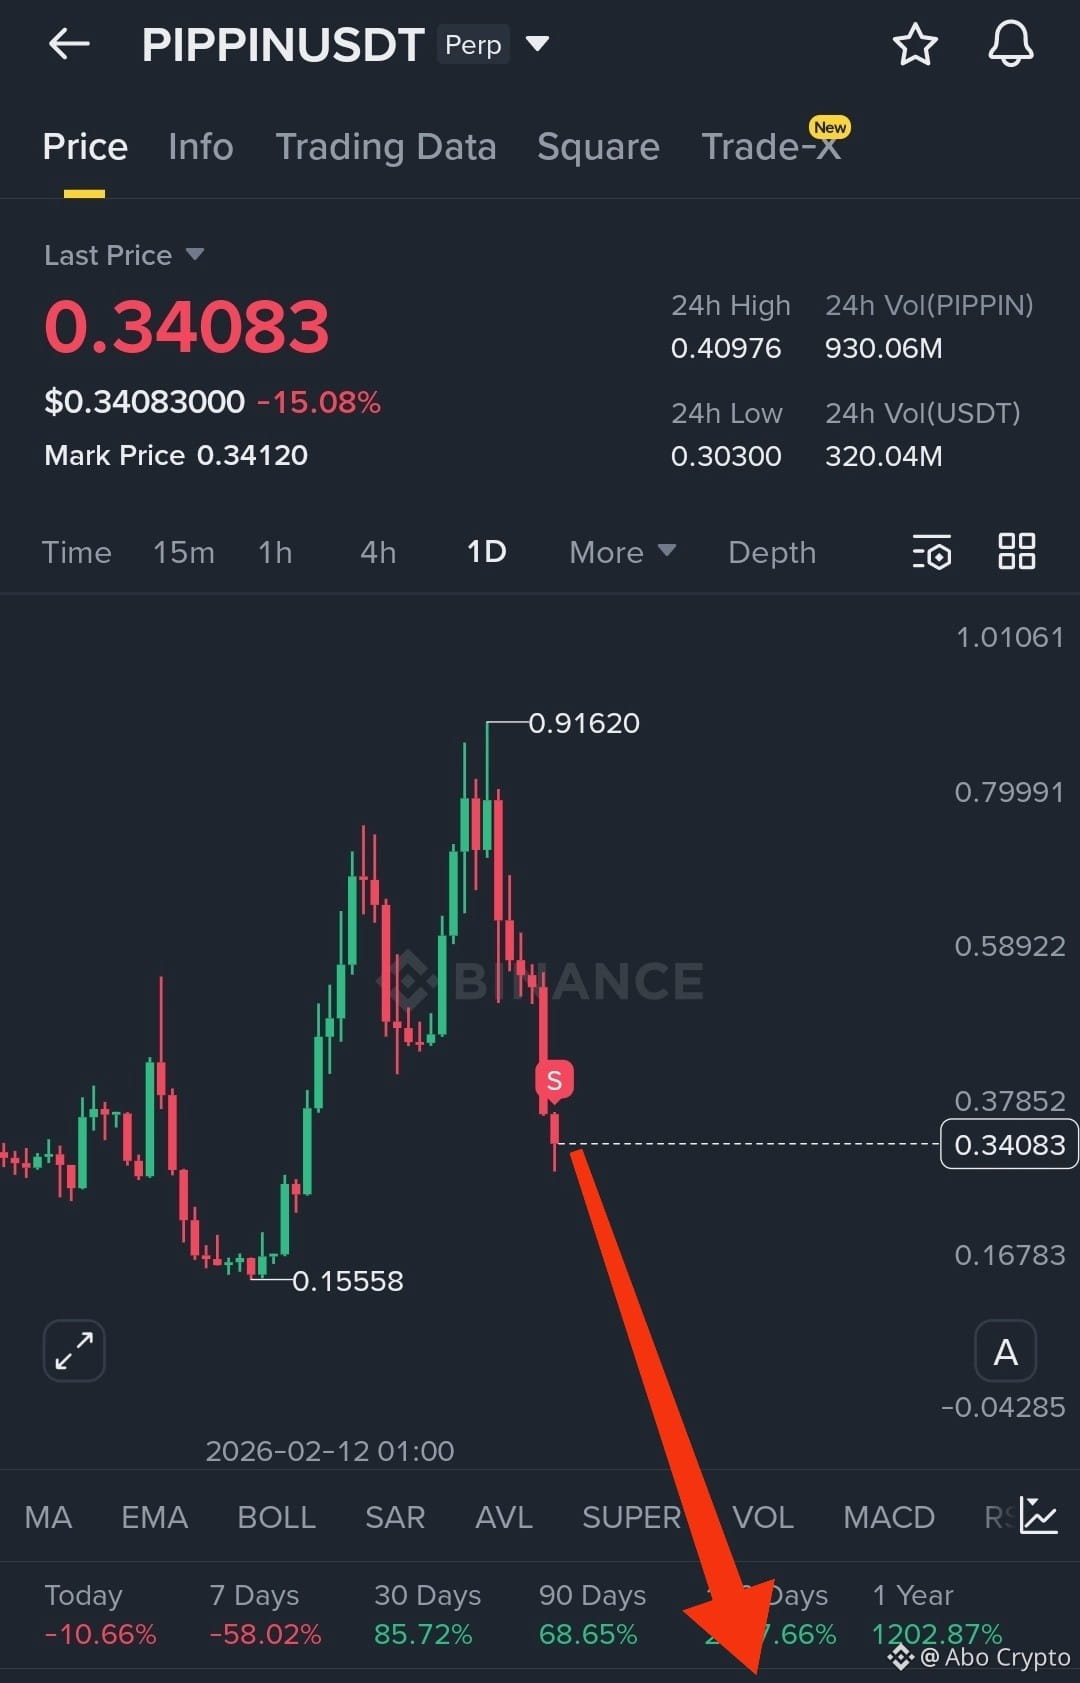
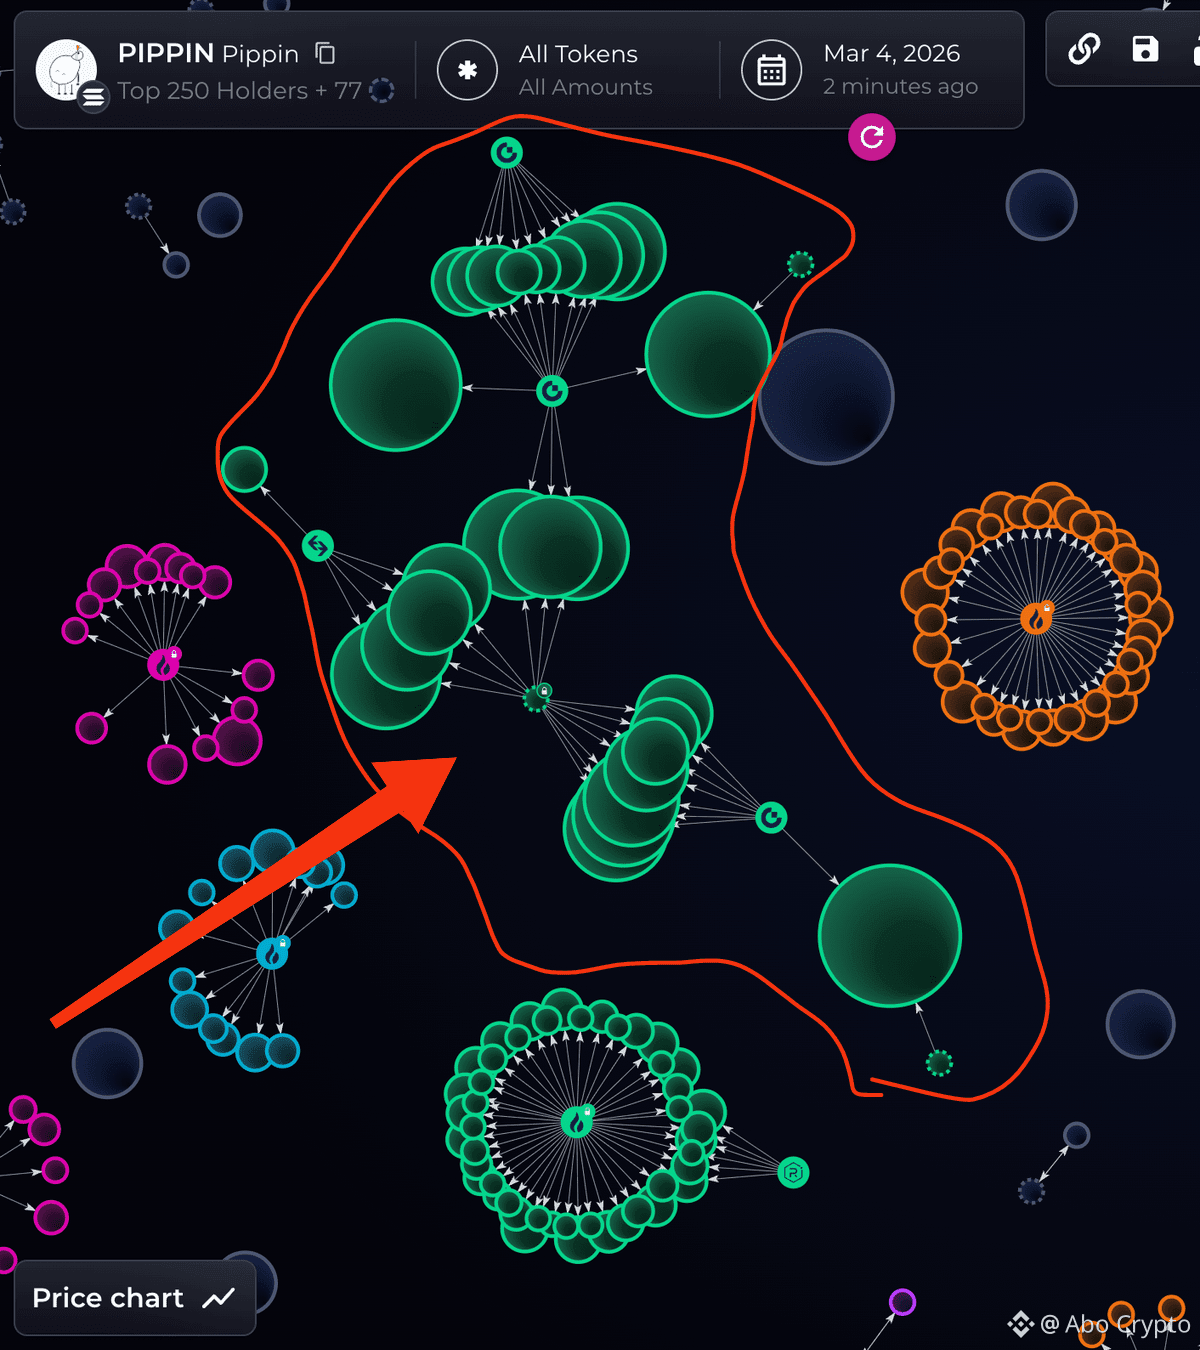
🚨$pippin 120 wallets control 80% of the supply
🤔🤔🤔
🚨$pippin 120 wallets control 80% of the supply
🤔🤔🤔
🤔🤔🤔
2
19
37k
·
--
See translation
Michael Saylor Hints at Buying More Bitcoin
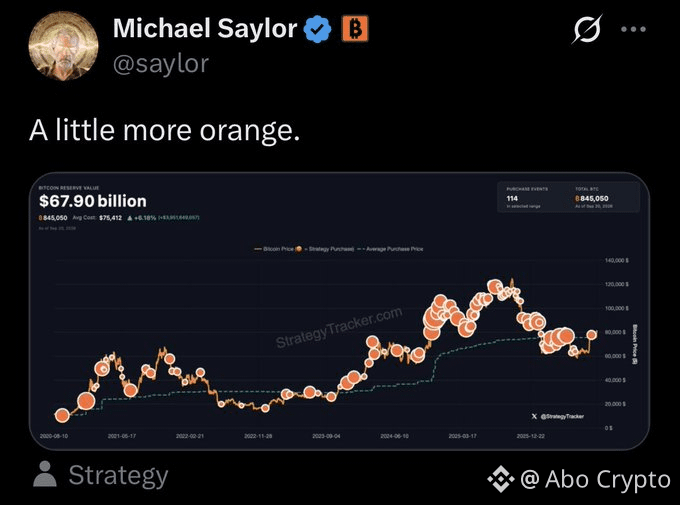
Saylor posted a screenshot of Strategy’s holdings and wrote:
A little more orange
But this short sentence immediately caught people’s attention
Strategy holds approximately 845,050 $BTC worth nearly $67.9 billion, according to the image
And now Saylor is hinting at “a little more orange” once again
Is this just a symbolic gesture
or is Strategy preparing to add more Bitcoin to its vaults
The market is waiting for the official announcement
Michael Saylor Hints at Buying More Bitcoin
Saylor posted a screenshot of Strategy’s holdings and wrote:
A little more orange
But this short sentence immediately caught people’s attention
Strategy holds approximately 845,050 $BTC worth nearly $67.9 billion, according to the image
And now Saylor is hinting at “a little more orange” once again
Is this just a symbolic gesture
or is Strategy preparing to add more Bitcoin to its vaults
The market is waiting for the official announcement
Saylor posted a screenshot of Strategy’s holdings and wrote:
A little more orange
But this short sentence immediately caught people’s attention
Strategy holds approximately 845,050 $BTC worth nearly $67.9 billion, according to the image
And now Saylor is hinting at “a little more orange” once again
Is this just a symbolic gesture
or is Strategy preparing to add more Bitcoin to its vaults
The market is waiting for the official announcement
1
100
·
--
Bullish
See translation
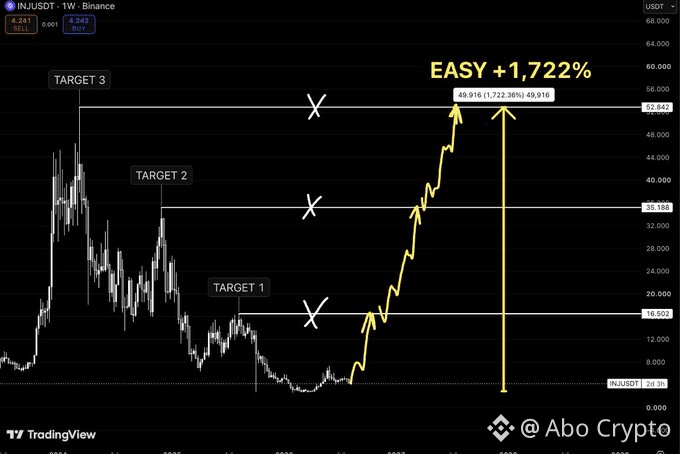
$INJ doesn’t need a new ATH to make this trade ridiculous.
That’s the part people miss.
From these lows, the old reaction zones alone give us:
$16.50 → Target 1
$35.18 → Target 2
$52.84 → Target 3
The full move?
+1,722%
And $52 isn’t some imaginary number pulled from nowhere
price has already traded around that region before
$INJ is basically being asked to repeat history
Crypto loves doing exactly that when everyone assumes it can’t
$INJ doesn’t need a new ATH to make this trade ridiculous.
That’s the part people miss.
From these lows, the old reaction zones alone give us:
$16.50 → Target 1
$35.18 → Target 2
$52.84 → Target 3
The full move?
+1,722%
And $52 isn’t some imaginary number pulled from nowhere
price has already traded around that region before
$INJ is basically being asked to repeat history
Crypto loves doing exactly that when everyone assumes it can’t
That’s the part people miss.
From these lows, the old reaction zones alone give us:
$16.50 → Target 1
$35.18 → Target 2
$52.84 → Target 3
The full move?
+1,722%
And $52 isn’t some imaginary number pulled from nowhere
price has already traded around that region before
$INJ is basically being asked to repeat history
Crypto loves doing exactly that when everyone assumes it can’t
1
106
·
--
Bullish
See translation
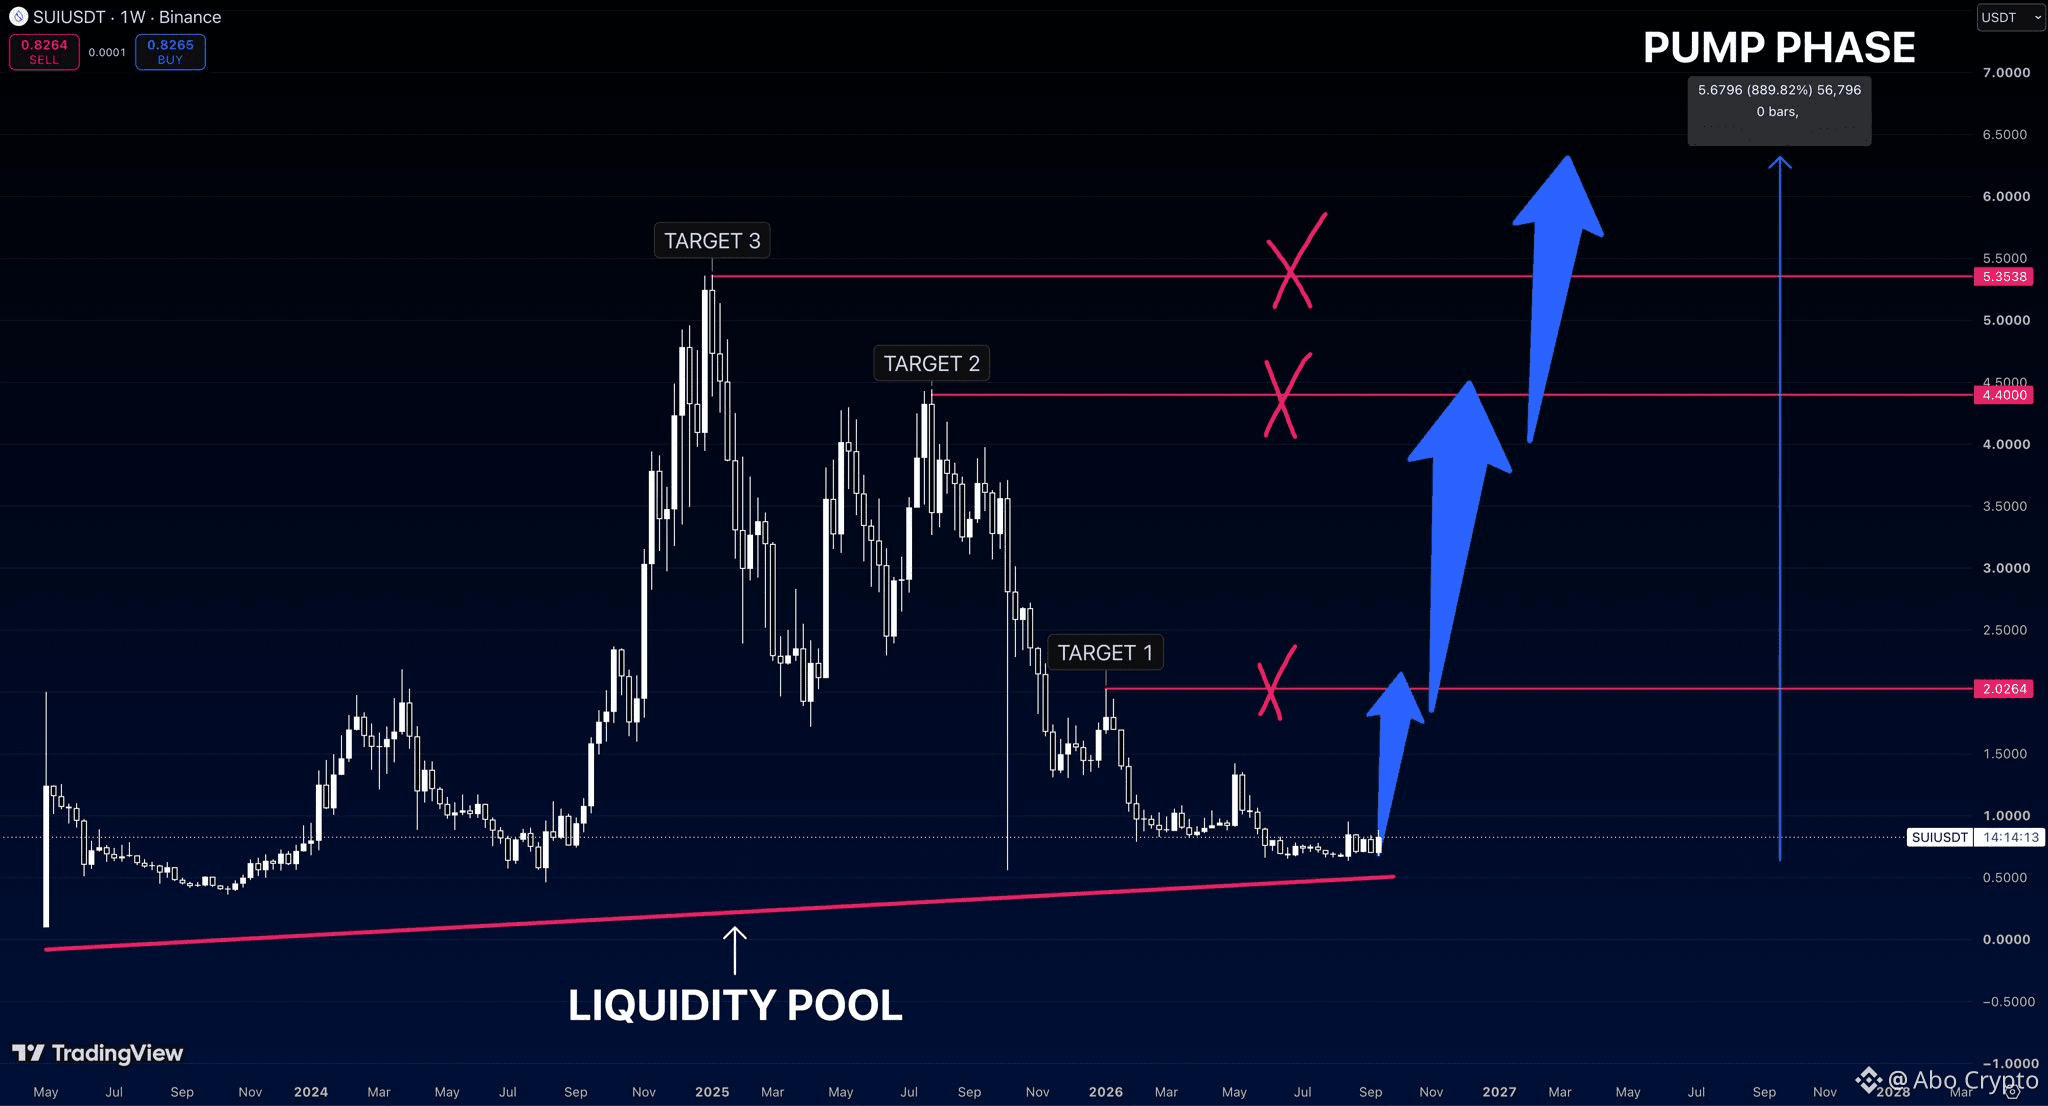
$SUI is sitting exactly where nobody wants it
And that’s usually when I start paying attention
From the chart, price is around $0.82, sitting right above the long term liquidity pool that has been building for years
Meanwhile the upside levels are still untouched:
$2.02 → $4.40 → $5.35
That first target alone is roughly a 2.5x from here
And the full move shown on the chart?
Around +890%
I’m not saying $SUI teleports to $6 tomorrow
But this setup is almost too simple:
Liquidity below has been tapped
Historical liquidity above is still sitting there
And if the market flips risk on again, I know exactly which direction I’m watching
$SUI is sitting exactly where nobody wants it
And that’s usually when I start paying attention
From the chart, price is around $0.82, sitting right above the long term liquidity pool that has been building for years
Meanwhile the upside levels are still untouched:
$2.02 → $4.40 → $5.35
That first target alone is roughly a 2.5x from here
And the full move shown on the chart?
Around +890%
I’m not saying $SUI teleports to $6 tomorrow
But this setup is almost too simple:
Liquidity below has been tapped
Historical liquidity above is still sitting there
And if the market flips risk on again, I know exactly which direction I’m watching
And that’s usually when I start paying attention
From the chart, price is around $0.82, sitting right above the long term liquidity pool that has been building for years
Meanwhile the upside levels are still untouched:
$2.02 → $4.40 → $5.35
That first target alone is roughly a 2.5x from here
And the full move shown on the chart?
Around +890%
I’m not saying $SUI teleports to $6 tomorrow
But this setup is almost too simple:
Liquidity below has been tapped
Historical liquidity above is still sitting there
And if the market flips risk on again, I know exactly which direction I’m watching
2
2.4k
·
--
See translation
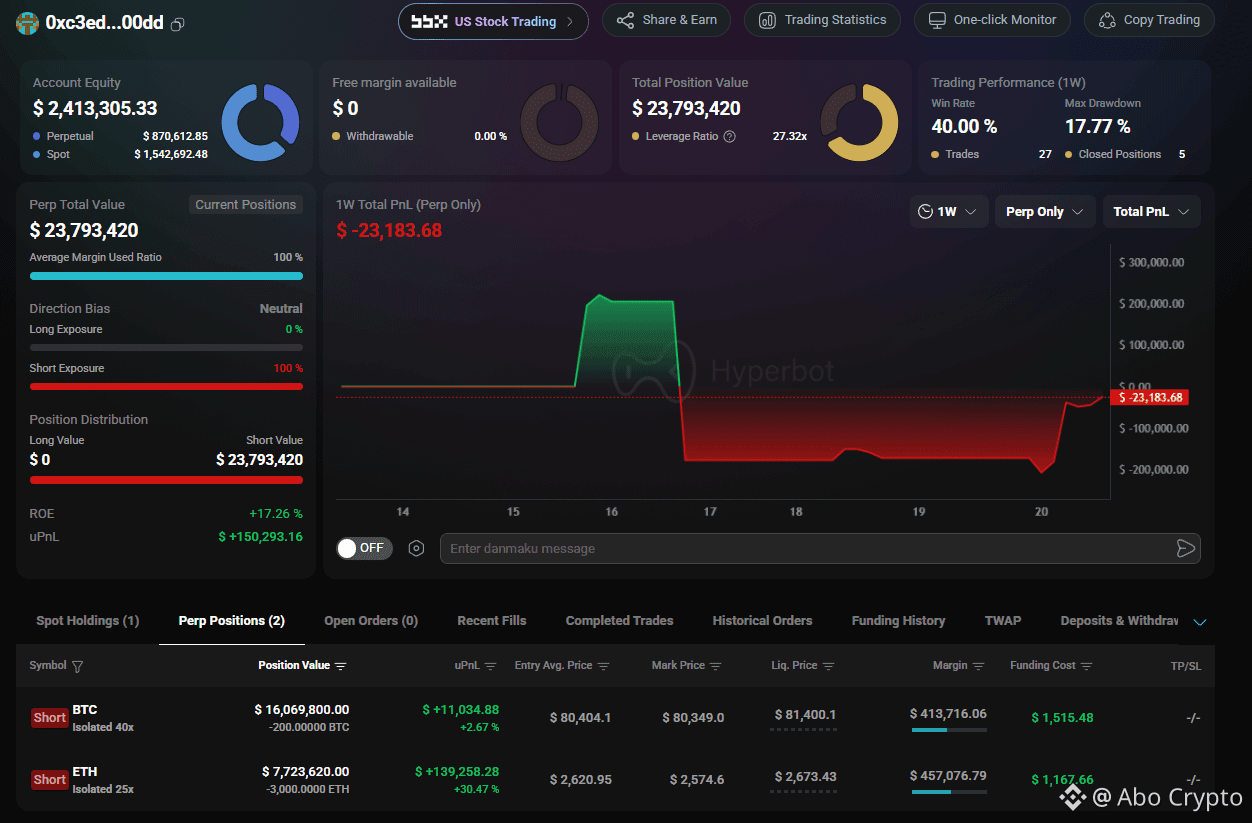
This trader has open short positions totaling over $23.7 million
The account has open short positions on Bitcoin and Ethereum
$BTC Short: $16.07M
$ETH Short: $7.72M
The account uses leverage of up to 40x on BTC and 25x on ETH
And what’s even stranger is that the liquidation prices are relatively close
BTC liquidation: $81,400
ETH liquidation: $2,673
This means a strong move against their positions could quickly turn the tables
Is this trader anticipating a bigger drop, or are they playing with fire with such massive leverage?
This trader has open short positions totaling over $23.7 million
The account has open short positions on Bitcoin and Ethereum
$BTC Short: $16.07M
$ETH Short: $7.72M
The account uses leverage of up to 40x on BTC and 25x on ETH
And what’s even stranger is that the liquidation prices are relatively close
BTC liquidation: $81,400
ETH liquidation: $2,673
This means a strong move against their positions could quickly turn the tables
Is this trader anticipating a bigger drop, or are they playing with fire with such massive leverage?
The account has open short positions on Bitcoin and Ethereum
$BTC Short: $16.07M
$ETH Short: $7.72M
The account uses leverage of up to 40x on BTC and 25x on ETH
And what’s even stranger is that the liquidation prices are relatively close
BTC liquidation: $81,400
ETH liquidation: $2,673
This means a strong move against their positions could quickly turn the tables
Is this trader anticipating a bigger drop, or are they playing with fire with such massive leverage?
1
2
783
·
--
See translation
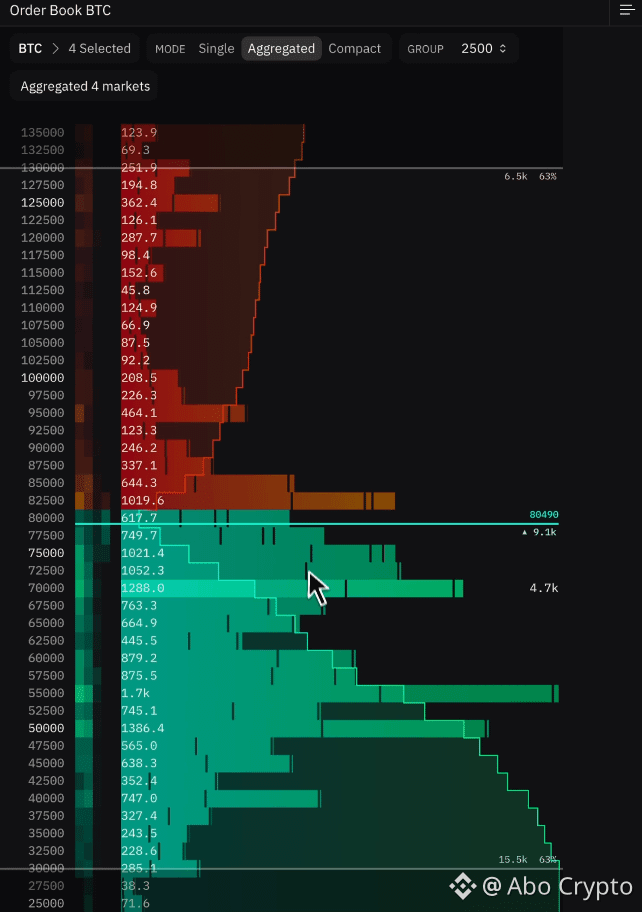
Bitcoin is facing a massive wall of selling pressure at $83, 000, and if it breaks through, the toughest phase for sellers may begin
The video clearly shows significant selling pressure above the current price, with the most prominent zone appearing at $83K
And here’s the key point
If BTC manages to break through this zone and turn it from
a Sell Wall into Support that could pave the way for much higher levels
The target that catches the eye after that is $100,000
but reaching it won’t happen with just a single candlestick breakout
Can $BTC absorb the selling pressure at $83K without losing momentum
If that happens, market sentiment could change entirely
Bitcoin is facing a massive wall of selling pressure at $83, 000, and if it breaks through, the toughest phase for sellers may begin
The video clearly shows significant selling pressure above the current price, with the most prominent zone appearing at $83K
And here’s the key point
If BTC manages to break through this zone and turn it from
a Sell Wall into Support that could pave the way for much higher levels
The target that catches the eye after that is $100,000
but reaching it won’t happen with just a single candlestick breakout
Can $BTC absorb the selling pressure at $83K without losing momentum
If that happens, market sentiment could change entirely
The video clearly shows significant selling pressure above the current price, with the most prominent zone appearing at $83K
And here’s the key point
If BTC manages to break through this zone and turn it from
a Sell Wall into Support that could pave the way for much higher levels
The target that catches the eye after that is $100,000
but reaching it won’t happen with just a single candlestick breakout
Can $BTC absorb the selling pressure at $83K without losing momentum
If that happens, market sentiment could change entirely
2
2
3.3k
·
--
Bullish
See translation
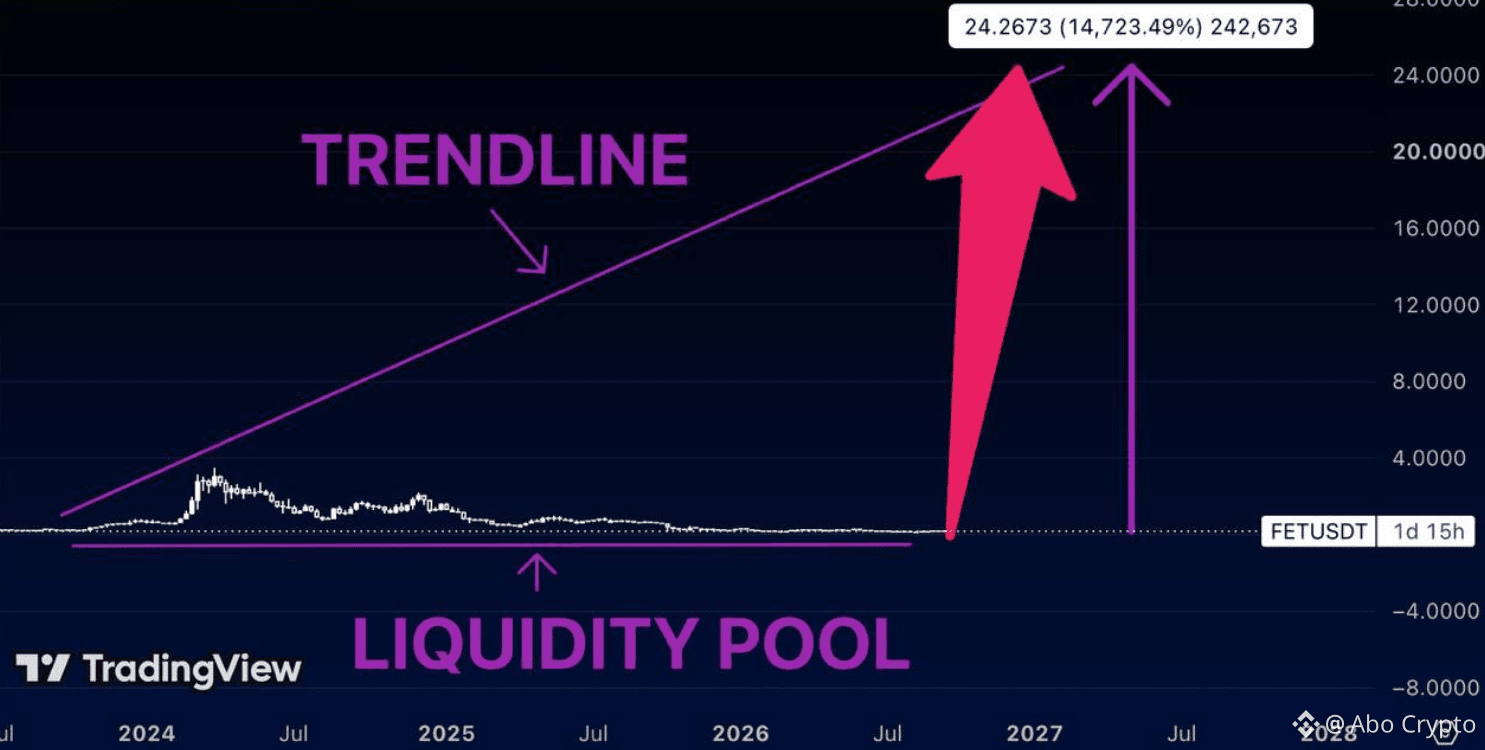
$FET at $0.18 looks completely dead
And that’s exactly what makes this chart interesting
Years of bleeding have pushed price straight back into the same long-term liquidity pool where the entire structure began
Everyone sees a coin down 95%+ and thinks: “it’s over.”
I see asymmetric risk.
Because if $FET ever starts a real expansion from this base
it doesn’t need to do anything unprecedented
The macro trendline on my chart stretches toward $24+
From these lows, that’s roughly +14,700%
Sounds ridiculous
But crypto has a funny habit of making the ridiculous look obvious in hindsight
For now, I’m watching the bottom
That’s where the interesting part starts
$FET at $0.18 looks completely dead
And that’s exactly what makes this chart interesting
Years of bleeding have pushed price straight back into the same long-term liquidity pool where the entire structure began
Everyone sees a coin down 95%+ and thinks: “it’s over.”
I see asymmetric risk.
Because if $FET ever starts a real expansion from this base
it doesn’t need to do anything unprecedented
The macro trendline on my chart stretches toward $24+
From these lows, that’s roughly +14,700%
Sounds ridiculous
But crypto has a funny habit of making the ridiculous look obvious in hindsight
For now, I’m watching the bottom
That’s where the interesting part starts
And that’s exactly what makes this chart interesting
Years of bleeding have pushed price straight back into the same long-term liquidity pool where the entire structure began
Everyone sees a coin down 95%+ and thinks: “it’s over.”
I see asymmetric risk.
Because if $FET ever starts a real expansion from this base
it doesn’t need to do anything unprecedented
The macro trendline on my chart stretches toward $24+
From these lows, that’s roughly +14,700%
Sounds ridiculous
But crypto has a funny habit of making the ridiculous look obvious in hindsight
For now, I’m watching the bottom
That’s where the interesting part starts
1
252
·
--
Bullish
1
1
148
·
--
See translation
The disease took a lot from him, but it didn't take away his faith in Bitcoin
In March 2013, Hal Finney wrote one of the most memorable stories in the history of Bitcoin: “Bitcoin and Me”
Hal was suffering from ALS and had become so paralyzed that he used an eye-tracking system to control his computer
Programming had become much slower for him
But he didn’t stop
Despite his condition, he continued to contribute to the development of the open source Bitcoin network because he believed that Bitcoin could help change the world
He was even working on a small project to control his wheelchair, and at the same time, he was developing a project related to Bitcoin wallet security
Most notably, he said the wallet project was nearly complete
Almost all that remained was to document the project
Imagine the scene for a moment: a person who has lost the ability to move, and programming was becoming more difficult for him day by day
Yet he was still writing code and building for the future
He didn’t know where $BTC would end up, but he believed it was worth building
More than a decade later, the question remains: Was Hal Finney’s vision bigger than just a currency?
The disease took a lot from him, but it didn't take away his faith in Bitcoin
In March 2013, Hal Finney wrote one of the most memorable stories in the history of Bitcoin: “Bitcoin and Me”
Hal was suffering from ALS and had become so paralyzed that he used an eye-tracking system to control his computer
Programming had become much slower for him
But he didn’t stop
Despite his condition, he continued to contribute to the development of the open source Bitcoin network because he believed that Bitcoin could help change the world
He was even working on a small project to control his wheelchair, and at the same time, he was developing a project related to Bitcoin wallet security
Most notably, he said the wallet project was nearly complete
Almost all that remained was to document the project
Imagine the scene for a moment: a person who has lost the ability to move, and programming was becoming more difficult for him day by day
Yet he was still writing code and building for the future
He didn’t know where $BTC would end up, but he believed it was worth building
More than a decade later, the question remains: Was Hal Finney’s vision bigger than just a currency?
In March 2013, Hal Finney wrote one of the most memorable stories in the history of Bitcoin: “Bitcoin and Me”
Hal was suffering from ALS and had become so paralyzed that he used an eye-tracking system to control his computer
Programming had become much slower for him
But he didn’t stop
Despite his condition, he continued to contribute to the development of the open source Bitcoin network because he believed that Bitcoin could help change the world
He was even working on a small project to control his wheelchair, and at the same time, he was developing a project related to Bitcoin wallet security
Most notably, he said the wallet project was nearly complete
Almost all that remained was to document the project
Imagine the scene for a moment: a person who has lost the ability to move, and programming was becoming more difficult for him day by day
Yet he was still writing code and building for the future
He didn’t know where $BTC would end up, but he believed it was worth building
More than a decade later, the question remains: Was Hal Finney’s vision bigger than just a currency?

4
571
·
--
Bullish
See translation
The market is waiting for a sell off, but Morgan Stanley seems to be waiting for something else
Something most traders don’t see: Institutional money continues to flow into Bitcoin
Morgan Stanley isn’t selling Bitcoin it’s doing the exact opposite
At a time when the market is gripped by uncertainty and fear
there’s a major player moving quietly
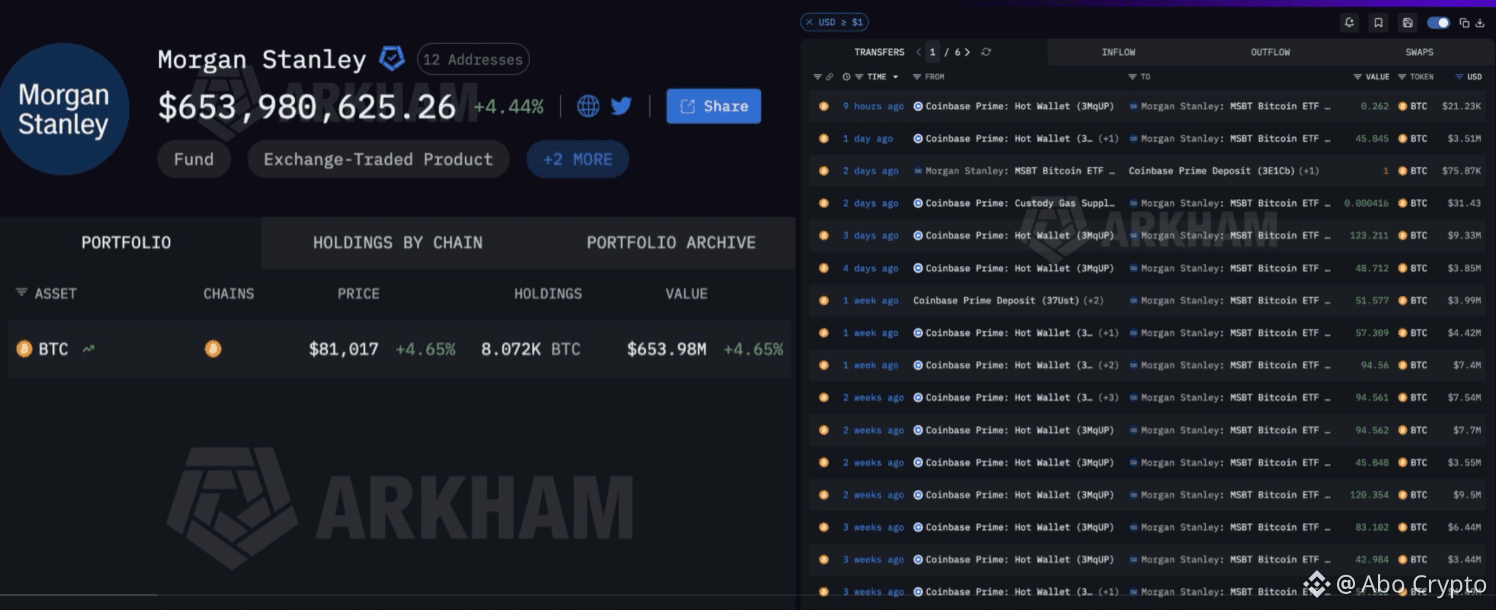
Morgan Stanley’s MSBT fund has accumulated approximately $51.5 million in BTC over the last 20 trading days
And, strangely enough, not a single day has seen outflows
This means that while many investors are trying to figure out:
Is this the end of the rally?
Should we reduce our positions?
Should we wait for a bigger drop?
Institutional money seems to be saying something different:
We’re still buying.
And the picture becomes even more intriguing when we see that Morgan Stanley’s holdings have reached approximately 8, 072
$BTC with a value exceeding $653 million
Of course, ETF inflows alone don’t mean Bitcoin will inevitably rise
But when funds keep coming in day after day without a single outflow, it’s hard to ignore the signal
What do institutions know that the market doesn’t see yet?
The market is waiting for a sell off, but Morgan Stanley seems to be waiting for something else
Something most traders don’t see: Institutional money continues to flow into Bitcoin
Morgan Stanley isn’t selling Bitcoin it’s doing the exact opposite
At a time when the market is gripped by uncertainty and fear
there’s a major player moving quietly
Morgan Stanley’s MSBT fund has accumulated approximately $51.5 million in BTC over the last 20 trading days
And, strangely enough, not a single day has seen outflows
This means that while many investors are trying to figure out:
Is this the end of the rally?
Should we reduce our positions?
Should we wait for a bigger drop?
Institutional money seems to be saying something different:
We’re still buying.
And the picture becomes even more intriguing when we see that Morgan Stanley’s holdings have reached approximately 8, 072
$BTC with a value exceeding $653 million
Of course, ETF inflows alone don’t mean Bitcoin will inevitably rise
But when funds keep coming in day after day without a single outflow, it’s hard to ignore the signal
What do institutions know that the market doesn’t see yet?
Something most traders don’t see: Institutional money continues to flow into Bitcoin
Morgan Stanley isn’t selling Bitcoin it’s doing the exact opposite
At a time when the market is gripped by uncertainty and fear
there’s a major player moving quietly
Morgan Stanley’s MSBT fund has accumulated approximately $51.5 million in BTC over the last 20 trading days
And, strangely enough, not a single day has seen outflows
This means that while many investors are trying to figure out:
Is this the end of the rally?
Should we reduce our positions?
Should we wait for a bigger drop?
Institutional money seems to be saying something different:
We’re still buying.
And the picture becomes even more intriguing when we see that Morgan Stanley’s holdings have reached approximately 8, 072
$BTC with a value exceeding $653 million
Of course, ETF inflows alone don’t mean Bitcoin will inevitably rise
But when funds keep coming in day after day without a single outflow, it’s hard to ignore the signal
What do institutions know that the market doesn’t see yet?
1
212
·
--
Bullish
See translation
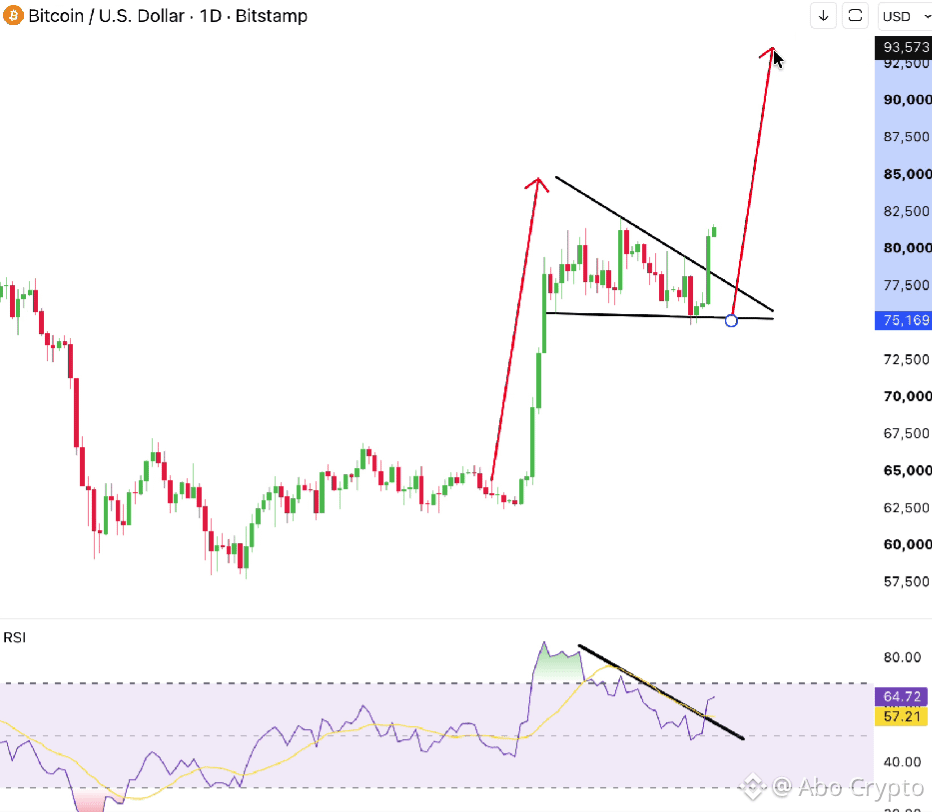
Bull flag just broke out
RSI is already following
$BTC
Bull flag just broke out
RSI is already following
$BTC
RSI is already following
$BTC
2
314
·
--
See translation
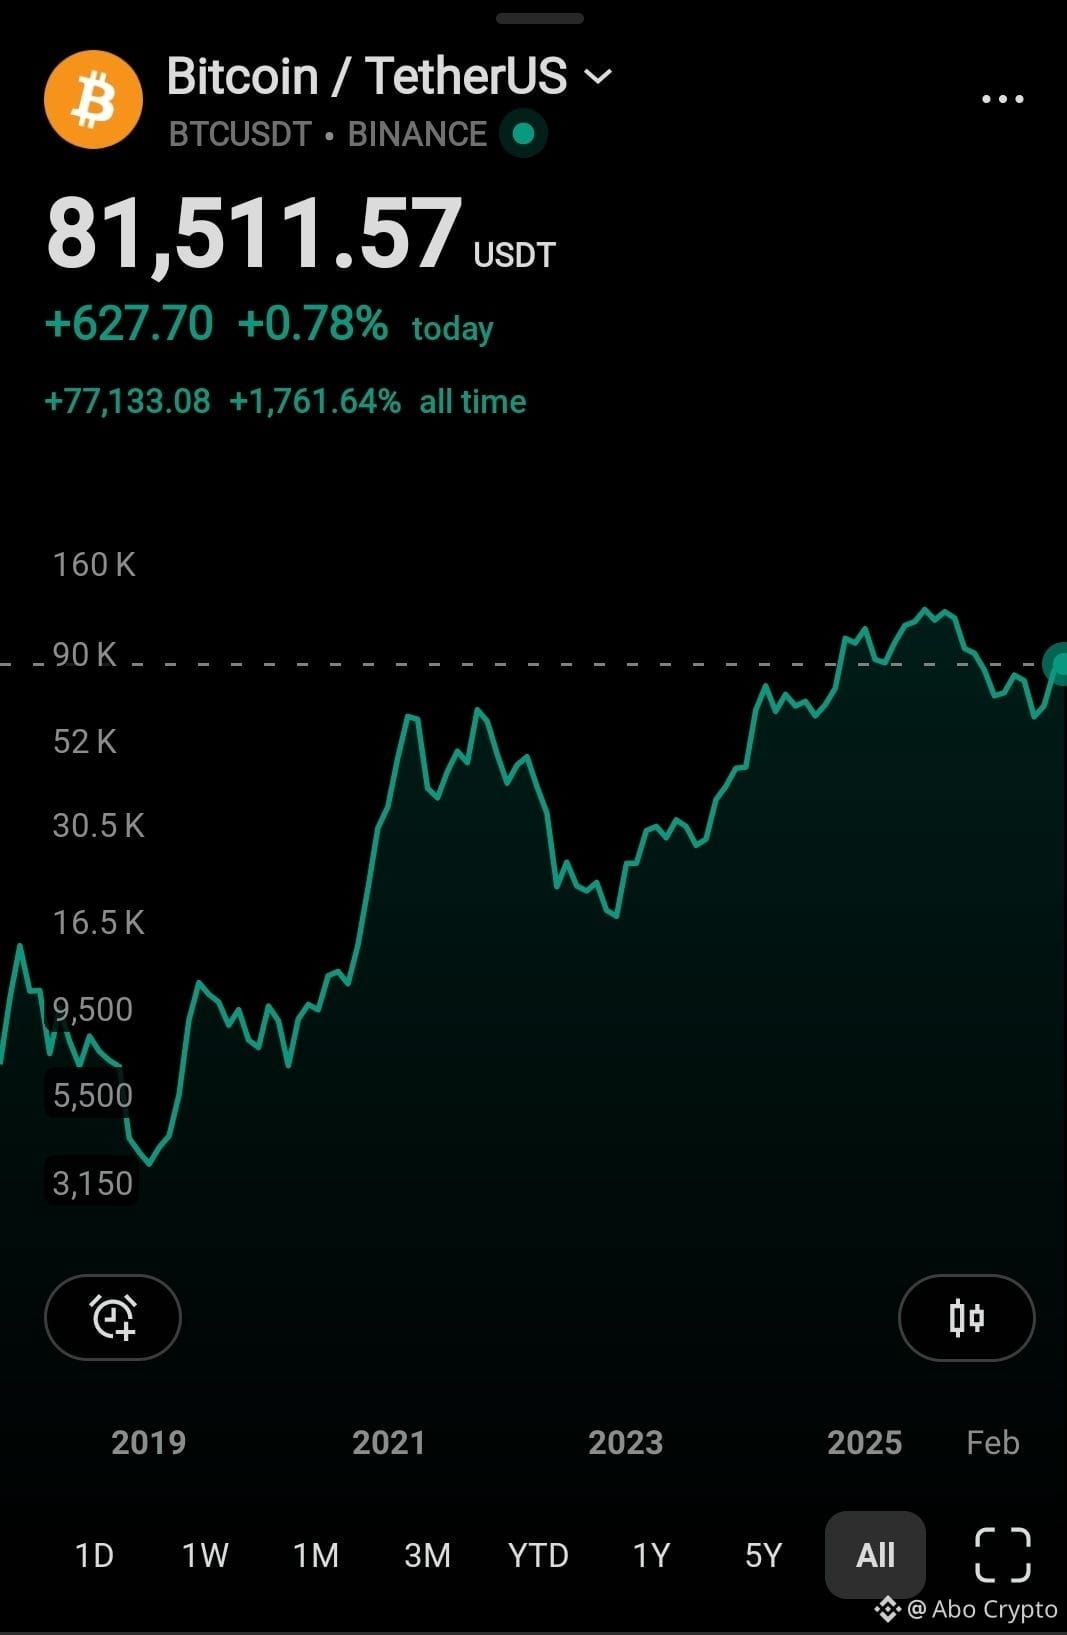
Even if the CLARITY Act fails and interest rates go up, they still couldn't push BTC below $60,000
What could actually push $BTC below $60K?
Give me just 3 reasons 👇
Even if the CLARITY Act fails and interest rates go up, they still couldn't push BTC below $60,000
What could actually push $BTC below $60K?
Give me just 3 reasons 👇
What could actually push $BTC below $60K?
Give me just 3 reasons 👇
1
720
·
--
Bullish
See translation
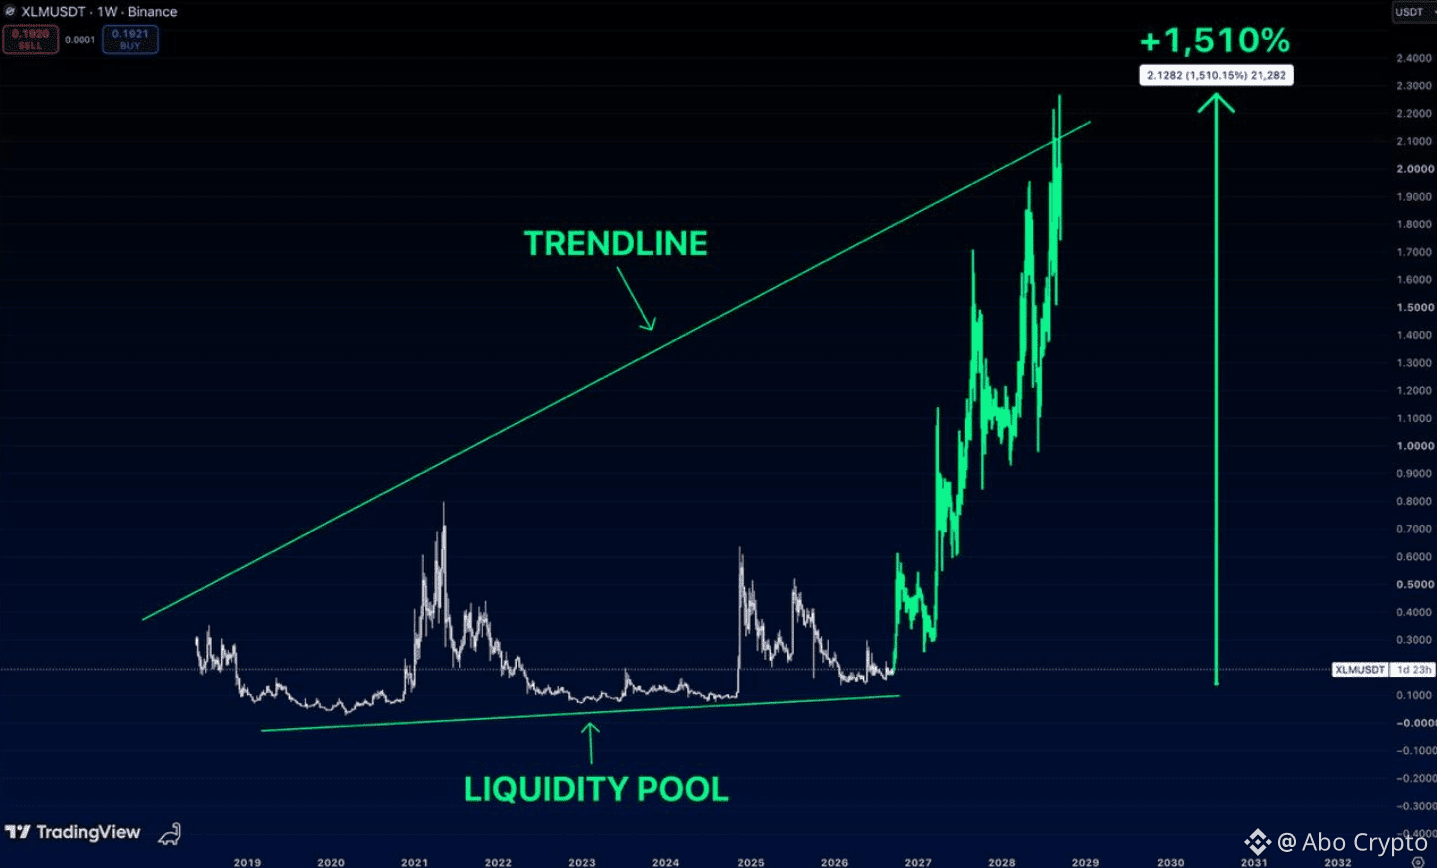
$XLM has survived every narrative shift crypto has thrown at it
Different market. Same pattern
Every major expansion started after $XLM spent an absurd amount of time doing absolutely nothing near the bottom
And that’s basically where the chart is sitting again
The long-term structure points toward the upper trendline, with the move shown on the chart reaching roughly $2.30
+1,510% from the projected base
Will it happen in a straight line? Obviously not
But this is exactly why I like charts like $XLM
You don’t need everyone to believe
You need everyone to believe later
$XLM has survived every narrative shift crypto has thrown at it
Different market. Same pattern
Every major expansion started after $XLM spent an absurd amount of time doing absolutely nothing near the bottom
And that’s basically where the chart is sitting again
The long-term structure points toward the upper trendline, with the move shown on the chart reaching roughly $2.30
+1,510% from the projected base
Will it happen in a straight line? Obviously not
But this is exactly why I like charts like $XLM
You don’t need everyone to believe
You need everyone to believe later
Different market. Same pattern
Every major expansion started after $XLM spent an absurd amount of time doing absolutely nothing near the bottom
And that’s basically where the chart is sitting again
The long-term structure points toward the upper trendline, with the move shown on the chart reaching roughly $2.30
+1,510% from the projected base
Will it happen in a straight line? Obviously not
But this is exactly why I like charts like $XLM
You don’t need everyone to believe
You need everyone to believe later
2
2k
·
--
Bullish
See translation
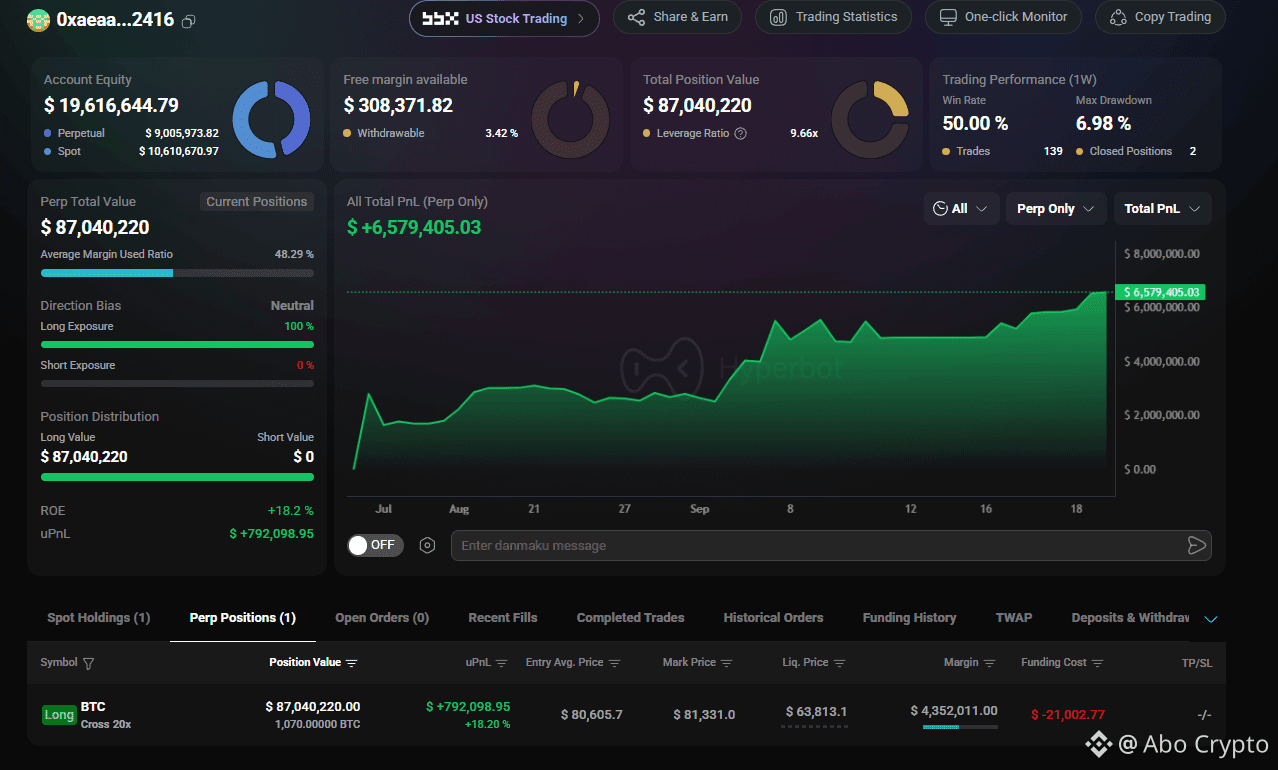
There’s a whale accumulating Bitcoin while everyone waits for confirmation is it ahead of the market?
At a time when many traders are still hesitant
this account chose to put a full $87 million into a long position on $BTC
But what caught my attention the most is that this whale hasn’t opened the trade yet
His position has been accumulating for months, and now, despite all the hype and fear in the market, it remains 100% long
There’s a whale accumulating Bitcoin while everyone waits for confirmation is it ahead of the market?
At a time when many traders are still hesitant
this account chose to put a full $87 million into a long position on $BTC
But what caught my attention the most is that this whale hasn’t opened the trade yet
His position has been accumulating for months, and now, despite all the hype and fear in the market, it remains 100% long
At a time when many traders are still hesitant
this account chose to put a full $87 million into a long position on $BTC
But what caught my attention the most is that this whale hasn’t opened the trade yet
His position has been accumulating for months, and now, despite all the hype and fear in the market, it remains 100% long
1
3
2.8k
·
--
Bullish
See translation
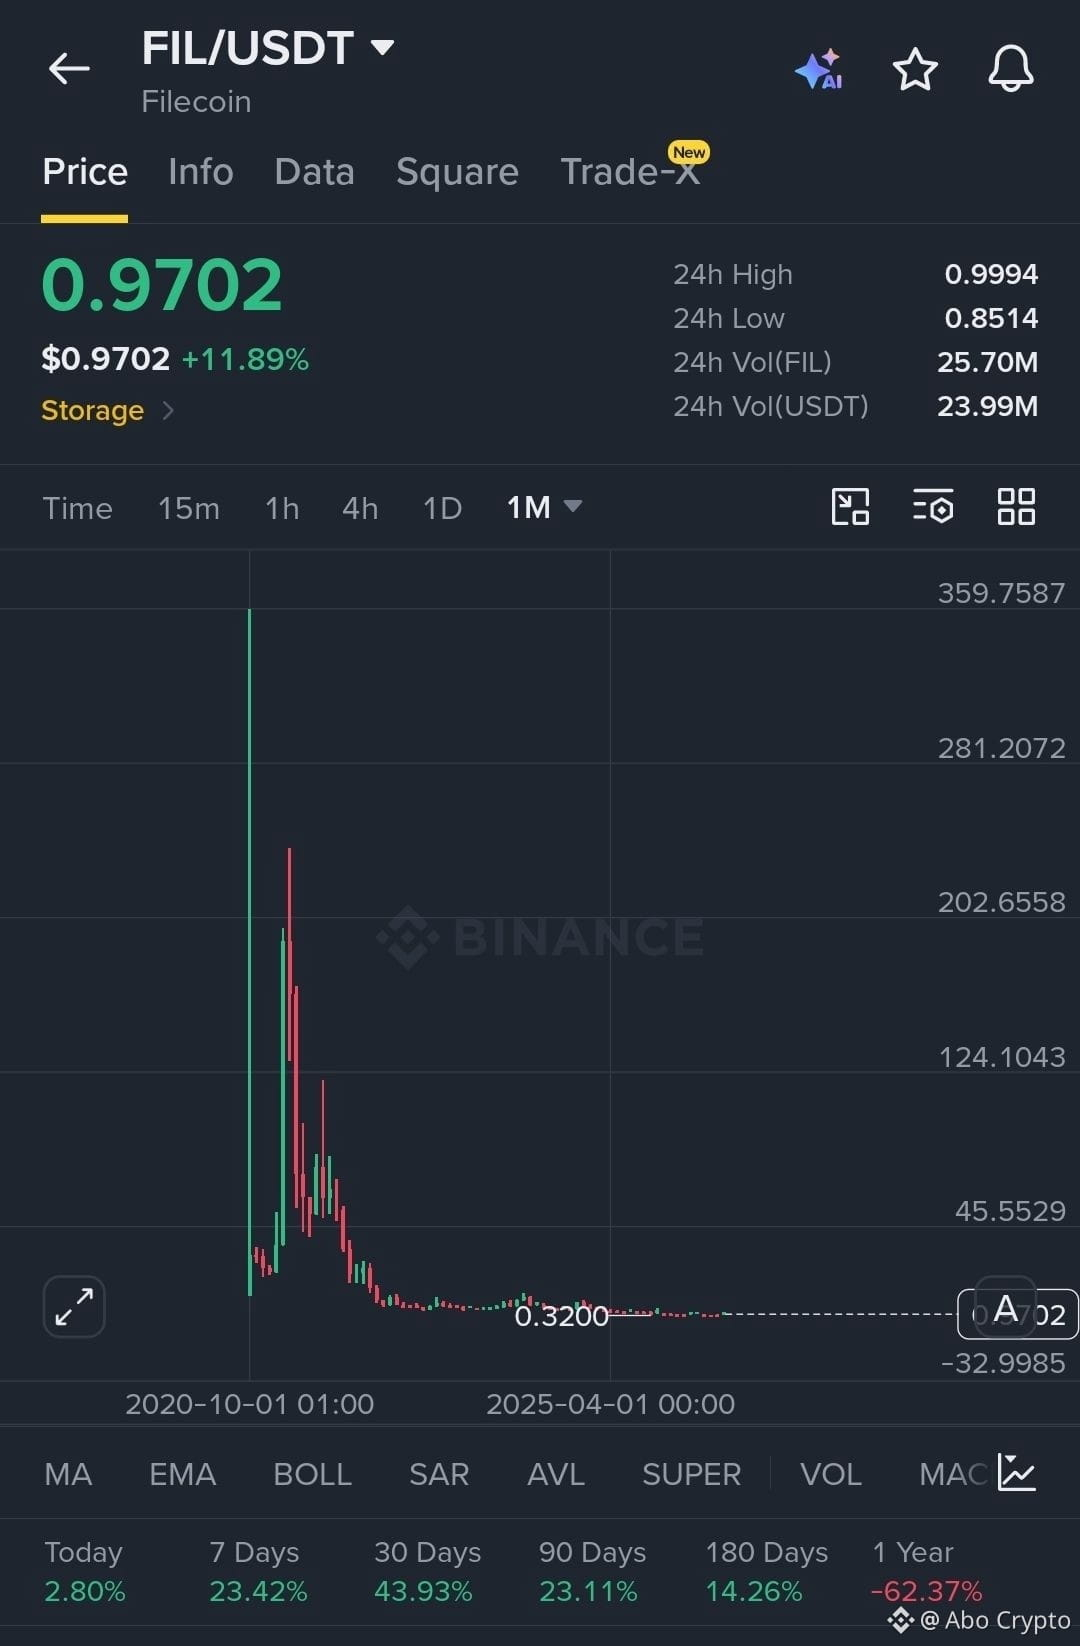
The $FIL token has lost 99.6% of its all time high, but what if this is the point where it all begins?
From around $237 ← to less than 1$
When most people see this chart, they say:
“The coin is done,” but there’s a completely different perspective
The price has spent years hovering near very low levels, yet FIL still exists and is trading on the market.
And today it’s around $0.97 which is still about 99.6% from its all time high
Now imagine this scenario
If FIL were to one day return to its historical ranges
We wouldn’t be talking about a 20% or 50% move
Even a return to $100 from around 1$ would mean roughly +10,000%
What about the scenario shown on the chart at $500?
Theoretically, that would mean a gain of more than +50,000% from these levels
But here we must distinguish between a scenario and a prediction
No one knows if FIL will even reach $500, and that’s exactly what makes the story exciting
People usually don’t pay attention to a coin when it’s at the bottom
They start talking about it when it goes up 5x, then 10x… Then the headlines start appearing
Why did FIL go up?
Is this the start of Altseason?
Did we miss the opportunity?
So the real question isn’t whether FIL will reach $500?
The question is: What if the market starts paying attention to it before the majority begins searching for it?
The $FIL token has lost 99.6% of its all time high, but what if this is the point where it all begins?
From around $237 ← to less than 1$
When most people see this chart, they say:
“The coin is done,” but there’s a completely different perspective
The price has spent years hovering near very low levels, yet FIL still exists and is trading on the market.
And today it’s around $0.97 which is still about 99.6% from its all time high
Now imagine this scenario
If FIL were to one day return to its historical ranges
We wouldn’t be talking about a 20% or 50% move
Even a return to $100 from around 1$ would mean roughly +10,000%
What about the scenario shown on the chart at $500?
Theoretically, that would mean a gain of more than +50,000% from these levels
But here we must distinguish between a scenario and a prediction
No one knows if FIL will even reach $500, and that’s exactly what makes the story exciting
People usually don’t pay attention to a coin when it’s at the bottom
They start talking about it when it goes up 5x, then 10x… Then the headlines start appearing
Why did FIL go up?
Is this the start of Altseason?
Did we miss the opportunity?
So the real question isn’t whether FIL will reach $500?
The question is: What if the market starts paying attention to it before the majority begins searching for it?
From around $237 ← to less than 1$
When most people see this chart, they say:
“The coin is done,” but there’s a completely different perspective
The price has spent years hovering near very low levels, yet FIL still exists and is trading on the market.
And today it’s around $0.97 which is still about 99.6% from its all time high
Now imagine this scenario
If FIL were to one day return to its historical ranges
We wouldn’t be talking about a 20% or 50% move
Even a return to $100 from around 1$ would mean roughly +10,000%
What about the scenario shown on the chart at $500?
Theoretically, that would mean a gain of more than +50,000% from these levels
But here we must distinguish between a scenario and a prediction
No one knows if FIL will even reach $500, and that’s exactly what makes the story exciting
People usually don’t pay attention to a coin when it’s at the bottom
They start talking about it when it goes up 5x, then 10x… Then the headlines start appearing
Why did FIL go up?
Is this the start of Altseason?
Did we miss the opportunity?
So the real question isn’t whether FIL will reach $500?
The question is: What if the market starts paying attention to it before the majority begins searching for it?
5
14
9.3k
·
--
Bullish
See translation
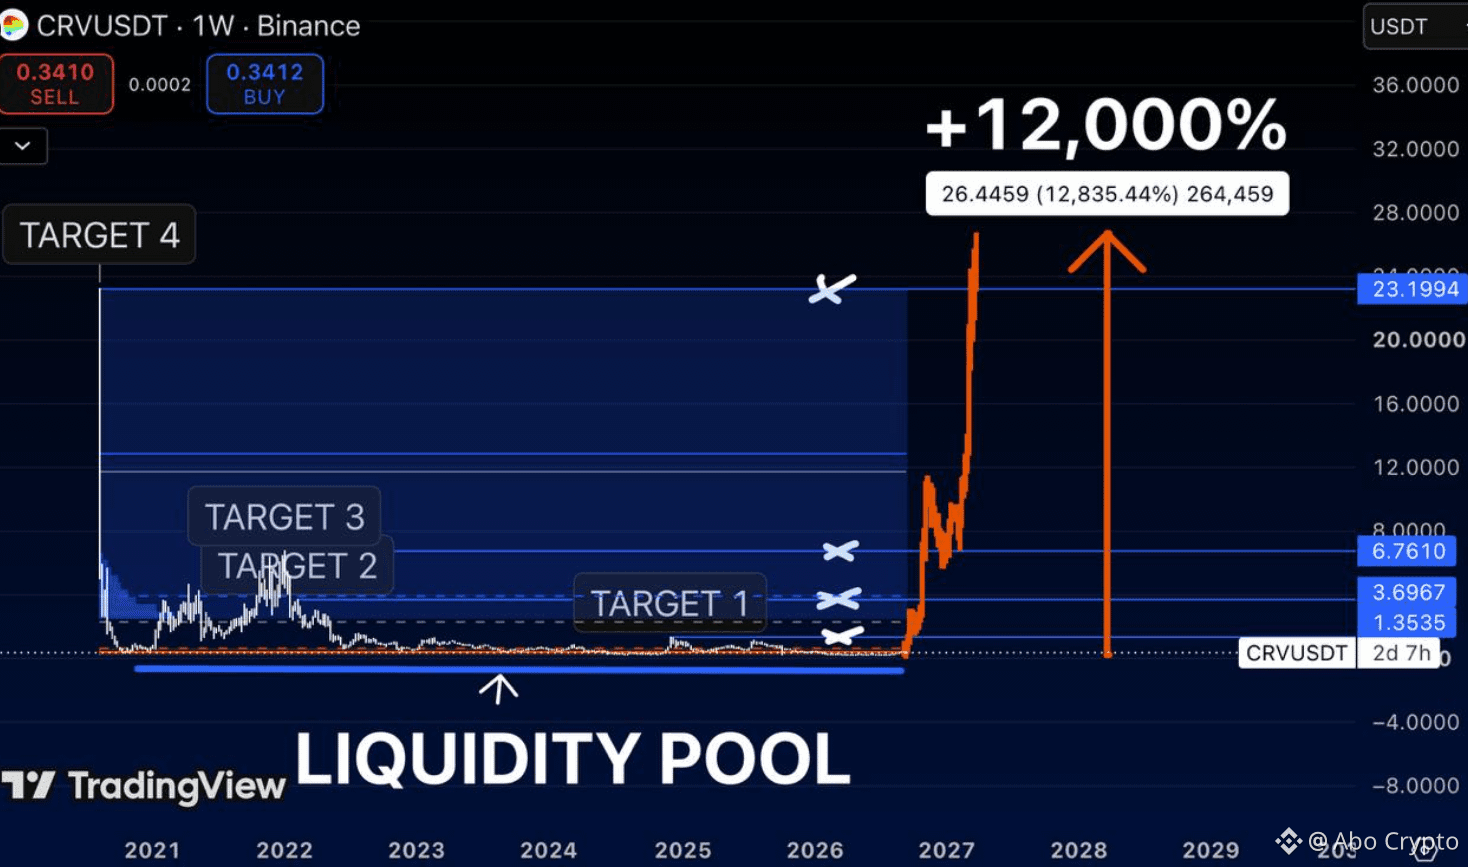
$CRV is one of those charts people ignore because it looks completely dead
That’s usually when I start paying attention
For years, price has been compressed near the same liquidity zone
while almost all of the old structure sits above us
The levels I’m watching:
$1.35 → $3.69 → $6.76 → $23.19
Each one opens another part of the old range
And from the lows to the full expansion shown on the chart?
+12,000%
Sounds ridiculous when $CRV is sitting around $0.34
But every huge move sounds ridiculous before it happens
I’m not interested in chasing it after the candles turn vertical
I’m interested in the part where nobody gives a shit yet
$CRV is one of those charts people ignore because it looks completely dead
That’s usually when I start paying attention
For years, price has been compressed near the same liquidity zone
while almost all of the old structure sits above us
The levels I’m watching:
$1.35 → $3.69 → $6.76 → $23.19
Each one opens another part of the old range
And from the lows to the full expansion shown on the chart?
+12,000%
Sounds ridiculous when $CRV is sitting around $0.34
But every huge move sounds ridiculous before it happens
I’m not interested in chasing it after the candles turn vertical
I’m interested in the part where nobody gives a shit yet
That’s usually when I start paying attention
For years, price has been compressed near the same liquidity zone
while almost all of the old structure sits above us
The levels I’m watching:
$1.35 → $3.69 → $6.76 → $23.19
Each one opens another part of the old range
And from the lows to the full expansion shown on the chart?
+12,000%
Sounds ridiculous when $CRV is sitting around $0.34
But every huge move sounds ridiculous before it happens
I’m not interested in chasing it after the candles turn vertical
I’m interested in the part where nobody gives a shit yet
1
162
·
--
See translation
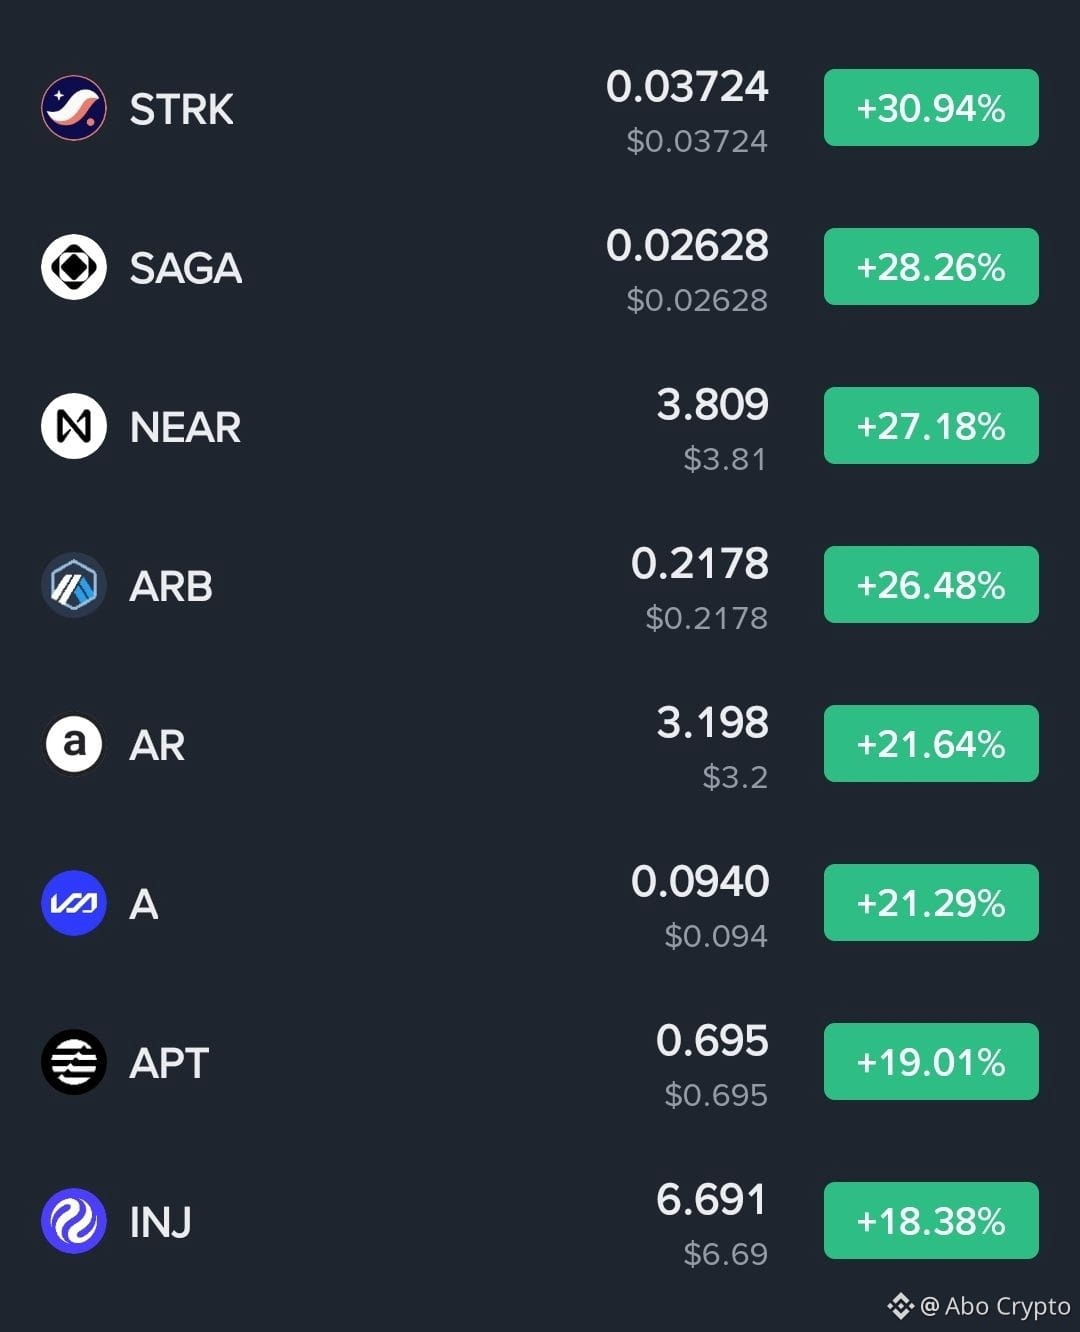
what are the chances that this is the start of the altcoin season?
what are the chances that this is the start of the altcoin season?
8
27
29.2k
·
--
Bullish
See translation
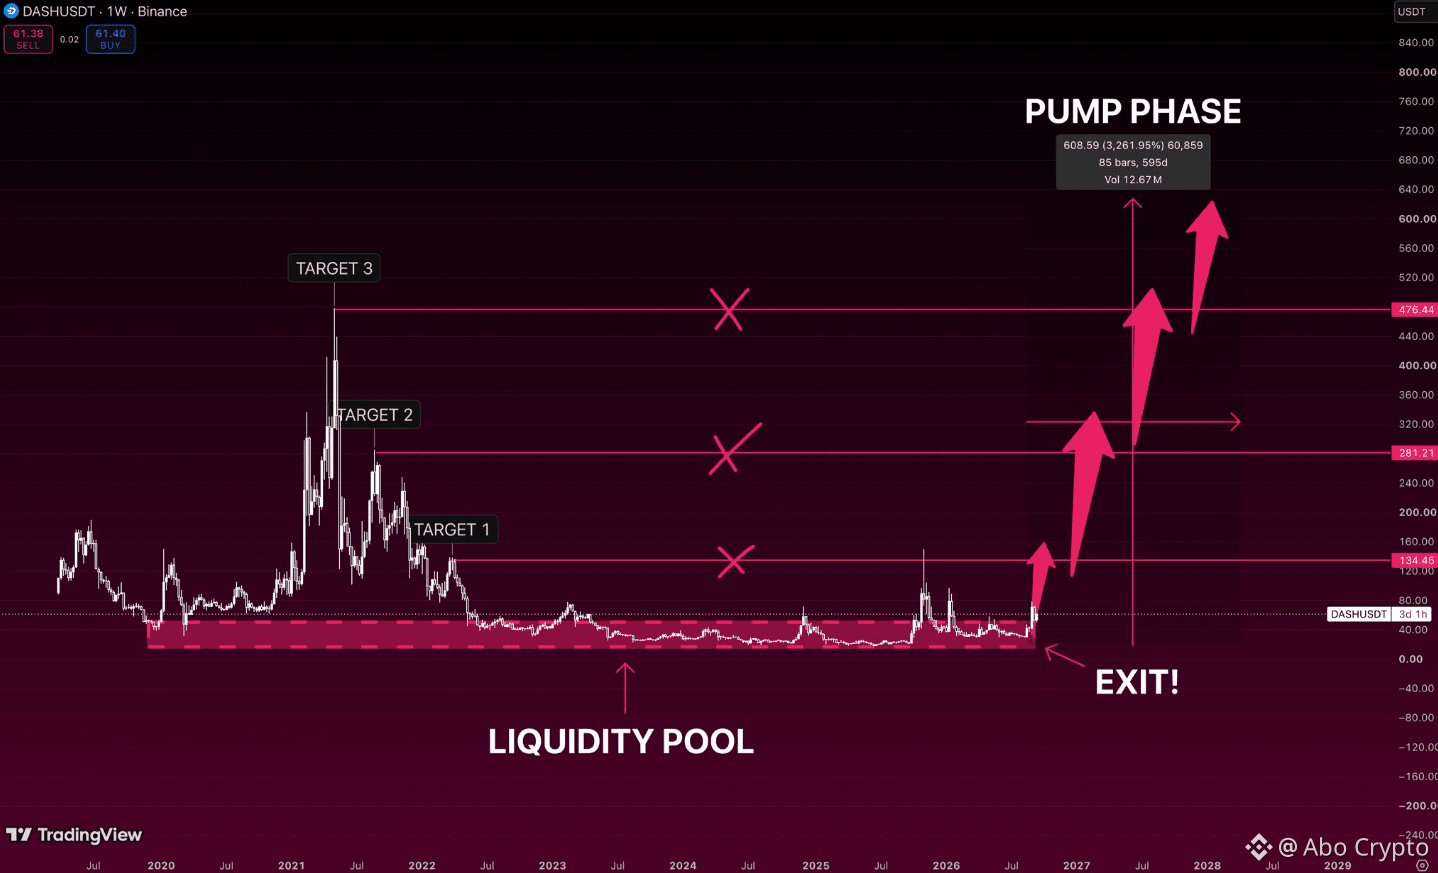
$DASH is doing something most people won’t notice until it’s already obvious
For years, price kept returning to the same liquidity pool
Every rally got sold
Every bit of excitement disappeared
And now $DASH is finally trying to leave that zone behind
That changes the conversation
The old structure gives us three levels that actually matter:
$134 → $281 → $476
Above that, the chart opens into a completely different regime
The full pump phase drawn here reaches roughly $600+
over 3,000% from the base of the move
The funny part? People will call
$DASH “interesting” again at $300
The chart was interesting while everyone had forgotten it existed
$DASH is doing something most people won’t notice until it’s already obvious
For years, price kept returning to the same liquidity pool
Every rally got sold
Every bit of excitement disappeared
And now $DASH is finally trying to leave that zone behind
That changes the conversation
The old structure gives us three levels that actually matter:
$134 → $281 → $476
Above that, the chart opens into a completely different regime
The full pump phase drawn here reaches roughly $600+
over 3,000% from the base of the move
The funny part? People will call
$DASH “interesting” again at $300
The chart was interesting while everyone had forgotten it existed
For years, price kept returning to the same liquidity pool
Every rally got sold
Every bit of excitement disappeared
And now $DASH is finally trying to leave that zone behind
That changes the conversation
The old structure gives us three levels that actually matter:
$134 → $281 → $476
Above that, the chart opens into a completely different regime
The full pump phase drawn here reaches roughly $600+
over 3,000% from the base of the move
The funny part? People will call
$DASH “interesting” again at $300
The chart was interesting while everyone had forgotten it existed
2
1
7
7.4k
·
--
See translation
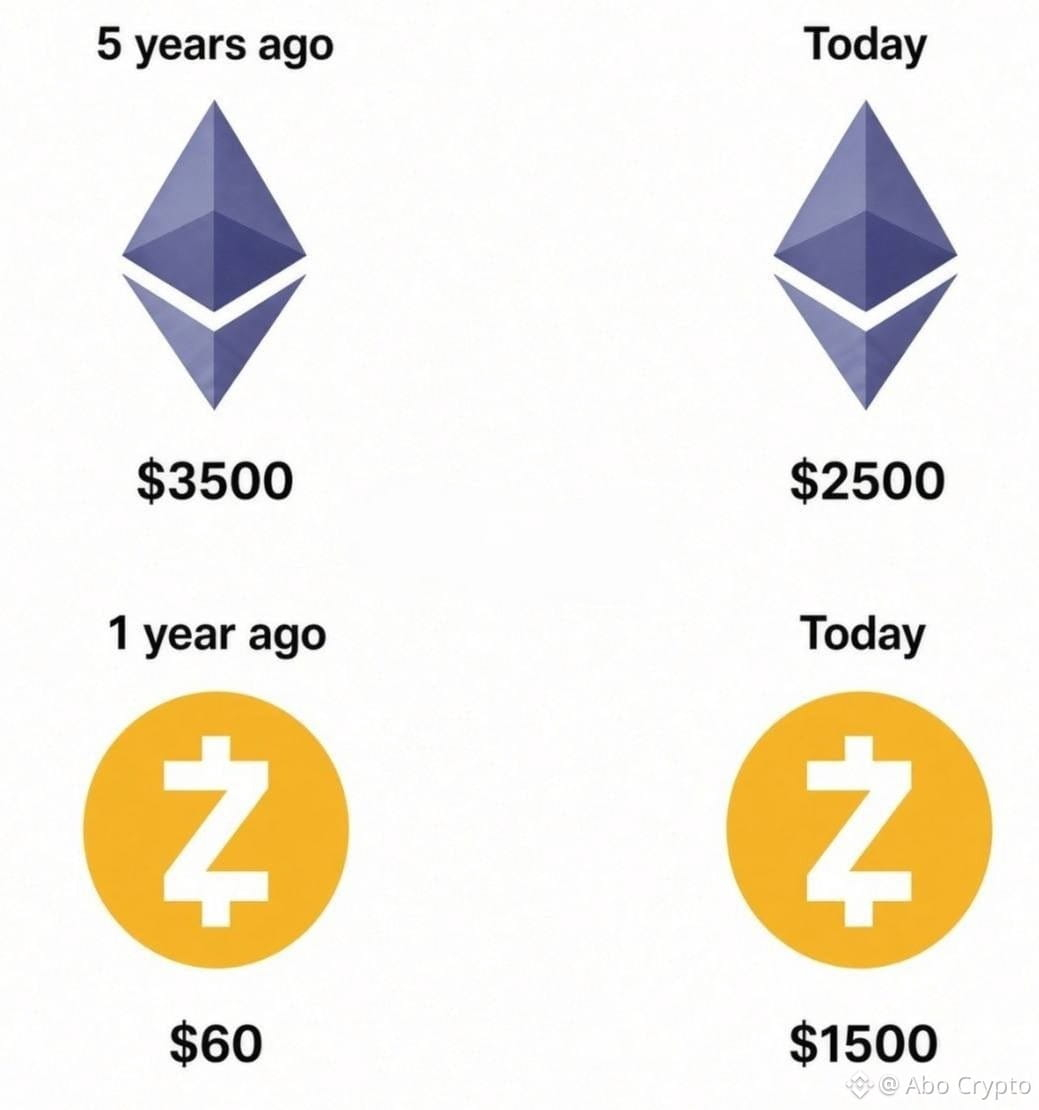
$4,000 invested in $ETH 5 years ago is now worth $2,850
$4,000 invested in $ZEC 1 year ago is now worth $100,000
Privacy is power. What people don’t know, they can’t ruin
$4,000 invested in $ETH 5 years ago is now worth $2,850
$4,000 invested in $ZEC 1 year ago is now worth $100,000
Privacy is power. What people don’t know, they can’t ruin
$4,000 invested in $ZEC 1 year ago is now worth $100,000
Privacy is power. What people don’t know, they can’t ruin
1
425
Log in to explore more content
Join global crypto users on Binance Square
⚡️ Get latest and useful information about crypto.
💬 Trusted by the world’s largest crypto exchange.
👍 Discover real insights from verified creators.
Email / Phone number
Trending Topics
SaylorHintsStrategyBitcoinBuy
2.2M views
11,574 Discussing
SAYLOR MAY HAVE BOUGHT MORE $BTC !
Michael Saylor reposted the chart he regularly shares on Sundays. #SaylorHintsStrategyBitcoinBuy
This means that the more orange dots there are, the more buying is taking place. He reposted this today.
He’ll most likely make another substantial purchase. We’ve mentioned before just how significant these purchases are. He holds nearly as much #Bitcoin as Satoshi does.
I think these purchases need to stop at some point and he might even start selling. Do you think this single hand dominance will ever end?
Kripto Kurdu
·9 Likes
·2.4k views
BOJRaisesRatesTo31YearHigh
188,808 views
2,778 Discussing
BuffettStepsDownAsBerkshireChairman
91,716 views
1,445 Discussing