
Ab_CryptoTrading
5.5k Posts

Ab_CryptoTrading
 Square Verified+
Report
Block User
Opportunity Creator🔮 || Full Time Crypto Trader💰 || Free Daily Trades ✅ || Web 3 👨💻 ||Promoter 💎 || Day Trader 📊 || UID 21517050
Open Trade
Occasional Trader
8.8 Years
7.6K+ Following
32.7K+ Followers
28.2K+ Liked
Posts
Portfolio
All
Quotes
Videos
Live
PINNED
Verified
See translation
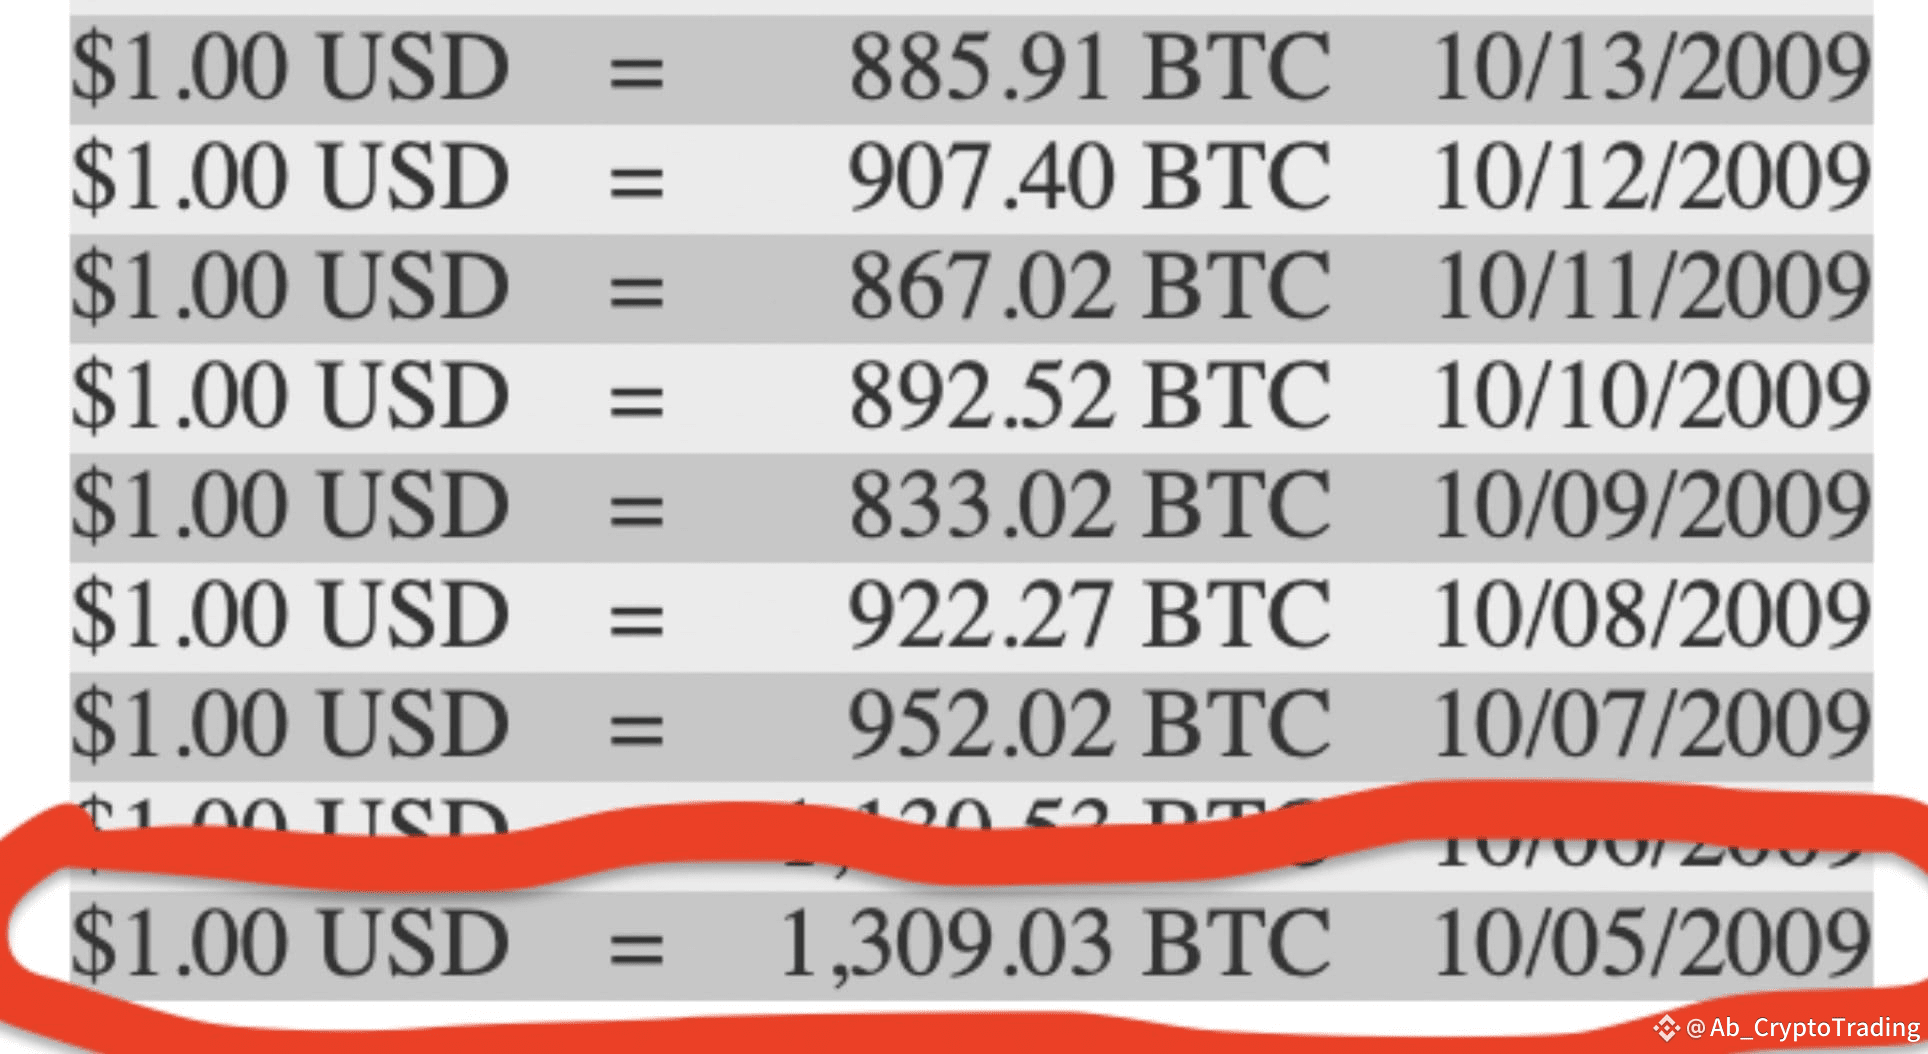
16 years ago, You could buy 1,309 #Bitcoin for $1
$1 = 1,309 BTC 🤯 $BTC
$USDT 1
#BTC 1,309
#BTCReclaims120K
#BNBBreaksATH
#Write2Earn
16 years ago, You could buy 1,309 #Bitcoin for $1
$1 = 1,309 BTC 🤯 $BTC
$USDT 1
#BTC 1,309
#BTCReclaims120K
#BNBBreaksATH
#Write2Earn
$1 = 1,309 BTC 🤯 $BTC
$USDT 1
#BTC 1,309
#BTCReclaims120K
#BNBBreaksATH
#Write2Earn
366
258
870
141.7k
PINNED
See translation
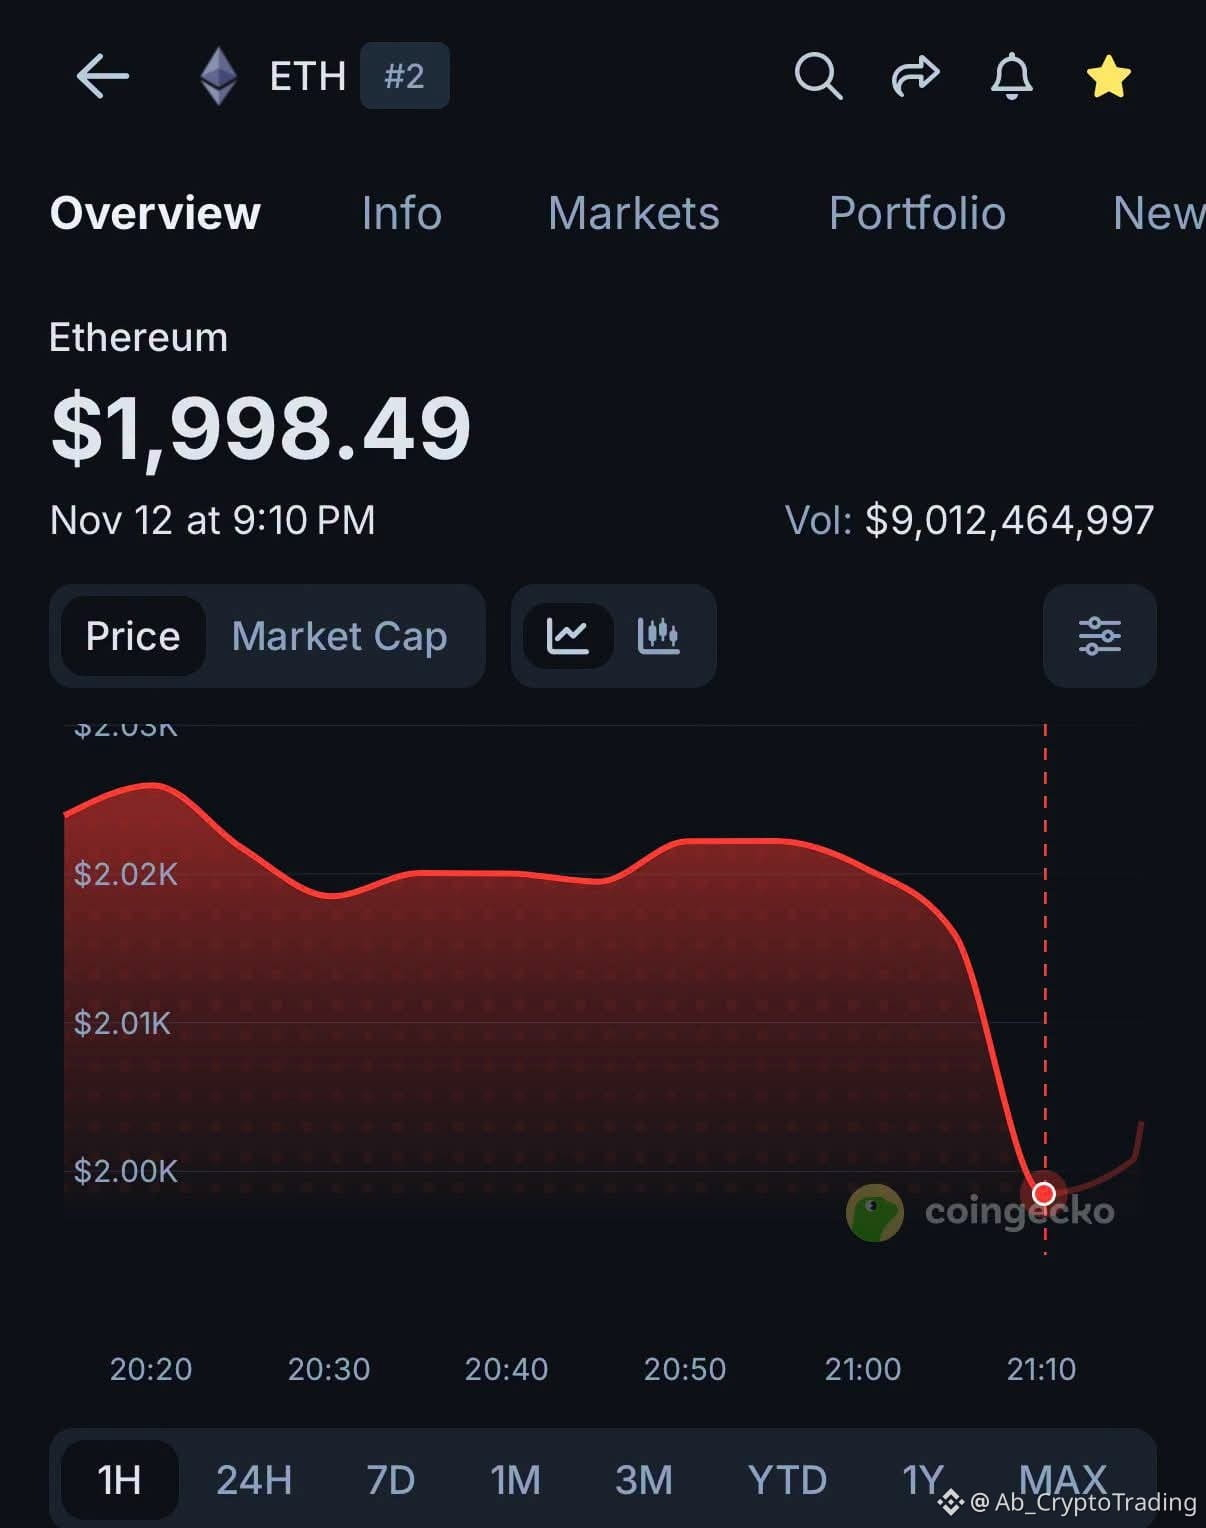
Everyone here is excited.
Why?
$80K $BTC on a Sunday.
But if you’re smart,
You know what this signals.
Let me break it down:
Next week is primed to be EVEN MORE bullish.
Why?
Weekends are typically low-volume,
Low-interest,
And often where pullbacks show up.
But the fact that we’re pushing this high on a weekend???
It’s a signal that buyers are piling in.
Now imagine what happens when the weekday volume kicks in.
When the big players return,
With more eyes on the charts and more liquidity flowing in.
This isn’t just a run-up;
It’s the setup for something much bigger.
Watch closely,
This is how breakouts become parabolic moves.$BTC #BTCBreaks80KATH #BIOProtocol #FedRateStrategy #EthereumRally #Write2Earn!
Everyone here is excited.
Why?
$80K $BTC on a Sunday.
But if you’re smart,
You know what this signals.
Let me break it down:
Next week is primed to be EVEN MORE bullish.
Why?
Weekends are typically low-volume,
Low-interest,
And often where pullbacks show up.
But the fact that we’re pushing this high on a weekend???
It’s a signal that buyers are piling in.
Now imagine what happens when the weekday volume kicks in.
When the big players return,
With more eyes on the charts and more liquidity flowing in.
This isn’t just a run-up;
It’s the setup for something much bigger.
Watch closely,
This is how breakouts become parabolic moves.$BTC #BTCBreaks80KATH #BIOProtocol #FedRateStrategy #EthereumRally #Write2Earn!
Why?
$80K $BTC on a Sunday.
But if you’re smart,
You know what this signals.
Let me break it down:
Next week is primed to be EVEN MORE bullish.
Why?
Weekends are typically low-volume,
Low-interest,
And often where pullbacks show up.
But the fact that we’re pushing this high on a weekend???
It’s a signal that buyers are piling in.
Now imagine what happens when the weekday volume kicks in.
When the big players return,
With more eyes on the charts and more liquidity flowing in.
This isn’t just a run-up;
It’s the setup for something much bigger.
Watch closely,
This is how breakouts become parabolic moves.$BTC #BTCBreaks80KATH #BIOProtocol #FedRateStrategy #EthereumRally #Write2Earn!
116
36
605
348.6k
1
188
See translation
🐸 IS PEPE ABOUT TO MAKE ANOTHER EXPLOSIVE MOVE?
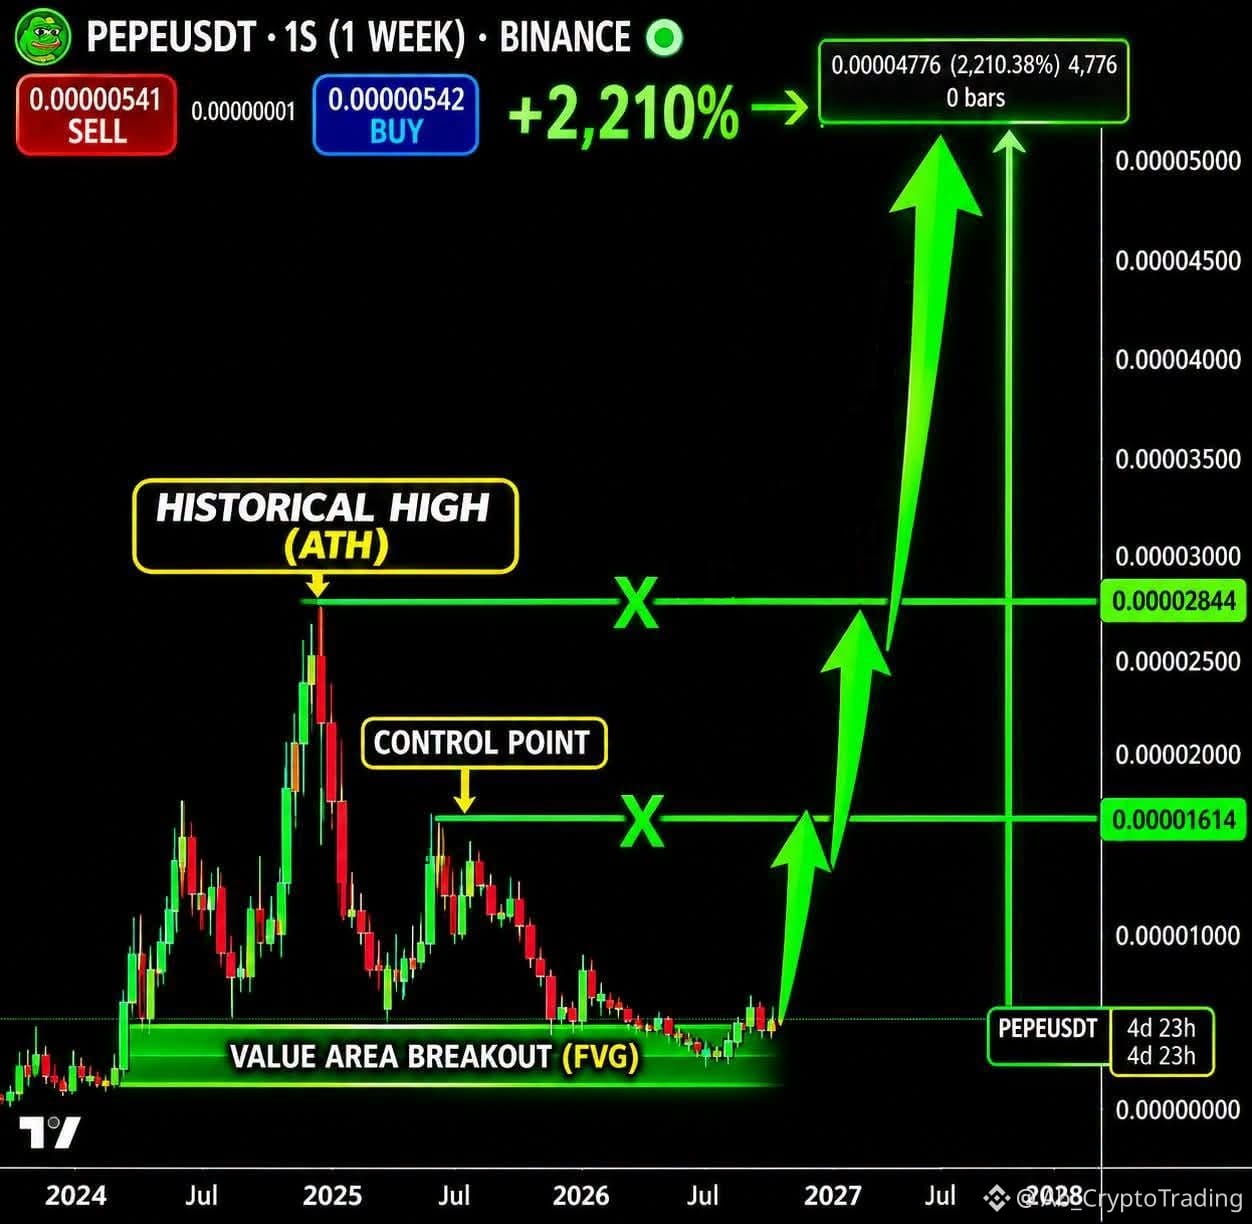
$PEPE is back on the radar, and this chart is pointing to a potentially massive upside scenario.
The projected move? +2,210% 🚀
But let's be realistic: a chart projection is not a guarantee, especially in the highly volatile memecoin market.
Here's the question:
🔥 If $PEPE started breaking above its key resistance levels, how far do you think it could realistically go?
1️⃣ +100% — A solid rally
2️⃣ +500% — A major comeback
3️⃣ +1,000% or more — Another legendary memecoin run
4️⃣ No chance — The hype is already priced in
And be honest…
Would you buy $PEPE at current levels, or is the risk simply too high?
👇 Drop your prediction. Let's see who's bullish and who's staying
away.
#PEPE #AnthropicRejectsIPODelayValuationinQuestion #CanNvidiaEarningsEaseMarketConcerns? #Write2Earn #Write2Earn!
🐸 IS PEPE ABOUT TO MAKE ANOTHER EXPLOSIVE MOVE?
$PEPE is back on the radar, and this chart is pointing to a potentially massive upside scenario.
The projected move? +2,210% 🚀
But let's be realistic: a chart projection is not a guarantee, especially in the highly volatile memecoin market.
Here's the question:
🔥 If $PEPE started breaking above its key resistance levels, how far do you think it could realistically go?
1️⃣ +100% — A solid rally
2️⃣ +500% — A major comeback
3️⃣ +1,000% or more — Another legendary memecoin run
4️⃣ No chance — The hype is already priced in
And be honest…
Would you buy $PEPE at current levels, or is the risk simply too high?
👇 Drop your prediction. Let's see who's bullish and who's staying
away.
#PEPE #AnthropicRejectsIPODelayValuationinQuestion #CanNvidiaEarningsEaseMarketConcerns? #Write2Earn #Write2Earn!
$PEPE is back on the radar, and this chart is pointing to a potentially massive upside scenario.
The projected move? +2,210% 🚀
But let's be realistic: a chart projection is not a guarantee, especially in the highly volatile memecoin market.
Here's the question:
🔥 If $PEPE started breaking above its key resistance levels, how far do you think it could realistically go?
1️⃣ +100% — A solid rally
2️⃣ +500% — A major comeback
3️⃣ +1,000% or more — Another legendary memecoin run
4️⃣ No chance — The hype is already priced in
And be honest…
Would you buy $PEPE at current levels, or is the risk simply too high?
👇 Drop your prediction. Let's see who's bullish and who's staying
away.
#PEPE #AnthropicRejectsIPODelayValuationinQuestion #CanNvidiaEarningsEaseMarketConcerns? #Write2Earn #Write2Earn!
1
260
See translation
🚨 ETHEREUM: $1,440 OR $7,000… WHICH SIDE OF THIS CHART ARE YOU ON? 👀
Most people are focused on Ethereum's next short-term move.
But the monthly chart raises a much bigger question:
What if the market is building another major cycle bottom before its next expansion?
Look at the structure:
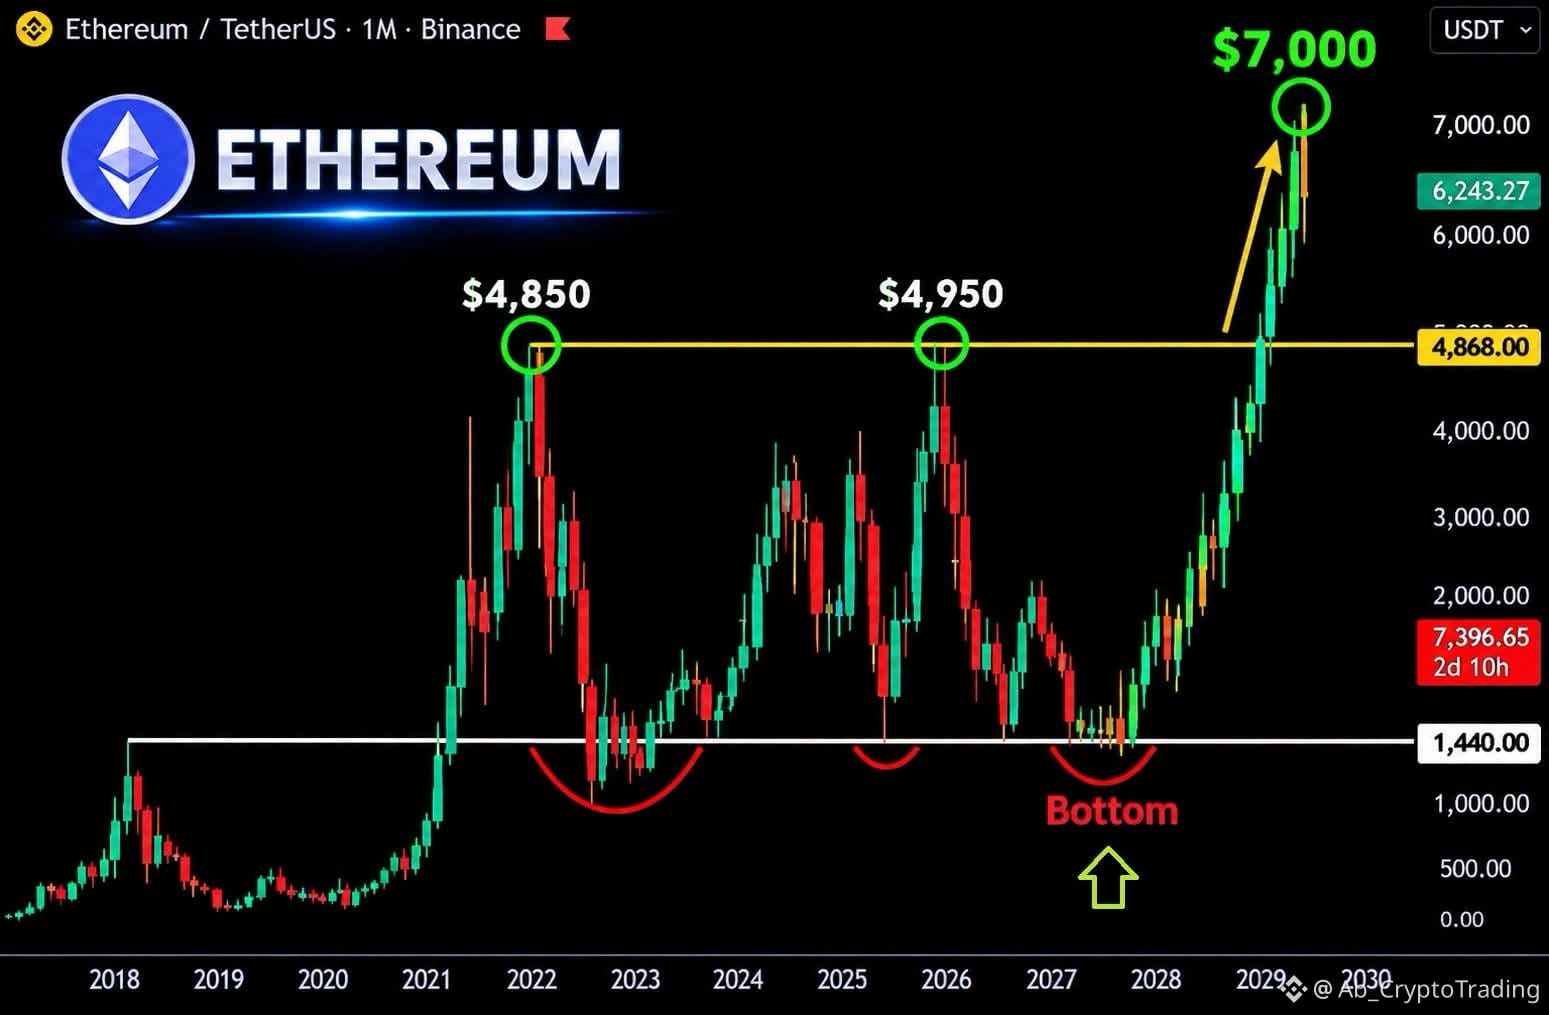
🔹 $4,850–$4,950: Two major historical highs that created a significant resistance zone.
🔹 $1,440: A critical long-term support area that has attracted attention across multiple market cycles.
🔹 2027 scenario: If $ETH revisits this support region, holds it, and confirms a new bullish structure, it could potentially establish the foundation for another major expansion.
🔹 Long-term target: Under this bullish scenario, a move toward $4,950 and eventually $7,000 becomes a possibility worth discussing.
But here's where I want to challenge both sides.
To the bears: Are you assuming Ethereum's best days are behind it, or do you have evidence that its long-term market structure has permanently changed?
To the bulls: What makes you confident that ETH can reclaim its previous highs and go beyond them?
And most importantly, what would prove your current thesis wrong?
I'm not saying $1,440 must be the bottom, and $7,000 is certainly not guaranteed. This is a long-term scenario that needs confirmation at every stage.
Let's make this interesting:
1️⃣ Is Ethereum still capable of reaching $7,000 in a future cycle?
2️⃣ Would a revisit to $1,440 represent a generational buying opportunity or a warning sign?
3️⃣ Has ETH lost its competitive advantage, or is the market underestimating its long-term potential?
4️⃣ If you had to choose one: Would you rather accumulate ETH during a major correction or wait for a confirmed breakout above $4,950?
I want actual arguments, not just price predictions.
Bullish, bearish, or somewhere in between — defend your view.
Let's see which thesis has the stronger evidence. 👇
#ETH #AnthropicRejectsIPODelayValuationinQuestion #Write2Earn #Write2Earn! #Ethereum
🚨 ETHEREUM: $1,440 OR $7,000… WHICH SIDE OF THIS CHART ARE YOU ON? 👀
Most people are focused on Ethereum's next short-term move.
But the monthly chart raises a much bigger question:
What if the market is building another major cycle bottom before its next expansion?
Look at the structure:
🔹 $4,850–$4,950: Two major historical highs that created a significant resistance zone.
🔹 $1,440: A critical long-term support area that has attracted attention across multiple market cycles.
🔹 2027 scenario: If $ETH revisits this support region, holds it, and confirms a new bullish structure, it could potentially establish the foundation for another major expansion.
🔹 Long-term target: Under this bullish scenario, a move toward $4,950 and eventually $7,000 becomes a possibility worth discussing.
But here's where I want to challenge both sides.
To the bears: Are you assuming Ethereum's best days are behind it, or do you have evidence that its long-term market structure has permanently changed?
To the bulls: What makes you confident that ETH can reclaim its previous highs and go beyond them?
And most importantly, what would prove your current thesis wrong?
I'm not saying $1,440 must be the bottom, and $7,000 is certainly not guaranteed. This is a long-term scenario that needs confirmation at every stage.
Let's make this interesting:
1️⃣ Is Ethereum still capable of reaching $7,000 in a future cycle?
2️⃣ Would a revisit to $1,440 represent a generational buying opportunity or a warning sign?
3️⃣ Has ETH lost its competitive advantage, or is the market underestimating its long-term potential?
4️⃣ If you had to choose one: Would you rather accumulate ETH during a major correction or wait for a confirmed breakout above $4,950?
I want actual arguments, not just price predictions.
Bullish, bearish, or somewhere in between — defend your view.
Let's see which thesis has the stronger evidence. 👇
#ETH #AnthropicRejectsIPODelayValuationinQuestion #Write2Earn #Write2Earn! #Ethereum
Most people are focused on Ethereum's next short-term move.
But the monthly chart raises a much bigger question:
What if the market is building another major cycle bottom before its next expansion?
Look at the structure:
🔹 $4,850–$4,950: Two major historical highs that created a significant resistance zone.
🔹 $1,440: A critical long-term support area that has attracted attention across multiple market cycles.
🔹 2027 scenario: If $ETH revisits this support region, holds it, and confirms a new bullish structure, it could potentially establish the foundation for another major expansion.
🔹 Long-term target: Under this bullish scenario, a move toward $4,950 and eventually $7,000 becomes a possibility worth discussing.
But here's where I want to challenge both sides.
To the bears: Are you assuming Ethereum's best days are behind it, or do you have evidence that its long-term market structure has permanently changed?
To the bulls: What makes you confident that ETH can reclaim its previous highs and go beyond them?
And most importantly, what would prove your current thesis wrong?
I'm not saying $1,440 must be the bottom, and $7,000 is certainly not guaranteed. This is a long-term scenario that needs confirmation at every stage.
Let's make this interesting:
1️⃣ Is Ethereum still capable of reaching $7,000 in a future cycle?
2️⃣ Would a revisit to $1,440 represent a generational buying opportunity or a warning sign?
3️⃣ Has ETH lost its competitive advantage, or is the market underestimating its long-term potential?
4️⃣ If you had to choose one: Would you rather accumulate ETH during a major correction or wait for a confirmed breakout above $4,950?
I want actual arguments, not just price predictions.
Bullish, bearish, or somewhere in between — defend your view.
Let's see which thesis has the stronger evidence. 👇
#ETH #AnthropicRejectsIPODelayValuationinQuestion #Write2Earn #Write2Earn! #Ethereum
1
121
See translation
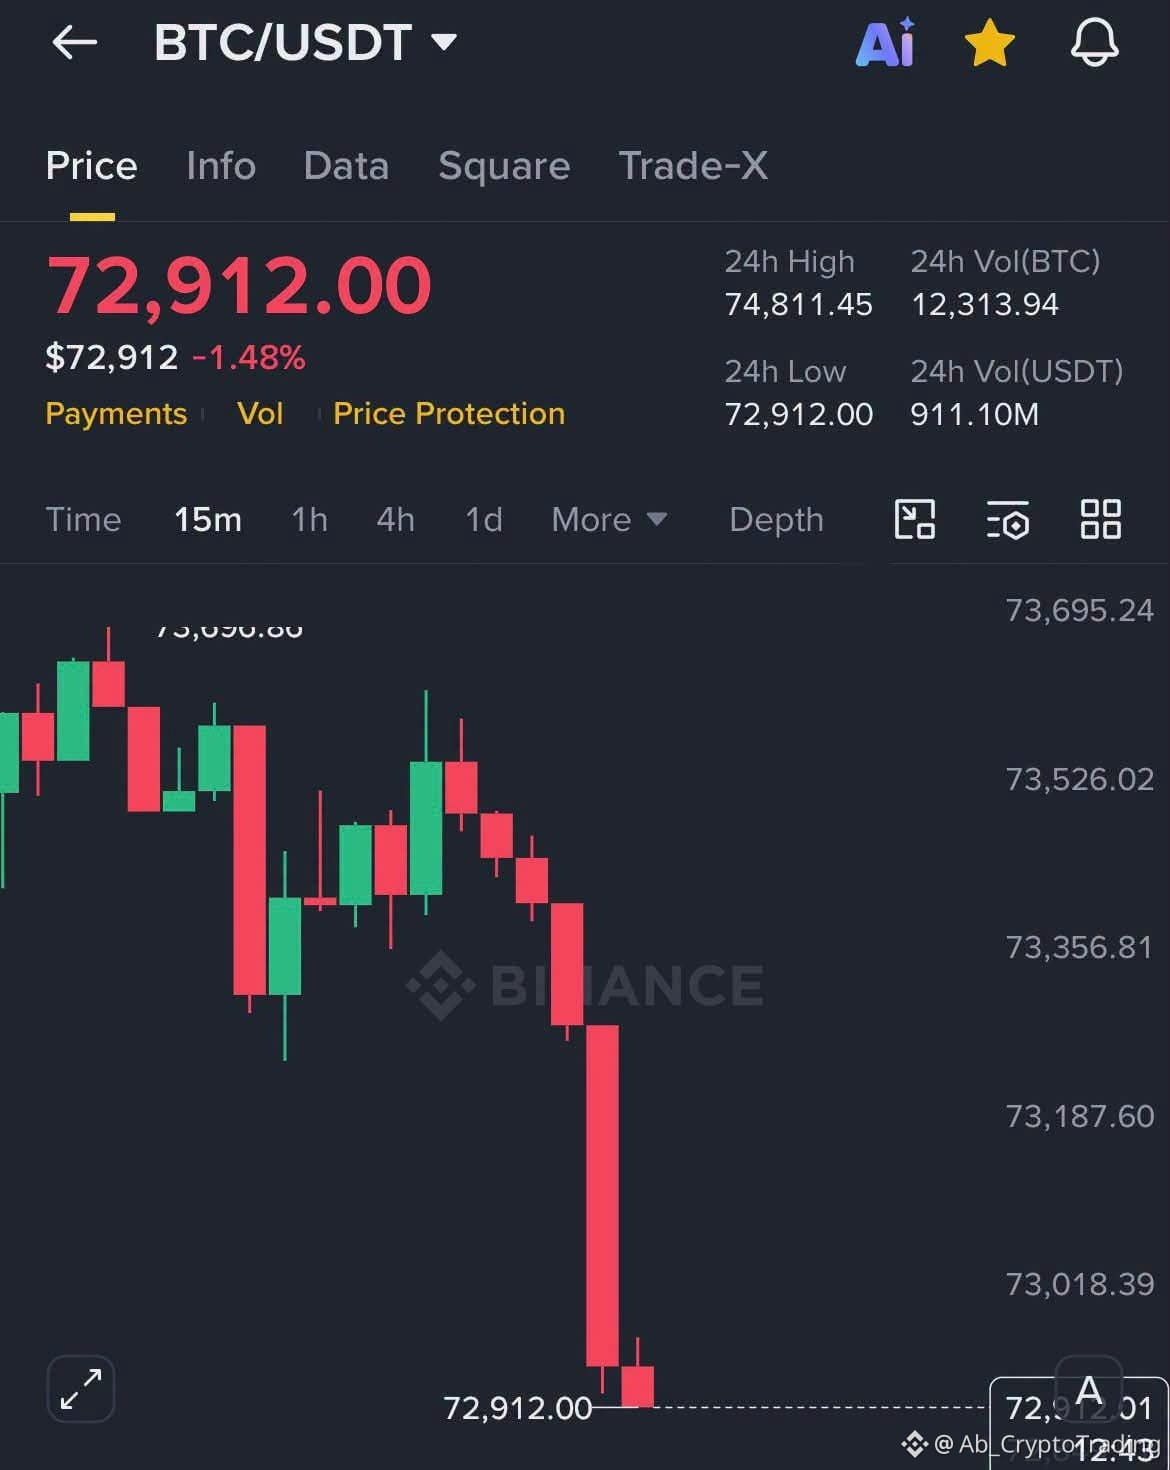
🚨 BITCOIN IS DOWN AGAIN…
First, we had CEO scandals.
Now Bitcoin is bleeding too. 😂
At this point, I have to ask:
Did Satoshi cheat on his wife too, or why is everyone dumping Bitcoin? 💀
$BTC doesn't even have a CEO, a public face, or a known personal life… and somehow it still gets dragged into the drama.
😂 What's next? A breakup announcement from the Bitcoin blockchain?
Wall Street really needs to calm down. 👇
#AnthropicRejectsIPODelayValuationinQuestion #CanNvidiaEarningsEaseMarketConcerns? #CoreWeaveJumps10%On168%RevenueGrowth #HuangRisksOusterOverReportedAffairWithSubordinate #BTC
🚨 BITCOIN IS DOWN AGAIN…
First, we had CEO scandals.
Now Bitcoin is bleeding too. 😂
At this point, I have to ask:
Did Satoshi cheat on his wife too, or why is everyone dumping Bitcoin? 💀
$BTC doesn't even have a CEO, a public face, or a known personal life… and somehow it still gets dragged into the drama.
😂 What's next? A breakup announcement from the Bitcoin blockchain?
Wall Street really needs to calm down. 👇
#AnthropicRejectsIPODelayValuationinQuestion #CanNvidiaEarningsEaseMarketConcerns? #CoreWeaveJumps10%On168%RevenueGrowth #HuangRisksOusterOverReportedAffairWithSubordinate #BTC
First, we had CEO scandals.
Now Bitcoin is bleeding too. 😂
At this point, I have to ask:
Did Satoshi cheat on his wife too, or why is everyone dumping Bitcoin? 💀
$BTC doesn't even have a CEO, a public face, or a known personal life… and somehow it still gets dragged into the drama.
😂 What's next? A breakup announcement from the Bitcoin blockchain?
Wall Street really needs to calm down. 👇
#AnthropicRejectsIPODelayValuationinQuestion #CanNvidiaEarningsEaseMarketConcerns? #CoreWeaveJumps10%On168%RevenueGrowth #HuangRisksOusterOverReportedAffairWithSubordinate #BTC
2
124
See translation
🚨 $BTC : ARE WE WATCHING A REPEAT OF THE 2023 STRUCTURE?
One of the most interesting things about market analysis is that price doesn't always repeat the same moves, but certain structures can offer valuable clues.
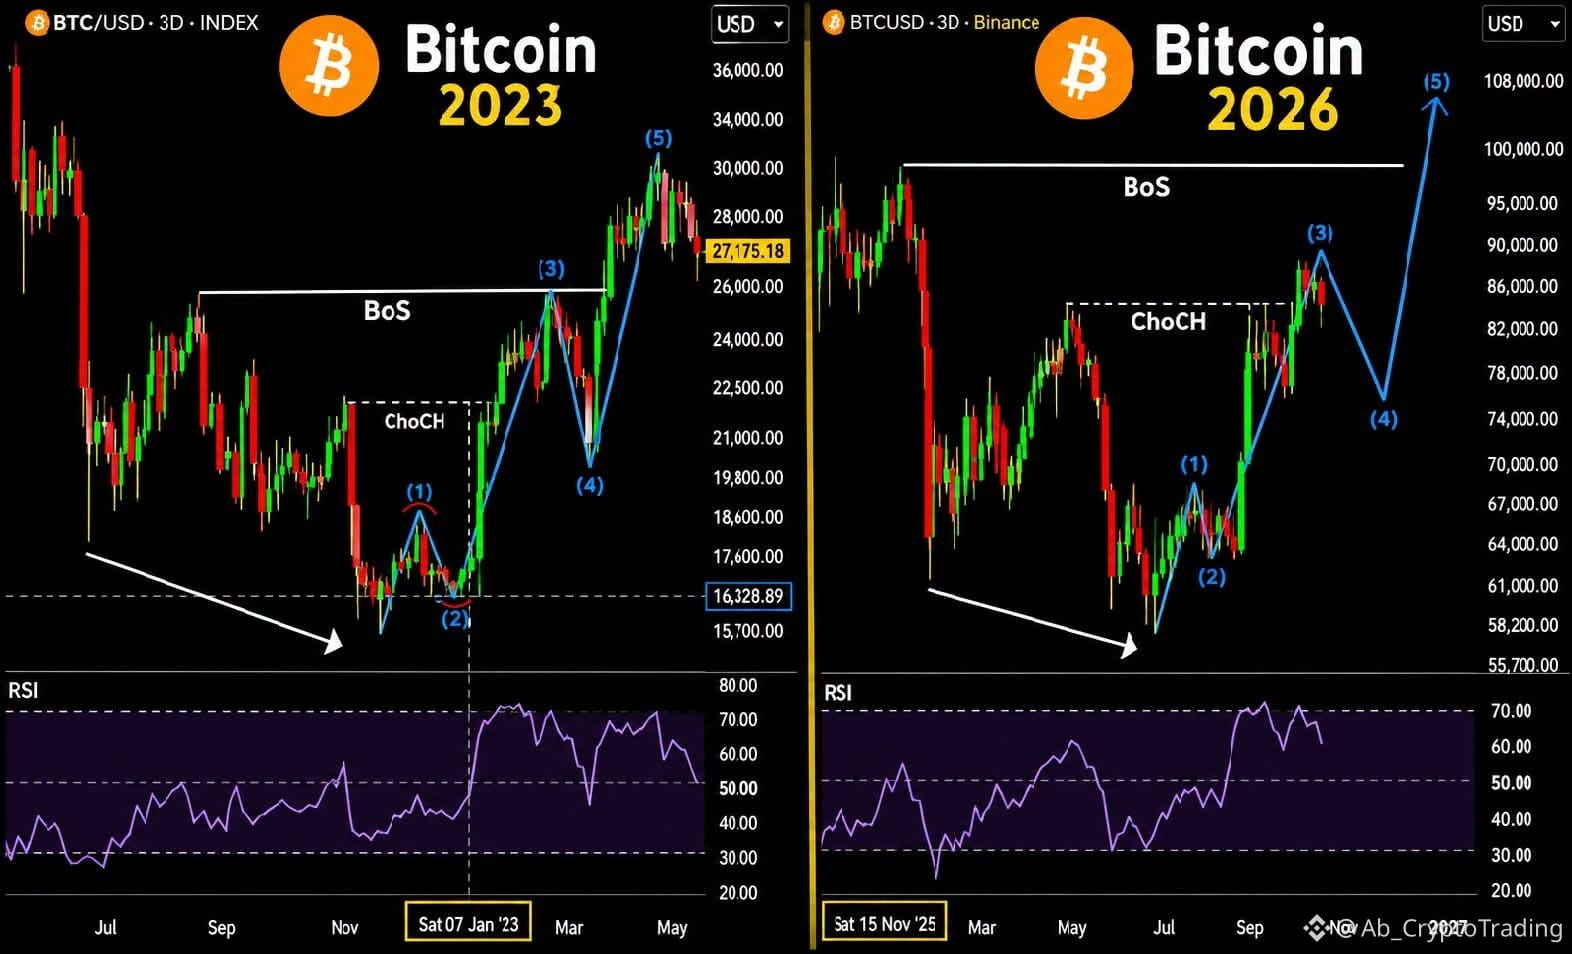
Looking at this comparison between Bitcoin's 2023 price action and its current 2026 structure, there are some similarities worth discussing.
In 2023, Bitcoin went through a major decline, established a potential bottom, shifted its market structure with a Change of Character (CHoCH), and eventually broke resistance (BoS) before continuing higher.
Now, the 2026 chart presents a potentially comparable structure.
Here's one scenario I'm considering:
- Bitcoin continues to respect its developing bullish structure.
- A corrective Wave (4) develops, potentially bringing price back toward the $73K–$75K area.
- If that zone holds and bullish momentum returns, another expansion toward the $100K–$108K region could become a possibility.
But let's be clear: this is a scenario, not a prediction or a guaranteed outcome.
The comparison becomes invalid if price loses important structural support and fails to reclaim it.
What matters most is not drawing similar-looking patterns, but watching whether price actually confirms the structure.
I'd like to hear different perspectives on this:
1. Do you see a meaningful similarity between the 2023 and 2026 structures, or is this just a visual coincidence?
2. Is a Wave (4) correction toward $73K–$75K reasonable before another potential leg higher?
3. What price level would invalidate this bullish scenario for you?
4. Do you think Bitcoin still has room for a move toward $100K+ in this cycle?
You don't have to agree with the bullish scenario. A well-supported bearish argument is just as valuable.
Let's compare market structures, not just price targets. What's your Elliott Wave count? 👇
#HotCPIDecemberHikePriced #AnthropicRejectsIPODelayValuationinQuestion #BTC #Binance #bitcoin
🚨 $BTC : ARE WE WATCHING A REPEAT OF THE 2023 STRUCTURE?
One of the most interesting things about market analysis is that price doesn't always repeat the same moves, but certain structures can offer valuable clues.
Looking at this comparison between Bitcoin's 2023 price action and its current 2026 structure, there are some similarities worth discussing.
In 2023, Bitcoin went through a major decline, established a potential bottom, shifted its market structure with a Change of Character (CHoCH), and eventually broke resistance (BoS) before continuing higher.
Now, the 2026 chart presents a potentially comparable structure.
Here's one scenario I'm considering:
- Bitcoin continues to respect its developing bullish structure.
- A corrective Wave (4) develops, potentially bringing price back toward the $73K–$75K area.
- If that zone holds and bullish momentum returns, another expansion toward the $100K–$108K region could become a possibility.
But let's be clear: this is a scenario, not a prediction or a guaranteed outcome.
The comparison becomes invalid if price loses important structural support and fails to reclaim it.
What matters most is not drawing similar-looking patterns, but watching whether price actually confirms the structure.
I'd like to hear different perspectives on this:
1. Do you see a meaningful similarity between the 2023 and 2026 structures, or is this just a visual coincidence?
2. Is a Wave (4) correction toward $73K–$75K reasonable before another potential leg higher?
3. What price level would invalidate this bullish scenario for you?
4. Do you think Bitcoin still has room for a move toward $100K+ in this cycle?
You don't have to agree with the bullish scenario. A well-supported bearish argument is just as valuable.
Let's compare market structures, not just price targets. What's your Elliott Wave count? 👇
#HotCPIDecemberHikePriced #AnthropicRejectsIPODelayValuationinQuestion #BTC #Binance #bitcoin
One of the most interesting things about market analysis is that price doesn't always repeat the same moves, but certain structures can offer valuable clues.
Looking at this comparison between Bitcoin's 2023 price action and its current 2026 structure, there are some similarities worth discussing.
In 2023, Bitcoin went through a major decline, established a potential bottom, shifted its market structure with a Change of Character (CHoCH), and eventually broke resistance (BoS) before continuing higher.
Now, the 2026 chart presents a potentially comparable structure.
Here's one scenario I'm considering:
- Bitcoin continues to respect its developing bullish structure.
- A corrective Wave (4) develops, potentially bringing price back toward the $73K–$75K area.
- If that zone holds and bullish momentum returns, another expansion toward the $100K–$108K region could become a possibility.
But let's be clear: this is a scenario, not a prediction or a guaranteed outcome.
The comparison becomes invalid if price loses important structural support and fails to reclaim it.
What matters most is not drawing similar-looking patterns, but watching whether price actually confirms the structure.
I'd like to hear different perspectives on this:
1. Do you see a meaningful similarity between the 2023 and 2026 structures, or is this just a visual coincidence?
2. Is a Wave (4) correction toward $73K–$75K reasonable before another potential leg higher?
3. What price level would invalidate this bullish scenario for you?
4. Do you think Bitcoin still has room for a move toward $100K+ in this cycle?
You don't have to agree with the bullish scenario. A well-supported bearish argument is just as valuable.
Let's compare market structures, not just price targets. What's your Elliott Wave count? 👇
#HotCPIDecemberHikePriced #AnthropicRejectsIPODelayValuationinQuestion #BTC #Binance #bitcoin
3
132
See translation
🚨 CRYPTO UNDER PRESSURE: BTC, ETH, XLM & ADA — WHAT COMES NEXT? 📉
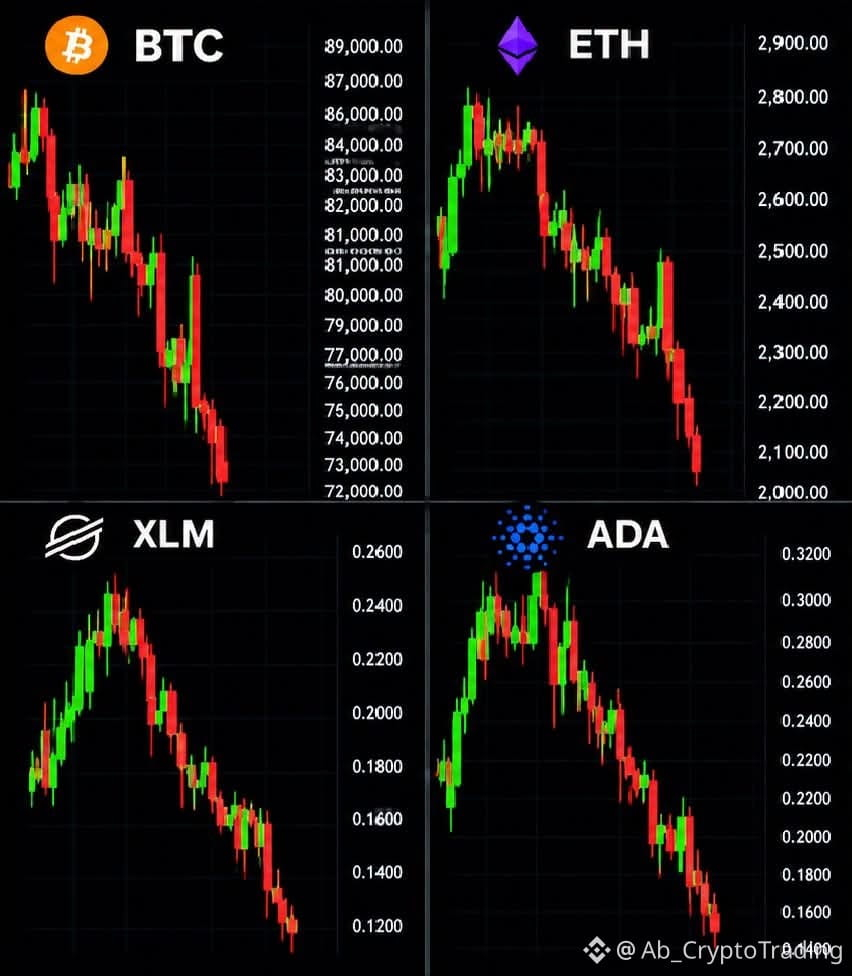
The latest price action across these four major crypto assets is raising some important questions.
Bitcoin is facing renewed selling pressure, Ethereum is struggling to hold higher levels, while Stellar (XLM) and Cardano (ADA) are showing significant weakness.
What's particularly interesting is that the selling isn't isolated to one asset. We're seeing weakness across both major cryptocurrencies and established altcoins.
Here are the key questions I'm watching:
🔹 $BTC : Is this a deeper correction, or could buyers defend the current support area?
🔹 $ETH : Can Ethereum regain momentum, or is further downside still a possibility?
🔹 $XLM : Is the recent decline creating an accumulation opportunity, or does the chart suggest more weakness ahead?
🔹 $ADA : What would it take for Cardano to reverse its current bearish structure?
I'm not calling a bottom just because prices are lower. Confirmation from price action and buying volume will matter.
Let's hear your take:
- Are you buying this dip or staying on the sidelines?
- Which of these four assets has the strongest recovery potential?
- Do you believe the broader crypto bull cycle is still intact?
Share your analysis and the levels you're watching. Let's compare perspectives.
#HotCPIDecemberHikePriced #AnthropicRejectsIPODelayValuationinQuestion #BTC #ETH #ADA
🚨 CRYPTO UNDER PRESSURE: BTC, ETH, XLM & ADA — WHAT COMES NEXT? 📉
The latest price action across these four major crypto assets is raising some important questions.
Bitcoin is facing renewed selling pressure, Ethereum is struggling to hold higher levels, while Stellar (XLM) and Cardano (ADA) are showing significant weakness.
What's particularly interesting is that the selling isn't isolated to one asset. We're seeing weakness across both major cryptocurrencies and established altcoins.
Here are the key questions I'm watching:
🔹 $BTC : Is this a deeper correction, or could buyers defend the current support area?
🔹 $ETH : Can Ethereum regain momentum, or is further downside still a possibility?
🔹 $XLM : Is the recent decline creating an accumulation opportunity, or does the chart suggest more weakness ahead?
🔹 $ADA : What would it take for Cardano to reverse its current bearish structure?
I'm not calling a bottom just because prices are lower. Confirmation from price action and buying volume will matter.
Let's hear your take:
- Are you buying this dip or staying on the sidelines?
- Which of these four assets has the strongest recovery potential?
- Do you believe the broader crypto bull cycle is still intact?
Share your analysis and the levels you're watching. Let's compare perspectives.
#HotCPIDecemberHikePriced #AnthropicRejectsIPODelayValuationinQuestion #BTC #ETH #ADA
The latest price action across these four major crypto assets is raising some important questions.
Bitcoin is facing renewed selling pressure, Ethereum is struggling to hold higher levels, while Stellar (XLM) and Cardano (ADA) are showing significant weakness.
What's particularly interesting is that the selling isn't isolated to one asset. We're seeing weakness across both major cryptocurrencies and established altcoins.
Here are the key questions I'm watching:
🔹 $BTC : Is this a deeper correction, or could buyers defend the current support area?
🔹 $ETH : Can Ethereum regain momentum, or is further downside still a possibility?
🔹 $XLM : Is the recent decline creating an accumulation opportunity, or does the chart suggest more weakness ahead?
🔹 $ADA : What would it take for Cardano to reverse its current bearish structure?
I'm not calling a bottom just because prices are lower. Confirmation from price action and buying volume will matter.
Let's hear your take:
- Are you buying this dip or staying on the sidelines?
- Which of these four assets has the strongest recovery potential?
- Do you believe the broader crypto bull cycle is still intact?
Share your analysis and the levels you're watching. Let's compare perspectives.
#HotCPIDecemberHikePriced #AnthropicRejectsIPODelayValuationinQuestion #BTC #ETH #ADA
1
128
See translation
₿ What if Bitcoin's next major cycle follows a very different timeline than most investors expect?
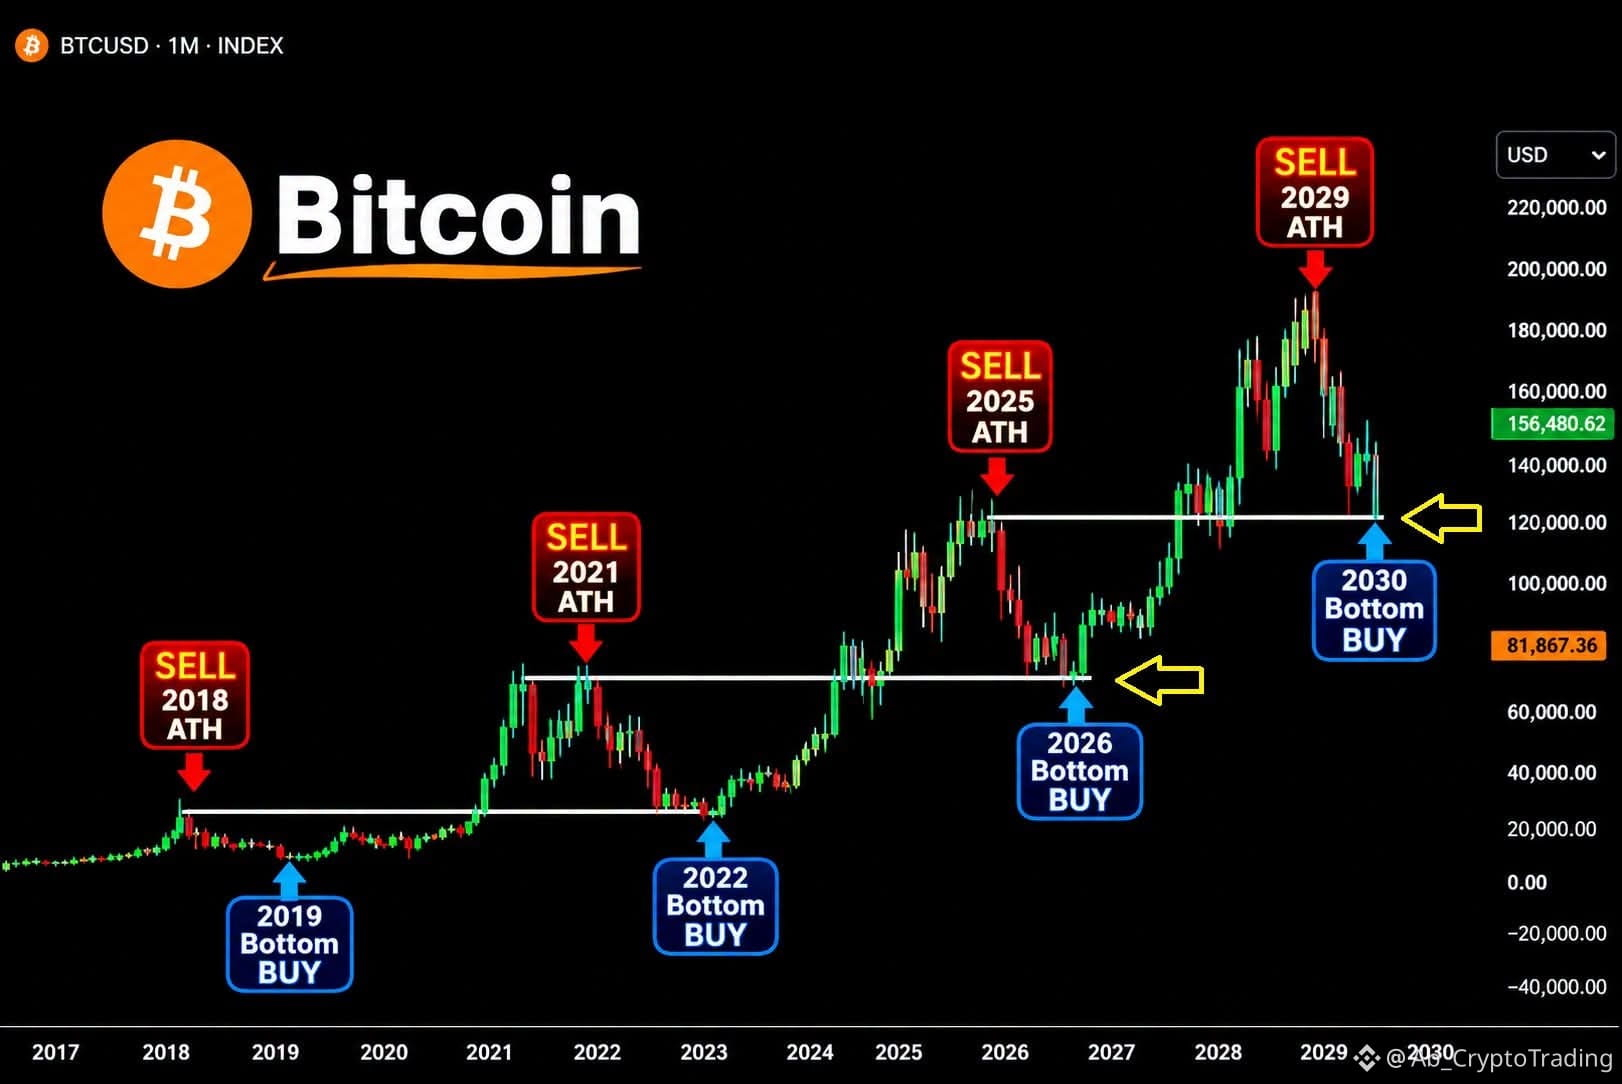
I've been looking at Bitcoin's long-term monthly chart, and there's an interesting scenario worth discussing.
Historically, Bitcoin has gone through major expansion phases followed by deep corrections and periods of accumulation.
Looking at the broader cycle structure, here's one possible long-term roadmap:
🔴 2025: A potential cycle peak and major profit-taking phase.
🔵 2026: A possible market bottom and long-term accumulation opportunity.
🔴 2029: Another potential cycle high, possibly pushing Bitcoin above $200K.
🔵 2030: A new correction and potential long-term accumulation phase.
Now, I'm not suggesting these dates or price levels are guaranteed.
In fact, the interesting part is whether Bitcoin's traditional four-year cycle will continue to repeat, or whether institutional adoption, ETFs, liquidity, and changing market dynamics will fundamentally alter its historical behavior.
Here's what I'd really like to debate:
1️⃣ Do you believe Bitcoin will continue following its historical four-year cycle?
2️⃣ Could the next major Bitcoin peak happen around 2029, or will institutional demand change the entire cycle structure?
3️⃣ If BTC experiences another major correction, would you be accumulating aggressively or waiting for stronger confirmation of a bottom?
Personally, I think the biggest mistake investors can make is treating any historical pattern as a guarantee of what comes next.
What's your long-term Bitcoin thesis: $200K+ by 2029, or a completely different market cycle?
Let's hear the arguments from both sides. 👇 $BTC
#Binance #BinanceSquareFamily #BTC #HotCPIDecemberHikePriced #AnthropicRejectsIPODelayValuationinQuestion
₿ What if Bitcoin's next major cycle follows a very different timeline than most investors expect?
I've been looking at Bitcoin's long-term monthly chart, and there's an interesting scenario worth discussing.
Historically, Bitcoin has gone through major expansion phases followed by deep corrections and periods of accumulation.
Looking at the broader cycle structure, here's one possible long-term roadmap:
🔴 2025: A potential cycle peak and major profit-taking phase.
🔵 2026: A possible market bottom and long-term accumulation opportunity.
🔴 2029: Another potential cycle high, possibly pushing Bitcoin above $200K.
🔵 2030: A new correction and potential long-term accumulation phase.
Now, I'm not suggesting these dates or price levels are guaranteed.
In fact, the interesting part is whether Bitcoin's traditional four-year cycle will continue to repeat, or whether institutional adoption, ETFs, liquidity, and changing market dynamics will fundamentally alter its historical behavior.
Here's what I'd really like to debate:
1️⃣ Do you believe Bitcoin will continue following its historical four-year cycle?
2️⃣ Could the next major Bitcoin peak happen around 2029, or will institutional demand change the entire cycle structure?
3️⃣ If BTC experiences another major correction, would you be accumulating aggressively or waiting for stronger confirmation of a bottom?
Personally, I think the biggest mistake investors can make is treating any historical pattern as a guarantee of what comes next.
What's your long-term Bitcoin thesis: $200K+ by 2029, or a completely different market cycle?
Let's hear the arguments from both sides. 👇 $BTC
#Binance #BinanceSquareFamily #BTC #HotCPIDecemberHikePriced #AnthropicRejectsIPODelayValuationinQuestion
I've been looking at Bitcoin's long-term monthly chart, and there's an interesting scenario worth discussing.
Historically, Bitcoin has gone through major expansion phases followed by deep corrections and periods of accumulation.
Looking at the broader cycle structure, here's one possible long-term roadmap:
🔴 2025: A potential cycle peak and major profit-taking phase.
🔵 2026: A possible market bottom and long-term accumulation opportunity.
🔴 2029: Another potential cycle high, possibly pushing Bitcoin above $200K.
🔵 2030: A new correction and potential long-term accumulation phase.
Now, I'm not suggesting these dates or price levels are guaranteed.
In fact, the interesting part is whether Bitcoin's traditional four-year cycle will continue to repeat, or whether institutional adoption, ETFs, liquidity, and changing market dynamics will fundamentally alter its historical behavior.
Here's what I'd really like to debate:
1️⃣ Do you believe Bitcoin will continue following its historical four-year cycle?
2️⃣ Could the next major Bitcoin peak happen around 2029, or will institutional demand change the entire cycle structure?
3️⃣ If BTC experiences another major correction, would you be accumulating aggressively or waiting for stronger confirmation of a bottom?
Personally, I think the biggest mistake investors can make is treating any historical pattern as a guarantee of what comes next.
What's your long-term Bitcoin thesis: $200K+ by 2029, or a completely different market cycle?
Let's hear the arguments from both sides. 👇 $BTC
#Binance #BinanceSquareFamily #BTC #HotCPIDecemberHikePriced #AnthropicRejectsIPODelayValuationinQuestion
4
252
See translation
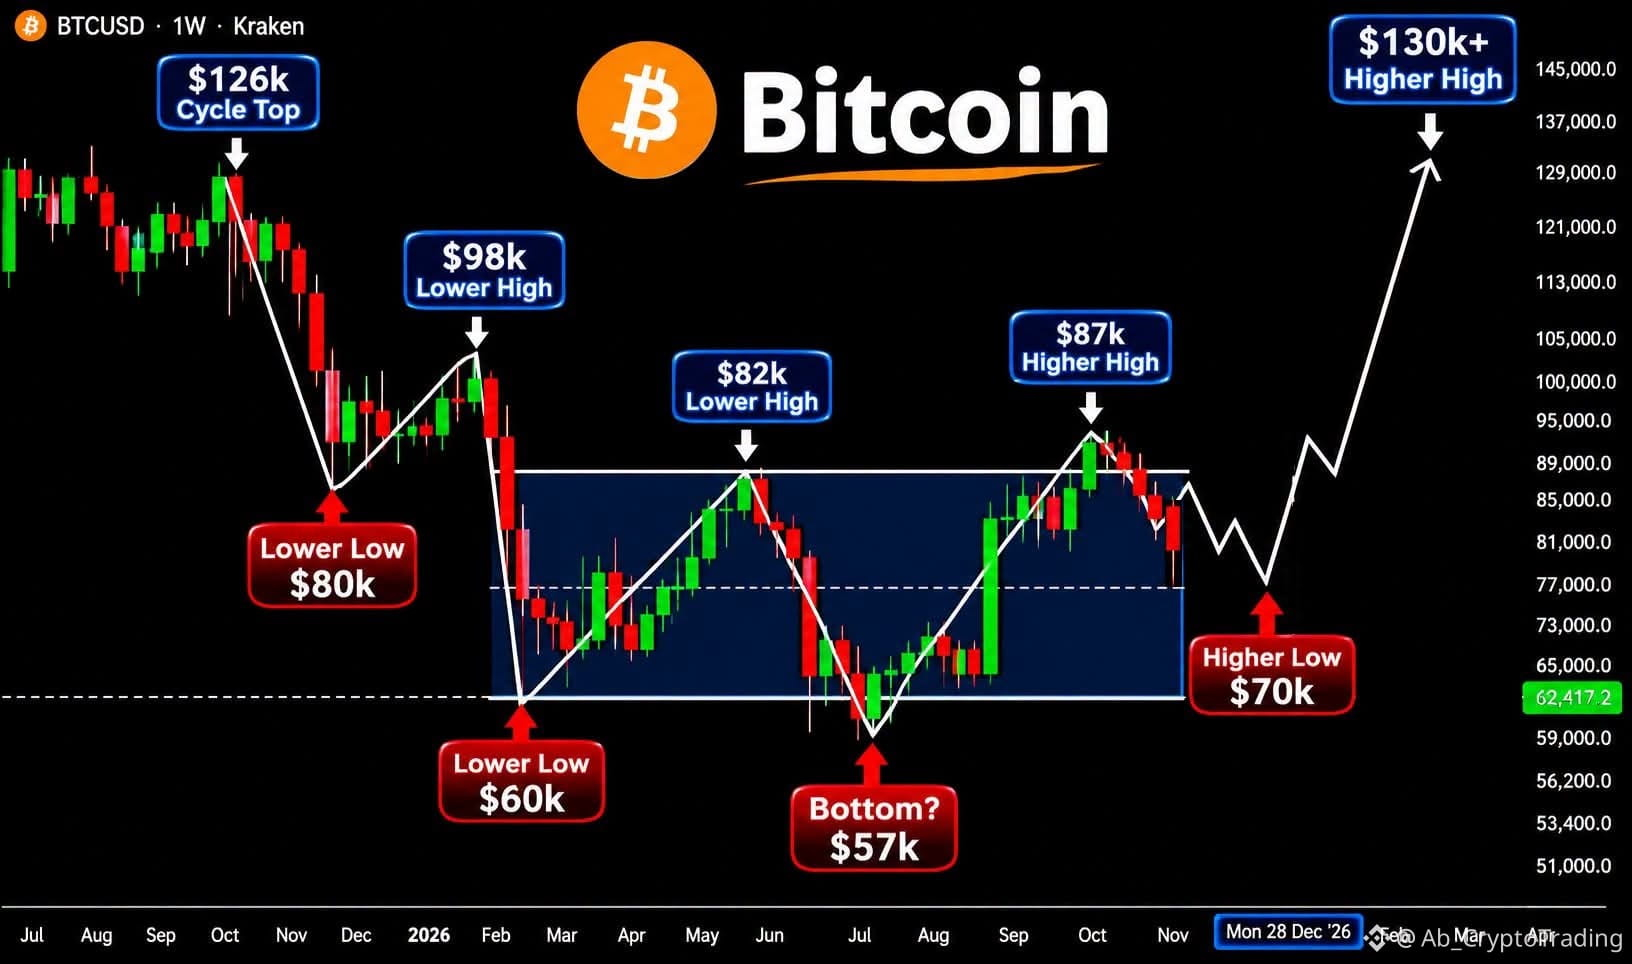
₿ What if Bitcoin is setting up for another major move higher… but not before one more shakeout?
Here's an alternative scenario I've been watching on the weekly chart.
Bitcoin has already gone through several major swings, creating a sequence of lower highs and lower lows before recovering toward the $87K area.
Now, what if the market is starting to build a different structure?
One possible scenario worth considering:
🔹 A pullback toward the $70K region could establish a higher low.
🔹 Holding that area could strengthen the case for a bullish market structure.
🔹 A move above previous resistance could open the door to a retest of the $126K cycle high.
🔹 And if momentum continues, the $130K+ region could become a potential upside target.
Of course, this is just one scenario. A breakdown below key support would change the entire picture.
What makes this setup interesting is that both outcomes are still worth considering.
I'm curious how other market participants are reading this:
1️⃣ Do you see a potential higher low forming around $70K, or is another deeper correction more likely?
2️⃣ Is the $126K area the next major obstacle, or could Bitcoin eventually push toward $130K–$145K?
3️⃣ What price level would invalidate this bullish scenario for you?
No need to agree with the chart. I'd rather hear a well-reasoned bearish argument than a hundred comments saying "To the moon."
What's your take? Are we looking at a potential continuation setup, or a bull trap? 👇 $BTC
#BTC
#HotCPIDecemberHikePriced #AnthropicRejectsIPODelayValuationinQuestion #Binance #BinanceSquareFamily
₿ What if Bitcoin is setting up for another major move higher… but not before one more shakeout?
Here's an alternative scenario I've been watching on the weekly chart.
Bitcoin has already gone through several major swings, creating a sequence of lower highs and lower lows before recovering toward the $87K area.
Now, what if the market is starting to build a different structure?
One possible scenario worth considering:
🔹 A pullback toward the $70K region could establish a higher low.
🔹 Holding that area could strengthen the case for a bullish market structure.
🔹 A move above previous resistance could open the door to a retest of the $126K cycle high.
🔹 And if momentum continues, the $130K+ region could become a potential upside target.
Of course, this is just one scenario. A breakdown below key support would change the entire picture.
What makes this setup interesting is that both outcomes are still worth considering.
I'm curious how other market participants are reading this:
1️⃣ Do you see a potential higher low forming around $70K, or is another deeper correction more likely?
2️⃣ Is the $126K area the next major obstacle, or could Bitcoin eventually push toward $130K–$145K?
3️⃣ What price level would invalidate this bullish scenario for you?
No need to agree with the chart. I'd rather hear a well-reasoned bearish argument than a hundred comments saying "To the moon."
What's your take? Are we looking at a potential continuation setup, or a bull trap? 👇 $BTC
#BTC
#HotCPIDecemberHikePriced #AnthropicRejectsIPODelayValuationinQuestion #Binance #BinanceSquareFamily
Here's an alternative scenario I've been watching on the weekly chart.
Bitcoin has already gone through several major swings, creating a sequence of lower highs and lower lows before recovering toward the $87K area.
Now, what if the market is starting to build a different structure?
One possible scenario worth considering:
🔹 A pullback toward the $70K region could establish a higher low.
🔹 Holding that area could strengthen the case for a bullish market structure.
🔹 A move above previous resistance could open the door to a retest of the $126K cycle high.
🔹 And if momentum continues, the $130K+ region could become a potential upside target.
Of course, this is just one scenario. A breakdown below key support would change the entire picture.
What makes this setup interesting is that both outcomes are still worth considering.
I'm curious how other market participants are reading this:
1️⃣ Do you see a potential higher low forming around $70K, or is another deeper correction more likely?
2️⃣ Is the $126K area the next major obstacle, or could Bitcoin eventually push toward $130K–$145K?
3️⃣ What price level would invalidate this bullish scenario for you?
No need to agree with the chart. I'd rather hear a well-reasoned bearish argument than a hundred comments saying "To the moon."
What's your take? Are we looking at a potential continuation setup, or a bull trap? 👇 $BTC
#BTC
#HotCPIDecemberHikePriced #AnthropicRejectsIPODelayValuationinQuestion #Binance #BinanceSquareFamily
2
128
See translation
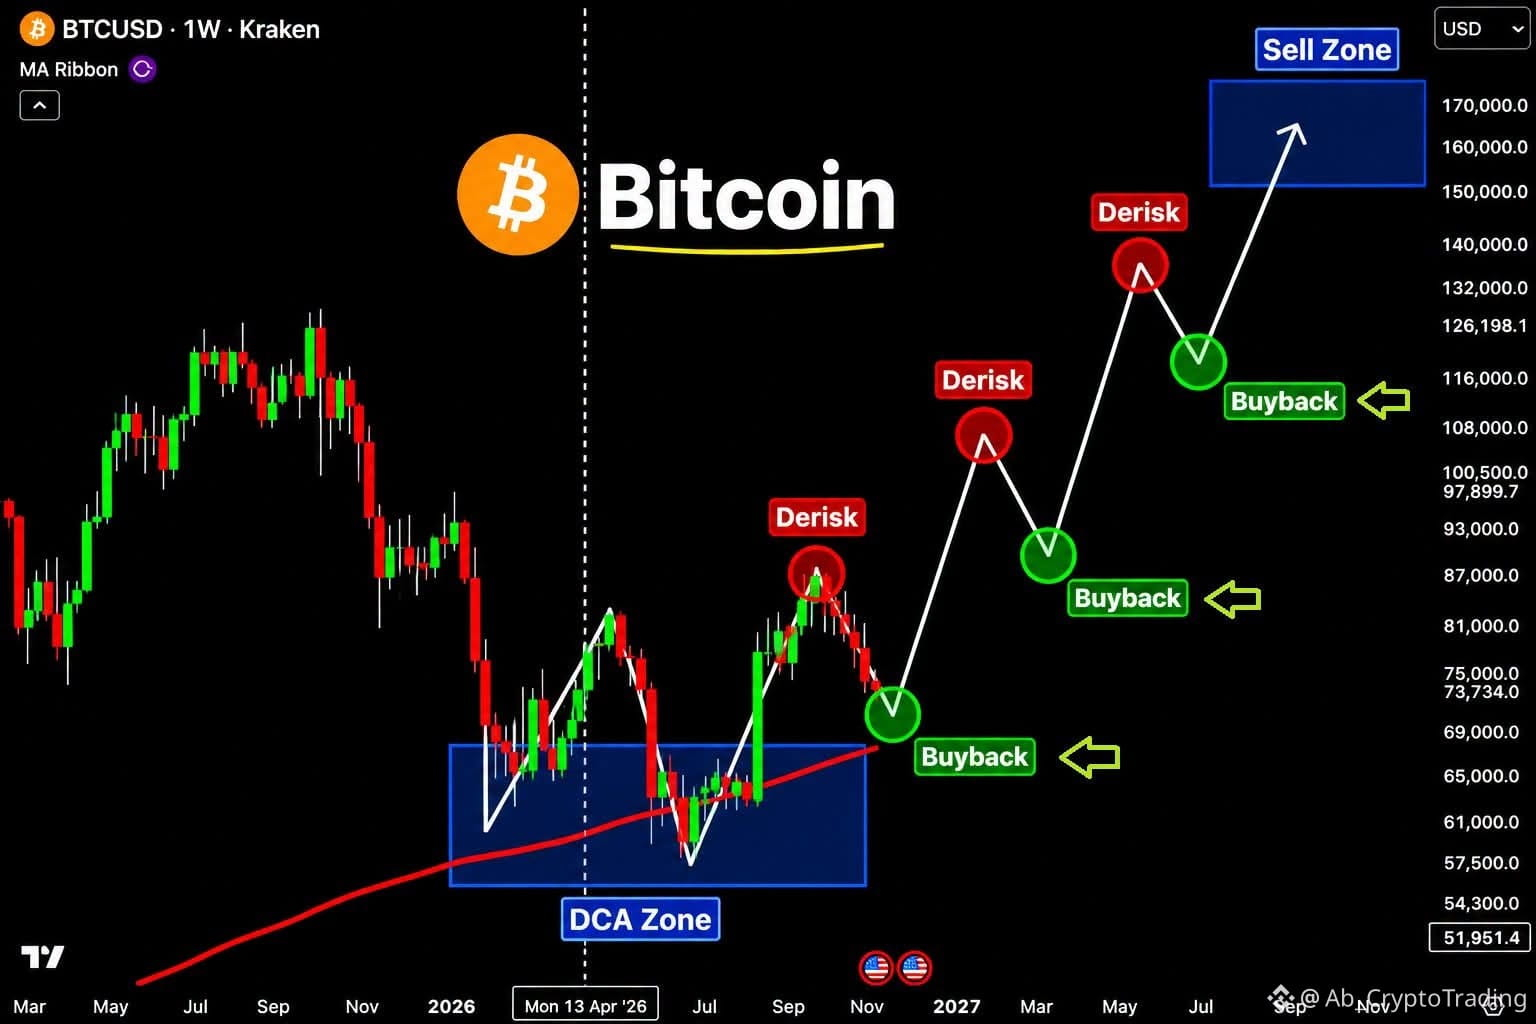
🚨 ₿ Bitcoin's next major move could be more interesting than most people expect.
I've been looking at the bigger picture on the weekly chart, and there's one scenario I think is worth discussing.
Rather than chasing every breakout, I'm more interested in how Bitcoin behaves around key accumulation and distribution areas.
My current roadmap looks something like this:
🔹 Potential pullbacks could offer opportunities to accumulate gradually (DCA).
🔹 As price moves higher, taking partial profits and reducing exposure may become increasingly important.
🔹 If momentum remains strong, we could eventually see Bitcoin challenge the $150K–$170K region.
But I want to be clear: this is a potential market scenario, not a guaranteed prediction. The market can always take a different path.
Here's what I'd really like to hear from other Bitcoin investors:
1. Do you think $BTC still has another major leg up in this cycle?
2. Would you prefer buying dips along the way, or holding through the volatility?
3. At what price level would you personally start taking profits?
Personally, I think having a plan for both the upside AND the downside is what separates disciplined investors from emotional traders.
What's your Bitcoin game plan for the months ahead?
I'm genuinely interested in hearing different perspectives. 👇
#BTC #CanNvidiaEarningsEaseMarketConcerns? #HotCPIDecemberHikePriced #Write2Earn #Write2Earrn
🚨 ₿ Bitcoin's next major move could be more interesting than most people expect.
I've been looking at the bigger picture on the weekly chart, and there's one scenario I think is worth discussing.
Rather than chasing every breakout, I'm more interested in how Bitcoin behaves around key accumulation and distribution areas.
My current roadmap looks something like this:
🔹 Potential pullbacks could offer opportunities to accumulate gradually (DCA).
🔹 As price moves higher, taking partial profits and reducing exposure may become increasingly important.
🔹 If momentum remains strong, we could eventually see Bitcoin challenge the $150K–$170K region.
But I want to be clear: this is a potential market scenario, not a guaranteed prediction. The market can always take a different path.
Here's what I'd really like to hear from other Bitcoin investors:
1. Do you think $BTC still has another major leg up in this cycle?
2. Would you prefer buying dips along the way, or holding through the volatility?
3. At what price level would you personally start taking profits?
Personally, I think having a plan for both the upside AND the downside is what separates disciplined investors from emotional traders.
What's your Bitcoin game plan for the months ahead?
I'm genuinely interested in hearing different perspectives. 👇
#BTC #CanNvidiaEarningsEaseMarketConcerns? #HotCPIDecemberHikePriced #Write2Earn #Write2Earrn
I've been looking at the bigger picture on the weekly chart, and there's one scenario I think is worth discussing.
Rather than chasing every breakout, I'm more interested in how Bitcoin behaves around key accumulation and distribution areas.
My current roadmap looks something like this:
🔹 Potential pullbacks could offer opportunities to accumulate gradually (DCA).
🔹 As price moves higher, taking partial profits and reducing exposure may become increasingly important.
🔹 If momentum remains strong, we could eventually see Bitcoin challenge the $150K–$170K region.
But I want to be clear: this is a potential market scenario, not a guaranteed prediction. The market can always take a different path.
Here's what I'd really like to hear from other Bitcoin investors:
1. Do you think $BTC still has another major leg up in this cycle?
2. Would you prefer buying dips along the way, or holding through the volatility?
3. At what price level would you personally start taking profits?
Personally, I think having a plan for both the upside AND the downside is what separates disciplined investors from emotional traders.
What's your Bitcoin game plan for the months ahead?
I'm genuinely interested in hearing different perspectives. 👇
#BTC #CanNvidiaEarningsEaseMarketConcerns? #HotCPIDecemberHikePriced #Write2Earn #Write2Earrn
4
580
See translation
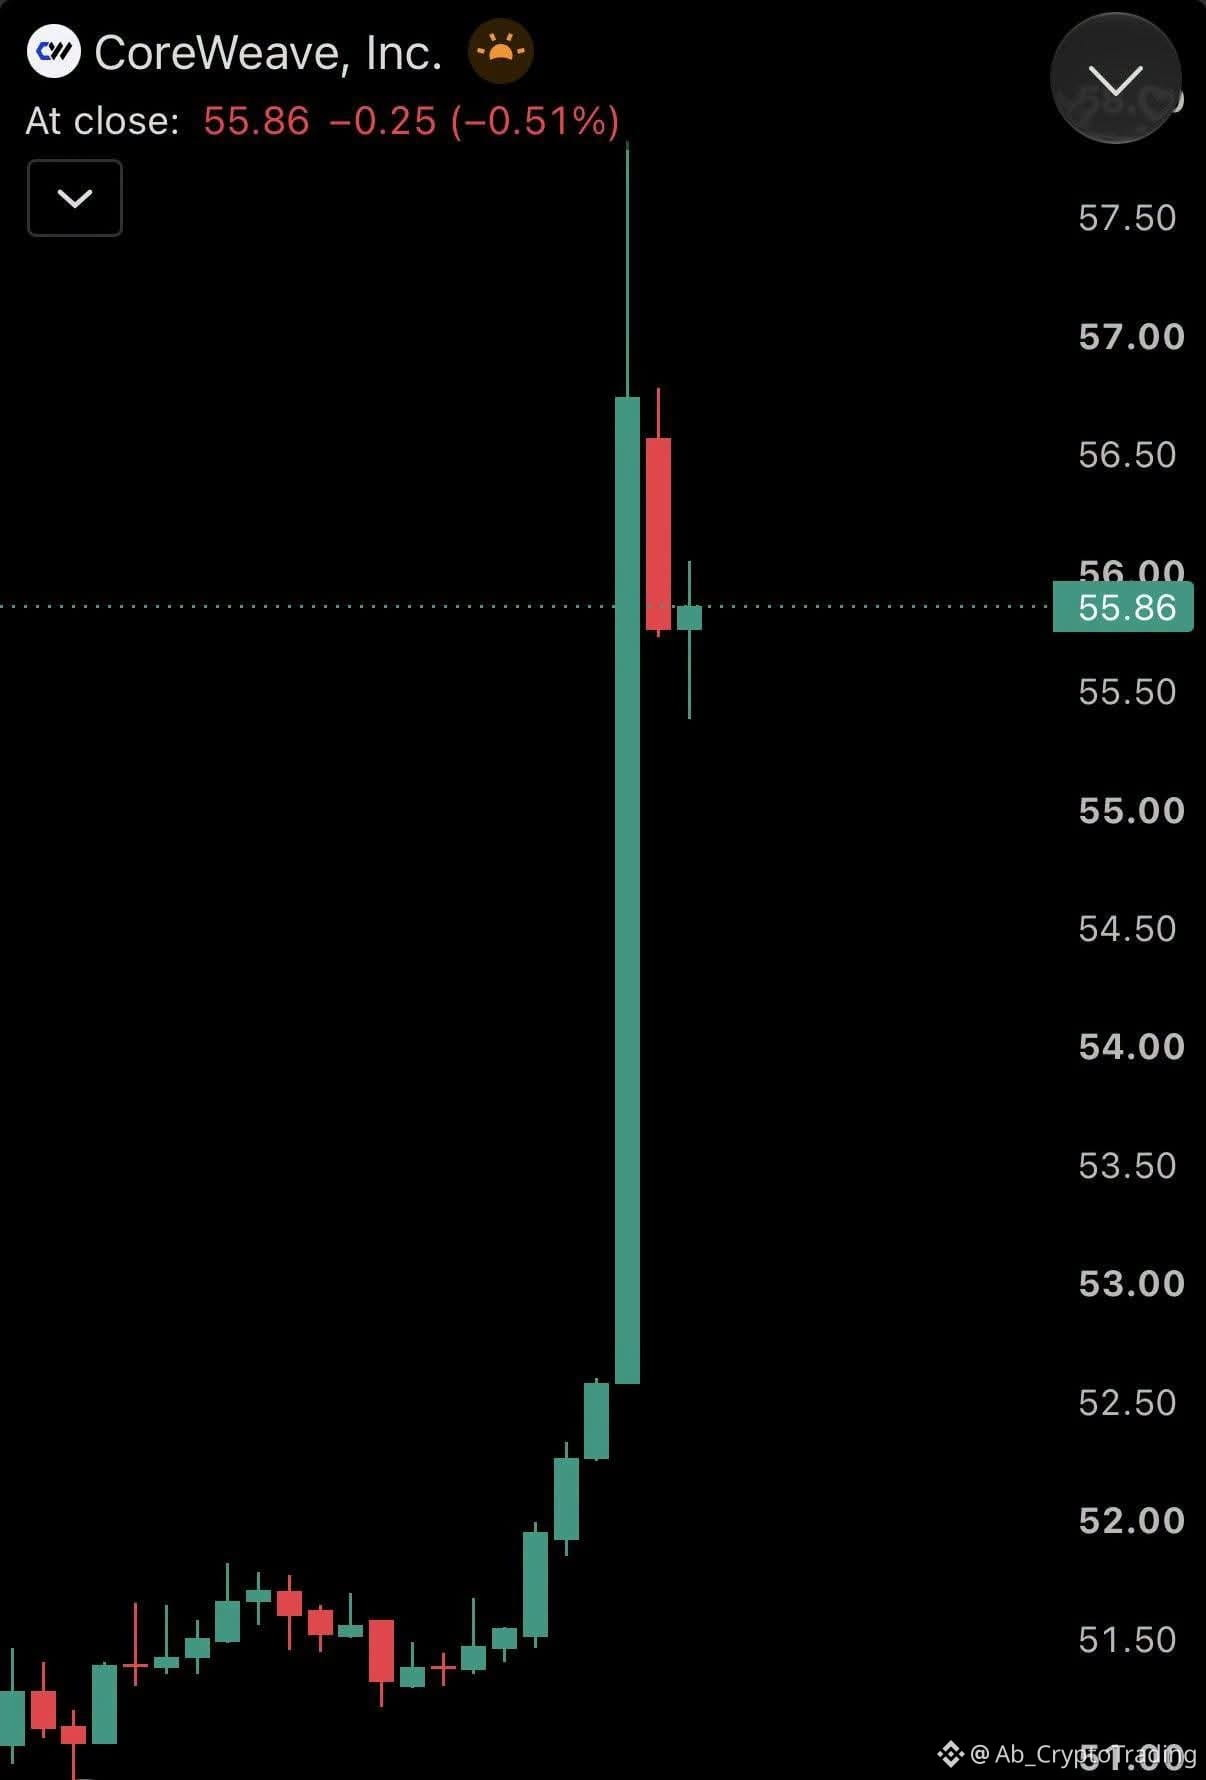
🚨 COREWEAVE JUST SENT A BIG SIGNAL TO THE AI MARKET.
CoreWeave ($CRWVB ) delivered a powerful Q3 earnings report, and the market reaction says a lot about where investor sentiment around AI infrastructure may be heading.
Here's what caught my attention:
• Revenue: $3.66B, up 168% year over year.
• Revenue backlog: $132.5B, up 138% year over year.
• Adjusted operating income reached $379M, with a 10% margin.
• Full-year 2026 revenue guidance was raised to $13B–$13.3B.
• Shares surged more than 16% in extended trading.
And here's where things get interesting…
The market isn't just betting on AI software anymore. It's increasingly focused on the infrastructure powering the entire AI ecosystem:
Data centers. Computing capacity. GPUs. Energy. Cloud infrastructure.
CoreWeave is right in the middle of that investment cycle.
But there's another side to this story.
The company is planning massive capital expenditures of $37B–$39B this year, and its debt burden remains a risk investors cannot ignore.
So here's the question I think every serious AI investor should be asking:
Are we witnessing the beginning of a new, sustainable growth cycle in AI infrastructure, or is the market getting ahead of itself by pricing in years of future demand?
I'd particularly like to hear different perspectives:
1️⃣ Is $CRWV becoming one of the most important AI infrastructure plays in the market?
2️⃣ Would you rather own CoreWeave, NVIDIA ($NVDA), or a broader AI ETF at current valuations?
3️⃣ What's the bigger opportunity over the next 2–3 years: AI chips, data centers, or the companies building the cloud infrastructure?
Bullish, bearish, or somewhere in between — what's your thesis?
Let's get beyond the headlines and talk fundamentals. 👇
#HotCPIDecemberHikePriced #AnthropicRejectsIPODelayValuationinQuestion #CoreWeaveJumps10%On168%RevenueGrowth #CanNvidiaEarningsEaseMarketConcerns? #BarclaysRaisesBlackRockBitcoinETFStake48%
🚨 COREWEAVE JUST SENT A BIG SIGNAL TO THE AI MARKET.
CoreWeave ($CRWVB ) delivered a powerful Q3 earnings report, and the market reaction says a lot about where investor sentiment around AI infrastructure may be heading.
Here's what caught my attention:
• Revenue: $3.66B, up 168% year over year.
• Revenue backlog: $132.5B, up 138% year over year.
• Adjusted operating income reached $379M, with a 10% margin.
• Full-year 2026 revenue guidance was raised to $13B–$13.3B.
• Shares surged more than 16% in extended trading.
And here's where things get interesting…
The market isn't just betting on AI software anymore. It's increasingly focused on the infrastructure powering the entire AI ecosystem:
Data centers. Computing capacity. GPUs. Energy. Cloud infrastructure.
CoreWeave is right in the middle of that investment cycle.
But there's another side to this story.
The company is planning massive capital expenditures of $37B–$39B this year, and its debt burden remains a risk investors cannot ignore.
So here's the question I think every serious AI investor should be asking:
Are we witnessing the beginning of a new, sustainable growth cycle in AI infrastructure, or is the market getting ahead of itself by pricing in years of future demand?
I'd particularly like to hear different perspectives:
1️⃣ Is $CRWV becoming one of the most important AI infrastructure plays in the market?
2️⃣ Would you rather own CoreWeave, NVIDIA ($NVDA), or a broader AI ETF at current valuations?
3️⃣ What's the bigger opportunity over the next 2–3 years: AI chips, data centers, or the companies building the cloud infrastructure?
Bullish, bearish, or somewhere in between — what's your thesis?
Let's get beyond the headlines and talk fundamentals. 👇
#HotCPIDecemberHikePriced #AnthropicRejectsIPODelayValuationinQuestion #CoreWeaveJumps10%On168%RevenueGrowth #CanNvidiaEarningsEaseMarketConcerns? #BarclaysRaisesBlackRockBitcoinETFStake48%
CoreWeave ($CRWVB ) delivered a powerful Q3 earnings report, and the market reaction says a lot about where investor sentiment around AI infrastructure may be heading.
Here's what caught my attention:
• Revenue: $3.66B, up 168% year over year.
• Revenue backlog: $132.5B, up 138% year over year.
• Adjusted operating income reached $379M, with a 10% margin.
• Full-year 2026 revenue guidance was raised to $13B–$13.3B.
• Shares surged more than 16% in extended trading.
And here's where things get interesting…
The market isn't just betting on AI software anymore. It's increasingly focused on the infrastructure powering the entire AI ecosystem:
Data centers. Computing capacity. GPUs. Energy. Cloud infrastructure.
CoreWeave is right in the middle of that investment cycle.
But there's another side to this story.
The company is planning massive capital expenditures of $37B–$39B this year, and its debt burden remains a risk investors cannot ignore.
So here's the question I think every serious AI investor should be asking:
Are we witnessing the beginning of a new, sustainable growth cycle in AI infrastructure, or is the market getting ahead of itself by pricing in years of future demand?
I'd particularly like to hear different perspectives:
1️⃣ Is $CRWV becoming one of the most important AI infrastructure plays in the market?
2️⃣ Would you rather own CoreWeave, NVIDIA ($NVDA), or a broader AI ETF at current valuations?
3️⃣ What's the bigger opportunity over the next 2–3 years: AI chips, data centers, or the companies building the cloud infrastructure?
Bullish, bearish, or somewhere in between — what's your thesis?
Let's get beyond the headlines and talk fundamentals. 👇
#HotCPIDecemberHikePriced #AnthropicRejectsIPODelayValuationinQuestion #CoreWeaveJumps10%On168%RevenueGrowth #CanNvidiaEarningsEaseMarketConcerns? #BarclaysRaisesBlackRockBitcoinETFStake48%
3
155
See translation
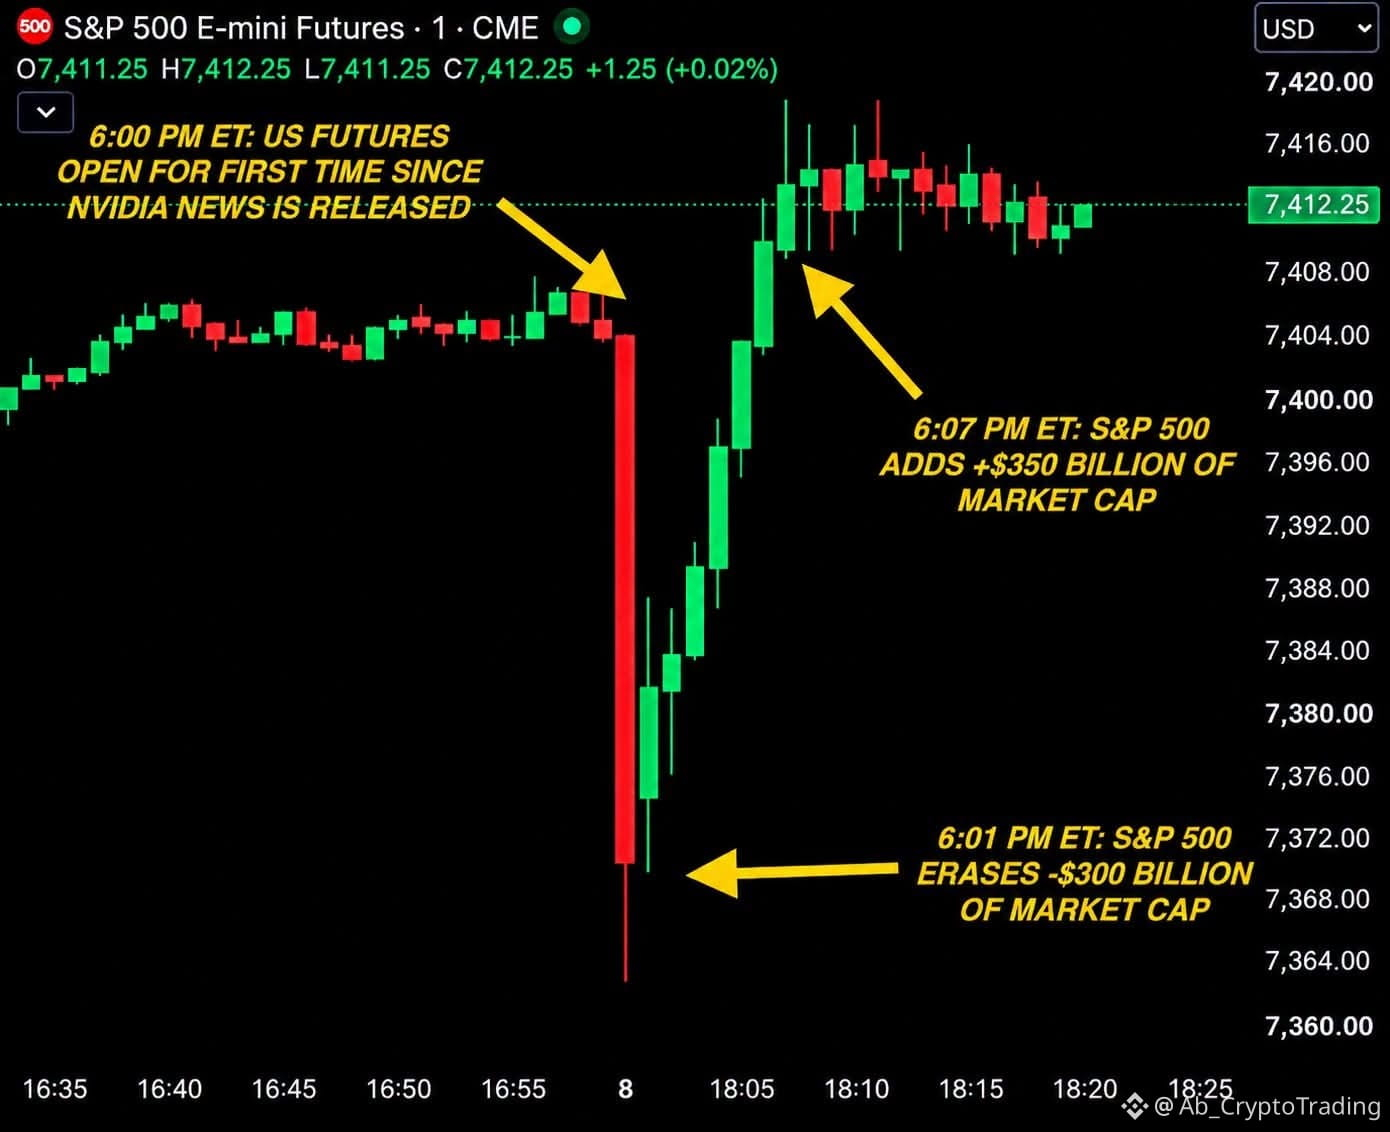
🚨 Can one company's news really shake the entire US stock market?
Take a closer look at this S&P 500 E-mini futures chart.
In just a few minutes, the market experienced an extraordinary swing:
📉 Nearly $300 billion in market capitalization wiped out.
📈 Then, approximately $350 billion added back.
All amid market reactions surrounding NVIDIA-related news.
But here's the bigger question:
Are we witnessing a market driven by fundamentals, or one increasingly dominated by headlines, algorithms, and investor sentiment?
I'd love to hear your perspective:
1. Has NVIDIA become influential enough to move the broader US market?
2. Are these sharp reversals genuine buying opportunities or warning signs of excessive market volatility?
3. Is today's market becoming more reactive to news than to actual company fundamentals?
Let's hear different perspectives. No hype, no predictions — just thoughtful market discussion.
What's your take? 👇 $NVDAB $AAPLB $TSLAB
#HotCPIDecemberHikePriced #AnthropicRejectsIPODelayValuationinQuestion #CoreWeaveJumps10%On168%RevenueGrowth #BarclaysRaisesBlackRockBitcoinETFStake48% #CanNvidiaEarningsEaseMarketConcerns?
🚨 Can one company's news really shake the entire US stock market?
Take a closer look at this S&P 500 E-mini futures chart.
In just a few minutes, the market experienced an extraordinary swing:
📉 Nearly $300 billion in market capitalization wiped out.
📈 Then, approximately $350 billion added back.
All amid market reactions surrounding NVIDIA-related news.
But here's the bigger question:
Are we witnessing a market driven by fundamentals, or one increasingly dominated by headlines, algorithms, and investor sentiment?
I'd love to hear your perspective:
1. Has NVIDIA become influential enough to move the broader US market?
2. Are these sharp reversals genuine buying opportunities or warning signs of excessive market volatility?
3. Is today's market becoming more reactive to news than to actual company fundamentals?
Let's hear different perspectives. No hype, no predictions — just thoughtful market discussion.
What's your take? 👇 $NVDAB $AAPLB $TSLAB
#HotCPIDecemberHikePriced #AnthropicRejectsIPODelayValuationinQuestion #CoreWeaveJumps10%On168%RevenueGrowth #BarclaysRaisesBlackRockBitcoinETFStake48% #CanNvidiaEarningsEaseMarketConcerns?
Take a closer look at this S&P 500 E-mini futures chart.
In just a few minutes, the market experienced an extraordinary swing:
📉 Nearly $300 billion in market capitalization wiped out.
📈 Then, approximately $350 billion added back.
All amid market reactions surrounding NVIDIA-related news.
But here's the bigger question:
Are we witnessing a market driven by fundamentals, or one increasingly dominated by headlines, algorithms, and investor sentiment?
I'd love to hear your perspective:
1. Has NVIDIA become influential enough to move the broader US market?
2. Are these sharp reversals genuine buying opportunities or warning signs of excessive market volatility?
3. Is today's market becoming more reactive to news than to actual company fundamentals?
Let's hear different perspectives. No hype, no predictions — just thoughtful market discussion.
What's your take? 👇 $NVDAB $AAPLB $TSLAB
#HotCPIDecemberHikePriced #AnthropicRejectsIPODelayValuationinQuestion #CoreWeaveJumps10%On168%RevenueGrowth #BarclaysRaisesBlackRockBitcoinETFStake48% #CanNvidiaEarningsEaseMarketConcerns?
2
252
See translation
Bro 😂 😂 Jensen Huang has apparently rejected every AI model… except the Chinese one! 🇨🇳
When the AI competition gets so intense that even NVIDIA's CEO seems to have a favorite exception. 😂
But jokes aside, here's the real question:
Are Chinese AI models genuinely becoming a serious threat to OpenAI, Google, Meta, and Anthropic? Or is there still a significant technological gap?
And if you could choose ONLY ONE AI model to rely on for your daily work, which one would it be?
OpenAI, Gemini, Claude, DeepSeek, or something else? 👀
Let's see where everyone's loyalty stands! 🔥 $NVDAB
#CanNvidiaEarningsEaseMarketConcerns? #BarclaysRaisesBlackRockBitcoinETFStake48% #CoreWeaveJumps10%On168%RevenueGrowth #AnthropicRejectsIPODelayValuationinQuestion #HotCPIDecemberHikePriced
Bro 😂 😂 Jensen Huang has apparently rejected every AI model… except the Chinese one! 🇨🇳
When the AI competition gets so intense that even NVIDIA's CEO seems to have a favorite exception. 😂
But jokes aside, here's the real question:
Are Chinese AI models genuinely becoming a serious threat to OpenAI, Google, Meta, and Anthropic? Or is there still a significant technological gap?
And if you could choose ONLY ONE AI model to rely on for your daily work, which one would it be?
OpenAI, Gemini, Claude, DeepSeek, or something else? 👀
Let's see where everyone's loyalty stands! 🔥 $NVDAB
#CanNvidiaEarningsEaseMarketConcerns? #BarclaysRaisesBlackRockBitcoinETFStake48% #CoreWeaveJumps10%On168%RevenueGrowth #AnthropicRejectsIPODelayValuationinQuestion #HotCPIDecemberHikePriced
When the AI competition gets so intense that even NVIDIA's CEO seems to have a favorite exception. 😂
But jokes aside, here's the real question:
Are Chinese AI models genuinely becoming a serious threat to OpenAI, Google, Meta, and Anthropic? Or is there still a significant technological gap?
And if you could choose ONLY ONE AI model to rely on for your daily work, which one would it be?
OpenAI, Gemini, Claude, DeepSeek, or something else? 👀
Let's see where everyone's loyalty stands! 🔥 $NVDAB
#CanNvidiaEarningsEaseMarketConcerns? #BarclaysRaisesBlackRockBitcoinETFStake48% #CoreWeaveJumps10%On168%RevenueGrowth #AnthropicRejectsIPODelayValuationinQuestion #HotCPIDecemberHikePriced

1
6
461
See translation
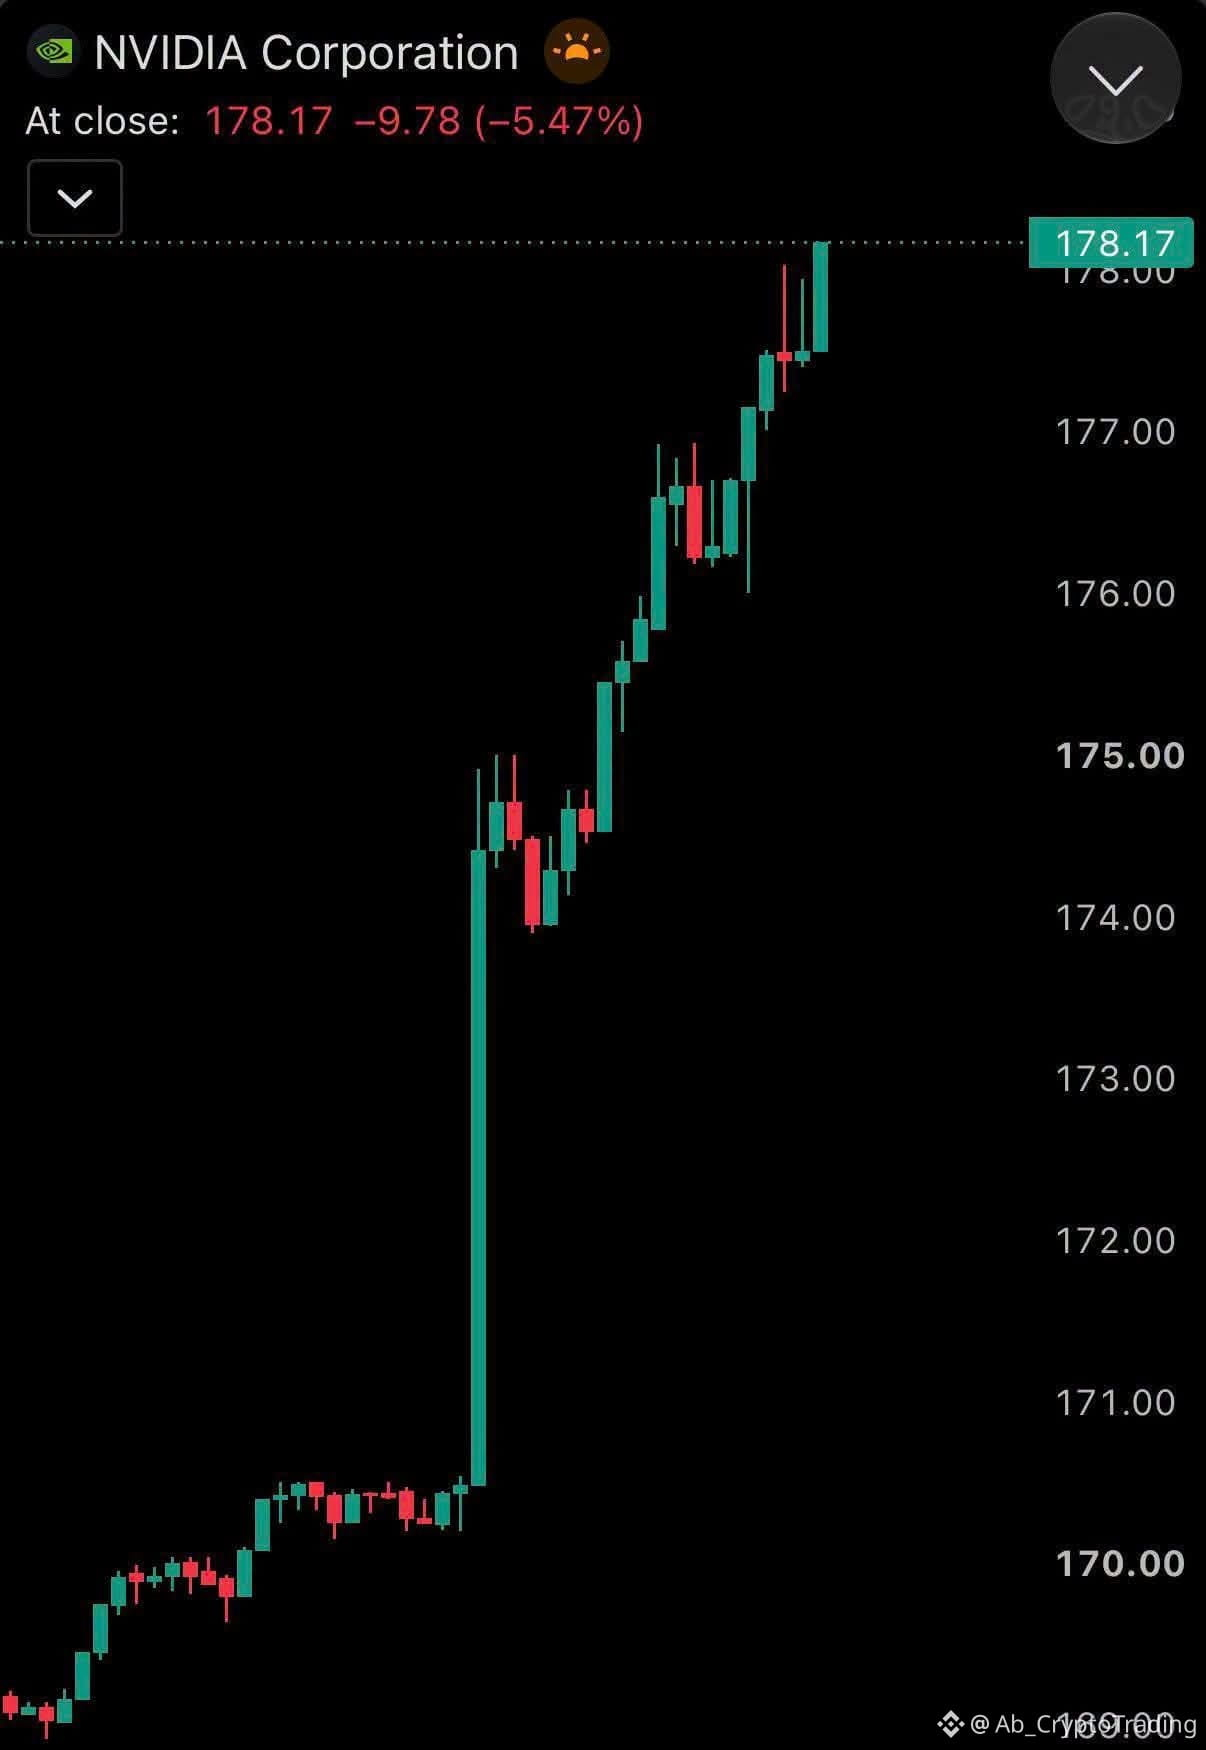
🚨 NVIDIA ($NVDA ) IS BACK — BUT WOULD YOU BUY THE DIP?
After yesterday's sell-off triggered by the controversy surrounding Jensen Huang, NVIDIA shares staged a strong rebound on Wednesday, with buyers stepping in to scoop up the dip.
And here's where things get interesting...
The controversy hasn't disappeared. The uncertainty hasn't magically vanished. Yet investors are already stepping back into the stock.
So let's settle this:
If you had $10,000 to invest right now, what would you do?
🔥 BUY NVIDIA — the fundamentals matter more than the controversy.
🤔 WAIT — let the dust settle before risking a dollar.
💀 SELL — this is a warning sign investors shouldn't ignore.
Pick your side and explain your reasoning. Let's see who's actually willing to put their money where their mouth is.
#HotCPIDecemberHikePriced #AnthropicRejectsIPODelayValuationinQuestion #CanNvidiaEarningsEaseMarketConcerns? #BarclaysRaisesBlackRockBitcoinETFStake48% #CoreWeaveJumps10%On168%RevenueGrowth
🚨 NVIDIA ($NVDA ) IS BACK — BUT WOULD YOU BUY THE DIP?
After yesterday's sell-off triggered by the controversy surrounding Jensen Huang, NVIDIA shares staged a strong rebound on Wednesday, with buyers stepping in to scoop up the dip.
And here's where things get interesting...
The controversy hasn't disappeared. The uncertainty hasn't magically vanished. Yet investors are already stepping back into the stock.
So let's settle this:
If you had $10,000 to invest right now, what would you do?
🔥 BUY NVIDIA — the fundamentals matter more than the controversy.
🤔 WAIT — let the dust settle before risking a dollar.
💀 SELL — this is a warning sign investors shouldn't ignore.
Pick your side and explain your reasoning. Let's see who's actually willing to put their money where their mouth is.
#HotCPIDecemberHikePriced #AnthropicRejectsIPODelayValuationinQuestion #CanNvidiaEarningsEaseMarketConcerns? #BarclaysRaisesBlackRockBitcoinETFStake48% #CoreWeaveJumps10%On168%RevenueGrowth
After yesterday's sell-off triggered by the controversy surrounding Jensen Huang, NVIDIA shares staged a strong rebound on Wednesday, with buyers stepping in to scoop up the dip.
And here's where things get interesting...
The controversy hasn't disappeared. The uncertainty hasn't magically vanished. Yet investors are already stepping back into the stock.
So let's settle this:
If you had $10,000 to invest right now, what would you do?
🔥 BUY NVIDIA — the fundamentals matter more than the controversy.
🤔 WAIT — let the dust settle before risking a dollar.
💀 SELL — this is a warning sign investors shouldn't ignore.
Pick your side and explain your reasoning. Let's see who's actually willing to put their money where their mouth is.
#HotCPIDecemberHikePriced #AnthropicRejectsIPODelayValuationinQuestion #CanNvidiaEarningsEaseMarketConcerns? #BarclaysRaisesBlackRockBitcoinETFStake48% #CoreWeaveJumps10%On168%RevenueGrowth
2
191
See translation
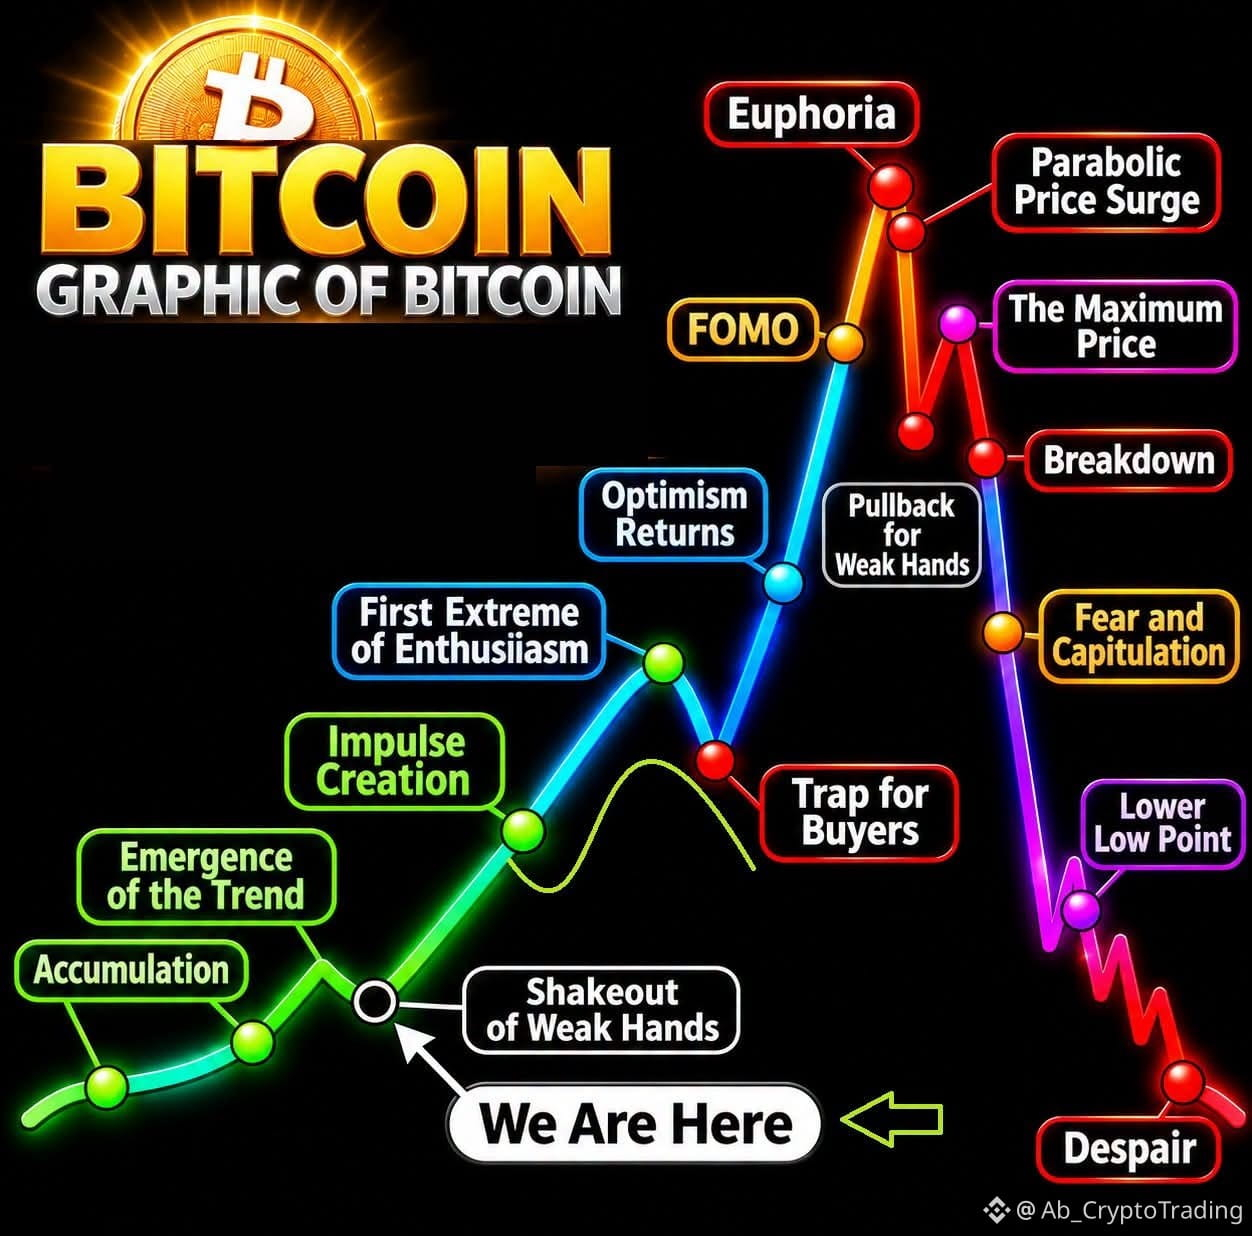
Bitcoin Market Cycles: Where Does Psychology Become the Biggest Risk?
Bitcoin cycles are not driven by price alone.
They are driven by psychology.
From accumulation and renewed optimism to FOMO, euphoria, and eventually fear and capitulation — every stage reflects a different relationship between investors and risk.
But here's the interesting part:
The most dangerous moment in a bull market may not be when everyone is bearish… but when everyone becomes convinced that the upside is guaranteed.
Euphoria can make experienced investors abandon risk management, while FOMO can turn hesitation into impulsive buying.
And sometimes, the market doesn't need a major negative catalyst to reverse.
It only needs expectations to become too extreme.
Which phase do you believe creates the greatest risk for market participants: FOMO, Euphoria, or the first signs of Breakdown?
The answer may reveal more about market psychology than the price chart itself. $BTC
#HotCPIDecemberHikePriced #AnthropicRejectsIPODelayValuationinQuestion #CoreWeaveJumps10%On168%RevenueGrowth #CanNvidiaEarningsEaseMarketConcerns? #BarclaysRaisesBlackRockBitcoinETFStake48%
Bitcoin Market Cycles: Where Does Psychology Become the Biggest Risk?
Bitcoin cycles are not driven by price alone.
They are driven by psychology.
From accumulation and renewed optimism to FOMO, euphoria, and eventually fear and capitulation — every stage reflects a different relationship between investors and risk.
But here's the interesting part:
The most dangerous moment in a bull market may not be when everyone is bearish… but when everyone becomes convinced that the upside is guaranteed.
Euphoria can make experienced investors abandon risk management, while FOMO can turn hesitation into impulsive buying.
And sometimes, the market doesn't need a major negative catalyst to reverse.
It only needs expectations to become too extreme.
Which phase do you believe creates the greatest risk for market participants: FOMO, Euphoria, or the first signs of Breakdown?
The answer may reveal more about market psychology than the price chart itself. $BTC
#HotCPIDecemberHikePriced #AnthropicRejectsIPODelayValuationinQuestion #CoreWeaveJumps10%On168%RevenueGrowth #CanNvidiaEarningsEaseMarketConcerns? #BarclaysRaisesBlackRockBitcoinETFStake48%
Bitcoin cycles are not driven by price alone.
They are driven by psychology.
From accumulation and renewed optimism to FOMO, euphoria, and eventually fear and capitulation — every stage reflects a different relationship between investors and risk.
But here's the interesting part:
The most dangerous moment in a bull market may not be when everyone is bearish… but when everyone becomes convinced that the upside is guaranteed.
Euphoria can make experienced investors abandon risk management, while FOMO can turn hesitation into impulsive buying.
And sometimes, the market doesn't need a major negative catalyst to reverse.
It only needs expectations to become too extreme.
Which phase do you believe creates the greatest risk for market participants: FOMO, Euphoria, or the first signs of Breakdown?
The answer may reveal more about market psychology than the price chart itself. $BTC
#HotCPIDecemberHikePriced #AnthropicRejectsIPODelayValuationinQuestion #CoreWeaveJumps10%On168%RevenueGrowth #CanNvidiaEarningsEaseMarketConcerns? #BarclaysRaisesBlackRockBitcoinETFStake48%
1
6
420
See translation
All Time High Prices vs Current Price 👇
(as of 2026 November 11th),
‣ $HYPE - $97.96 → $70.85 → 🔻-28%
‣ $ETH - $4,946.05 → $2,017.12 → 🔻-59%
‣ $SOL - $293.31 → $81.96 → 🔻-72%
‣ $SUI - $5.35 → $0.8049 → 🔻-85%
‣ $XRP - $3.65 → $1.05 → 🔻-71%
‣ $XLM - $0.8756 → $0.1415 → 🔻-84%
‣ $AVAX - $144.96 → $8.17 → 🔻-94%
#HotCPIDecemberHikePriced #AnthropicRejectsIPODelayValuationinQuestion #TradFiForBeginners #Write2Earn #BuyTheDip
All Time High Prices vs Current Price 👇
(as of 2026 November 11th),
‣ $HYPE - $97.96 → $70.85 → 🔻-28%
‣ $ETH - $4,946.05 → $2,017.12 → 🔻-59%
‣ $SOL - $293.31 → $81.96 → 🔻-72%
‣ $SUI - $5.35 → $0.8049 → 🔻-85%
‣ $XRP - $3.65 → $1.05 → 🔻-71%
‣ $XLM - $0.8756 → $0.1415 → 🔻-84%
‣ $AVAX - $144.96 → $8.17 → 🔻-94%
#HotCPIDecemberHikePriced #AnthropicRejectsIPODelayValuationinQuestion #TradFiForBeginners #Write2Earn #BuyTheDip
(as of 2026 November 11th),
‣ $HYPE - $97.96 → $70.85 → 🔻-28%
‣ $ETH - $4,946.05 → $2,017.12 → 🔻-59%
‣ $SOL - $293.31 → $81.96 → 🔻-72%
‣ $SUI - $5.35 → $0.8049 → 🔻-85%
‣ $XRP - $3.65 → $1.05 → 🔻-71%
‣ $XLM - $0.8756 → $0.1415 → 🔻-84%
‣ $AVAX - $144.96 → $8.17 → 🔻-94%
#HotCPIDecemberHikePriced #AnthropicRejectsIPODelayValuationinQuestion #TradFiForBeginners #Write2Earn #BuyTheDip

6
485
See translation
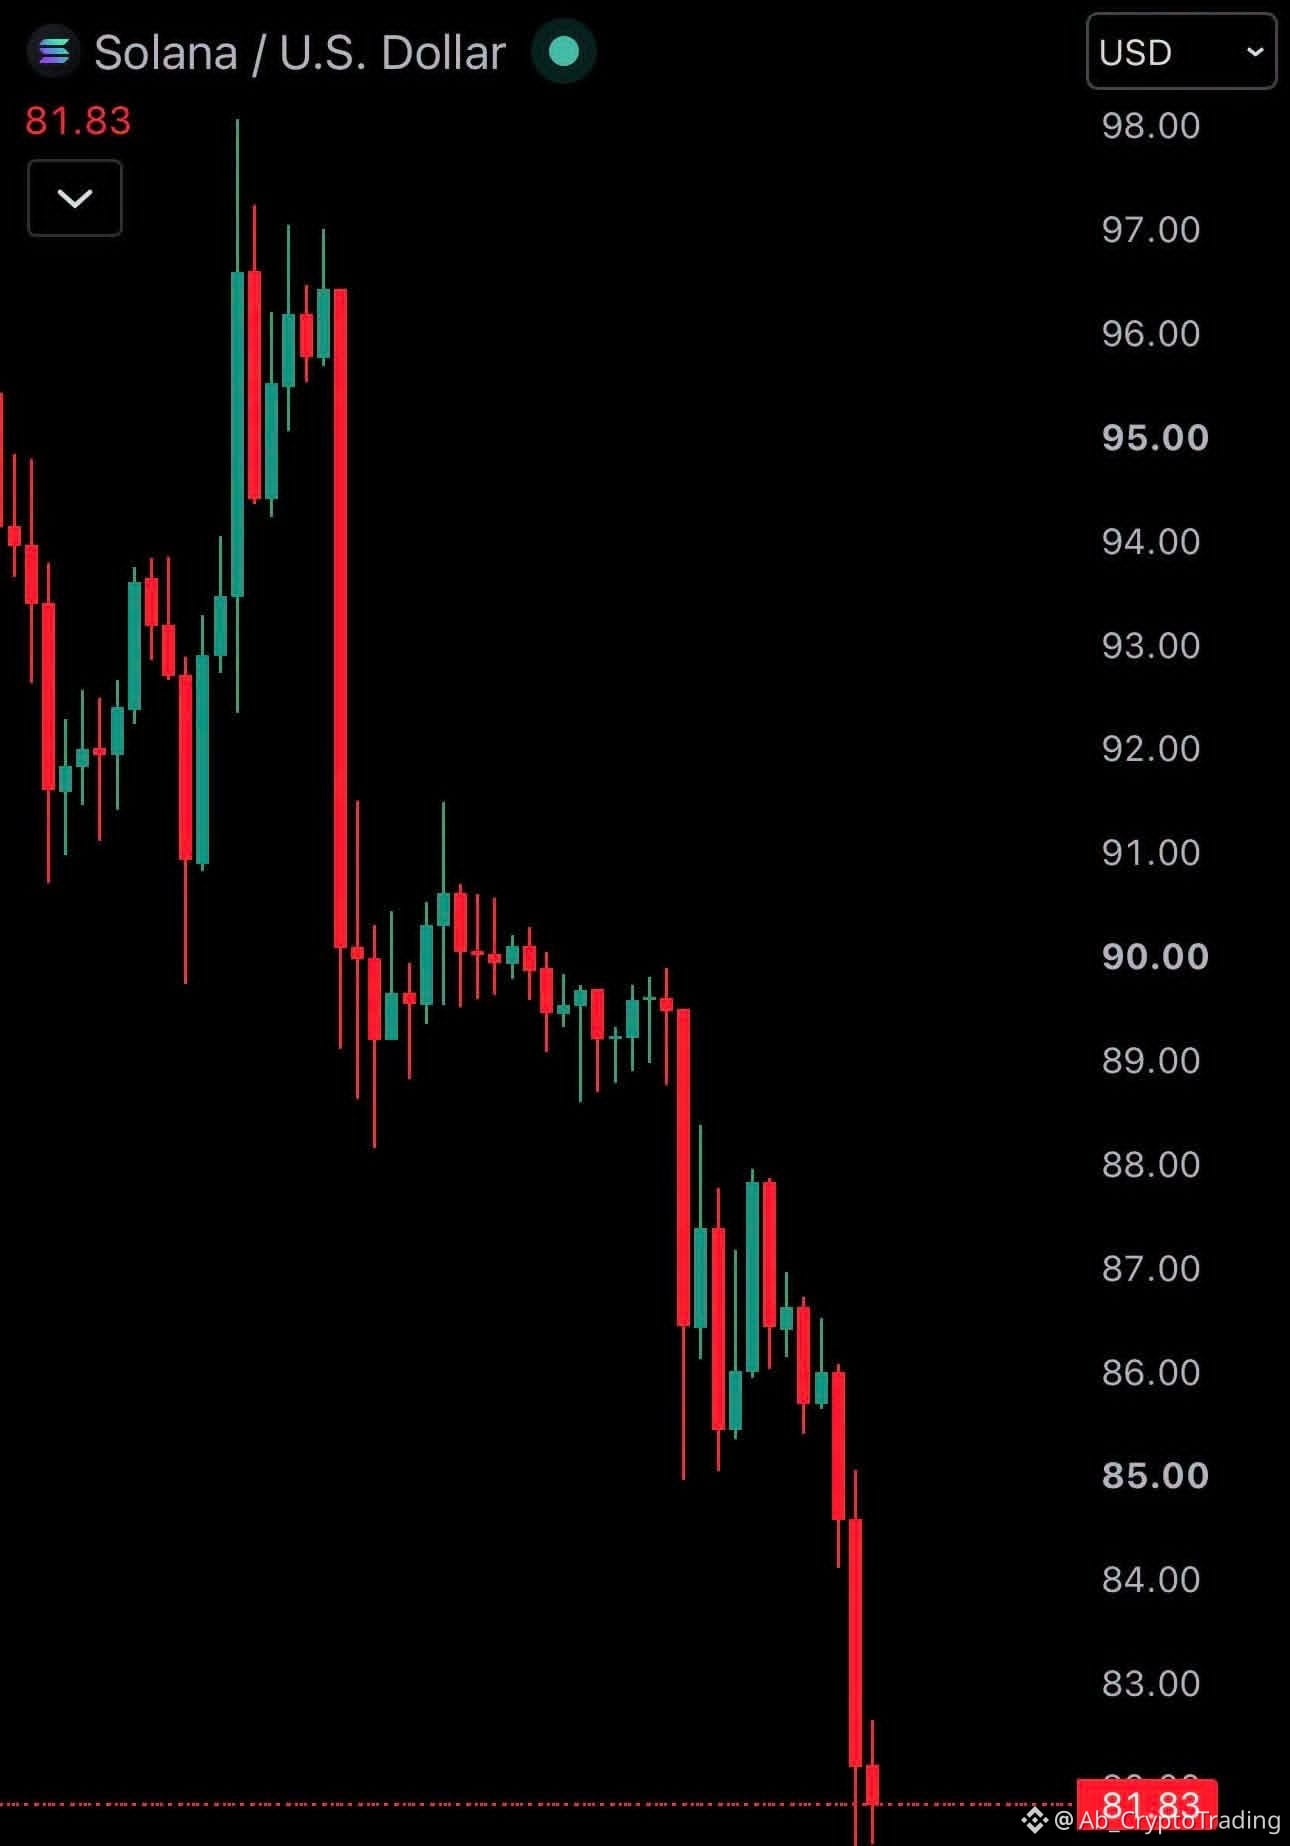
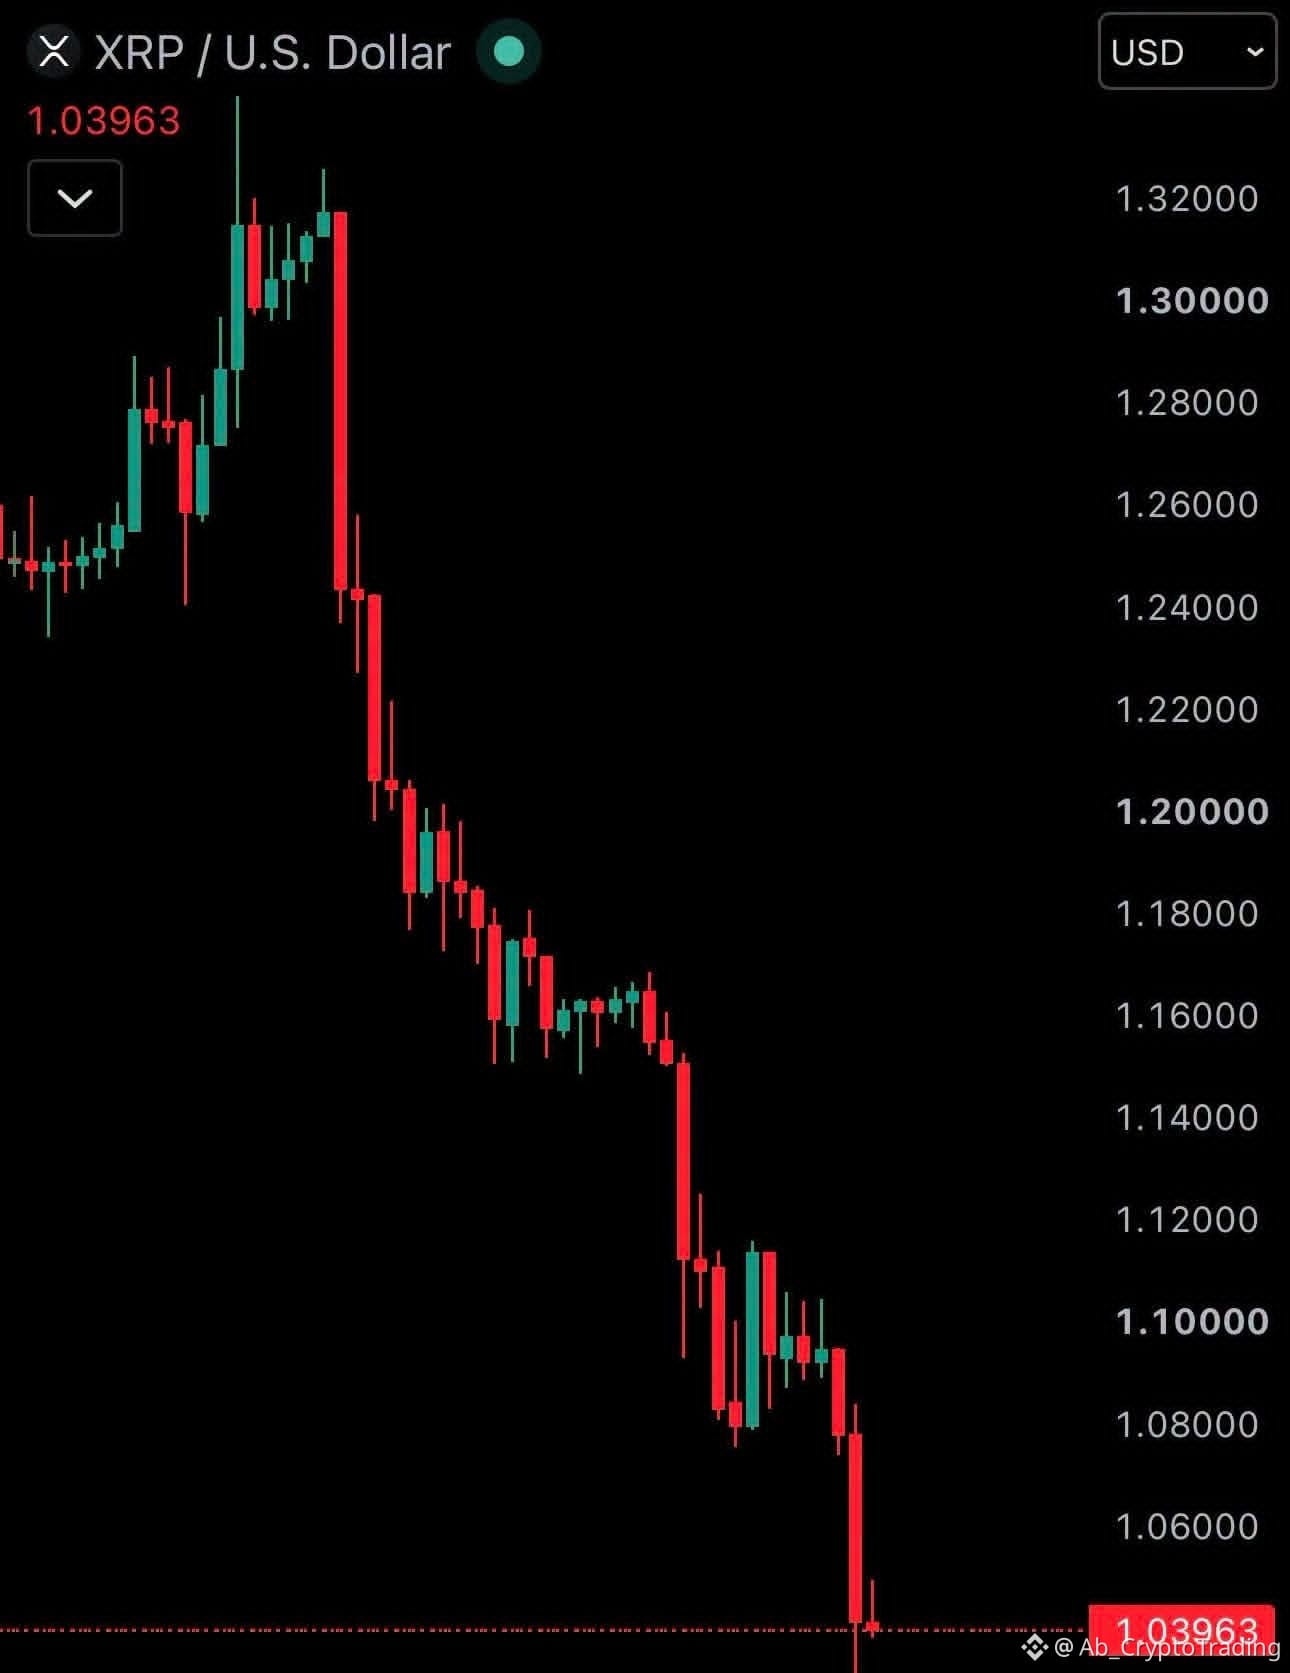
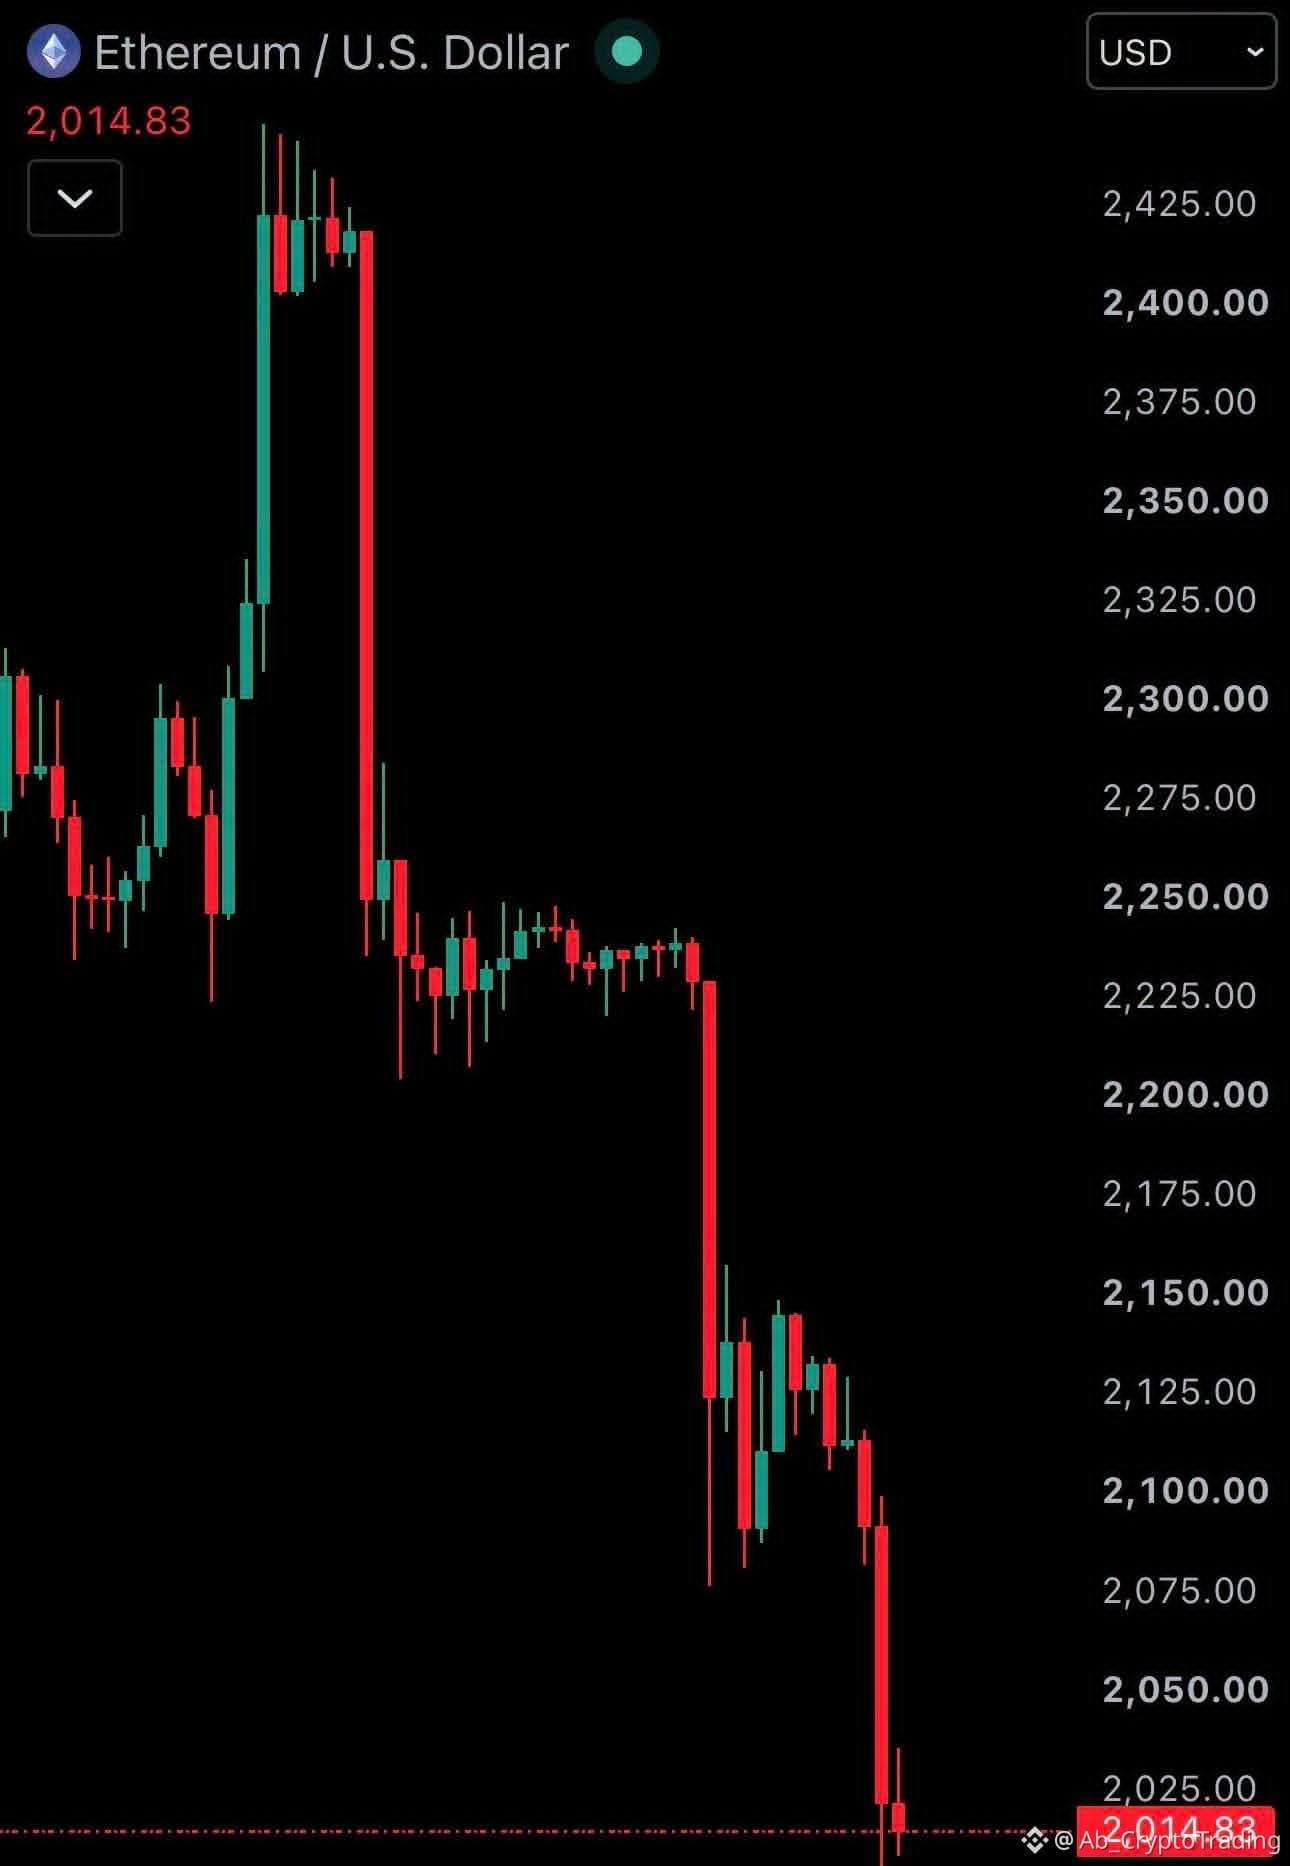
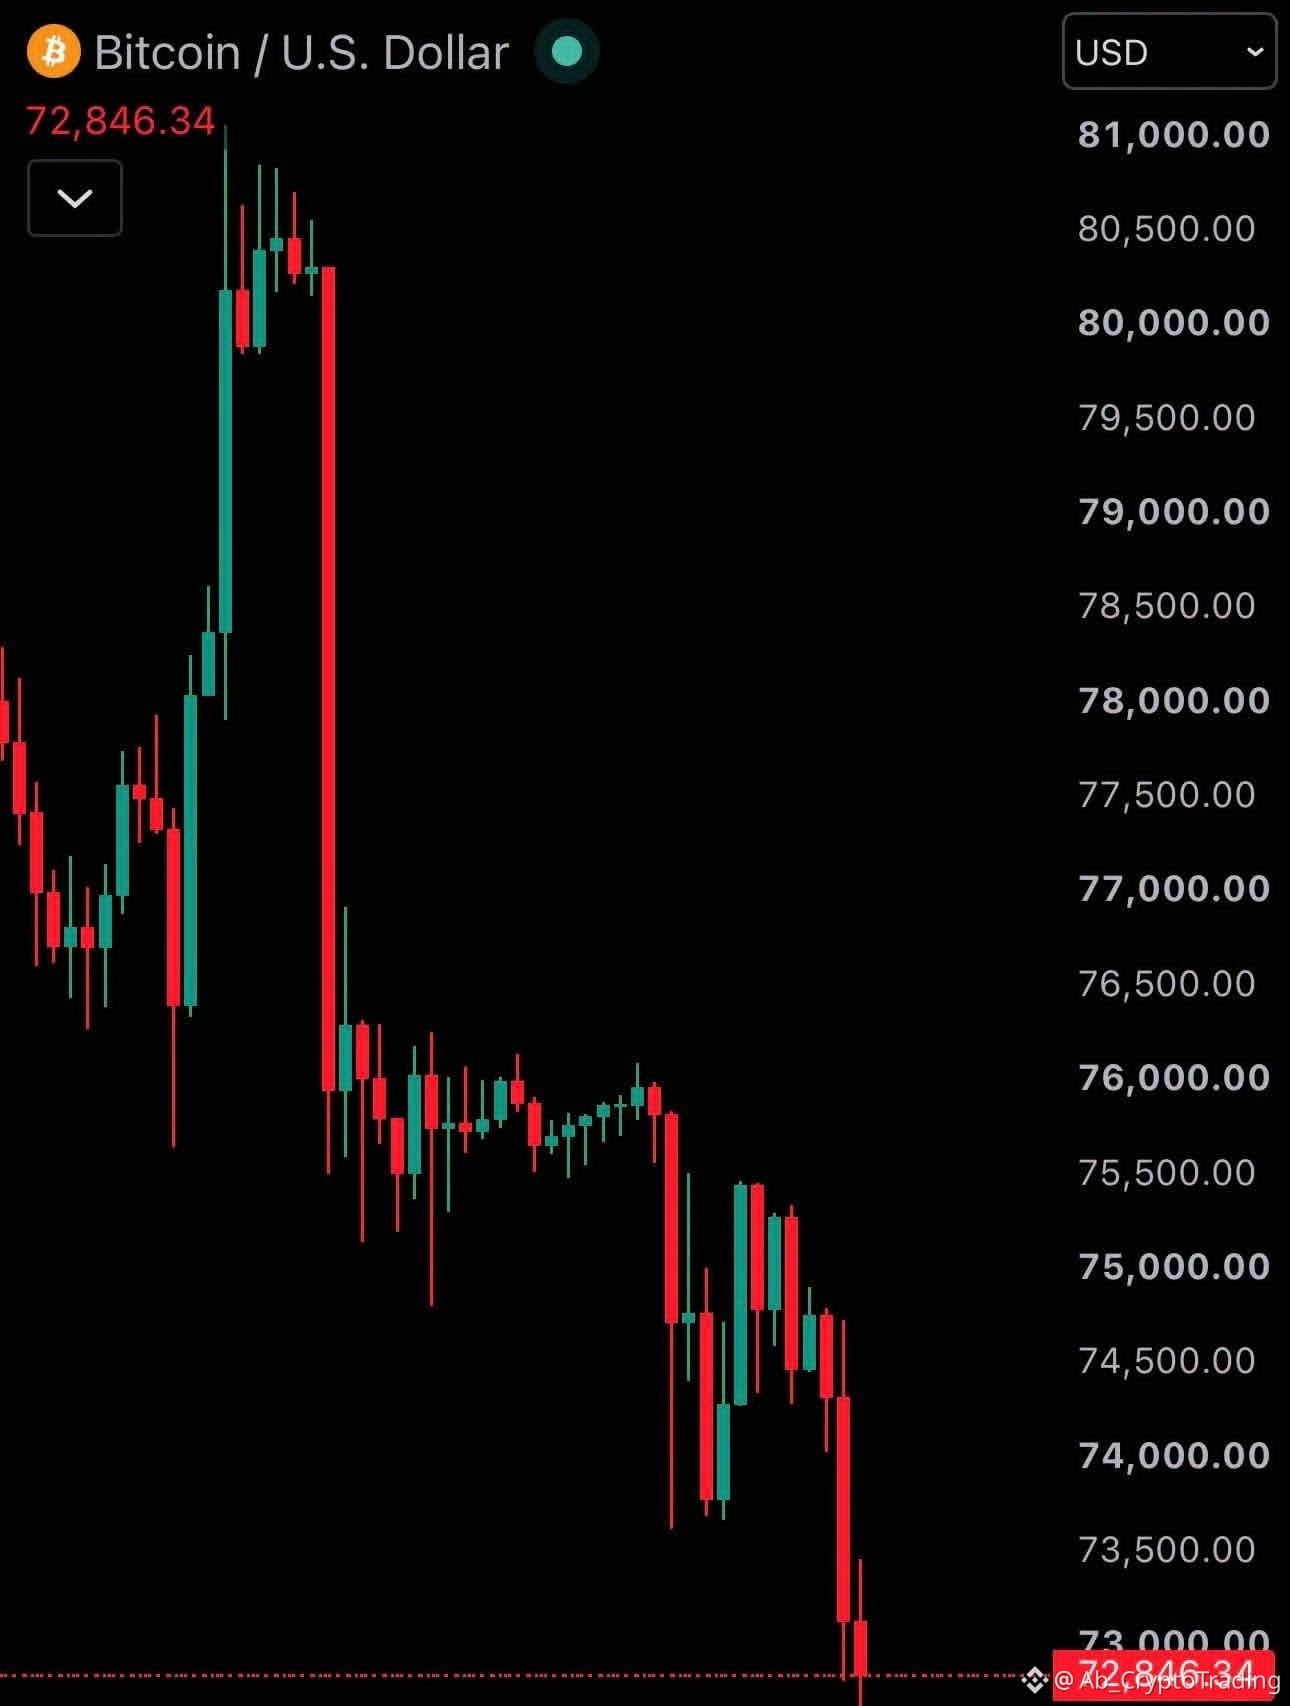
JUST IN: Crypto is dumping
$SOL falls under $82
$XRP falls under $1.05
#ETH falls under $2,015
$BTC falls under $73,000
$600,000,000 in leveraged cryptocurrency positions have been liquidated in the past 4 hours.
#BitcoinFiveWeeklyLosses #crypto #Dip #buying
JUST IN: Crypto is dumping
$SOL falls under $82
$XRP falls under $1.05
#ETH falls under $2,015
$BTC falls under $73,000
$600,000,000 in leveraged cryptocurrency positions have been liquidated in the past 4 hours.
#BitcoinFiveWeeklyLosses #crypto #Dip #buying
$SOL falls under $82
$XRP falls under $1.05
#ETH falls under $2,015
$BTC falls under $73,000
$600,000,000 in leveraged cryptocurrency positions have been liquidated in the past 4 hours.
#BitcoinFiveWeeklyLosses #crypto #Dip #buying
2
181
See translation
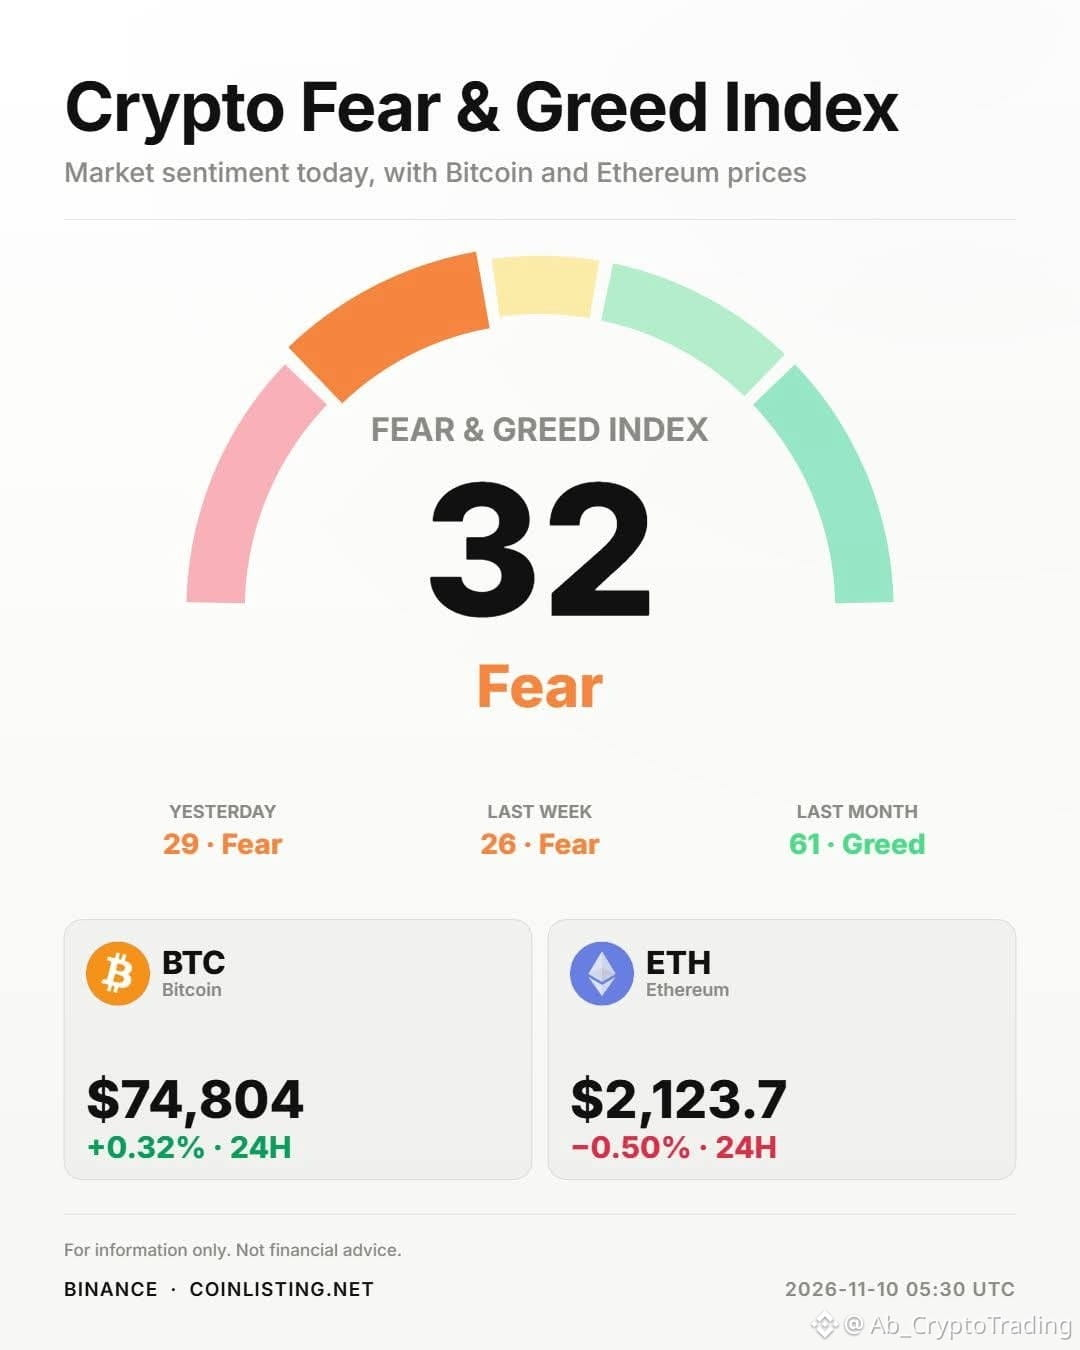
😱 Crypto Fear & Greed Index + BTC & ETH price
1. $BTC +0.32% ($74,804)
2. $ETH −0.50% ($2,123.7)
Fear & Greed 32 (Fear)
Live data: coinlisting
⚠️ Not financial advice.
#crypto #Bitcoin #Altcoins #CoinListing #BTC
😱 Crypto Fear & Greed Index + BTC & ETH price
1. $BTC +0.32% ($74,804)
2. $ETH −0.50% ($2,123.7)
Fear & Greed 32 (Fear)
Live data: coinlisting
⚠️ Not financial advice.
#crypto #Bitcoin #Altcoins #CoinListing #BTC
1. $BTC +0.32% ($74,804)
2. $ETH −0.50% ($2,123.7)
Fear & Greed 32 (Fear)
Live data: coinlisting
⚠️ Not financial advice.
#crypto #Bitcoin #Altcoins #CoinListing #BTC
2
96
See translation
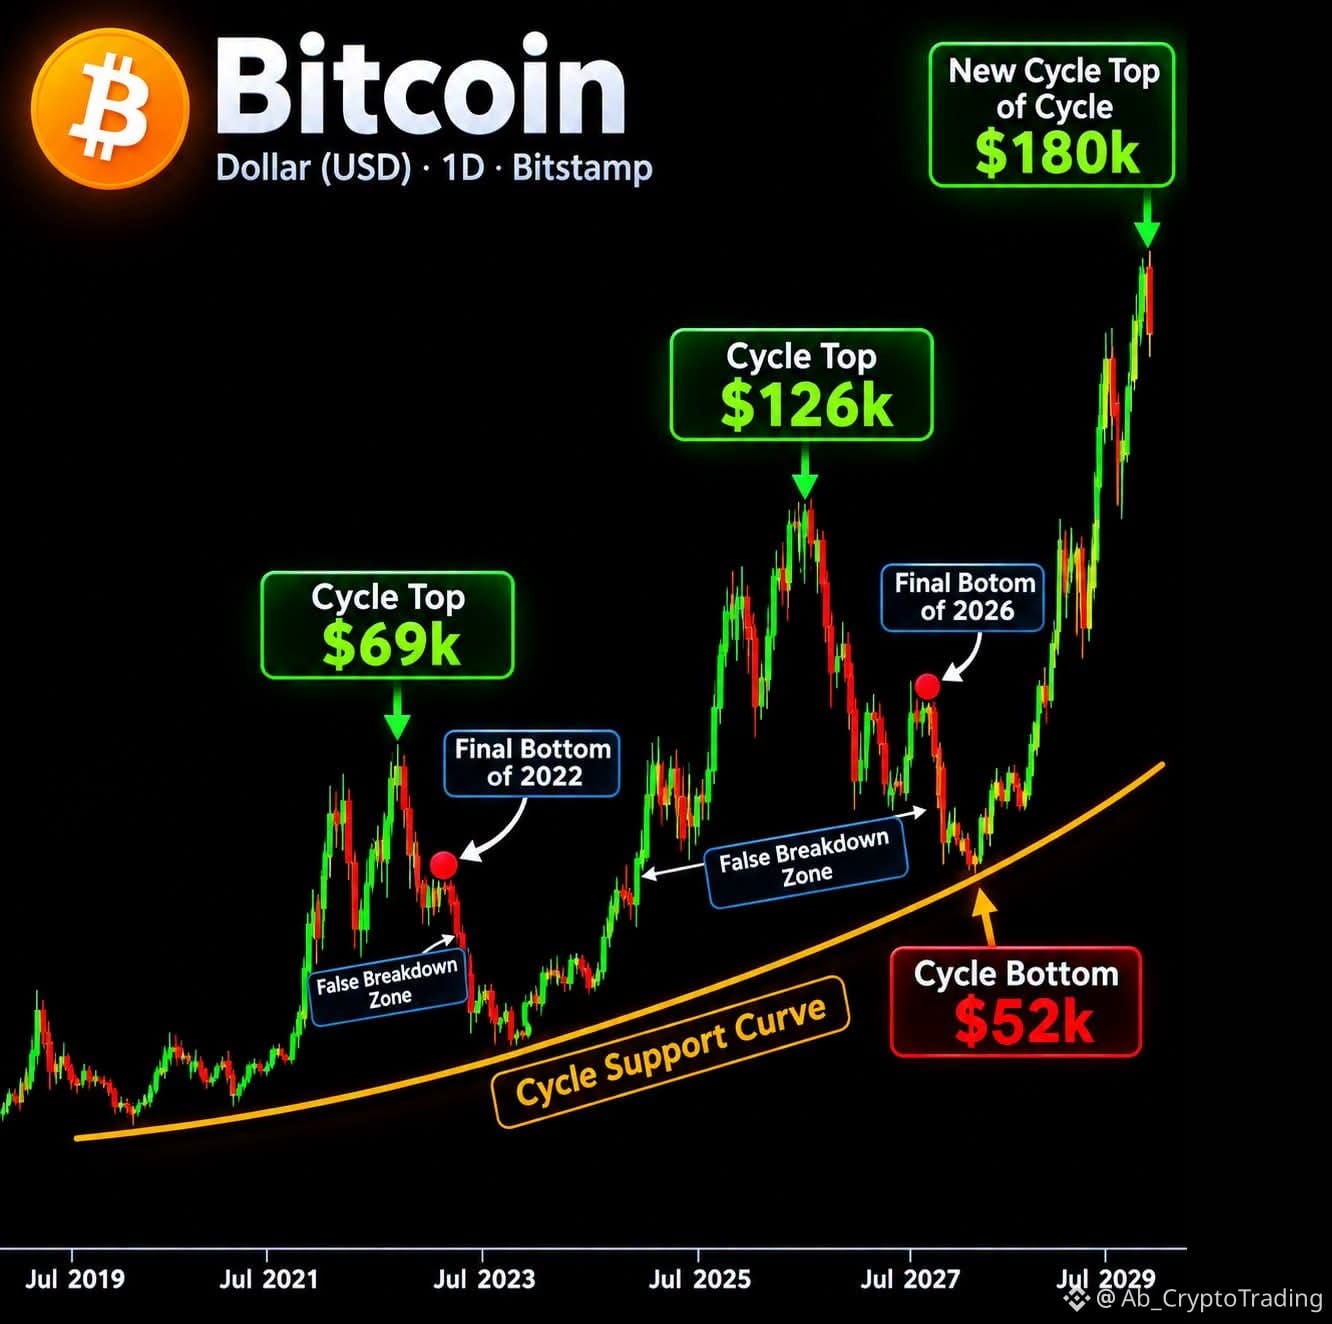
🚨 BITCOIN: ARE WE WITNESSING ANOTHER FALSE BREAKDOWN… OR THE FINAL BOTTOM BEFORE THE NEXT MASSIVE RALLY?
Bitcoin’s previous cycles have shown some fascinating similarities.
📈 2019–2022: Cycle top around $69K, followed by a major correction.
📈 2023–2026: Another cycle structure, with a projected top around $126K.
And now, the chart presents a much bigger question:
Could Bitcoin reach $180K in the next cycle, while the long-term support curve continues to hold?
Or are we placing too much confidence in historical patterns?
Let's put your conviction to the test:
If Bitcoin experiences another major correction, where would you be most comfortable buying?
🔥 $80K–$90K $BTC
🟢 $60K–$70K $BTC
🔵 $40K–$50K $BTC
💎 I'm not buying until a confirmed reversal.
And one more question:
Do you believe Bitcoin can reach $180K by 2029, or is that overly optimistic?
I want to hear your reasoning, not just your price target. 👇 #BTC #Binance
#Write2Earn #Write2Earrn #CPITestsDecemberRateOutlook
🚨 BITCOIN: ARE WE WITNESSING ANOTHER FALSE BREAKDOWN… OR THE FINAL BOTTOM BEFORE THE NEXT MASSIVE RALLY?
Bitcoin’s previous cycles have shown some fascinating similarities.
📈 2019–2022: Cycle top around $69K, followed by a major correction.
📈 2023–2026: Another cycle structure, with a projected top around $126K.
And now, the chart presents a much bigger question:
Could Bitcoin reach $180K in the next cycle, while the long-term support curve continues to hold?
Or are we placing too much confidence in historical patterns?
Let's put your conviction to the test:
If Bitcoin experiences another major correction, where would you be most comfortable buying?
🔥 $80K–$90K $BTC
🟢 $60K–$70K $BTC
🔵 $40K–$50K $BTC
💎 I'm not buying until a confirmed reversal.
And one more question:
Do you believe Bitcoin can reach $180K by 2029, or is that overly optimistic?
I want to hear your reasoning, not just your price target. 👇 #BTC #Binance
#Write2Earn #Write2Earrn #CPITestsDecemberRateOutlook
Bitcoin’s previous cycles have shown some fascinating similarities.
📈 2019–2022: Cycle top around $69K, followed by a major correction.
📈 2023–2026: Another cycle structure, with a projected top around $126K.
And now, the chart presents a much bigger question:
Could Bitcoin reach $180K in the next cycle, while the long-term support curve continues to hold?
Or are we placing too much confidence in historical patterns?
Let's put your conviction to the test:
If Bitcoin experiences another major correction, where would you be most comfortable buying?
🔥 $80K–$90K $BTC
🟢 $60K–$70K $BTC
🔵 $40K–$50K $BTC
💎 I'm not buying until a confirmed reversal.
And one more question:
Do you believe Bitcoin can reach $180K by 2029, or is that overly optimistic?
I want to hear your reasoning, not just your price target. 👇 #BTC #Binance
#Write2Earn #Write2Earrn #CPITestsDecemberRateOutlook
2
244
Log in to explore more content
Join global crypto users on Binance Square
⚡️ Get latest and useful information about crypto.
💬 Trusted by the world’s largest crypto exchange.
👍 Discover real insights from verified creators.
Email / Phone number
Trending Topics
HuangExitNvidiaStrategyInFocus
27,977 views
585 Discussing
STOCKS | Nvidia’s Jensen Huang Resigns, Colette Kress Named as Interim CEO
Binance News
·14 Likes
·16.9k views
AnthropicRejectsIPODelayValuationinQuestion
597,743 views
4,927 Discussing
BitMineReports$6.3BNetLossForFiscal2026
3,590 views
77 Discussing