
Koiisyourname
1.9k Posts

Koiisyourname
Report
Block User
mình đăng bài chỉ để nhắc nhở bản thân khi vào lệnh, không mục đích kêu gọi, tạo nhóm hay bất cứ lý do gì khác…
Frequent Trader
5 Years
1 Following
4.1K+ Followers
30.0K+ Liked
Posts
All
Quotes
PINNED
To keep up with the market, I post continuously and adjust daily instead of weekly. You need to follow closely all the posts, as they are interconnected to create a comprehensive picture.
$BTC I post the exact daily adjustments in the frame, but I also remind you of the entry; if precise, you can gain 2-3000 in price. If you want to hold long, please pay attention to some posts that analyze the 1D frame - confirming the upward or downward trend, which also includes available entry and take profit points for you to trade.
$ETH and #altcoins pay attention to the DOM post and some analysis posts for me.
The market follows a trend, but it doesn't go straight; it will fluctuate continuously, shake off positions, set traps, sell peaks, and accumulate bottoms... So, if you miss a post, don't blame me for not warning you in advance!
There are fluctuations, prices, and entry stop losses already available; if you can't follow, it's either fear or not daring to trade (because usually, entries are when it's decreasing, I suggest going long or vice versa).
One last time: I do not open copy trading, do not call orders, do not create groups, and post only to practice and remind myself when entering orders, not for any other purpose!
Best regards and decisive victory!
To keep up with the market, I post continuously and adjust daily instead of weekly. You need to follow closely all the posts, as they are interconnected to create a comprehensive picture.
$BTC I post the exact daily adjustments in the frame, but I also remind you of the entry; if precise, you can gain 2-3000 in price. If you want to hold long, please pay attention to some posts that analyze the 1D frame - confirming the upward or downward trend, which also includes available entry and take profit points for you to trade.
$ETH and #altcoins pay attention to the DOM post and some analysis posts for me.
The market follows a trend, but it doesn't go straight; it will fluctuate continuously, shake off positions, set traps, sell peaks, and accumulate bottoms... So, if you miss a post, don't blame me for not warning you in advance!
There are fluctuations, prices, and entry stop losses already available; if you can't follow, it's either fear or not daring to trade (because usually, entries are when it's decreasing, I suggest going long or vice versa).
One last time: I do not open copy trading, do not call orders, do not create groups, and post only to practice and remind myself when entering orders, not for any other purpose!
Best regards and decisive victory!
$BTC I post the exact daily adjustments in the frame, but I also remind you of the entry; if precise, you can gain 2-3000 in price. If you want to hold long, please pay attention to some posts that analyze the 1D frame - confirming the upward or downward trend, which also includes available entry and take profit points for you to trade.
$ETH and #altcoins pay attention to the DOM post and some analysis posts for me.
The market follows a trend, but it doesn't go straight; it will fluctuate continuously, shake off positions, set traps, sell peaks, and accumulate bottoms... So, if you miss a post, don't blame me for not warning you in advance!
There are fluctuations, prices, and entry stop losses already available; if you can't follow, it's either fear or not daring to trade (because usually, entries are when it's decreasing, I suggest going long or vice versa).
One last time: I do not open copy trading, do not call orders, do not create groups, and post only to practice and remind myself when entering orders, not for any other purpose!
Best regards and decisive victory!
15
10
148
2.5k
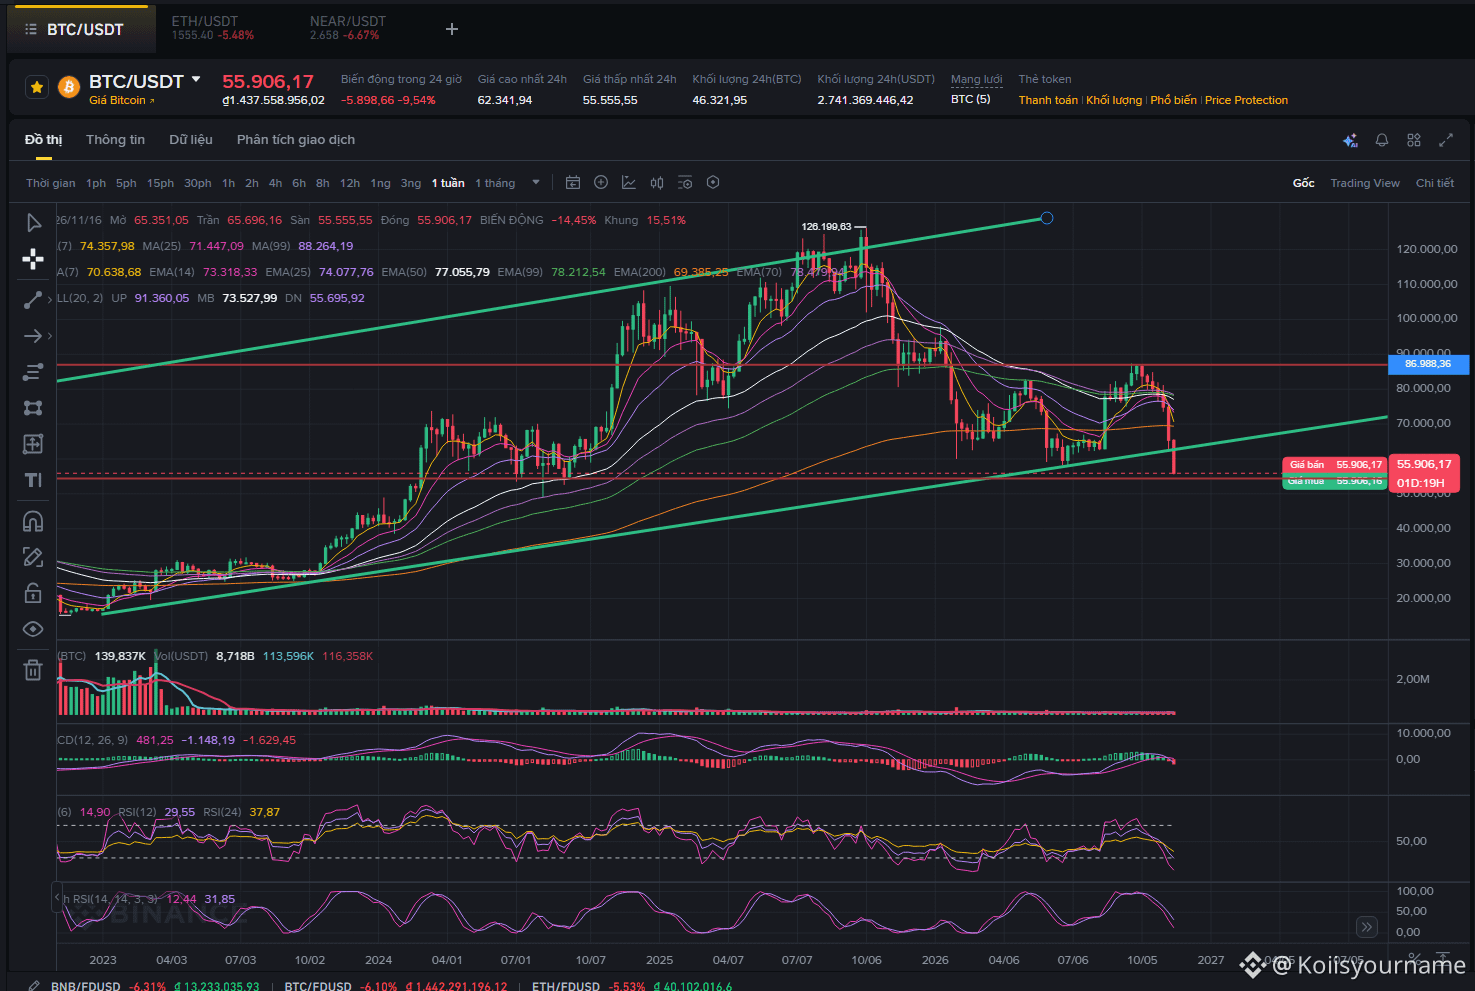
$BTC It fucking broke the early rebound trend =)) Anyone who bought spot around 7x–8x is probably nervous now, huh?
$BTC It fucking broke the early rebound trend =)) Anyone who bought spot around 7x–8x is probably nervous now, huh?
6
5
658
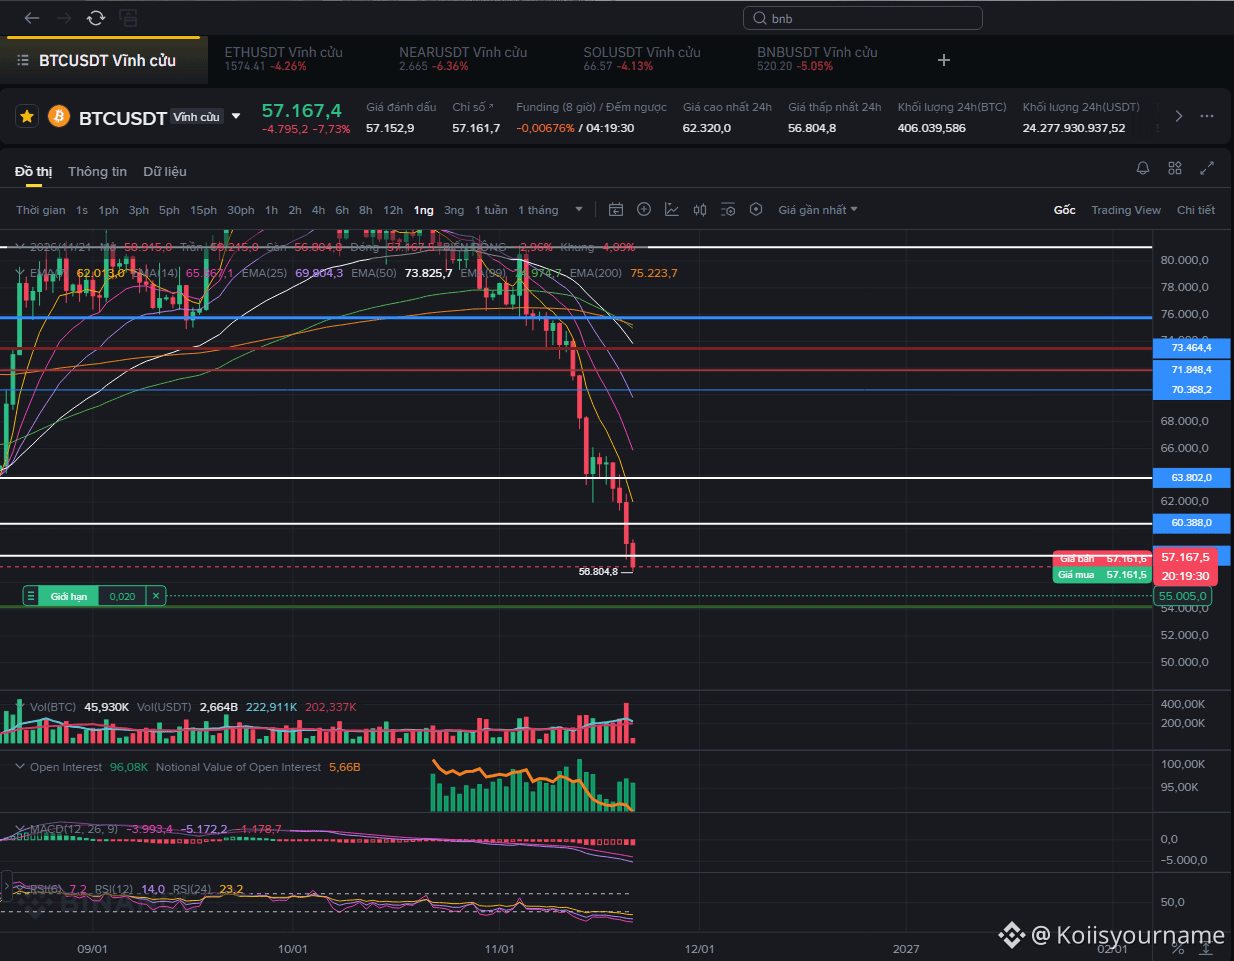
$BTC Yesterday I thought it would go back to 60K, then gradually drop to 57K, but I didn't expect it to dump straight down overnight. I give up with you guys!
{future}(BTCUSDT)
$BTC Yesterday I thought it would go back to 60K, then gradually drop to 57K, but I didn't expect it to dump straight down overnight. I give up with you guys!
Koiisyourname
·
--
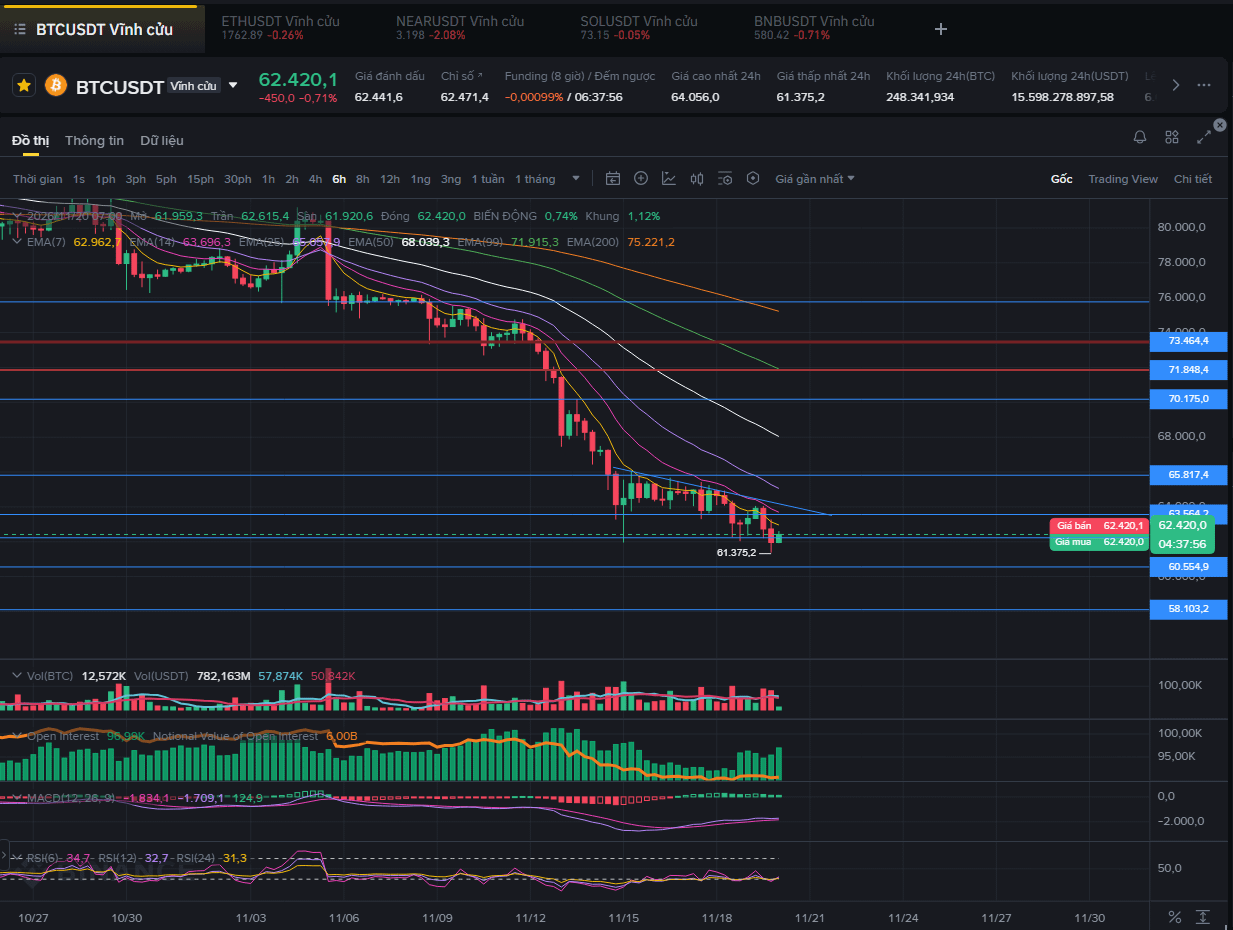
$BTC Daily range: 63K–60.5K – Downtrend continues
BTC is in a short-term downtrend within the 63K–57K price range after losing the 62K level last night. It is highly likely to retest the bottom, as shown in scenario 2 drawn earlier.
So the prediction of early accumulation around 63K–71K can be set aside. For now, though, the price action is very unclear and hard to predict, so the chance of being wrong is high, with plenty of sophisticated short traps. (Even technical analysis is no help if just one piece of positive news breaks—the chart will immediately change direction.)
Note: Short only for the short term in this price range. Don’t FOMO into shorts, or you could easily get caught in a short trap.
As for capital flows, they have remained negative for four consecutive days, with no signs of new buying coming into the market. Keep an eye on capital flows in these sensitive areas!
BTC is in a short-term downtrend within the 63K–57K price range after losing the 62K level last night. It is highly likely to retest the bottom, as shown in scenario 2 drawn earlier.
So the prediction of early accumulation around 63K–71K can be set aside. For now, though, the price action is very unclear and hard to predict, so the chance of being wrong is high, with plenty of sophisticated short traps. (Even technical analysis is no help if just one piece of positive news breaks—the chart will immediately change direction.)
Note: Short only for the short term in this price range. Don’t FOMO into shorts, or you could easily get caught in a short trap.
As for capital flows, they have remained negative for four consecutive days, with no signs of new buying coming into the market. Keep an eye on capital flows in these sensitive areas!
12
8
1.6k
Eat, then go to sleep. Good night, ace!
$BTC
{future}(BTCUSDT)
Eat, then go to sleep. Good night, ace!
$BTC
$BTC
13
8
4.3k

This is how a guy with trading experience draws a chart :)))
Even if I drew you a perfectly clear chart, you still wouldn’t be able to read it. You post nonsense charts with random trend lines, then claim to have trading experience. You say things just to get people calling you stupid, and keep making a fool of yourself!
There’s no benefit to posting— you just end up dealing with idiots who come to nitpick. There are really a lot of them, and they’re downright aggressive!
This is how a guy with trading experience draws a chart :)))
Even if I drew you a perfectly clear chart, you still wouldn’t be able to read it. You post nonsense charts with random trend lines, then claim to have trading experience. You say things just to get people calling you stupid, and keep making a fool of yourself!
There’s no benefit to posting— you just end up dealing with idiots who come to nitpick. There are really a lot of them, and they’re downright aggressive!
Even if I drew you a perfectly clear chart, you still wouldn’t be able to read it. You post nonsense charts with random trend lines, then claim to have trading experience. You say things just to get people calling you stupid, and keep making a fool of yourself!
There’s no benefit to posting— you just end up dealing with idiots who come to nitpick. There are really a lot of them, and they’re downright aggressive!
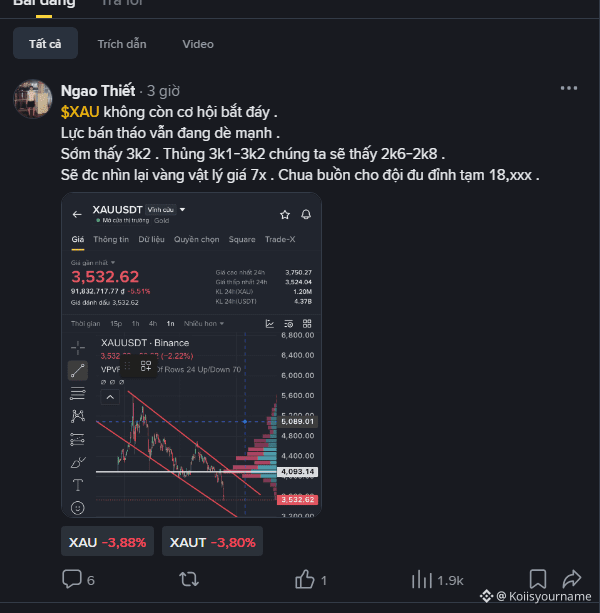

Ngao Thiết
·
--
Analysis is bullshit :)) The chart looks like it was drawn by someone with zero trading experience. Just trying to impress beginners.
11
9
2.9k
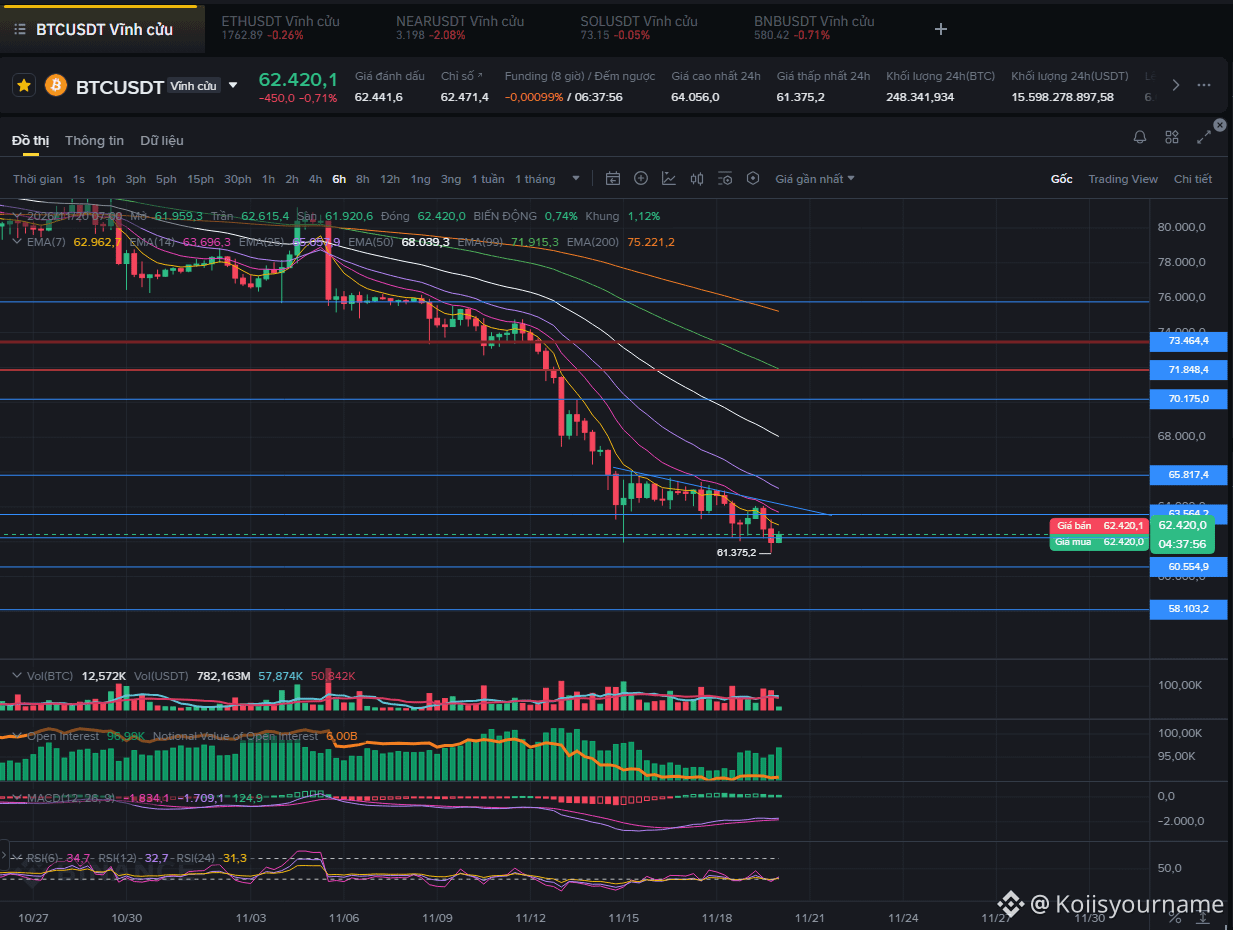
$BTC Daily range: 63K–60.5K – Downtrend continues
BTC is in a short-term downtrend within the 63K–57K price range after losing the 62K level last night. It is highly likely to retest the bottom, as shown in scenario 2 drawn earlier.
So the prediction of early accumulation around 63K–71K can be set aside. For now, though, the price action is very unclear and hard to predict, so the chance of being wrong is high, with plenty of sophisticated short traps. (Even technical analysis is no help if just one piece of positive news breaks—the chart will immediately change direction.)
Note: Short only for the short term in this price range. Don’t FOMO into shorts, or you could easily get caught in a short trap.
As for capital flows, they have remained negative for four consecutive days, with no signs of new buying coming into the market. Keep an eye on capital flows in these sensitive areas!
{future}(BTCUSDT)
$BTC Daily range: 63K–60.5K – Downtrend continues
BTC is in a short-term downtrend within the 63K–57K price range after losing the 62K level last night. It is highly likely to retest the bottom, as shown in scenario 2 drawn earlier.
So the prediction of early accumulation around 63K–71K can be set aside. For now, though, the price action is very unclear and hard to predict, so the chance of being wrong is high, with plenty of sophisticated short traps. (Even technical analysis is no help if just one piece of positive news breaks—the chart will immediately change direction.)
Note: Short only for the short term in this price range. Don’t FOMO into shorts, or you could easily get caught in a short trap.
As for capital flows, they have remained negative for four consecutive days, with no signs of new buying coming into the market. Keep an eye on capital flows in these sensitive areas!
BTC is in a short-term downtrend within the 63K–57K price range after losing the 62K level last night. It is highly likely to retest the bottom, as shown in scenario 2 drawn earlier.
So the prediction of early accumulation around 63K–71K can be set aside. For now, though, the price action is very unclear and hard to predict, so the chance of being wrong is high, with plenty of sophisticated short traps. (Even technical analysis is no help if just one piece of positive news breaks—the chart will immediately change direction.)
Note: Short only for the short term in this price range. Don’t FOMO into shorts, or you could easily get caught in a short trap.
As for capital flows, they have remained negative for four consecutive days, with no signs of new buying coming into the market. Keep an eye on capital flows in these sensitive areas!
10
1
17
6k
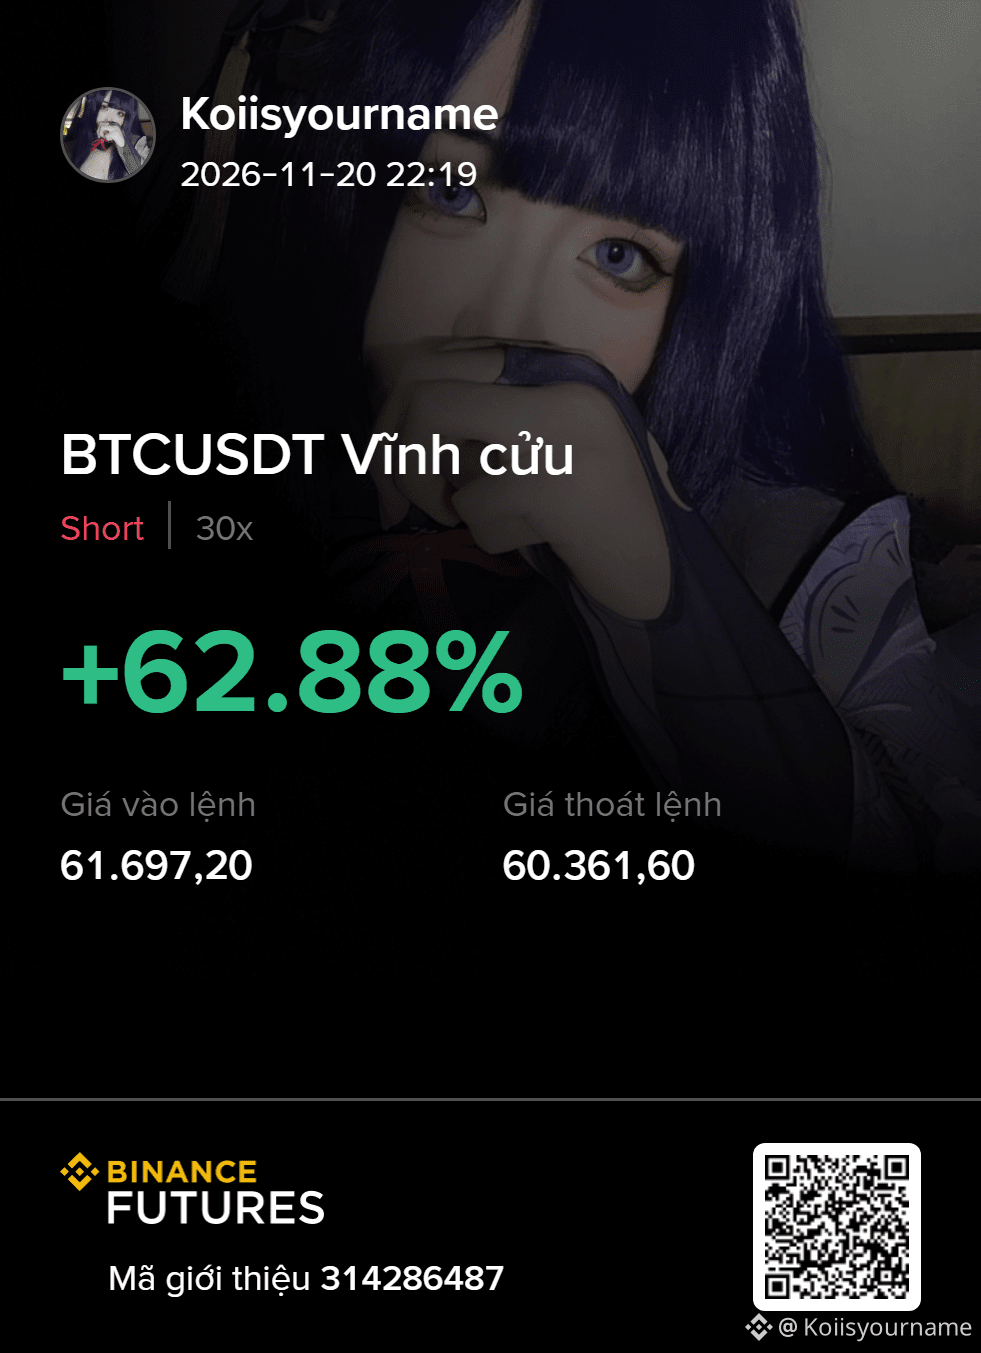
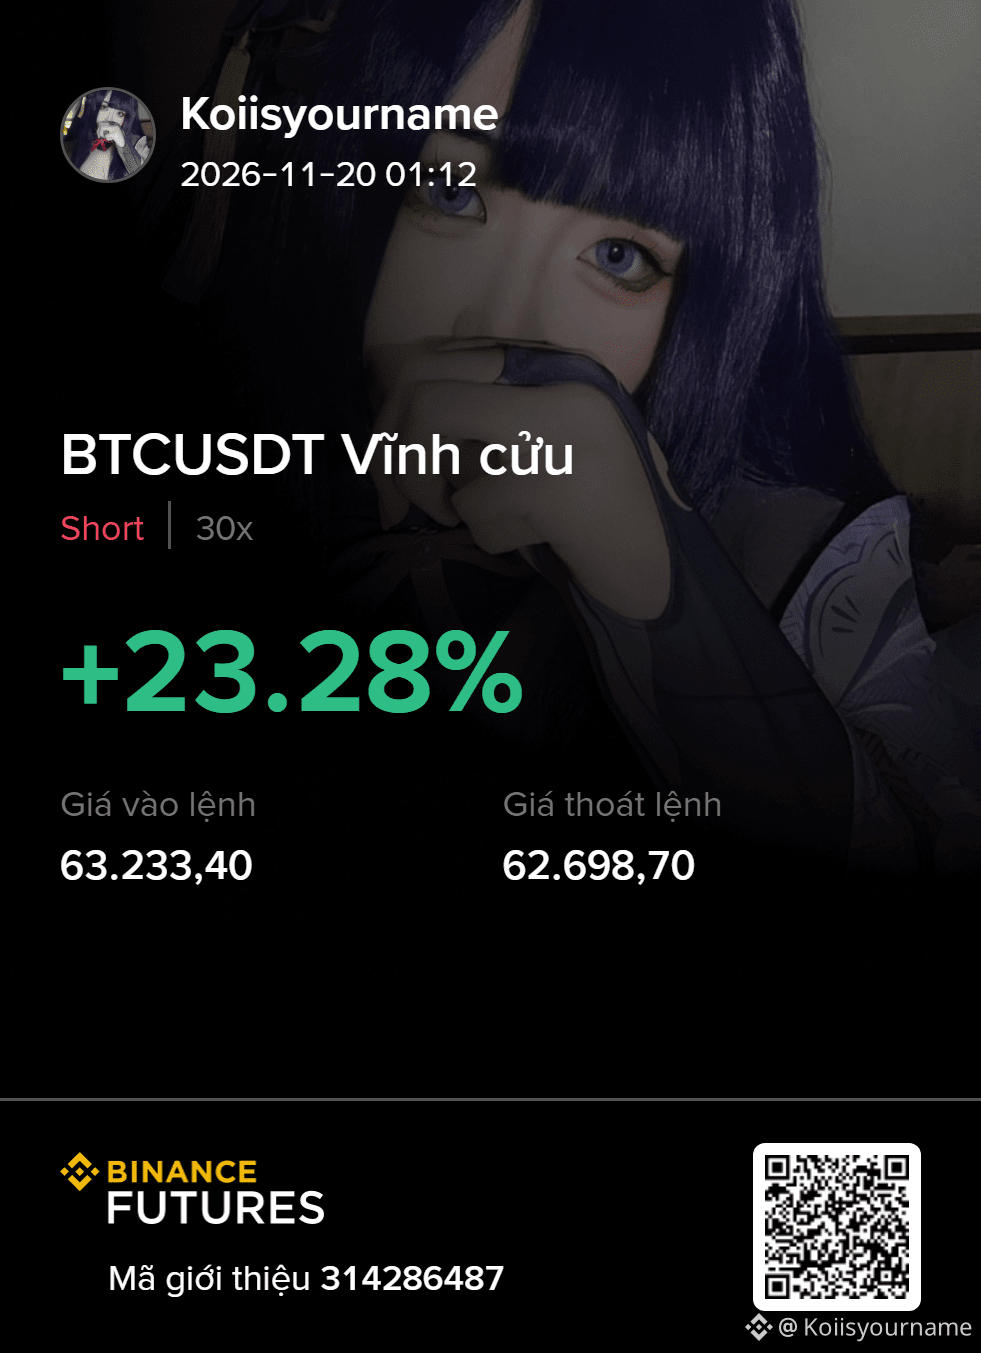
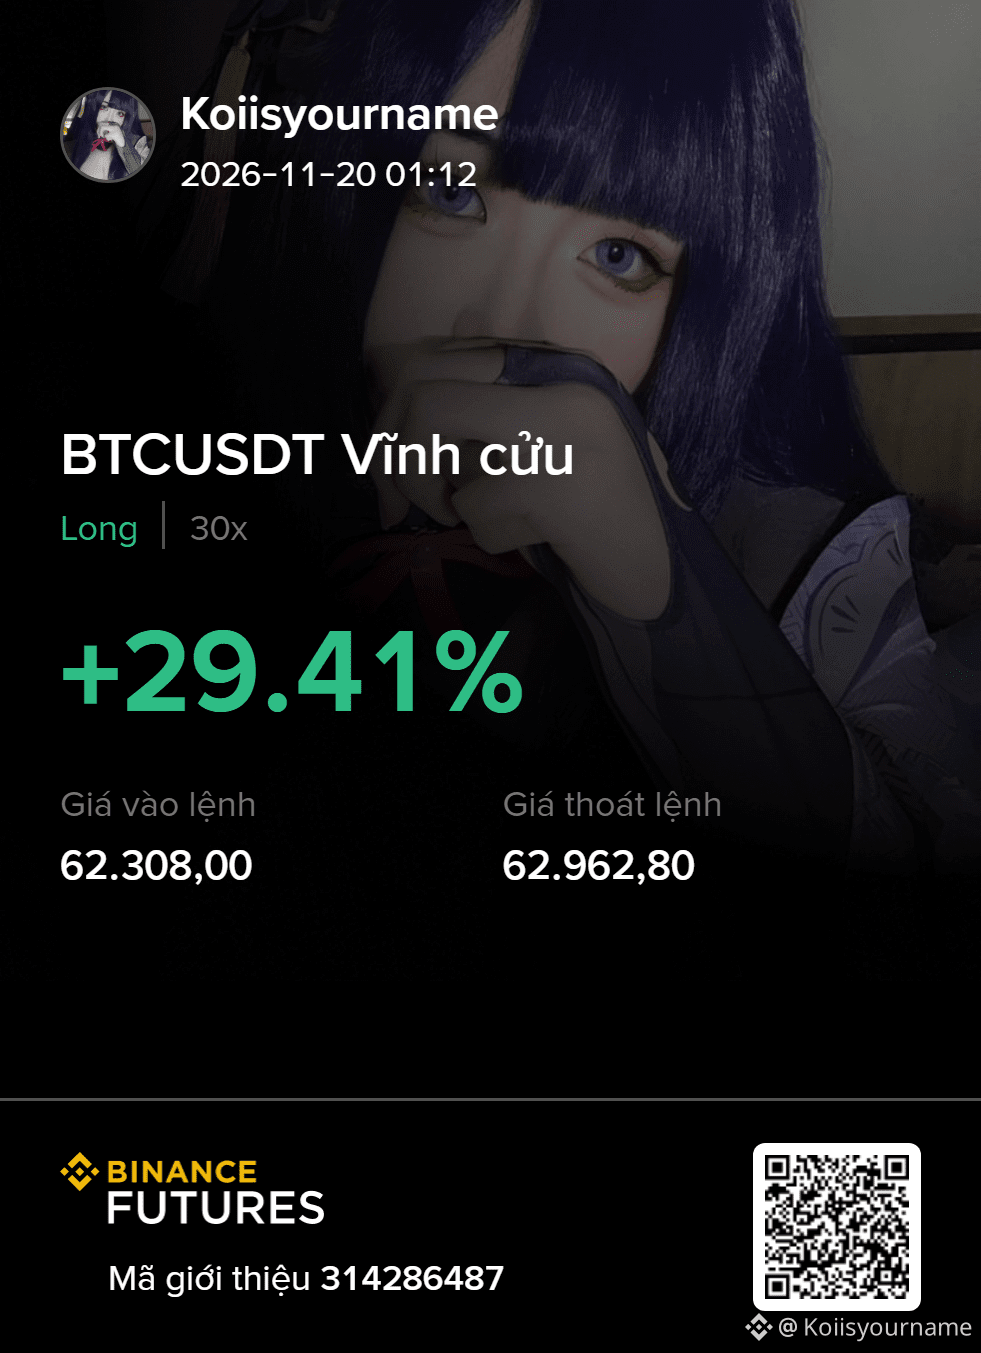
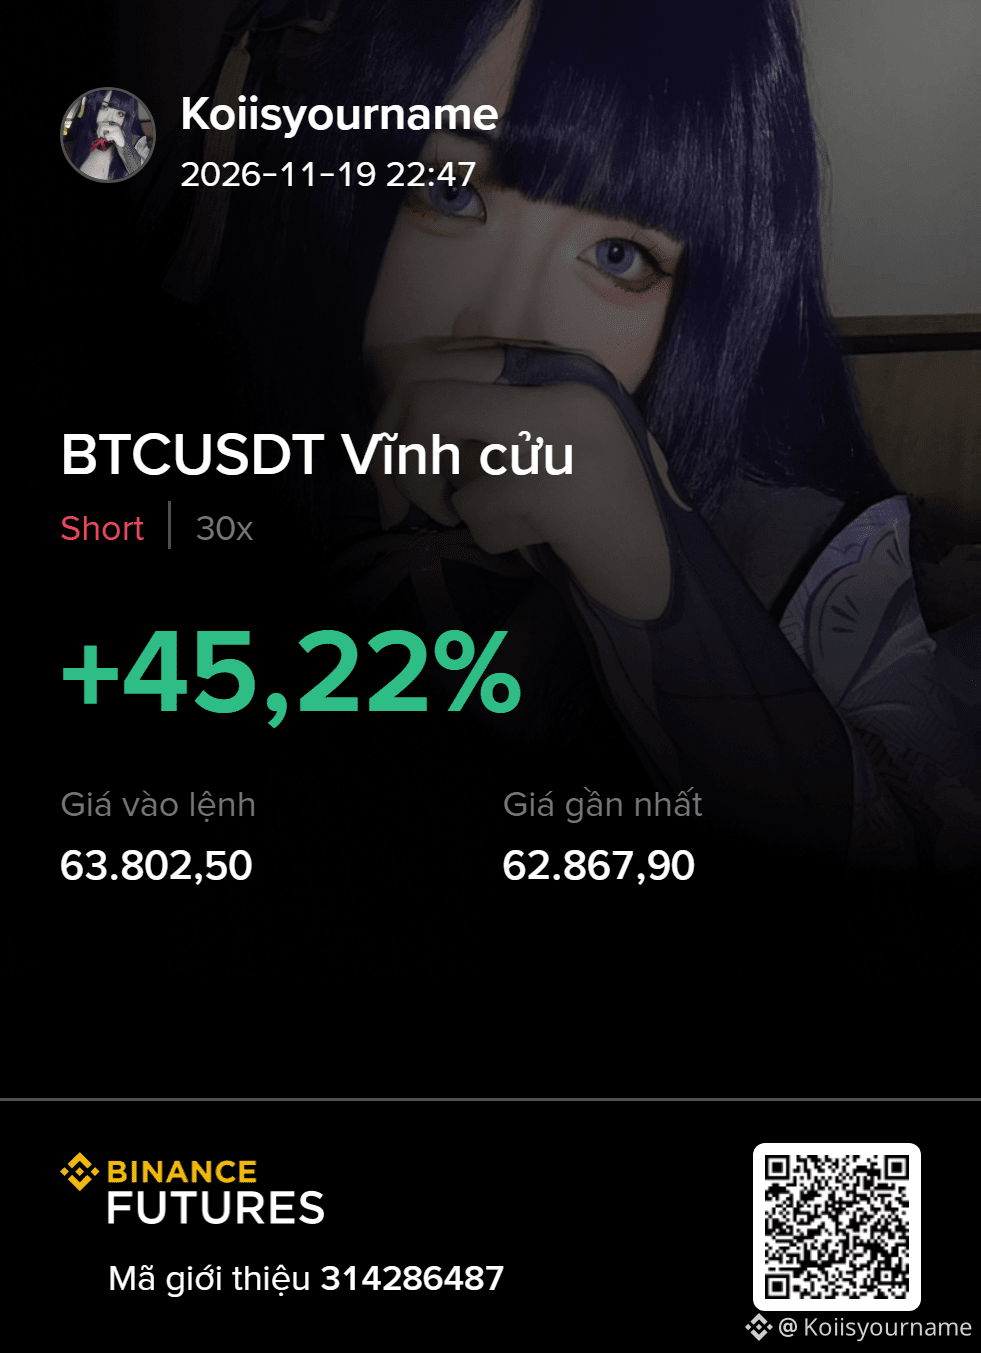
Got 3 trades in and then went to sleep; not bad for a day, even though I didn't hit my daily KPI :\
Sleep well, folks. Sleep soundly—don't dream that it goes up to 71 or down to 59. It's so stupid to keep guessing!
$BTC
{future}(BTCUSDT)
Got 3 trades in and then went to sleep; not bad for a day, even though I didn't hit my daily KPI :\
Sleep well, folks. Sleep soundly—don't dream that it goes up to 71 or down to 59. It's so stupid to keep guessing!
$BTC
Sleep well, folks. Sleep soundly—don't dream that it goes up to 71 or down to 59. It's so stupid to keep guessing!
$BTC
5
5
2.4k
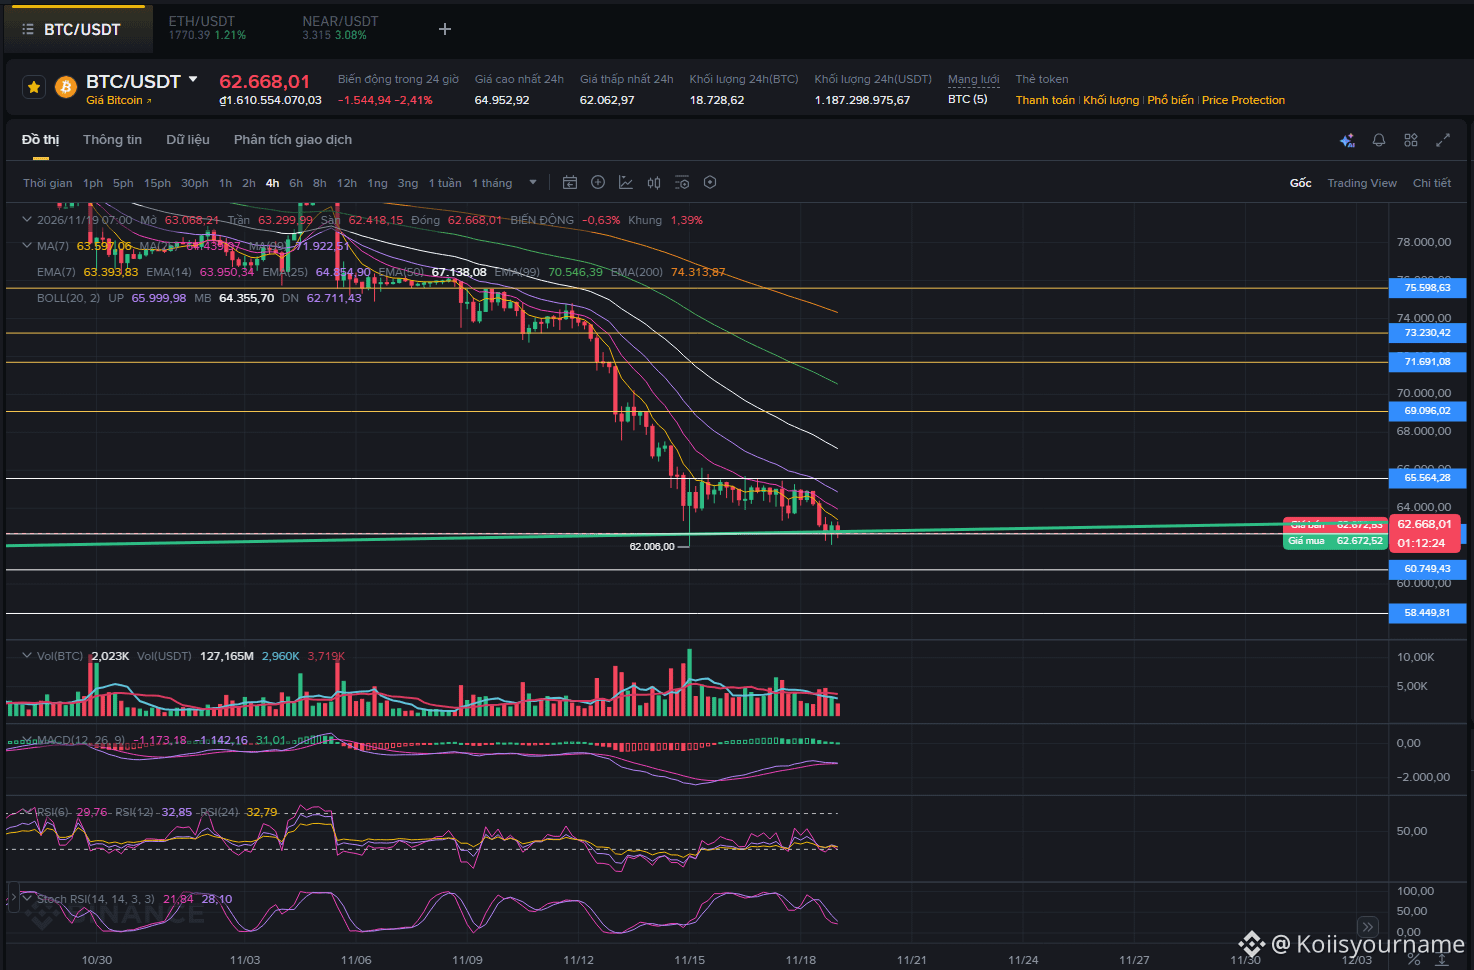
$BTC Testing the 4-hour timeframe bottom for the second time; all indicators across all timeframes are negative.
There has been no large volume to support the downtrend. The pattern is showing signs that the downtrend will continue.
The market has been selling off for 3 consecutive days in the 65–62 price range, with persistent negative cash flow. SW support in the 6x price range is currently just long!
Subjective assessment: The price is still within the 63–71K range, but there are no signs of strong bottom-fishing yet. Watch the 63–62 area closely; if the price breaks below it, the downtrend will continue toward the 5x range.
$BTC Testing the 4-hour timeframe bottom for the second time; all indicators across all timeframes are negative.
There has been no large volume to support the downtrend. The pattern is showing signs that the downtrend will continue.
The market has been selling off for 3 consecutive days in the 65–62 price range, with persistent negative cash flow. SW support in the 6x price range is currently just long!
Subjective assessment: The price is still within the 63–71K range, but there are no signs of strong bottom-fishing yet. Watch the 63–62 area closely; if the price breaks below it, the downtrend will continue toward the 5x range.
There has been no large volume to support the downtrend. The pattern is showing signs that the downtrend will continue.
The market has been selling off for 3 consecutive days in the 65–62 price range, with persistent negative cash flow. SW support in the 6x price range is currently just long!
Subjective assessment: The price is still within the 63–71K range, but there are no signs of strong bottom-fishing yet. Watch the 63–62 area closely; if the price breaks below it, the downtrend will continue toward the 5x range.
13
15
3.7k
No opinion for now! $BTC The weekly candle looks bad, MACD has crossed below zero, and the short-, medium-, and long-term trends are still down.
Price is testing the bottom around 63–62K, where there is fairly strong buying pressure! It hasn’t retested the level a second time yet.
- Moving sideways while waiting for news and testing buying pressure; many traders are still entering long positions around 63K.
Nothing is clear yet. The sideways outlook within the 63–71K range remains the preferred view, but there’s no concrete basis for it yet!
No opinion for now! $BTC The weekly candle looks bad, MACD has crossed below zero, and the short-, medium-, and long-term trends are still down.
Price is testing the bottom around 63–62K, where there is fairly strong buying pressure! It hasn’t retested the level a second time yet.
- Moving sideways while waiting for news and testing buying pressure; many traders are still entering long positions around 63K.
Nothing is clear yet. The sideways outlook within the 63–71K range remains the preferred view, but there’s no concrete basis for it yet!
Price is testing the bottom around 63–62K, where there is fairly strong buying pressure! It hasn’t retested the level a second time yet.
- Moving sideways while waiting for news and testing buying pressure; many traders are still entering long positions around 63K.
Nothing is clear yet. The sideways outlook within the 63–71K range remains the preferred view, but there’s no concrete basis for it yet!

2209NY
·
--
The weekly candle has closed. Do you have any short-term outlook?
2
11
2.6k
I think we shouldn't go long at this point!
$BTC
I think we shouldn't go long at this point!
$BTC
$BTC
6
7
2.5k
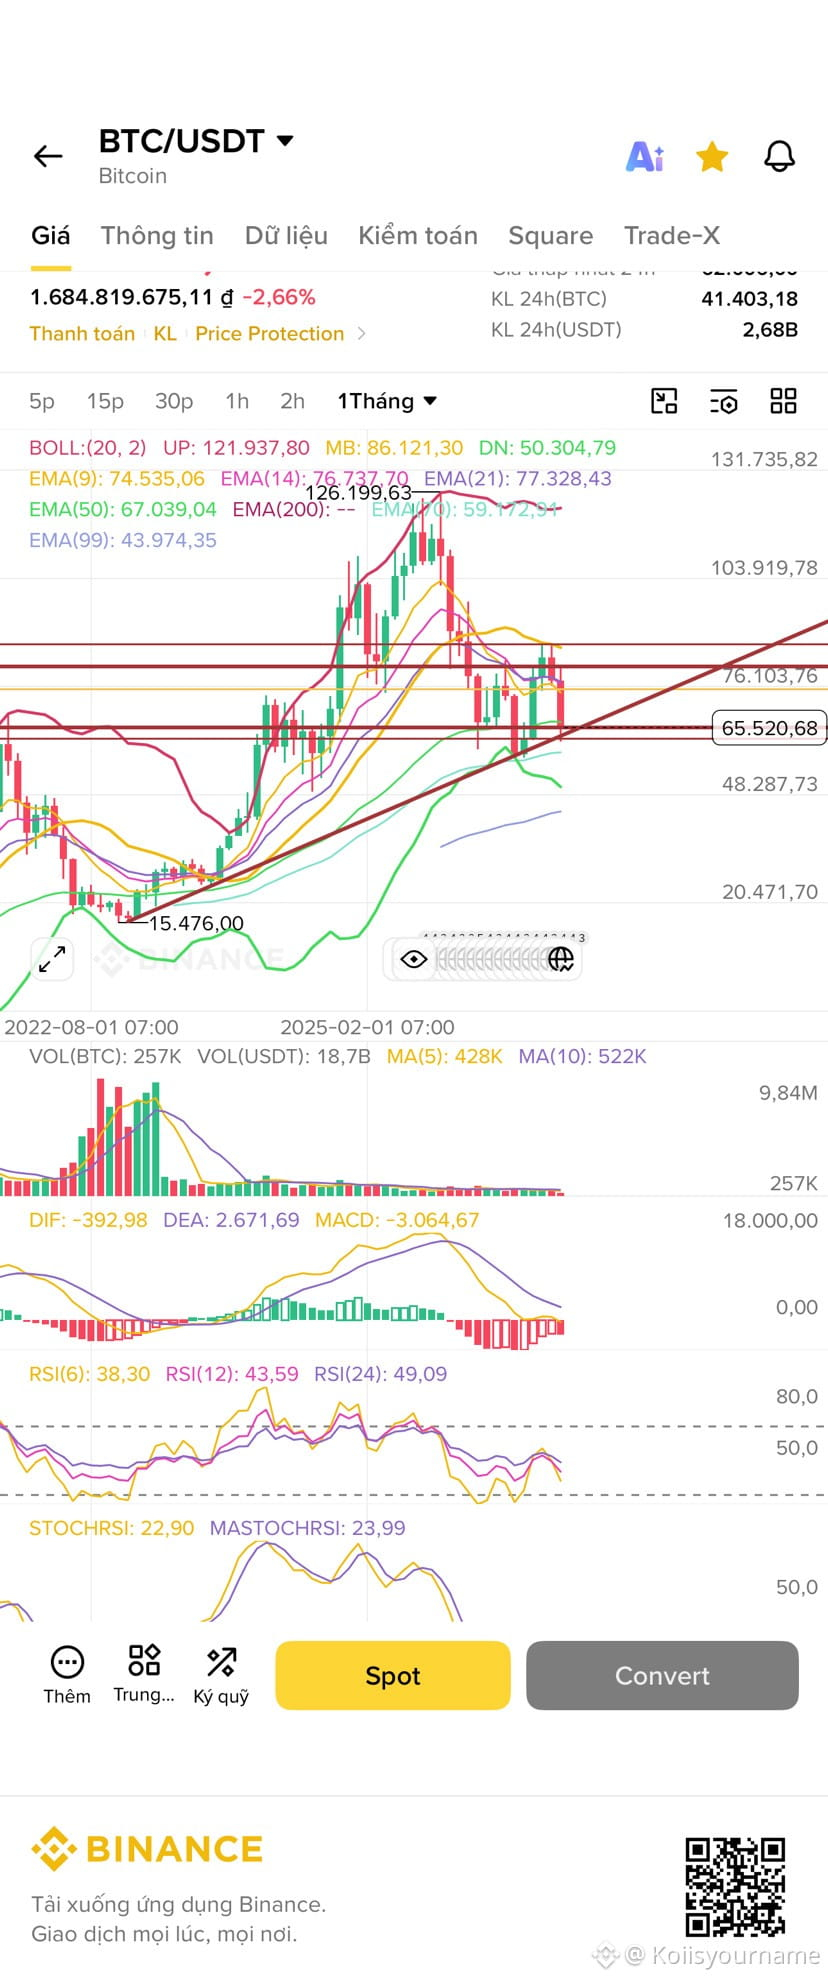
I’m sending the monthly chart for $BTC too, so nobody has to wonder. I’ve been getting lots of questions since yesterday about the bottom and people being so worried!
In a few days, rumors about 3x will start buzzing again, then everyone will pile into shorts and pay negative funding. When it sweeps with one green candle, they’ll call it a scam again! 🐧
I’m sending the monthly chart for $BTC too, so nobody has to wonder. I’ve been getting lots of questions since yesterday about the bottom and people being so worried!
In a few days, rumors about 3x will start buzzing again, then everyone will pile into shorts and pay negative funding. When it sweeps with one green candle, they’ll call it a scam again! 🐧
In a few days, rumors about 3x will start buzzing again, then everyone will pile into shorts and pay negative funding. When it sweeps with one green candle, they’ll call it a scam again! 🐧
Koiisyourname
·
--
$BTC The exact range right now is 63–71, and we’re still within the accumulation zone—not in the 65–5X range yet! So many people have been asking that I had to rush to answer!
Right now, it’s just a candle with a long lower wick; a bottom hasn’t truly been confirmed yet.
That wick from Saturday night to Sunday morning could be a mass grave for everyone who went long early at 65K or above. 🤐
$BTC
Right now, it’s just a candle with a long lower wick; a bottom hasn’t truly been confirmed yet.
That wick from Saturday night to Sunday morning could be a mass grave for everyone who went long early at 65K or above. 🤐
$BTC
10
14
4.5k
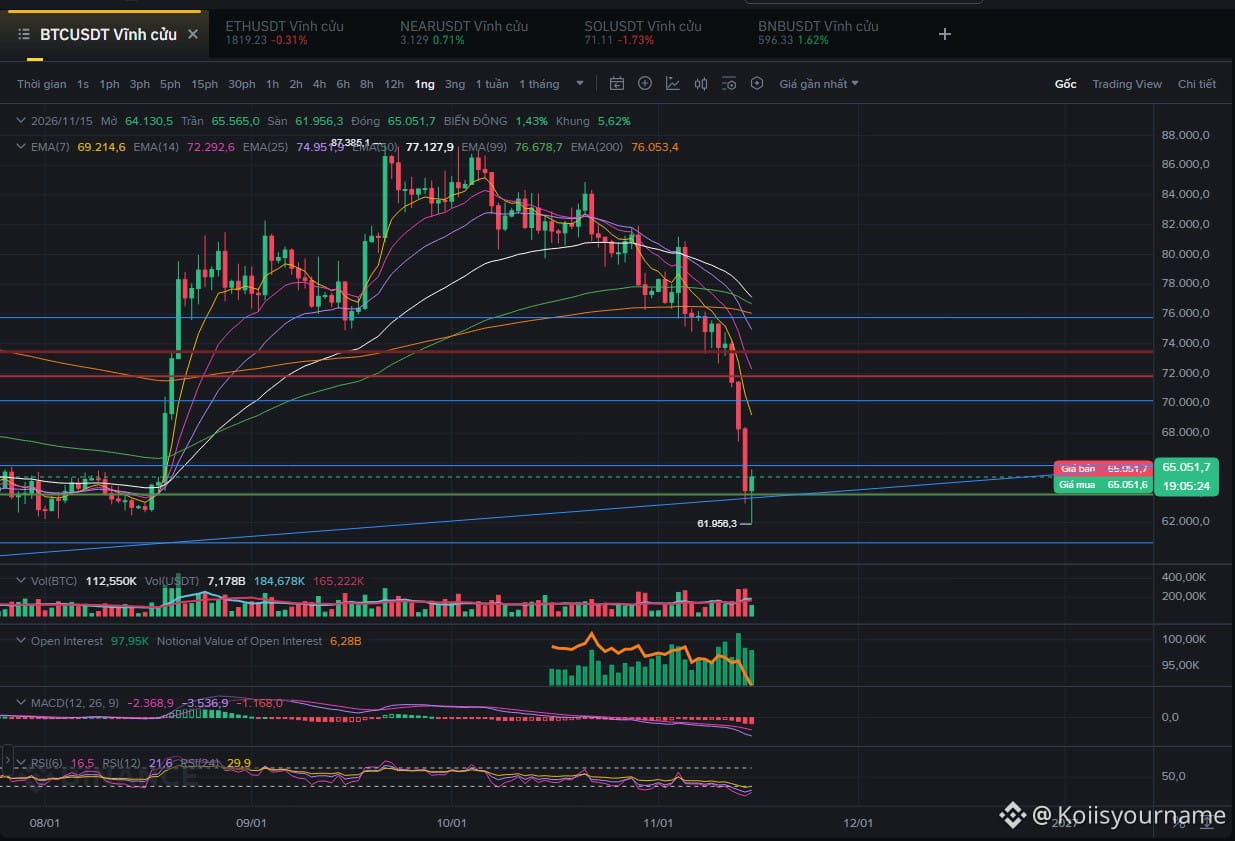
$BTC The exact range right now is 63–71, and we’re still within the accumulation zone—not in the 65–5X range yet! So many people have been asking that I had to rush to answer!
Right now, it’s just a candle with a long lower wick; a bottom hasn’t truly been confirmed yet.
That wick from Saturday night to Sunday morning could be a mass grave for everyone who went long early at 65K or above. 🤐
$BTC
{future}(BTCUSDT)
$BTC The exact range right now is 63–71, and we’re still within the accumulation zone—not in the 65–5X range yet! So many people have been asking that I had to rush to answer!
Right now, it’s just a candle with a long lower wick; a bottom hasn’t truly been confirmed yet.
That wick from Saturday night to Sunday morning could be a mass grave for everyone who went long early at 65K or above. 🤐
$BTC
Right now, it’s just a candle with a long lower wick; a bottom hasn’t truly been confirmed yet.
That wick from Saturday night to Sunday morning could be a mass grave for everyone who went long early at 65K or above. 🤐
$BTC
18
1
7
4.4k
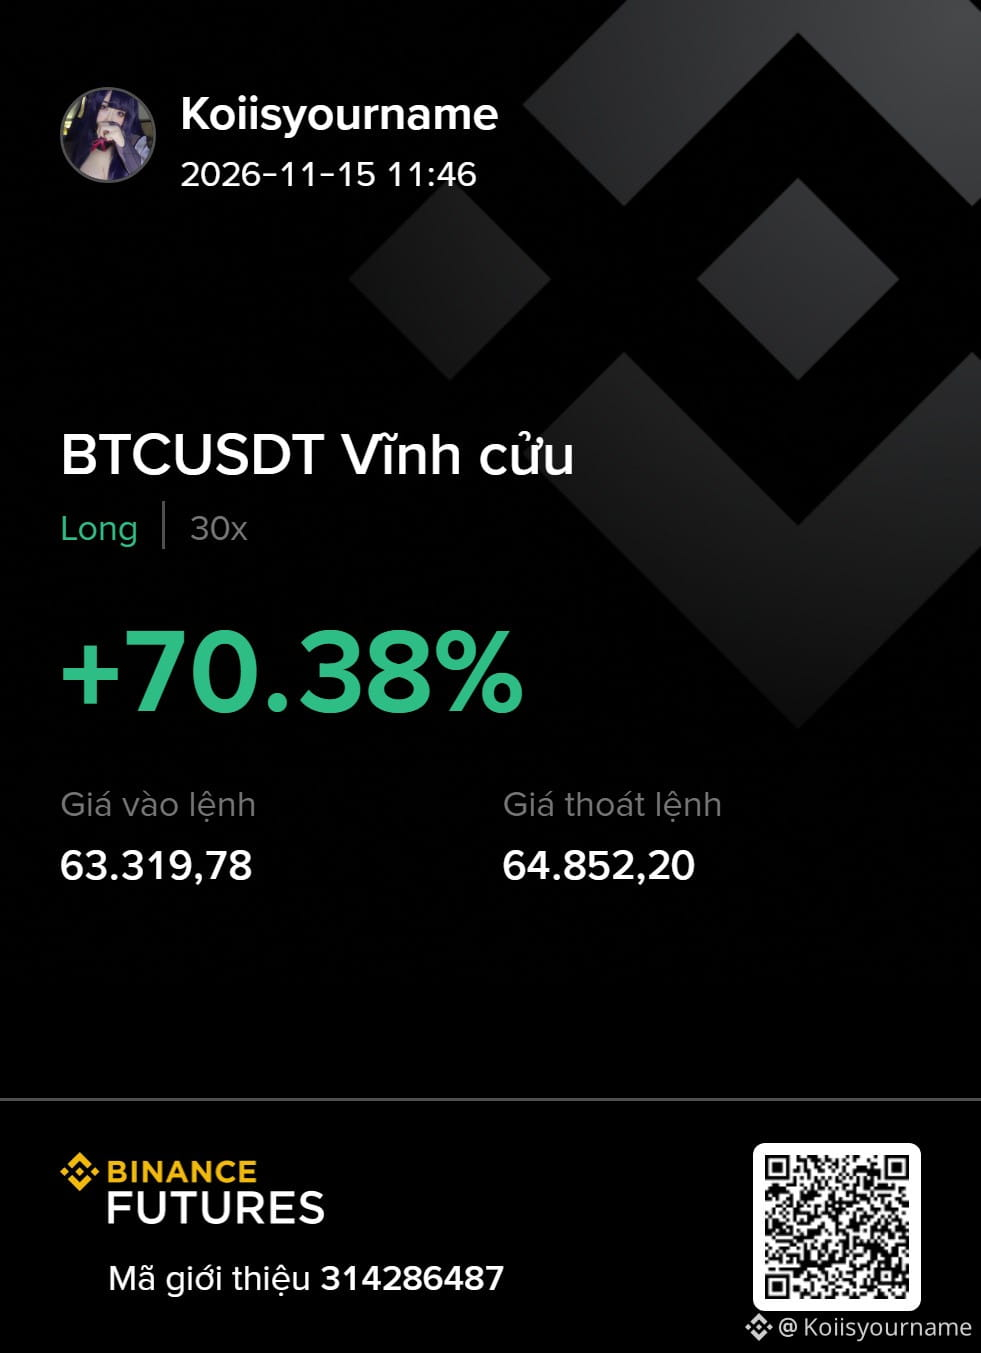
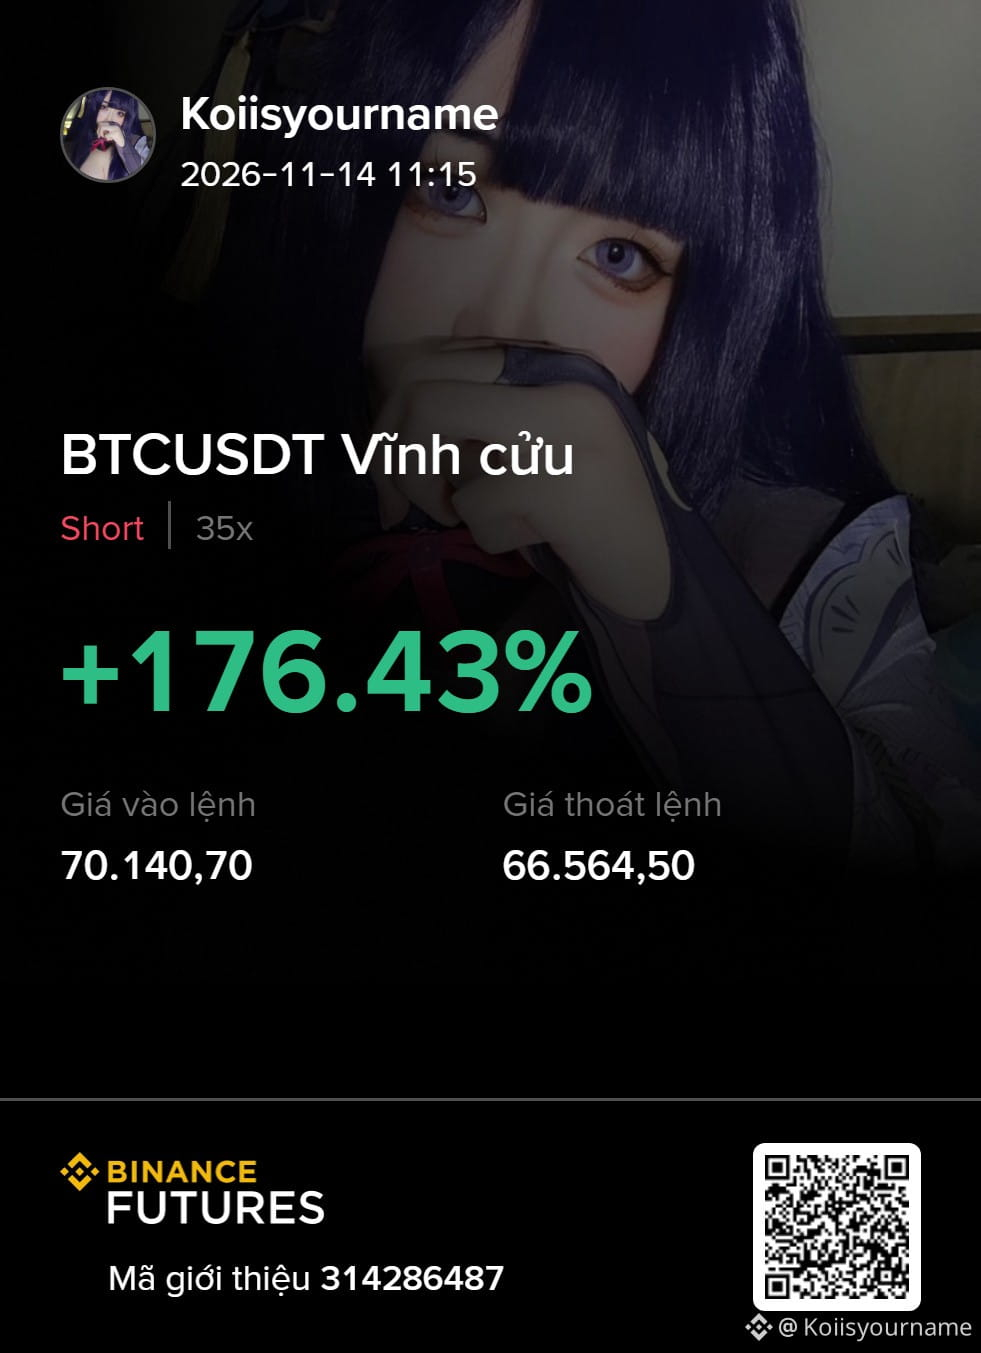
Placed the order yesterday, didn’t think they’d devour it last night. Woke up this morning and could only chow down! 🤧
What an insane weekend! $BTC
{future}(BTCUSDT)
Placed the order yesterday, didn’t think they’d devour it last night. Woke up this morning and could only chow down! 🤧
What an insane weekend! $BTC
What an insane weekend! $BTC
5
6
2.6k
Bro, you love money. I analyzed it a whole month in advance, and you’re playing $BTC with your hands moving faster than your brain! 🤭🤭🤭
Bro, you love money. I analyzed it a whole month in advance, and you’re playing $BTC with your hands moving faster than your brain! 🤭🤭🤭

Anh hai mê tiền
·
--
Why didn't you analyze it before it crashed?
15
9
2.5k
5
11
1.9k
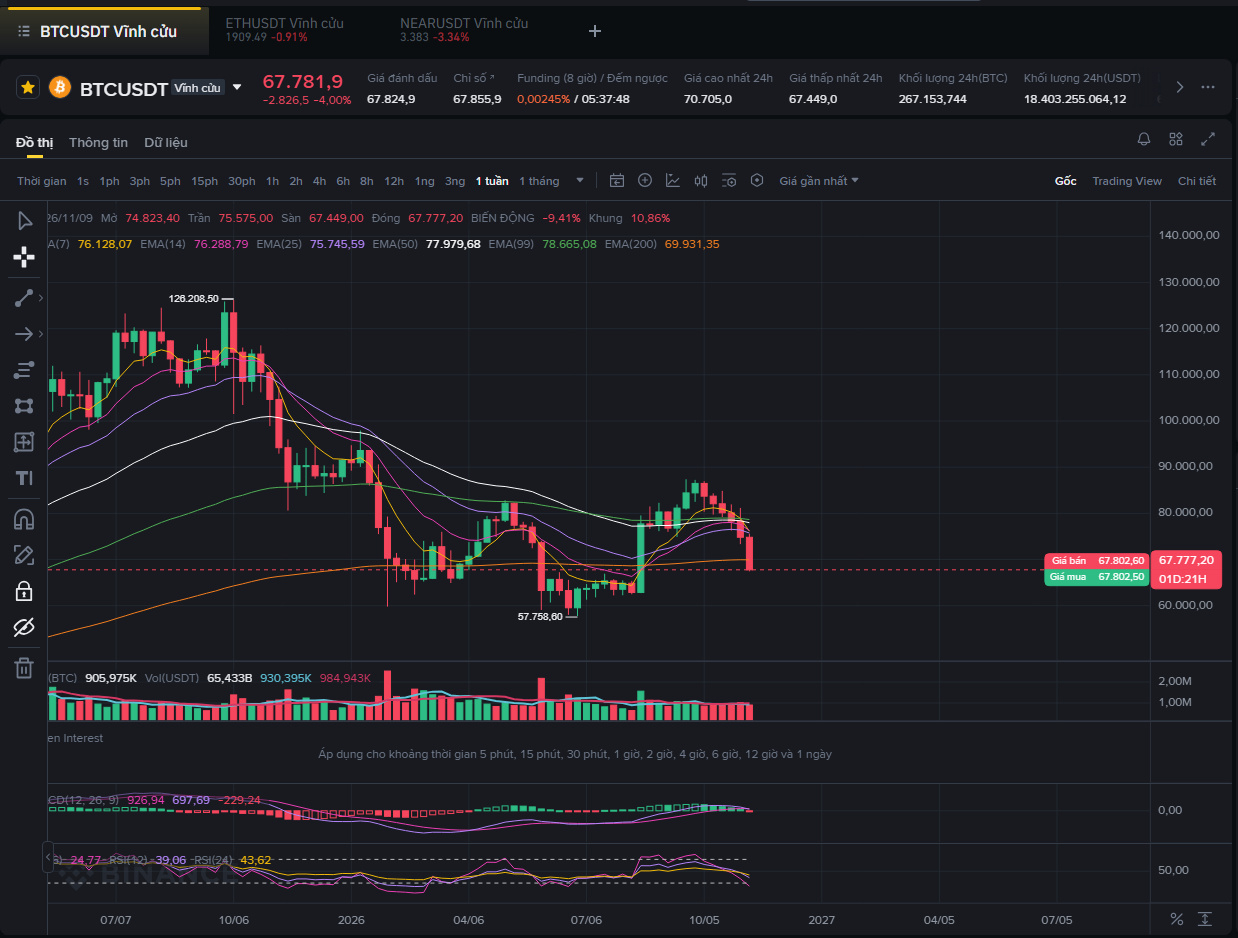
WHAT DOES THE FUTURE HOLD FOR $BTC AND CRYPTO!
Today we're back to look at the chart and revisit our October 31 analysis to paint a clearer picture of what to expect by the end of November!
In short, we'll look at two timeframes: weekly and monthly candles.
1. The monthly chart is still in a long-term downtrend, from 126K to 58K.
2. The monthly EMA50 dynamic support is currently at 67.7K—a good support zone for accumulating and regaining the uptrend.
3. Monthly MACD and RSI are still negative, moving sideways and in oversold territory. We need to wait for a recovery, with a few green months.
4. As I said, there are only two bullish possibilities. The first is reaccumulation, with a bottom at 58K and an accumulation zone around 60K–70K. The second is a corrective move that continues lower to 50K–37K, creating a new cycle with two years of decline.
Important: An inverse head-and-shoulders structure is forming, with the head at 58.5, the shoulders at 65.5, and the neckline around 84.
***Preferred scenario: Sideways movement in the 65K–73K range over the next two months, forming a solid long-term accumulation range.
***Worst-case scenario: A straight drop to 57K, followed by sideways movement in the 65K–57K range. This is a dangerous zone: losing the higher accumulation structure would mean retesting the bottom. If 57K breaks, next year will be cooked too!
The major levels during this period:
- Support: 67.7 - 65.5 - 62.3 - 58K
- Resistance: 73.7 - 76 - 78 -....
- Potential accumulation zone to watch: 65.5-73.7
Note: These are major levels. A price spike through a level and then a pullback of a few thousand is normal; a brief break and reversal doesn't mean the level has definitively broken. For a more precise analysis, you need to track daily ranges or hourly and minute candles!
It's the weekend, so get some rest. If you want to trade futures, just keep your position small!
$BTC
{future}(BTCUSDT)
WHAT DOES THE FUTURE HOLD FOR $BTC AND CRYPTO!
Today we're back to look at the chart and revisit our October 31 analysis to paint a clearer picture of what to expect by the end of November!
In short, we'll look at two timeframes: weekly and monthly candles.
1. The monthly chart is still in a long-term downtrend, from 126K to 58K.
2. The monthly EMA50 dynamic support is currently at 67.7K—a good support zone for accumulating and regaining the uptrend.
3. Monthly MACD and RSI are still negative, moving sideways and in oversold territory. We need to wait for a recovery, with a few green months.
4. As I said, there are only two bullish possibilities. The first is reaccumulation, with a bottom at 58K and an accumulation zone around 60K–70K. The second is a corrective move that continues lower to 50K–37K, creating a new cycle with two years of decline.
Important: An inverse head-and-shoulders structure is forming, with the head at 58.5, the shoulders at 65.5, and the neckline around 84.
***Preferred scenario: Sideways movement in the 65K–73K range over the next two months, forming a solid long-term accumulation range.
***Worst-case scenario: A straight drop to 57K, followed by sideways movement in the 65K–57K range. This is a dangerous zone: losing the higher accumulation structure would mean retesting the bottom. If 57K breaks, next year will be cooked too!
The major levels during this period:
- Support: 67.7 - 65.5 - 62.3 - 58K
- Resistance: 73.7 - 76 - 78 -....
- Potential accumulation zone to watch: 65.5-73.7
Note: These are major levels. A price spike through a level and then a pullback of a few thousand is normal; a brief break and reversal doesn't mean the level has definitively broken. For a more precise analysis, you need to track daily ranges or hourly and minute candles!
It's the weekend, so get some rest. If you want to trade futures, just keep your position small!
$BTC
Today we're back to look at the chart and revisit our October 31 analysis to paint a clearer picture of what to expect by the end of November!
In short, we'll look at two timeframes: weekly and monthly candles.
1. The monthly chart is still in a long-term downtrend, from 126K to 58K.
2. The monthly EMA50 dynamic support is currently at 67.7K—a good support zone for accumulating and regaining the uptrend.
3. Monthly MACD and RSI are still negative, moving sideways and in oversold territory. We need to wait for a recovery, with a few green months.
4. As I said, there are only two bullish possibilities. The first is reaccumulation, with a bottom at 58K and an accumulation zone around 60K–70K. The second is a corrective move that continues lower to 50K–37K, creating a new cycle with two years of decline.
Important: An inverse head-and-shoulders structure is forming, with the head at 58.5, the shoulders at 65.5, and the neckline around 84.
***Preferred scenario: Sideways movement in the 65K–73K range over the next two months, forming a solid long-term accumulation range.
***Worst-case scenario: A straight drop to 57K, followed by sideways movement in the 65K–57K range. This is a dangerous zone: losing the higher accumulation structure would mean retesting the bottom. If 57K breaks, next year will be cooked too!
The major levels during this period:
- Support: 67.7 - 65.5 - 62.3 - 58K
- Resistance: 73.7 - 76 - 78 -....
- Potential accumulation zone to watch: 65.5-73.7
Note: These are major levels. A price spike through a level and then a pullback of a few thousand is normal; a brief break and reversal doesn't mean the level has definitively broken. For a more precise analysis, you need to track daily ranges or hourly and minute candles!
It's the weekend, so get some rest. If you want to trade futures, just keep your position small!
$BTC
Koiisyourname
·
--
$BTC The current daily range is 76.5–80K
From what I can see, whether it continues to fall or rises, BTC will likely move sideways within this price range for at least 1–2 weeks (early November).
The candlestick pattern looks very much like a head and shoulders. When the price lost 80K on Friday, it was confirmed to be below the important daily-chart EMA50—a short-term bearish trend!
I currently think the price will rise for two reasons:
- First, a technical bounce before continuing to decline.
- Second, a bounce to retest the EMA50 once more.
One core point you should pay attention to: if the price loses the 75K level (with a daily candle closing below it), there’s a very high chance of a sharp sell-off toward 65.5K, in line with the short-term bearish pattern.
In the medium term, BTC is looking more positive than it did a few months ago. The weekly chart is showing a very strong recovery, while the monthly chart is gradually moving sideways. This gives me hope that it will bottom around 65K and recover strongly in January 2027.
From what I can see, whether it continues to fall or rises, BTC will likely move sideways within this price range for at least 1–2 weeks (early November).
The candlestick pattern looks very much like a head and shoulders. When the price lost 80K on Friday, it was confirmed to be below the important daily-chart EMA50—a short-term bearish trend!
I currently think the price will rise for two reasons:
- First, a technical bounce before continuing to decline.
- Second, a bounce to retest the EMA50 once more.
One core point you should pay attention to: if the price loses the 75K level (with a daily candle closing below it), there’s a very high chance of a sharp sell-off toward 65.5K, in line with the short-term bearish pattern.
In the medium term, BTC is looking more positive than it did a few months ago. The weekly chart is showing a very strong recovery, while the monthly chart is gradually moving sideways. This gives me hope that it will bottom around 65K and recover strongly in January 2027.
41
16
5.7k
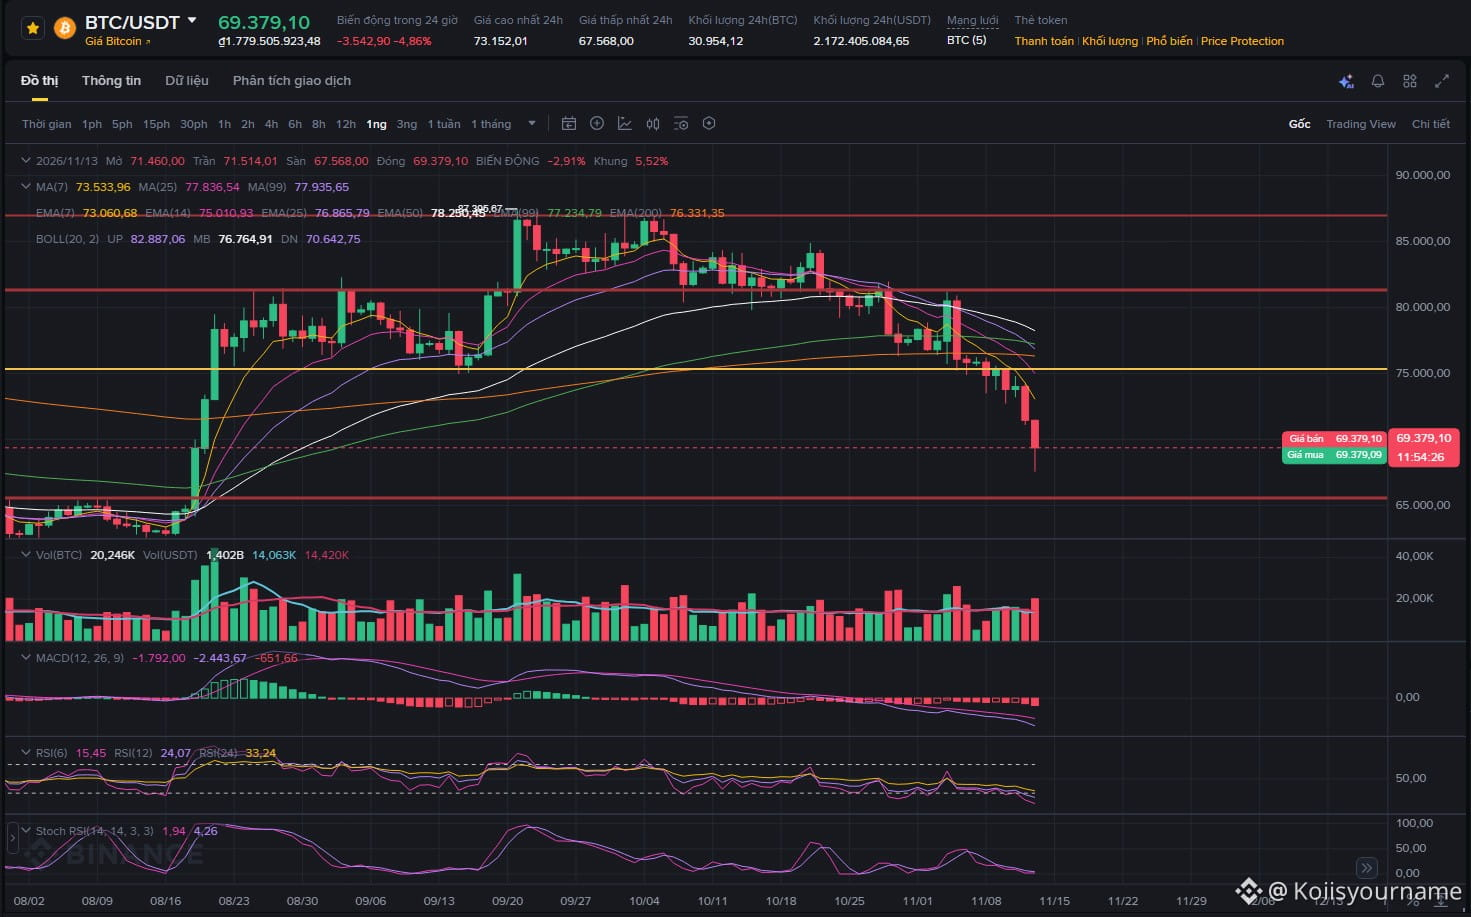
WHY DID $BTC CRASH THIS WEEK!?
There are many reasons behind the price drop from around 80K straight down to 67K this morning (within a week). But as a bit of a “wizard,” in this post I’ll only share the technical-analysis chart perspective. I’ll leave the other reasons for another post.
1. First, the weekly candles at the start of the month gave us four red candles that broke below the strong support zone at 80K, down to 76K, and closed at 78.3 => confirming the loss of the medium-term uptrend.
2. The uptrend’s low at 75K was the last line of defense for the bullish candles! When it broke, I told you guys the trend would turn down because there was no support left.
3. From 75K, there was a strong pump up to 81K, and I warned you about it too. You guys should have shorted around 80–81K; this was the final resistance test and a trend correction.
4. Losing 75K and moving sideways between 73K and 75K — this zone trapped longs. A lot of people may have known it would keep dropping, but they still went long because they were waiting for a corrective bounce back to 78K. And of course, 78K was a fantastic short zone then, but you guys were too caught up to take it. =))
5. Retested resistance around 75K and fell — the big players dumped!
That’s the summary. The indicators were also very clear:
- MACD on the 1D chart turned negative on 28/10 — an early signal that the uptrend was almost over.
- On 30/10, the 1D EMA was about to cross bearishly — confirming the uptrend was over!
- Funding stayed positive for two weeks, with OI rising sharply but value remaining low!
Overall, technical analysis on its own was pretty accurate. But when you combine it with news developments and global geopolitics, it’s like having a perfect picture for making predictions! The main thing is having enough knowledge and being diligent enough to keep up with all the information and decide what to do.
I’ve hit the character limit, can’t write any more! :)))
WHY DID $BTC CRASH THIS WEEK!?
There are many reasons behind the price drop from around 80K straight down to 67K this morning (within a week). But as a bit of a “wizard,” in this post I’ll only share the technical-analysis chart perspective. I’ll leave the other reasons for another post.
1. First, the weekly candles at the start of the month gave us four red candles that broke below the strong support zone at 80K, down to 76K, and closed at 78.3 => confirming the loss of the medium-term uptrend.
2. The uptrend’s low at 75K was the last line of defense for the bullish candles! When it broke, I told you guys the trend would turn down because there was no support left.
3. From 75K, there was a strong pump up to 81K, and I warned you about it too. You guys should have shorted around 80–81K; this was the final resistance test and a trend correction.
4. Losing 75K and moving sideways between 73K and 75K — this zone trapped longs. A lot of people may have known it would keep dropping, but they still went long because they were waiting for a corrective bounce back to 78K. And of course, 78K was a fantastic short zone then, but you guys were too caught up to take it. =))
5. Retested resistance around 75K and fell — the big players dumped!
That’s the summary. The indicators were also very clear:
- MACD on the 1D chart turned negative on 28/10 — an early signal that the uptrend was almost over.
- On 30/10, the 1D EMA was about to cross bearishly — confirming the uptrend was over!
- Funding stayed positive for two weeks, with OI rising sharply but value remaining low!
Overall, technical analysis on its own was pretty accurate. But when you combine it with news developments and global geopolitics, it’s like having a perfect picture for making predictions! The main thing is having enough knowledge and being diligent enough to keep up with all the information and decide what to do.
I’ve hit the character limit, can’t write any more! :)))
There are many reasons behind the price drop from around 80K straight down to 67K this morning (within a week). But as a bit of a “wizard,” in this post I’ll only share the technical-analysis chart perspective. I’ll leave the other reasons for another post.
1. First, the weekly candles at the start of the month gave us four red candles that broke below the strong support zone at 80K, down to 76K, and closed at 78.3 => confirming the loss of the medium-term uptrend.
2. The uptrend’s low at 75K was the last line of defense for the bullish candles! When it broke, I told you guys the trend would turn down because there was no support left.
3. From 75K, there was a strong pump up to 81K, and I warned you about it too. You guys should have shorted around 80–81K; this was the final resistance test and a trend correction.
4. Losing 75K and moving sideways between 73K and 75K — this zone trapped longs. A lot of people may have known it would keep dropping, but they still went long because they were waiting for a corrective bounce back to 78K. And of course, 78K was a fantastic short zone then, but you guys were too caught up to take it. =))
5. Retested resistance around 75K and fell — the big players dumped!
That’s the summary. The indicators were also very clear:
- MACD on the 1D chart turned negative on 28/10 — an early signal that the uptrend was almost over.
- On 30/10, the 1D EMA was about to cross bearishly — confirming the uptrend was over!
- Funding stayed positive for two weeks, with OI rising sharply but value remaining low!
Overall, technical analysis on its own was pretty accurate. But when you combine it with news developments and global geopolitics, it’s like having a perfect picture for making predictions! The main thing is having enough knowledge and being diligent enough to keep up with all the information and decide what to do.
I’ve hit the character limit, can’t write any more! :)))
24
20
13.1k
Log in to explore more content
Join global crypto users on Binance Square
⚡️ Get latest and useful information about crypto.
💬 Trusted by the world’s largest crypto exchange.
👍 Discover real insights from verified creators.
Email / Phone number
Trending Topics
CanBTCReboundAfterFallingBelow60K?
176,142 views
865 Discussing
Bitcoin News | Bitcoin Falls Below $60,000 for the First Time Since July as IBIT Posts Record $541 Million Outflow
Binance News
·45 Likes
·82.3k views
GlobalStocksFaceLongestLosingStreakSince2023
69,948 views
708 Discussing
AnthropicPlungesTowardIPOPriceonDay2
29,862 views
341 Discussing