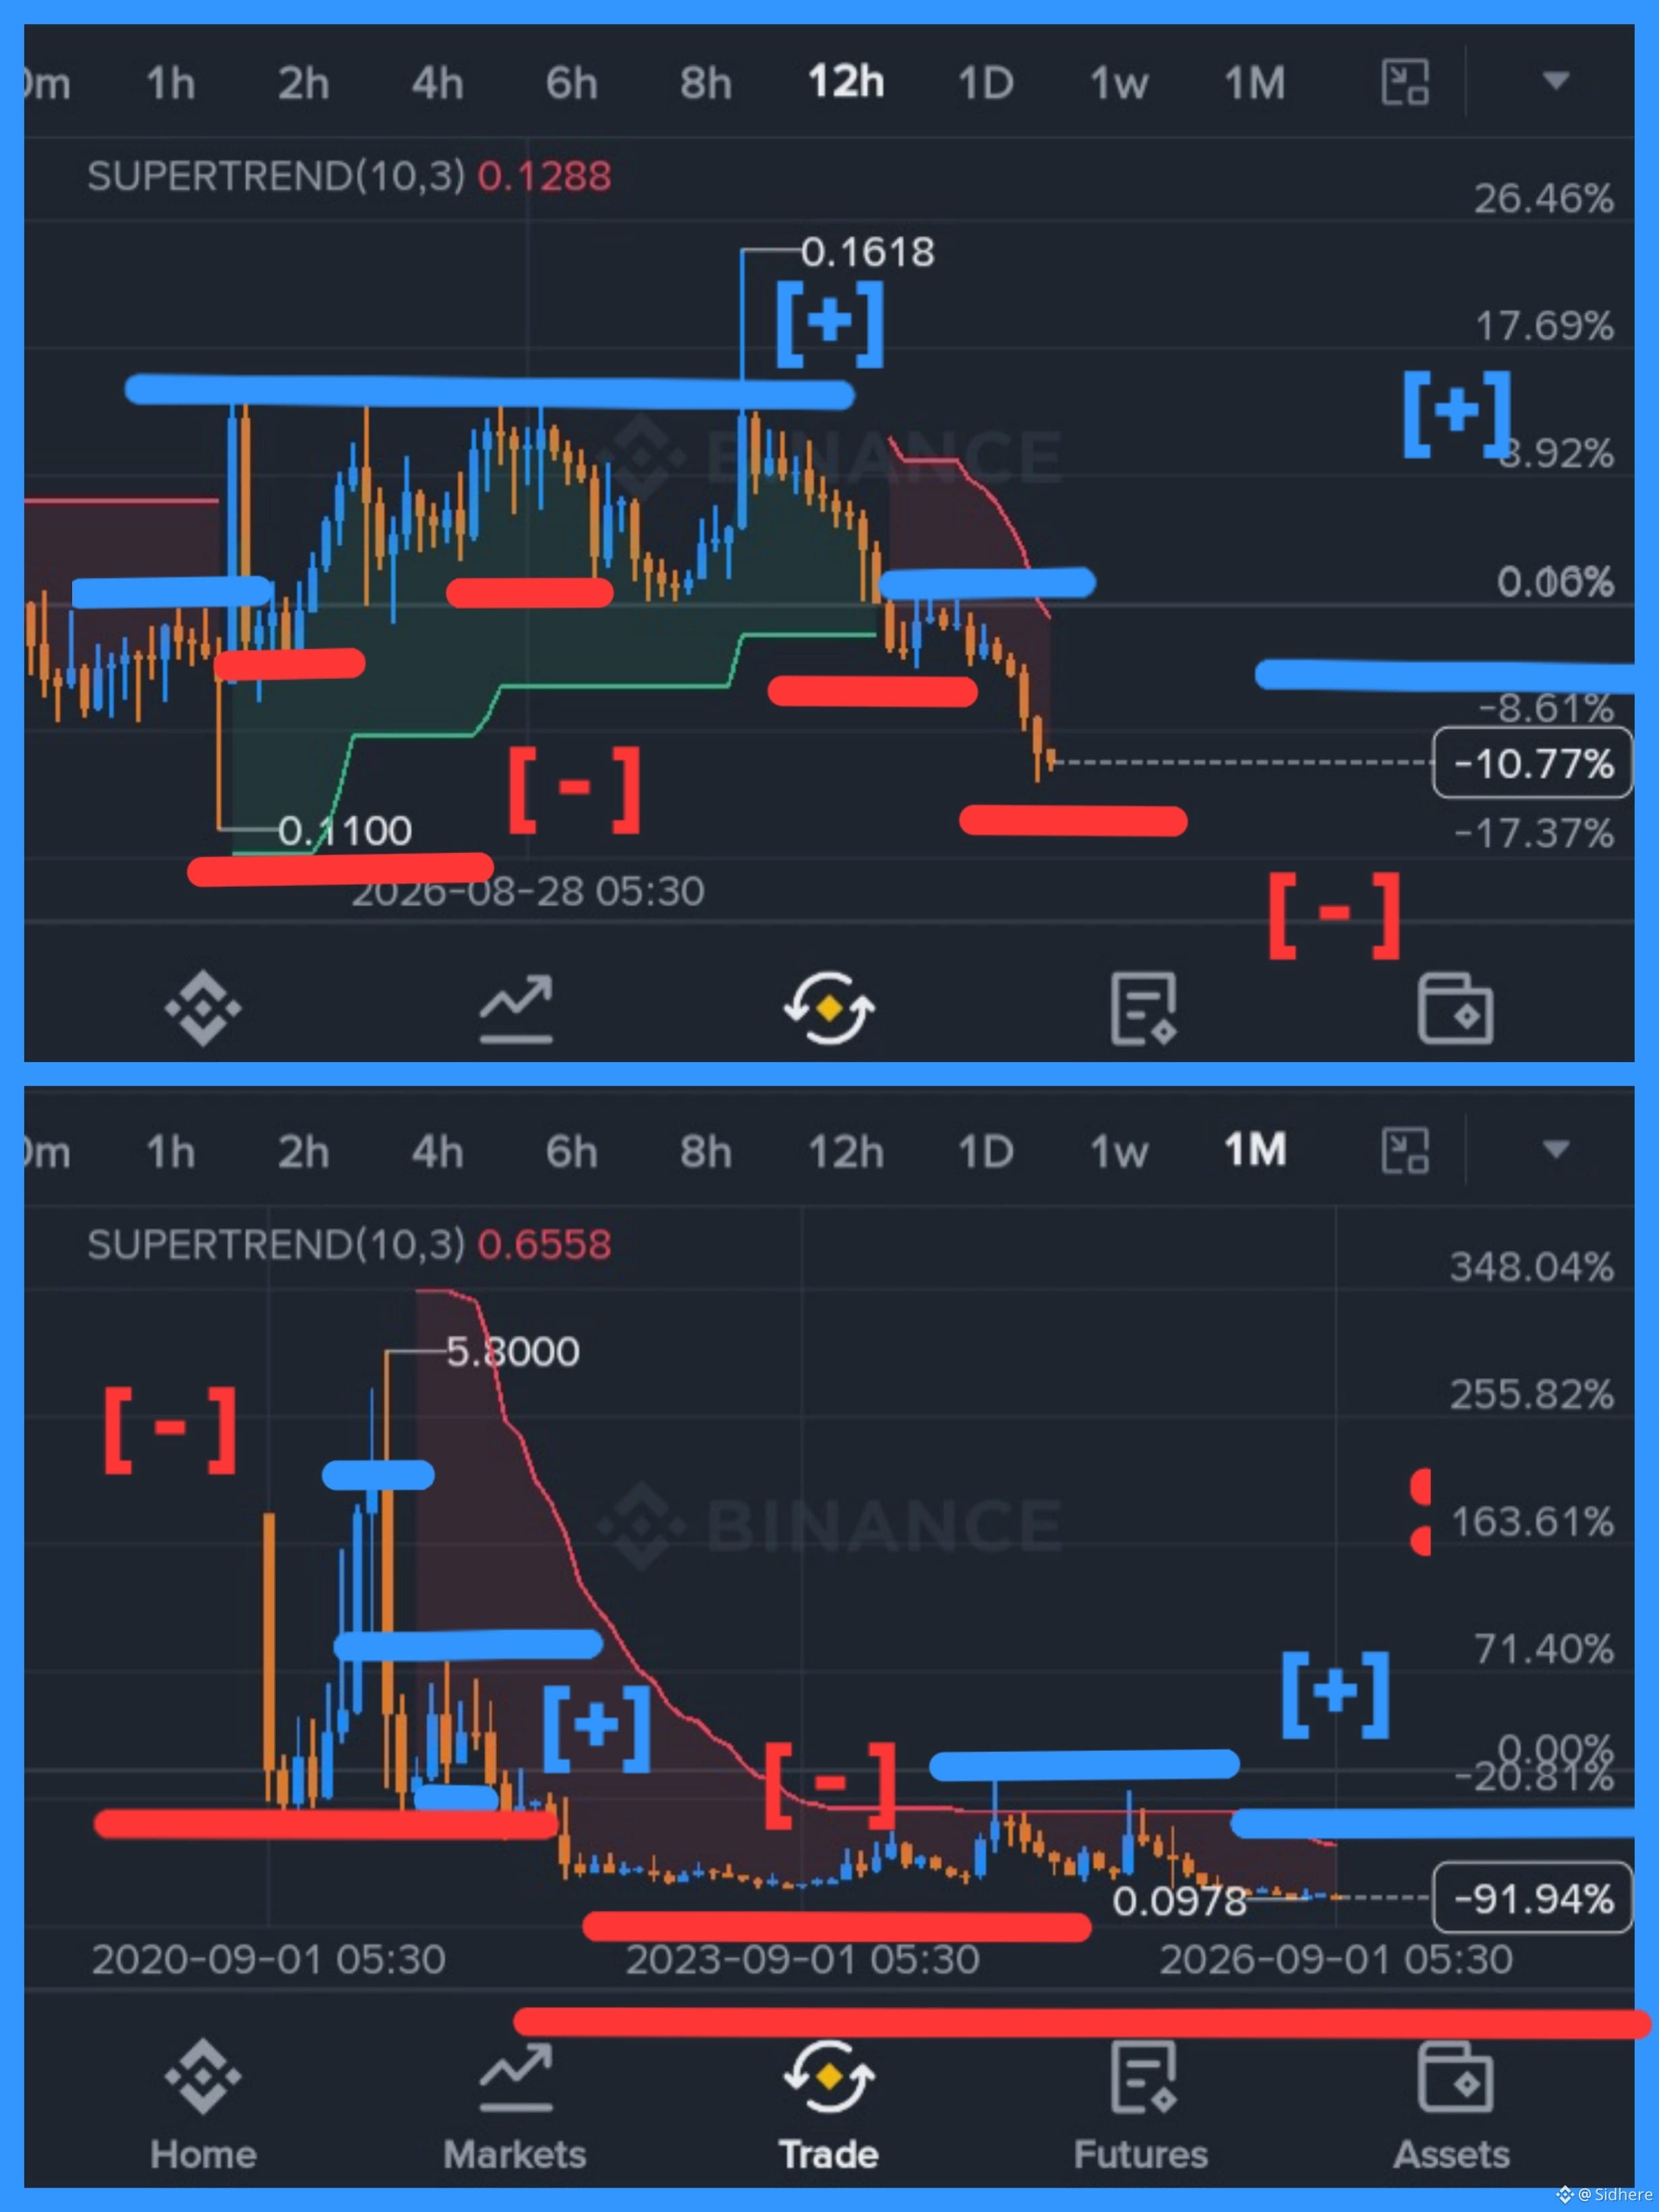
$DIA Chart Breakdown
12-Hour Chart (Short-Term Breakdown):
The Supertrend (10,3) turned bearish around $0.1288 (red zone overhead).
After peaking at $0.1618, $DIA lost the local higher-low structure and swept below the previous swing low near $0.1100, dropping into negative territory for your position around -10.77%.
Lower shadows/wicks show sellers taking control, driving the price past the green support floor into a fresh localized breakdown.
1-Month Chart (Macro Trend & Context):
Supertrend line on the monthly macro scale sits way up at $0.6558, maintaining a long-term macro downtrend.
Price is hovering near historical bottom levels close to the macro low of $0.0978 (-91.94% off peak cycle levels like $5.80).
Key Technical Levels to Watch
Immediate Resistance: $0.1288 – $0.1300 (Your breakeven & 12H Supertrend resistance zone). Reclaiming this level is required to flip short-term momentum back to bullish.
Key Support Floor: $0.1090 – $0.0978 (The local swing low and historical macro low). If price breaks below $0.0978, DIA enters price-discovery to the downside.
$DIA #Binance #Square #BTC #crypto #analysis
12-Hour Chart (Short-Term Breakdown):
The Supertrend (10,3) turned bearish around $0.1288 (red zone overhead).
After peaking at $0.1618, $DIA lost the local higher-low structure and swept below the previous swing low near $0.1100, dropping into negative territory for your position around -10.77%.
Lower shadows/wicks show sellers taking control, driving the price past the green support floor into a fresh localized breakdown.
1-Month Chart (Macro Trend & Context):
Supertrend line on the monthly macro scale sits way up at $0.6558, maintaining a long-term macro downtrend.
Price is hovering near historical bottom levels close to the macro low of $0.0978 (-91.94% off peak cycle levels like $5.80).
Key Technical Levels to Watch
Immediate Resistance: $0.1288 – $0.1300 (Your breakeven & 12H Supertrend resistance zone). Reclaiming this level is required to flip short-term momentum back to bullish.
Key Support Floor: $0.1090 – $0.0978 (The local swing low and historical macro low). If price breaks below $0.0978, DIA enters price-discovery to the downside.
$DIA #Binance #Square #BTC #crypto #analysis