

#pendle
pendle
2.5M views
7,590 Discussing
Hot
Latest

See translation
AGGRESSIVE BUYERS ABSORB OFFERS ON $PENDLE AS MOMENTUM EXPANDS TOWARD 2.01 🟢⚡
Entry: 1.897 ⚡
Target: 1.9349 - 2.0106 🚀
Stop Loss: 1.8213 ⚠️
Demand is stepping up aggressively on $PENDLE as buyers relentlessly clear local resistance, showing heavy bid support right at current levels. 📊 The immediate order flow confirms smart money positioning for a clean continuation leg while spot volume begins to swell.
📌 With downside risk tightly contained at 1.8213, the asymmetric upside toward 2.0106 offers a sharp risk-managed window for momentum traders. 💡 Are you riding this bid higher or waiting for a pullback to fill your orders? 👇
⚠️ Not financial advice. Always manage your risk. 🛡️
🏷️ #PENDLE #LongSetup #Altcoins #Breakout
🔥 💎
18


·
--
See translation
$PENDLE
{spot}(PENDLEUSDT)
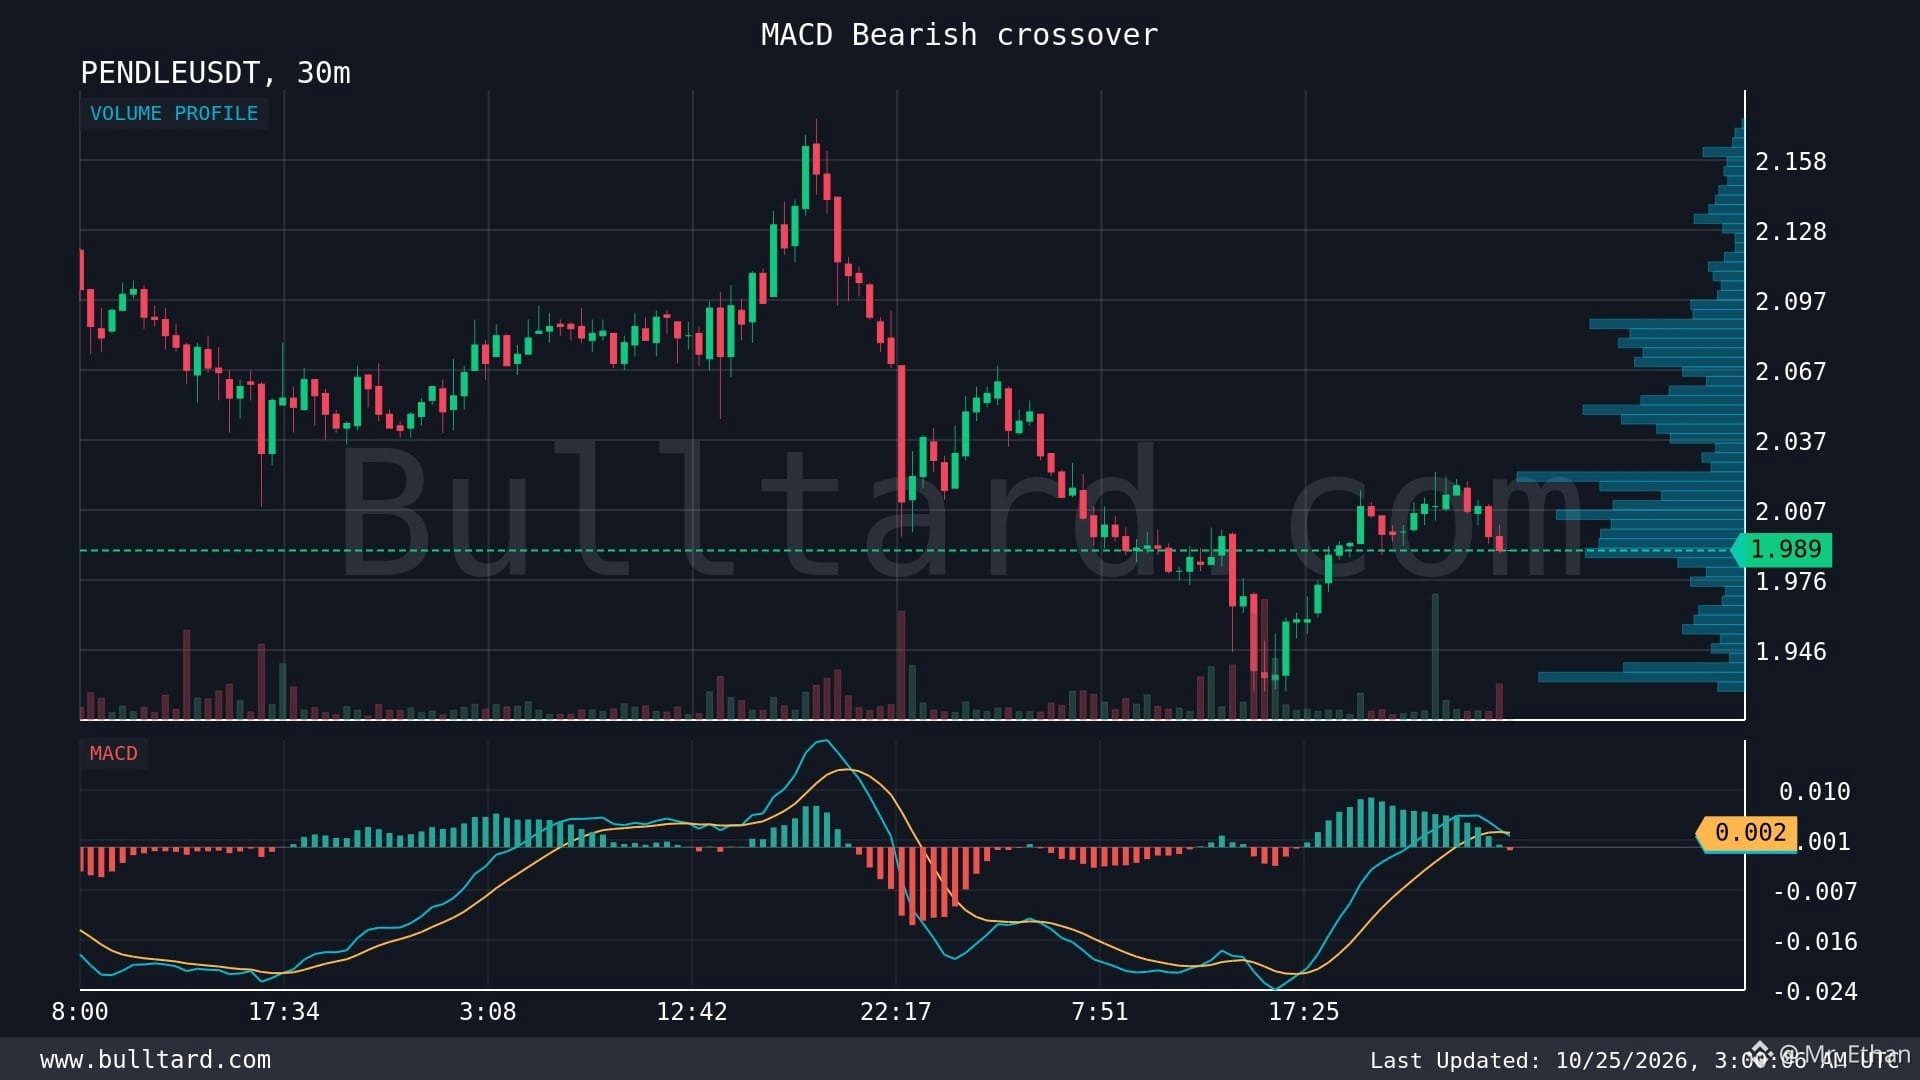
/USDT: I’m Watching This Bearish Signal 📉
I’ve been checking PENDLE/USDT on the 30-minute chart, and the latest MACD crossover has caught my attention.
PENDLE is trading around $1.989. The MACD line is at 0.001899, below the signal line at 0.002434. This suggests short-term buying momentum may be losing strength.
What I find interesting about Pendle is its approach to DeFi yields. It allows users to separate an asset’s principal from its future yield, giving them more ways to manage risk or speculate on returns. That makes it different from many standard DeFi tokens.
I believe yield trading can play a useful role in DeFi, especially for users who want more control over their returns. But there are risks too. Smart contract vulnerabilities, changing yields, low liquidity, and falling demand can all affect the ecosystem and PENDLE’s price.
My trading experience has taught me not to treat every bearish crossover as a sell signal. I want to see volume, support levels, and follow-through before drawing stronger conclusions.
For now, I’m watching how price reacts around current levels rather than making emotional moves.
What do you think? Will PENDLE recover its momentum, or is more downside possible?
#PENDLE #DeFi #CryptoTrading #BinanceSquare
$PENDLE
/USDT: I’m Watching This Bearish Signal 📉
I’ve been checking PENDLE/USDT on the 30-minute chart, and the latest MACD crossover has caught my attention.
PENDLE is trading around $1.989. The MACD line is at 0.001899, below the signal line at 0.002434. This suggests short-term buying momentum may be losing strength.
What I find interesting about Pendle is its approach to DeFi yields. It allows users to separate an asset’s principal from its future yield, giving them more ways to manage risk or speculate on returns. That makes it different from many standard DeFi tokens.
I believe yield trading can play a useful role in DeFi, especially for users who want more control over their returns. But there are risks too. Smart contract vulnerabilities, changing yields, low liquidity, and falling demand can all affect the ecosystem and PENDLE’s price.
My trading experience has taught me not to treat every bearish crossover as a sell signal. I want to see volume, support levels, and follow-through before drawing stronger conclusions.
For now, I’m watching how price reacts around current levels rather than making emotional moves.
What do you think? Will PENDLE recover its momentum, or is more downside possible?
#PENDLE #DeFi #CryptoTrading #BinanceSquare
1
90

·
--
See translation
$PENDLE looks ready to bounce up right from here
Buying $PENDLE between 1.9841 and 2.0002
Invalid below 1.9172
Taking profit at 2.1167 2.1965 2.3161
Down 4.0 percent today sitting near the middle of the range
Last low at $1.9280 is close by for a cheap stop
Volume is normal matching the seven day average
Price is in the zone right now
Tap $PENDLE to buy
#PENDLE #TradingSignals
2

·
--
See translation
$PENDLE is back on my quiet radar.
Not because it looks strong. Because the flush is getting interesting.
Price is $1.99, down 7.53% today, with $3.44M traded. The 4h move is worse at -5.9%, but RSI is sitting at 39. That’s pressure, not panic yet.
Volume is only 0.7x its 20d average, while price sits below both the 20d and 50d MAs. Bearish stack. Funding is barely positive at 0.001%, so longs are still paying while the chart bleeds 🩸
Here’s the alpha: $PENDLE is 26% off its 30d high, but this selloff isn’t showing huge volume. That makes it more interesting than chasing strength in $BTC after a big move.
At $2.00, I’m watching for a clean reclaim. If it can’t hold that level, I stay out and let sellers finish their job. Patience is the edge here 👀
#PENDLE #Binance
2

·
--
See translation
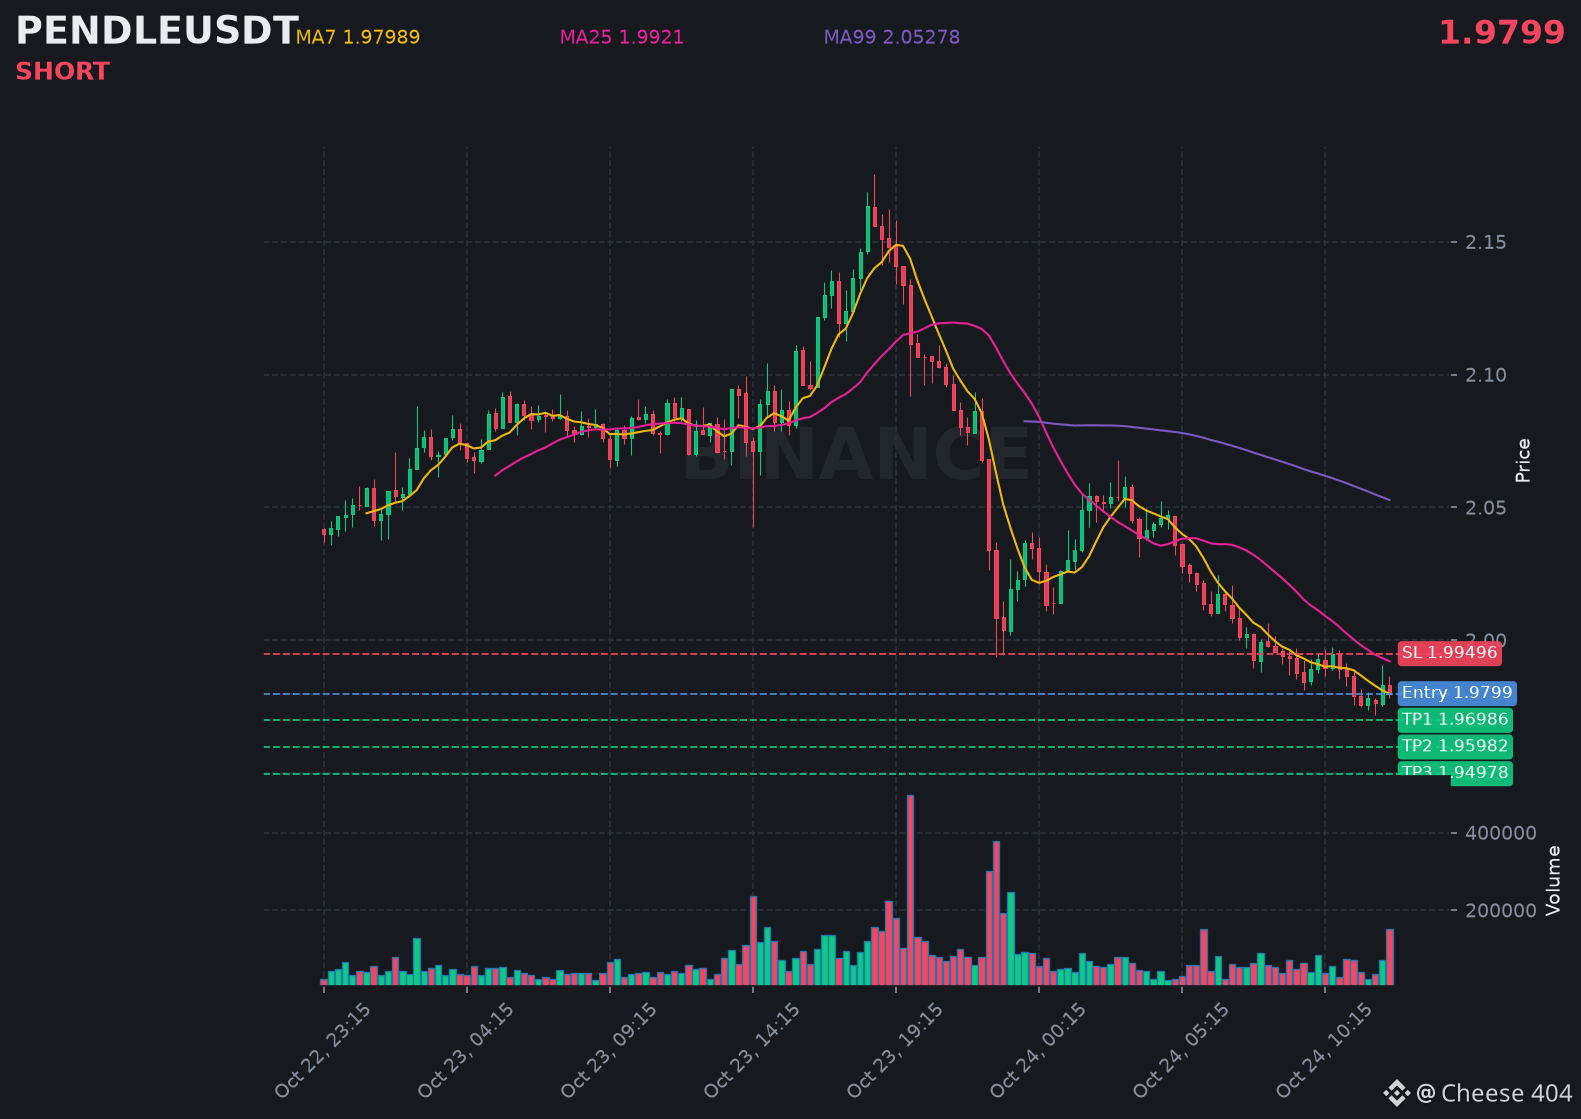
$PENDLE is trending down with real conviction, sellers capping every bounce along the way.
📍 @ 1.9799 | Volume: 0.30M USD
RSI 36 | EMA20: 1.99009 USD
📈 Trade Plan:
📈 Entry: 1.97689 – 1.98291
🛑 Stop Loss: 1.99496
🎯 TP1: 1.96986
🎯 TP2: 1.95982
🎯 TP3: 1.94978
Waiting for confirmation, then riding the downtrend.
👉 $PENDLE 👈 Catch it
#PENDLE
📍 @ 1.9799 | Volume: 0.30M USD
RSI 36 | EMA20: 1.99009 USD
📈 Trade Plan:
📈 Entry: 1.97689 – 1.98291
🛑 Stop Loss: 1.99496
🎯 TP1: 1.96986
🎯 TP2: 1.95982
🎯 TP3: 1.94978
Waiting for confirmation, then riding the downtrend.
👉 $PENDLE 👈 Catch it
#PENDLE
1
49

·
--
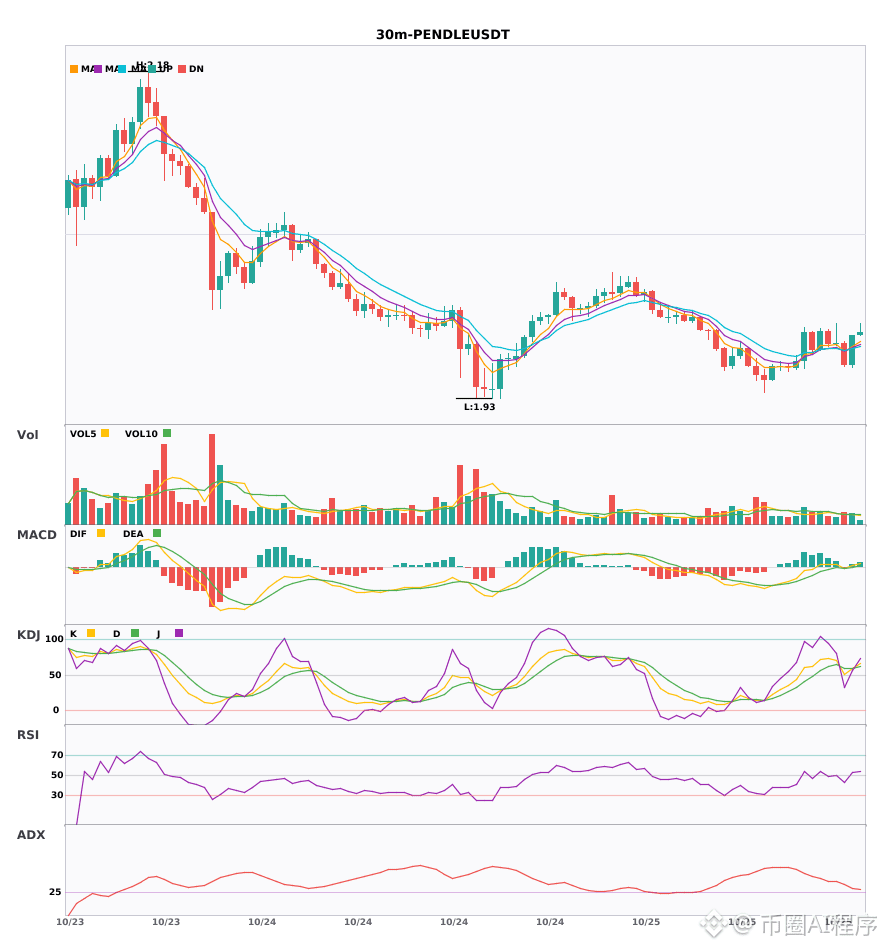
$PENDLE 30-minute multi-timeframe confluence, 4-hour bearish trend confirmed 🔥
════════════════════
🟢 $PENDLE 30-minute bearish signal
⚠️Technical analysis: 4-hour bearish confluence confirmed | 30-minute entry: MACD bearish cross below zero, bearish momentum accelerating | EMA5 crosses below EMA8, short-term outlook turns bearish | KDJ bearish cross, short-term bearish (K: 50.7, D: 59.8) | Volume normal (1.2x)
════════════════════
🔔 Follow for firsthand market updates 🔔
#多周期共振 #PENDLE
📌 When trading, pay attention to whether the candlestick patterns align
════════════════════
🟢 $PENDLE 30-minute bearish signal
⚠️Technical analysis: 4-hour bearish confluence confirmed | 30-minute entry: MACD bearish cross below zero, bearish momentum accelerating | EMA5 crosses below EMA8, short-term outlook turns bearish | KDJ bearish cross, short-term bearish (K: 50.7, D: 59.8) | Volume normal (1.2x)
════════════════════
🔔 Follow for firsthand market updates 🔔
#多周期共振 #PENDLE
📌 When trading, pay attention to whether the candlestick patterns align
10

·
--

Article
Why were PENDLE longs liquidated more than 100 times as much, despite shorts slightly outnumbering longs?PENDLE fell about 2% on both sides, while short accounts slightly outnumbered long accounts. Yet over the 24-hour window, about $39,400 in longs were liquidated, compared with only about $360 in shorts—a roughly 108-to-1 gap. In this mild downturn, liquidations hit almost exclusively long positions.
Binance: about $1.95150000 (-2.0480%); OKX: about $1.95100000 (-1.9598%). Over 24 hours, about $39,400 in longs and $360 in shorts were liquidated, for a total of about $39,800 across 55 liquidations. Open interest was about 13.85 million on Binance and 2.45 million on OKX. Binance funding was slightly negative while OKX funding was positive, pointing in opposite directions. The long/short account ratio was about 47.0%/53.0%.
Prices slipped just 2%, and short accounts still slightly outnumbered longs, yet liquidations were more than 100 times higher on the long side—a pattern more consistent with highly leveraged long positions being targeted and wiped out during a mild dip.
Why were PENDLE longs liquidated more than 100 times as much, despite shorts slightly outnumbering longs?
PENDLE fell about 2% on both sides, while short accounts slightly outnumbered long accounts. Yet over the 24-hour window, about $39,400 in longs were liquidated, compared with only about $360 in shorts—a roughly 108-to-1 gap. In this mild downturn, liquidations hit almost exclusively long positions.
Binance: about $1.95150000 (-2.0480%); OKX: about $1.95100000 (-1.9598%). Over 24 hours, about $39,400 in longs and $360 in shorts were liquidated, for a total of about $39,800 across 55 liquidations. Open interest was about 13.85 million on Binance and 2.45 million on OKX. Binance funding was slightly negative while OKX funding was positive, pointing in opposite directions. The long/short account ratio was about 47.0%/53.0%.
Prices slipped just 2%, and short accounts still slightly outnumbered longs, yet liquidations were more than 100 times higher on the long side—a pattern more consistent with highly leveraged long positions being targeted and wiped out during a mild dip.
8

·
--
Verified
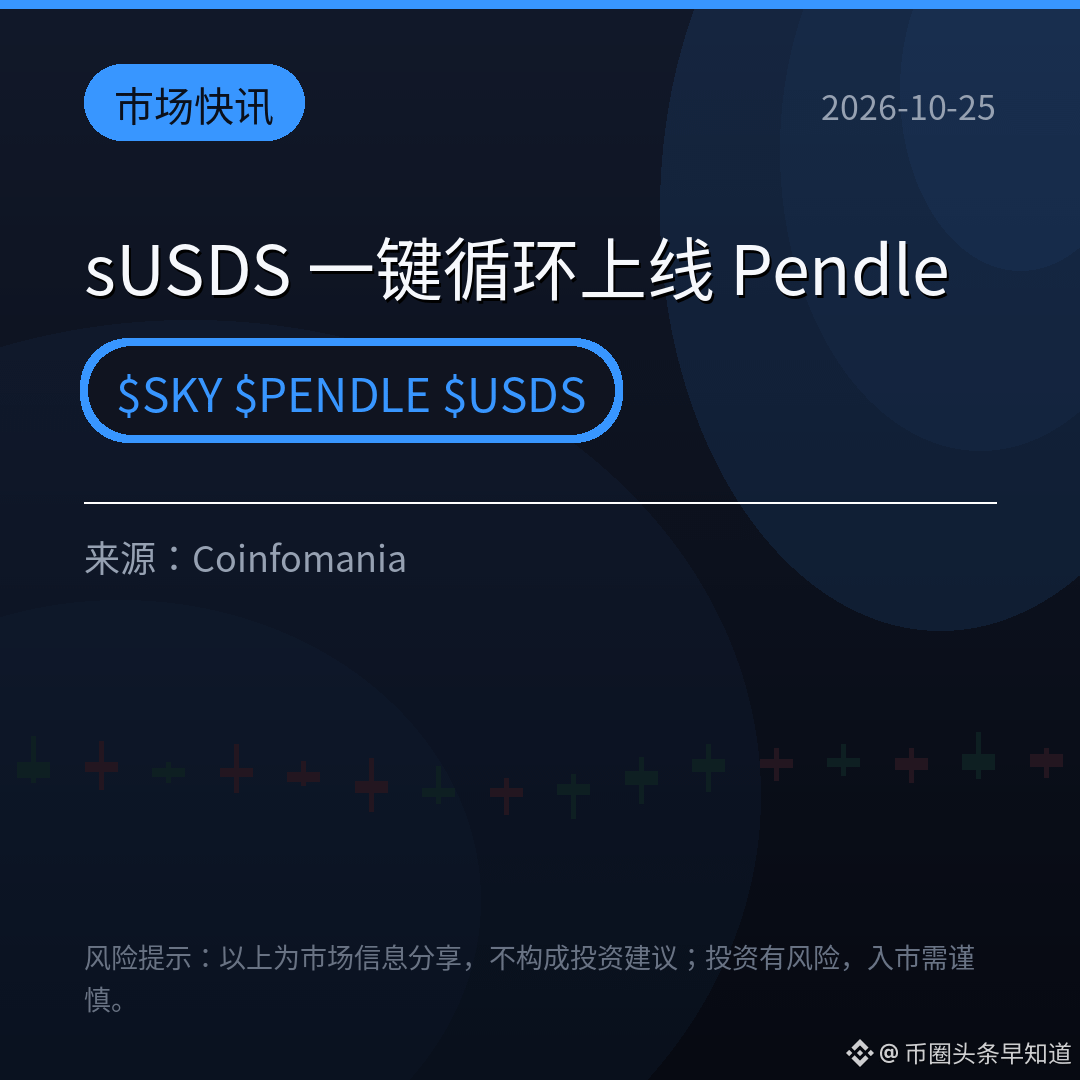
【Market Update】Sky announced: One-click sUSDS looping is now live on Pendle. Use PendleLoop to complete the loop in just a few clicks.
Convenience means lower costs and greater efficiency. Pendle’s yield-bearing asset strategies are getting easier to use, and sUSDS now has another use case.
But when positions fluctuate, losses can also hit faster. Is this bullish or bearish for $PENDLE ? Reply 1 if bullish, 2 if bearish.
$SKY $PENDLE $USDS
#DeFi #Pendle #Sky
(Source: Coinfomania)
⚠️Risk warning: The above is shared for market information only and does not constitute investment advice. Investing involves risk; please exercise caution.
1
157

·
--
Bullish
See translation
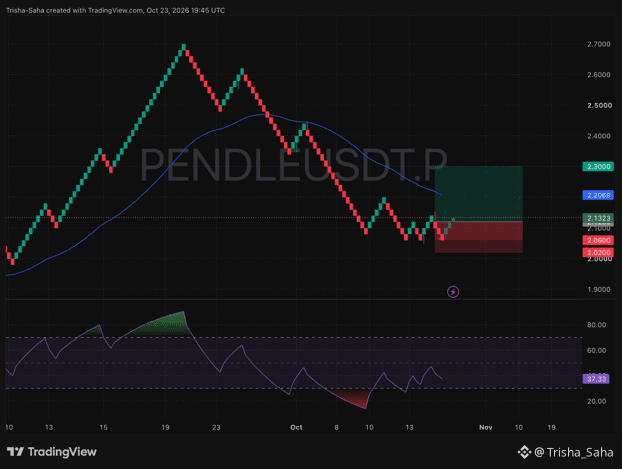
👑 $PENDLE JUST BUILT A TRIPLE-BOTTOM LAUNCHPAD — HUGE BREAKOUT AHEAD! 💸
📍 Trade Setup:
• Entry Zone: $2.1200 – $2.1323
• Stop Loss: $2.0200
• Target: $2.3000
🧭 Chart Analysis:
• Sellers tried three separate times to push price below $2.0600 and failed every single time, proving big buyers are absorbing the dip.
• Three straight green candles just printed off that floor, pushing price right back above $2.1323 with strong momentum.
• Flipping the blue trend line at $2.2069 into support clears the path straight to our $2.3000 target.
🛡️ Golden Rule: Once your trade hits +3% to +4% profit, move your Stop Loss right up to Break-Even so your principal is 100% protected!
I'm already loaded up and in this trade. Are you riding this wave with me? Drop a comment below! 👇
#PENDLE #PENDLEUSDT #DeFi #CryptoSignals
{future}(PENDLEUSDT)
👑 $PENDLE JUST BUILT A TRIPLE-BOTTOM LAUNCHPAD — HUGE BREAKOUT AHEAD! 💸
📍 Trade Setup:
• Entry Zone: $2.1200 – $2.1323
• Stop Loss: $2.0200
• Target: $2.3000
🧭 Chart Analysis:
• Sellers tried three separate times to push price below $2.0600 and failed every single time, proving big buyers are absorbing the dip.
• Three straight green candles just printed off that floor, pushing price right back above $2.1323 with strong momentum.
• Flipping the blue trend line at $2.2069 into support clears the path straight to our $2.3000 target.
🛡️ Golden Rule: Once your trade hits +3% to +4% profit, move your Stop Loss right up to Break-Even so your principal is 100% protected!
I'm already loaded up and in this trade. Are you riding this wave with me? Drop a comment below! 👇
#PENDLE #PENDLEUSDT #DeFi #CryptoSignals
134
·
--
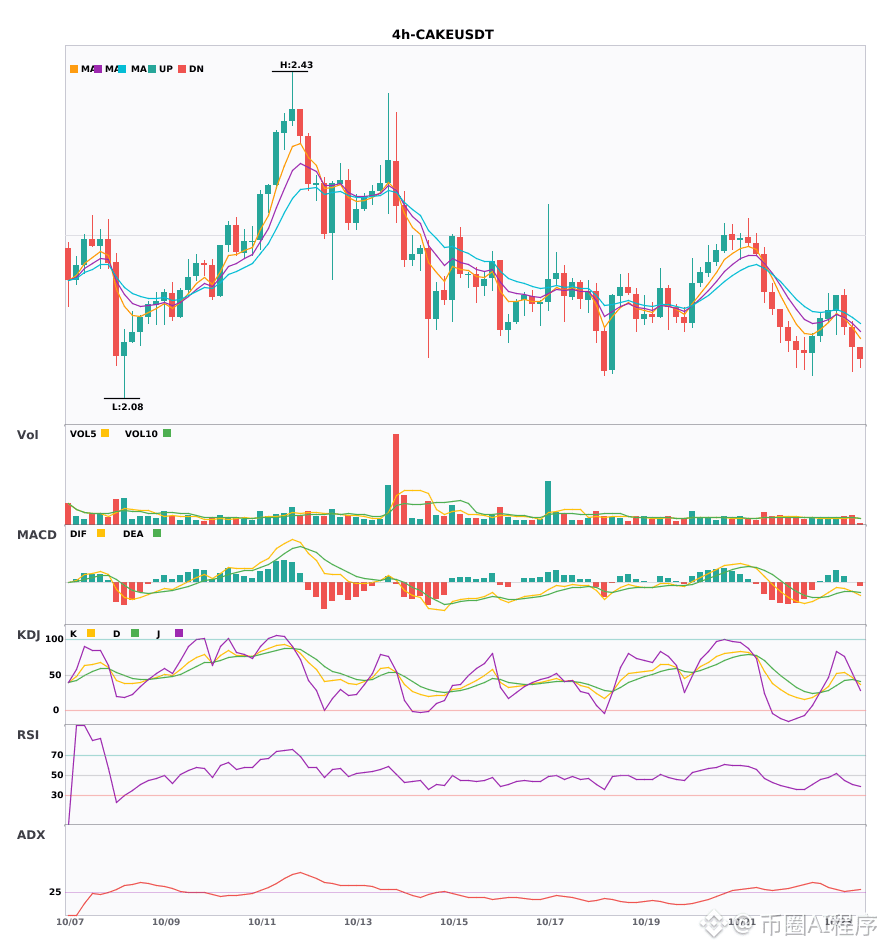
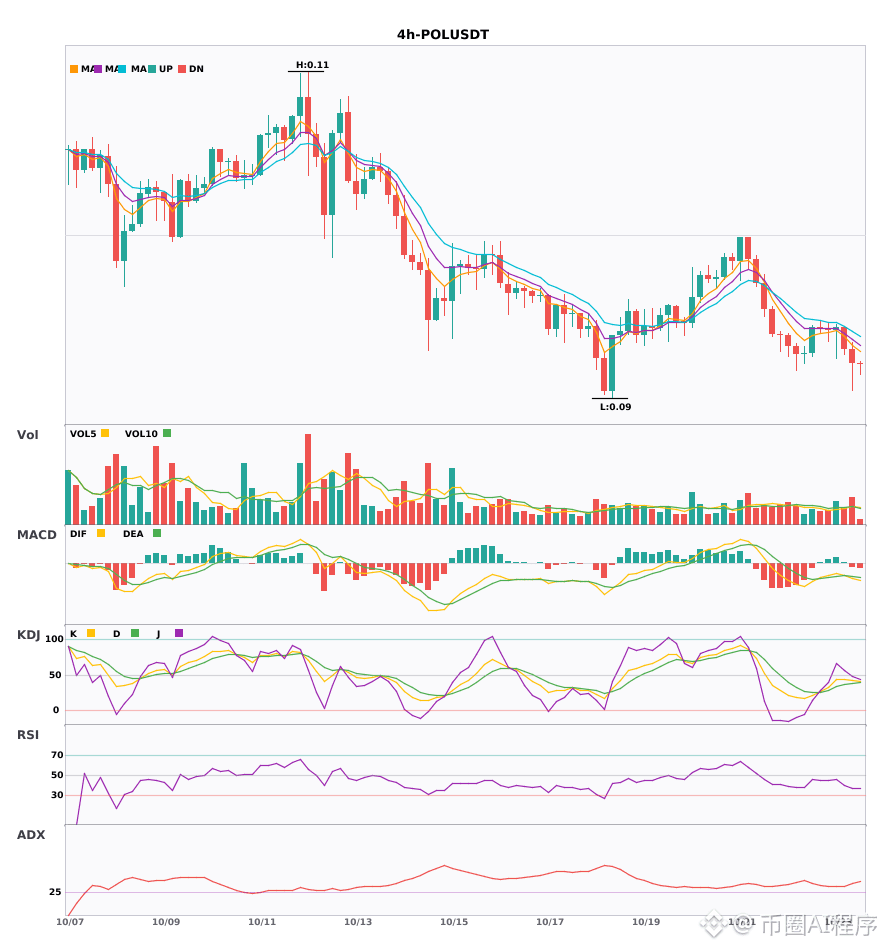
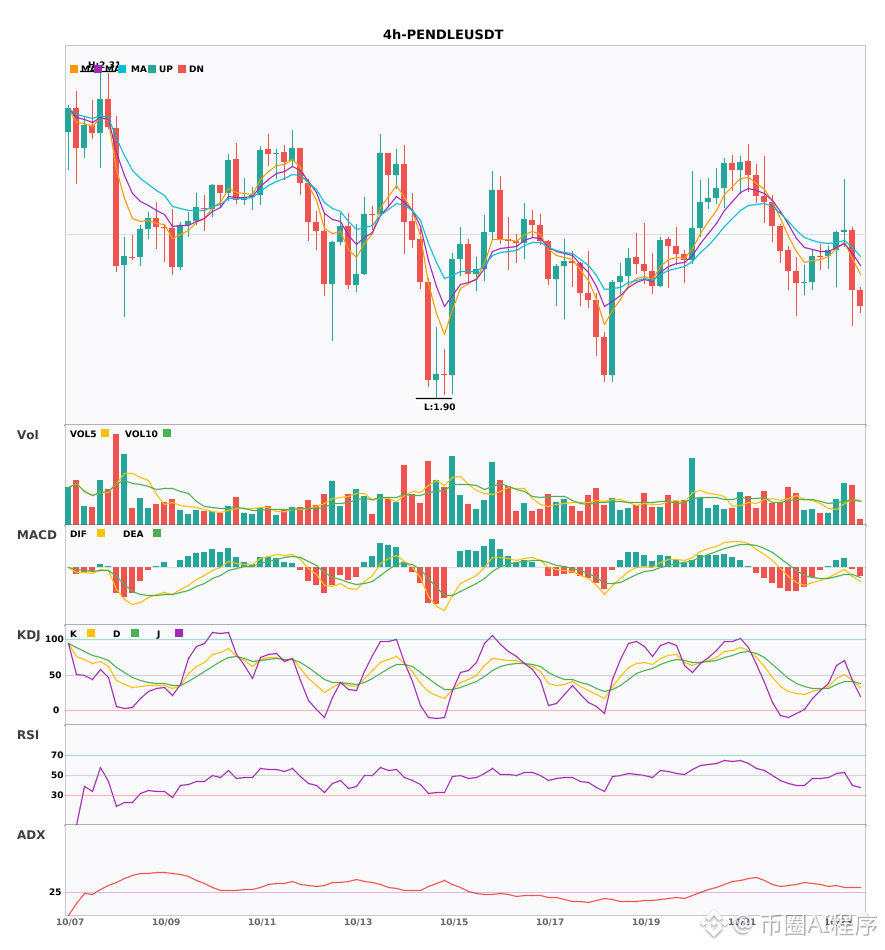
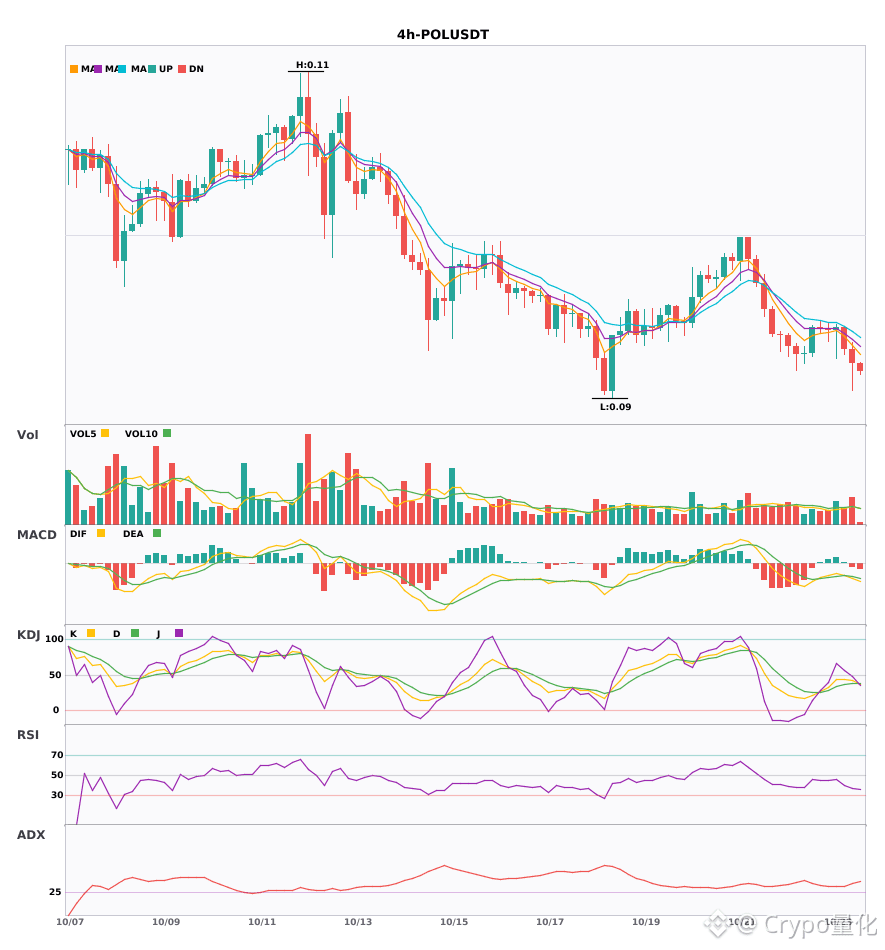
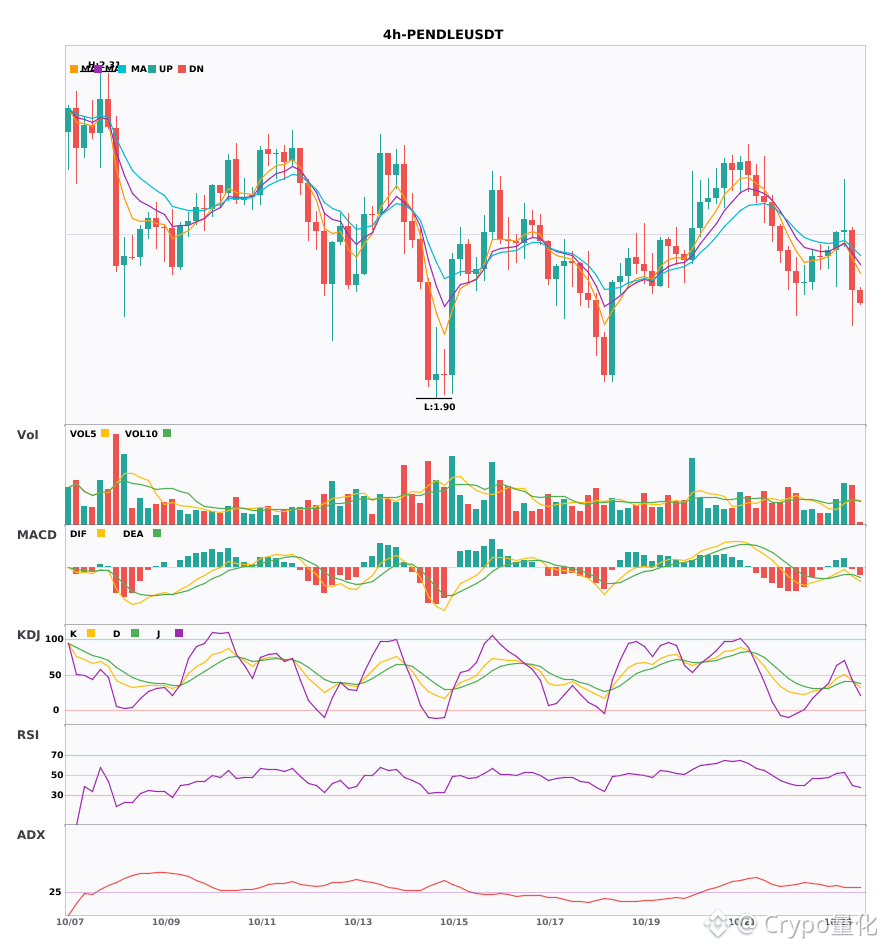
$CAKE / $POL / $PENDLE 4-hour bearish signals, daily bearish trend confirmed 🔥
════════════════════
🟢 $CAKE 4-hour bearish signal
⚠️ Technical analysis: Daily bearish confluence confirmed | 4-hour entry: MACD death cross below zero, bearish momentum accelerating | EMA5 < EMA8 < EMA13, bearish alignment | KDJ trending weakly, bears in control (K: 46.5, D: 43.3) | Normal volume (1.2x)
════════════════════
🟢 $POL 4-hour bearish signal
⚠️ Technical analysis: Daily bearish confluence confirmed | 4-hour entry: MACD death cross below zero, bearish momentum accelerating | EMA5 < EMA8 < EMA13, bearish alignment | KDJ trending weakly, bears in control (K: 41.6, D: 38.3) | Volume rising (1.5x)
════════════════════
🟢 $PENDLE 4-hour bearish signal
⚠️ Technical analysis: Daily bearish confluence confirmed | 4-hour entry: MACD death cross below zero, bearish momentum accelerating | EMA5 crosses below EMA8, short-term trend turns bearish | KDJ trending weakly, bears in control (K: 41.9, D: 41.5) | Volume rising (1.8x)
════════════════════
🔔 Follow for real-time market movement alerts 🔔
#多周期共振 #CAKE #POL #PENDLE
📌 When trading, pay attention to whether the candlestick patterns align
════════════════════
🟢 $CAKE 4-hour bearish signal
⚠️ Technical analysis: Daily bearish confluence confirmed | 4-hour entry: MACD death cross below zero, bearish momentum accelerating | EMA5 < EMA8 < EMA13, bearish alignment | KDJ trending weakly, bears in control (K: 46.5, D: 43.3) | Normal volume (1.2x)
════════════════════
🟢 $POL 4-hour bearish signal
⚠️ Technical analysis: Daily bearish confluence confirmed | 4-hour entry: MACD death cross below zero, bearish momentum accelerating | EMA5 < EMA8 < EMA13, bearish alignment | KDJ trending weakly, bears in control (K: 41.6, D: 38.3) | Volume rising (1.5x)
════════════════════
🟢 $PENDLE 4-hour bearish signal
⚠️ Technical analysis: Daily bearish confluence confirmed | 4-hour entry: MACD death cross below zero, bearish momentum accelerating | EMA5 crosses below EMA8, short-term trend turns bearish | KDJ trending weakly, bears in control (K: 41.9, D: 41.5) | Volume rising (1.8x)
════════════════════
🔔 Follow for real-time market movement alerts 🔔
#多周期共振 #CAKE #POL #PENDLE
📌 When trading, pay attention to whether the candlestick patterns align
40

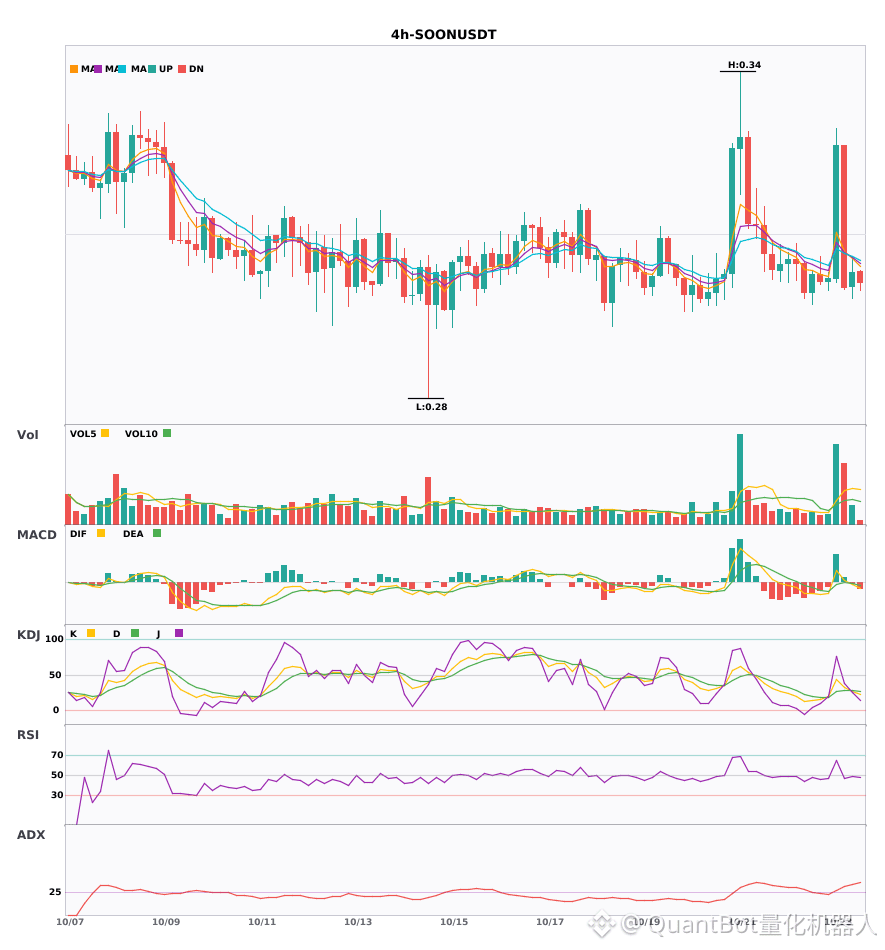
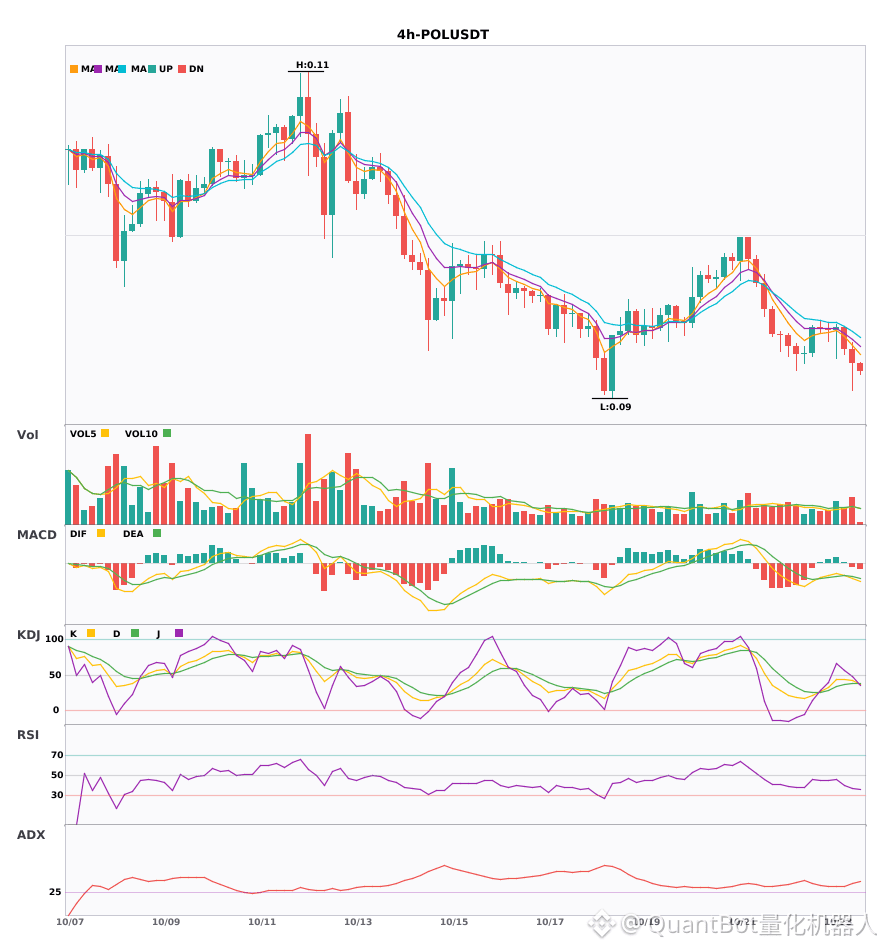
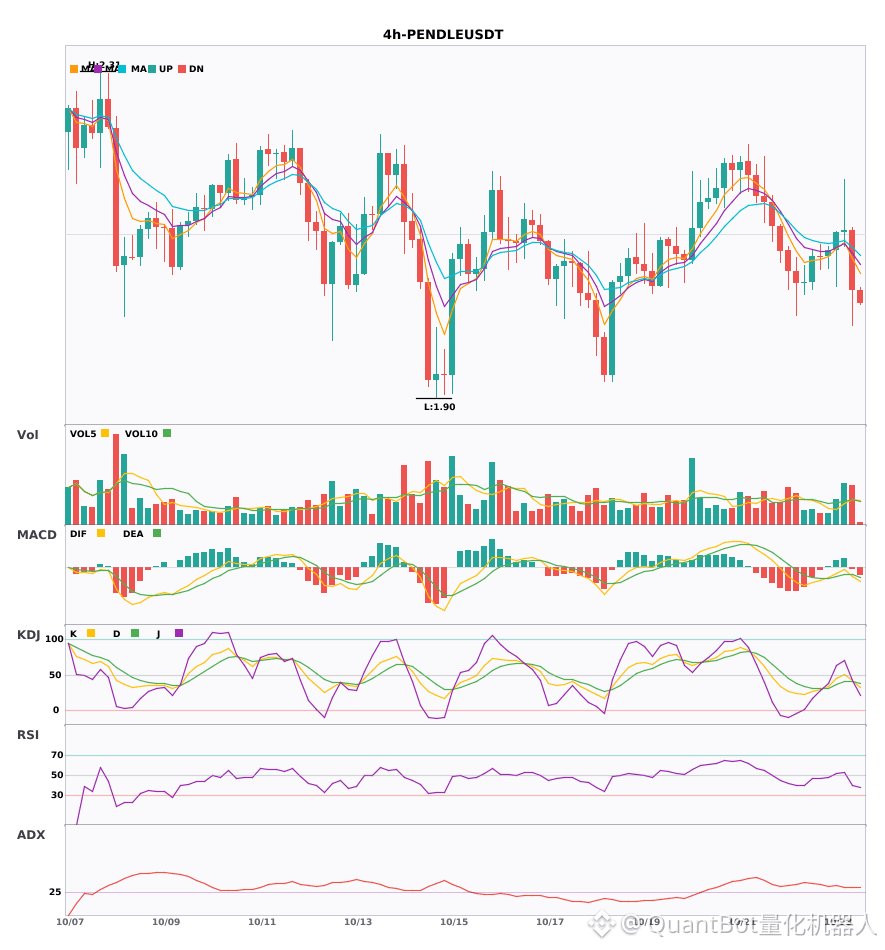
3 four-hour bearish alerts: $SOON / $POL / $PENDLE
📉 $SOON | 4-hour bearish signal
━━━━━━━━━━━━━━━━━━
Technical analysis: ADX(34) indicates a strong trend | MACD bearish cross below zero, bearish momentum accelerating | EMA5 crosses below EMA8, short-term outlook turns bearish | KDJ bearish cross, short-term bearish (K: 27.4, D: 28.3) | Volume surge (2.5x)
Price change: 1.0700%
📉 $POL | 4-hour bearish signal
━━━━━━━━━━━━━━━━━━
Technical analysis: ADX(38) indicates a strong trend | MACD bearish cross below zero, bearish momentum accelerating | EMA5 < EMA8 < EMA13, bearish alignment | KDJ trading weakly, bears in control (K: 41.6, D: 38.3) | Volume increase (1.5x)
Price change: -0.9600%
📉 $PENDLE | 4-hour bearish signal
━━━━━━━━━━━━━━━━━━
Technical analysis: ADX(33) indicates a strong trend | MACD bearish cross below zero, bearish momentum accelerating | EMA5 crosses below EMA8, short-term outlook turns bearish | KDJ trading weakly, bears in control (K: 41.9, D: 41.5) | Volume increase (1.8x)
Price change: -3.5600%
━━━━━━━━━━━━━━━━━━
#技术分析 #SOON #POL #PENDLE
📌 The above content is for reference only and does not constitute investment advice
37

·
--
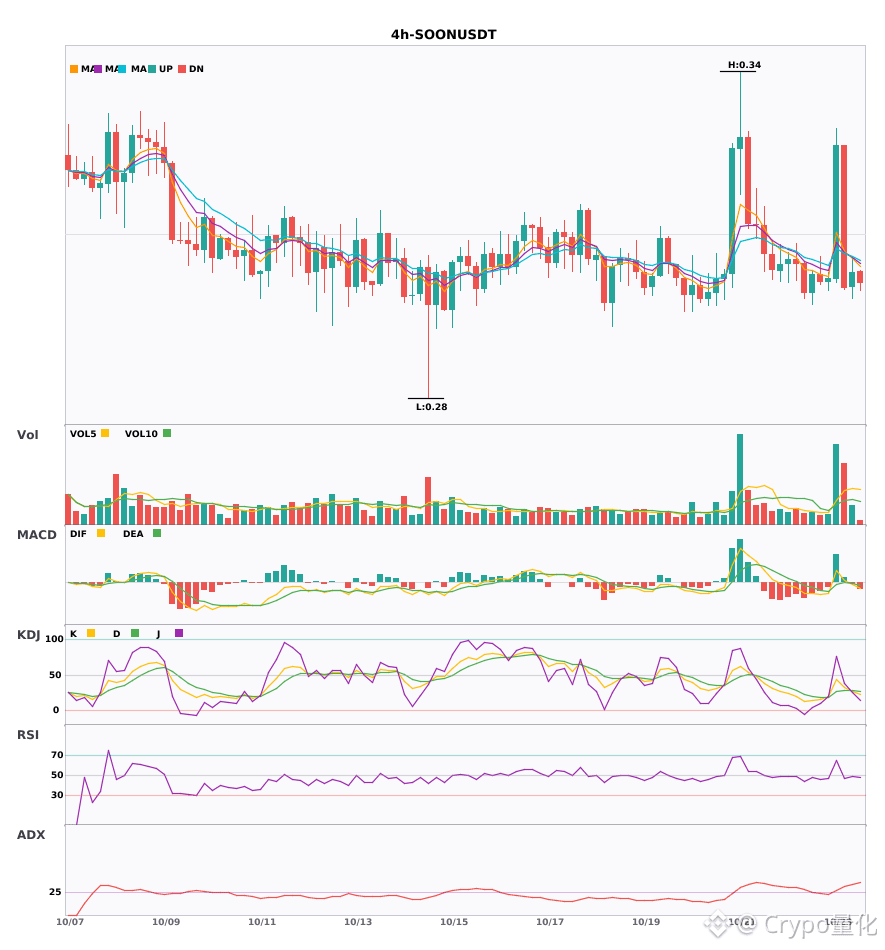
$SOON / $POL / $PENDLE 4 Hourly timeframe bearish, facing short-term pressure 🔥
════════════════════
🟢 $SOON 4-hour bearish signal
⚠️Technical analysis: ADX(34) indicates a clear trending market | MACD bearish cross below zero, bearish momentum accelerating | EMA5 crossed below EMA8, short-term outlook turns bearish | KDJ bearish cross, bearish short-term outlook (K: 27.4, D: 28.3) | Volume surge (2.5x)
════════════════════
🟢 $POL 4-hour bearish signal
⚠️Technical analysis: ADX(38) indicates a clear trending market | MACD bearish cross below zero, bearish momentum accelerating | EMA5 < EMA8 < EMA13, bearish alignment | KDJ moving weakly, bears in control (K: 41.6, D: 38.3) | Volume increase (1.5x)
════════════════════
🟢 $PENDLE 4 4-hour bearish signal
⚠️Technical analysis: ADX(33) indicates a clear trending market | MACD bearish cross below zero, bearish momentum accelerating | EMA5 crossed below EMA8, short-term outlook turns bearish | KDJ moving weakly, bears in control (K: 41.9, D: 41.5) | Volume increase (1.8x)
════════════════════
🔔 Follow for real-time market updates 🔔
#技术分析 #SOON #POL #PENDLE
📌 When trading, pay attention to whether the candlestick pattern aligns
════════════════════
🟢 $SOON 4-hour bearish signal
⚠️Technical analysis: ADX(34) indicates a clear trending market | MACD bearish cross below zero, bearish momentum accelerating | EMA5 crossed below EMA8, short-term outlook turns bearish | KDJ bearish cross, bearish short-term outlook (K: 27.4, D: 28.3) | Volume surge (2.5x)
════════════════════
🟢 $POL 4-hour bearish signal
⚠️Technical analysis: ADX(38) indicates a clear trending market | MACD bearish cross below zero, bearish momentum accelerating | EMA5 < EMA8 < EMA13, bearish alignment | KDJ moving weakly, bears in control (K: 41.6, D: 38.3) | Volume increase (1.5x)
════════════════════
🟢 $PENDLE 4 4-hour bearish signal
⚠️Technical analysis: ADX(33) indicates a clear trending market | MACD bearish cross below zero, bearish momentum accelerating | EMA5 crossed below EMA8, short-term outlook turns bearish | KDJ moving weakly, bears in control (K: 41.9, D: 41.5) | Volume increase (1.8x)
════════════════════
🔔 Follow for real-time market updates 🔔
#技术分析 #SOON #POL #PENDLE
📌 When trading, pay attention to whether the candlestick pattern aligns
67

·
--
See translation
$PENDLE 0.9x volume ratio today means the current drop is just drifting
Most traders stare only at price and completely ignore what volume is actually telling them
Right now $PENDLE sits at $2.0740 down 3.4 percent on the day
The 24 hour volume is $2.6M which works out to 0.9x the seven day average
That fraction is the tell
When price falls on below average volume it usually means sellers lack real conviction
It is a quiet drift rather than a heavy institutional dump
Checking this ratio takes twenty seconds on any decent charting tool
Divide today total volume by the daily average of the past week
If that number stays under one it means the move lacks real weight
Never trust a breakdown if the volume bar is shrinking instead of growing
How do you measure volume strength on your charts
#PENDLE #TradingTips
4

·
--
Article
PENDLE Is Up About 2%, Yet Long Liquidations Are Nearly 114x Higher$PENDLE is still up around 2%, yet over the past 24 hours, long liquidations have outpaced short liquidations by nearly 114 times.
#PENDLE #持仓量 #资金费率 #Liquidations
Long liquidations totaled about $16,900, versus roughly $148 for shorts—about 114 times as much, across 25 liquidations. The current price is around 2.107 on Binance and 2.107 on OKX, with both exchanges in sync. It’s up about 2.3%/2.7% over 24 hours.
Total futures open interest is around $62.92 million: about $15.2 million on Binance and $2.68 million on OKX. Accounts are slightly net long, with longs at about 51% and shorts at about 49%. The funding rate is around +0.012%, indicating a slight bias toward longs paying.
With PENDLE up about 2%, does the 114x liquidation gap mean longs piled on leverage too quickly, while shorts barely got squeezed?
PENDLE Is Up About 2%, Yet Long Liquidations Are Nearly 114x Higher
$PENDLE is still up around 2%, yet over the past 24 hours, long liquidations have outpaced short liquidations by nearly 114 times.
#PENDLE #持仓量 #资金费率 #Liquidations
Long liquidations totaled about $16,900, versus roughly $148 for shorts—about 114 times as much, across 25 liquidations. The current price is around 2.107 on Binance and 2.107 on OKX, with both exchanges in sync. It’s up about 2.3%/2.7% over 24 hours.
Total futures open interest is around $62.92 million: about $15.2 million on Binance and $2.68 million on OKX. Accounts are slightly net long, with longs at about 51% and shorts at about 49%. The funding rate is around +0.012%, indicating a slight bias toward longs paying.
With PENDLE up about 2%, does the 114x liquidation gap mean longs piled on leverage too quickly, while shorts barely got squeezed?
See translation
💥 $PENDLE SILENTLY ACCUMULATING IN THE BOTTOM ZONE BEFORE THE MONOPOLY RALLY! 🦈
While rival DEX protocols battle for squeezed market share, $PENDLE quietly commands a near-monopoly on yield derivative infrastructure. Institutional positioning favors uncrowded sector titans trading at deep discount value. 🦈
The technical structure is tightening fast, with the weekly MACD curling smoothly toward the zero axis inside a low-risk demand basin. 📊 A single high-volume expansion candle will trigger heavy momentum inflows, making early positioning far superior to chasing green spikes. ⚡
💡 Patience in quiet accumulation zones yields the sharpest risk-to-reward ratios on the board. 💬 Are you front-loading your bids here or waiting to chase the breakout rally? 👇
⚠️ Not financial advice. Always manage your risk. 🛡️
🏷️ #PENDLE #DeFi #Altcoins #Breakout #Crypto
🔥 💎
5

See translation
🚨 $PENDLE VOL SPIKES 800% AS WHALES ABSORB LOCAL RESISTANCE FOR EXPLOSIVE EXPANSION! 💥
Entry: 2.11 - 2.12 ⚡
Target: 2.18 - 2.25 🚀
Smart money just injected massive fuel into $PENDLE , driving an unprecedented 800% volume expansion while Open Interest hits vertical trajectory. 🦈 Institutional absorption is clearly underway at these levels, compressing price directly underneath the overhead ceiling. 📊
Heavy bids are aggressively stacking on the order book, leaving local supply completely exhausted. ⚡ Once this immediate resistance snaps, upside momentum threatens to trigger an aggressive vertical expansion into higher liquidity pools. 📌
💬 Are you positioning ahead of this breakout or waiting for confirmation above resistance? 👇
⚠️ Not financial advice. Always manage your risk. 🛡️
🏷️ #PENDLE #Breakout #Altcoins #Crypto
🔥 ⚡
10

See translation
💥 $PENDLE BREAKS PSYCHOLOGICAL RESISTANCE AS HEAVY LIQUIDITY PUSHES BREAKOUT HIGHER! 🚀
Entry: 2.095 - 2.125 ⚡
Target: 2.155 - 2.190 - 2.225 🚀
Stop Loss: 2.045 ⚠️
📌 Smart money absorbed sell pressure at key levels, forcing a clean reclaim above psychological resistance with aggressive buyer volume. 📊 Order flow indicates market makers are actively defending this demand block while overleveraged shorts get squeezed out of position.
⚡ Momentum heavily favors a direct push toward upper target zones as liquidity sweeps trigger consecutive stop runs. 💬 Are you riding this momentum swing or waiting for a retest before taking a position? 👇
⚠️ Not financial advice. Always manage your risk. 🛡️
🏷️ #PENDLE #LongSetup #Altcoins #Crypto
🔥 💎
2

·
--
See translation
What would a Pendle principal token such as PT-RLP (USDC) actually return at maturity? Pendle's normal expectation is one USDC. To evaluate a discounted purchase, I'd check the exchange rate behind that figure before calculating the expected return.
Pendle's market page has a Watermark Rate view showing the underlying yield-bearing token's current exchange rate and its highest recorded rate. Both are measured against the accounting asset, USDC in this example. If the rate is still below that watermark at maturity, redemption can be worth less than one USDC. The PT's purchase price doesn't determine that redemption amount.
The wrinkle is how the high was set. Pendle's documentation says oracle mispricing or a temporary spike in the underlying token's share price can leave an artificially high watermark. It stays in place after the exchange rate returns to normal. That leaves two separate questions for the purchase: has the rate recovered to normal, and has it recovered to the high used for redemption?
Source: Pendle, Understanding Negative Yield Risk
https://docs.pendle.finance/pendle-v2/ProtocolMechanics/NegativeYield
#DeFi #Pendle
139
Log in to explore more content
Join global crypto users on Binance Square
⚡️ Get latest and useful information about crypto.
💬 Trusted by the world’s largest crypto exchange.
👍 Discover real insights from verified creators.
Email / Phone number
Trending Topics
1
#BinancePick
2.5M views
138,800 Discussing
2
#EarningsSeason
5M views
24,021 Discussing
3
#ElectrumWalletBugLetRogueServersStealFunds
3,254 views
168 Discussing
4
#ArgentineCourtDismissesLIBRACaseAgainstMilei
11,557 views
241 Discussing
5
#SKHynixReportedlyPlansSpecialDividendFromKioxiaStakeSale
2,377 views
41 Discussing
6
#KeystoneWebsiteBreachExposesBuyersShippingAddresses
1,365 views
31 Discussing
7
#USQ3GDPAndSeptemberPCEDueNextWeek
85,709 views
1,051 Discussing
8
#SouthKoreaDelaysCryptoIncomeTax
157,556 views
1,097 Discussing
9
#ElectrumFixesHighRiskExploitInVersionsBefore4.8.3
68,762 views
787 Discussing
10
#SouthKoreaPlansToRegulateStablecoinsUnderFXLaw
66,666 views
701 Discussing