
#onchainanalysis
onchainanalysis
849,183 views
2,252 Discussing
Hot
Latest

See translation
Have you noticed how retail traders keep celebrating smart money entries without checking the wallet distribution?
Most investors rush to copy-trade big wallets only to become exit liquidity when that same smart money decides to take profit.
Take a look at this recent $SOL ecosystem case study. On-chain tracking showed a trader aggressively accumulating a newly trending token, generating massive hype across social feeds. But there was a critical catch that most people ignored: the accumulation was so aggressive that the trader became the largest single holder of the supply.
When one entity holds a disproportionate share of an asset like $ETH or smaller meme pairs, price action ceases to be market-driven. It turns into a ticking time bomb where an automated limit order or a simple $BNB bridge swap can collapse the entire liquidity pool in a single transaction.
How do you evaluate top holder concentration before following a smart money trade?
#CryptoTrading #OnChainAnalysis #SmartMoney
Most investors rush to copy-trade big wallets only to become exit liquidity when that same smart money decides to take profit.
Take a look at this recent $SOL ecosystem case study. On-chain tracking showed a trader aggressively accumulating a newly trending token, generating massive hype across social feeds. But there was a critical catch that most people ignored: the accumulation was so aggressive that the trader became the largest single holder of the supply.
When one entity holds a disproportionate share of an asset like $ETH or smaller meme pairs, price action ceases to be market-driven. It turns into a ticking time bomb where an automated limit order or a simple $BNB bridge swap can collapse the entire liquidity pool in a single transaction.
How do you evaluate top holder concentration before following a smart money trade?
#CryptoTrading #OnChainAnalysis #SmartMoney


See translation
Picture this: a single on-chain trader snipes a microcap runner early, builds massive paper profits, but ends up holding the bag as the single largest wallet on the roster.
Most retail traders chase these explosive green candles without checking the holder distribution, only to realize too late that their favorite setup is held hostage by one entity who cannot exit without cratering the order book.
We saw this exact pattern play out during the early $PEPE distribution phase and again with recent low-float $SOL meme launches. When one wallet controls over 15% to 20% of the circulating float, liquidity essentially dries up on the sell side. The trader cannot take substantial profits into a thin $BNB pool without triggering automated arbitrage bots and panic cascades.
The dilemma becomes straightforward: take heavy slippage on market sells, or slowly distribute across decentralized pools while hoping market momentum stays intact.
How do you usually evaluate top-holder concentration before taking a position in low-cap setups?
#CryptoTrading #OnChainAnalysis #DeFi
Most retail traders chase these explosive green candles without checking the holder distribution, only to realize too late that their favorite setup is held hostage by one entity who cannot exit without cratering the order book.
We saw this exact pattern play out during the early $PEPE distribution phase and again with recent low-float $SOL meme launches. When one wallet controls over 15% to 20% of the circulating float, liquidity essentially dries up on the sell side. The trader cannot take substantial profits into a thin $BNB pool without triggering automated arbitrage bots and panic cascades.
The dilemma becomes straightforward: take heavy slippage on market sells, or slowly distribute across decentralized pools while hoping market momentum stays intact.
How do you usually evaluate top-holder concentration before taking a position in low-cap setups?
#CryptoTrading #OnChainAnalysis #DeFi


See translation
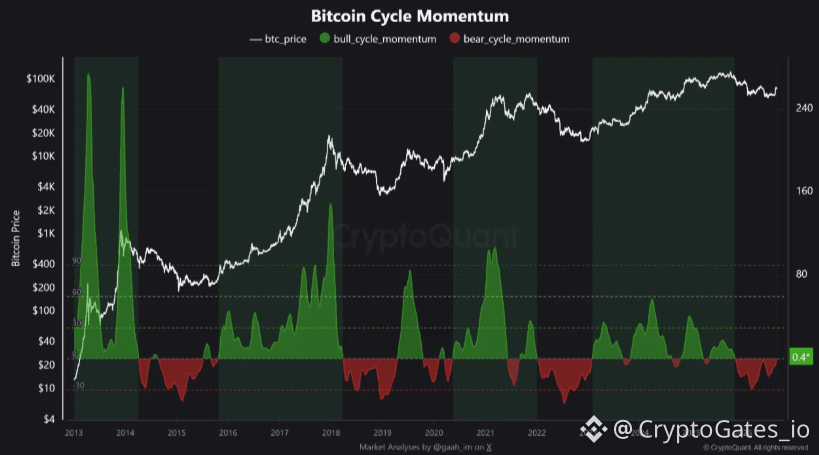
$BTC On-Chain Update: Cycle Momentum Flips Positive
key data point: Bitcoin's Cycle Momentum indicator just crossed from -11.4 (June) to +0.4 (current), the first positive print in 8 months.
what this indicator does: tracks the balance of bullish vs bearish on-chain momentum across the cycle. Readings above zero historically align with strengthening structure.
Confirmation threshold: analysts tracking this metric flag 20-30 as the level needed for a confirmed reversal. We're not there. A cross above zero is the first step, not the finish line.
supporting a separate composite indicator built from MVRV, NUPL and SOPR also turned positive in late August, its first positive reading since October 2025.
Two independent on-chain frameworks moving the same direction is notable. It is not confirmation. treat this as a metric to track weekly, not a signal to act on in isolation.
Risk management still comes first regardless of what any single indicator prints...
#BTC #OnChainAnalysis
key data point: Bitcoin's Cycle Momentum indicator just crossed from -11.4 (June) to +0.4 (current), the first positive print in 8 months.
what this indicator does: tracks the balance of bullish vs bearish on-chain momentum across the cycle. Readings above zero historically align with strengthening structure.
Confirmation threshold: analysts tracking this metric flag 20-30 as the level needed for a confirmed reversal. We're not there. A cross above zero is the first step, not the finish line.
supporting a separate composite indicator built from MVRV, NUPL and SOPR also turned positive in late August, its first positive reading since October 2025.
Two independent on-chain frameworks moving the same direction is notable. It is not confirmation. treat this as a metric to track weekly, not a signal to act on in isolation.
Risk management still comes first regardless of what any single indicator prints...
#BTC #OnChainAnalysis

See translation
UTXO Age Bands: The On-Chain Signal Most Traders Ignore
Bitcoin's UTXO age distribution is one of the most underrated signals in crypto. When a large proportion of coins haven't moved in 12+ months, it tells you something money-flow charts cannot: long-term holders are not selling.
Here's why it matters right now:
- Coins aged 1–2 years are near cycle highs in their share of total supply. This cohort typically begins distributing only when price enters late-stage euphoria — we are not there yet.
- Short-term holder (STH) supply has been contracting, meaning recent buyers are either holding or have already exited at a loss. Less STH supply = less near-term sell pressure.
- Every time the 6-month+ UTXO band expanded during a consolidation phase, the subsequent 6–12 months rewarded patient capital.
This dynamic matters for $ETH and $SOL too — both networks have growing long-term cohorts as staking locks up supply and reduces liquid float.
The macro noise is loud. The on-chain structure is quiet — and quietly constructive.
Conviction is built in the silence between volatility spikes, not during them.
$BTC $ETH $SOL
#Bitcoin #OnChainAnalysis #UTXO #CryptoInsights #LongTermConviction
Bitcoin's UTXO age distribution is one of the most underrated signals in crypto. When a large proportion of coins haven't moved in 12+ months, it tells you something money-flow charts cannot: long-term holders are not selling.
Here's why it matters right now:
- Coins aged 1–2 years are near cycle highs in their share of total supply. This cohort typically begins distributing only when price enters late-stage euphoria — we are not there yet.
- Short-term holder (STH) supply has been contracting, meaning recent buyers are either holding or have already exited at a loss. Less STH supply = less near-term sell pressure.
- Every time the 6-month+ UTXO band expanded during a consolidation phase, the subsequent 6–12 months rewarded patient capital.
This dynamic matters for $ETH and $SOL too — both networks have growing long-term cohorts as staking locks up supply and reduces liquid float.
The macro noise is loud. The on-chain structure is quiet — and quietly constructive.
Conviction is built in the silence between volatility spikes, not during them.
$BTC $ETH $SOL
#Bitcoin #OnChainAnalysis #UTXO #CryptoInsights #LongTermConviction

See translation
Here is what happened when a single entity decided to quietly offload 51,387 $ETH worth over $125.9 million while the broader market was looking the other way.
Most retail traders get caught watching short-term charts, completely blind to heavy distribution happening directly on-chain until the red candles hit. By the time you notice the drop, smart money has already exited and left you holding the downside risk.
Address 0x2Ea2 moved 40,881 $ETH , roughly $100.7 million, directly onto exchanges in just 48 hours. Exchange deposits of this size rarely mean anything other than immediate sell pressure, signaling that large players are actively derisking.
The wallet still holds 10,506 $ETH worth around $25.52 million, meaning the selling phase might not be finished yet. When large capital moves into centralized books while assets like $BTC consolidate, localized liquidity usually takes the hit first.
How are you adjusting your spot exposure when on-chain exchange inflows spike like this?
#Ethereum #CryptoTrading #OnChainAnalysis
Most retail traders get caught watching short-term charts, completely blind to heavy distribution happening directly on-chain until the red candles hit. By the time you notice the drop, smart money has already exited and left you holding the downside risk.
Address 0x2Ea2 moved 40,881 $ETH , roughly $100.7 million, directly onto exchanges in just 48 hours. Exchange deposits of this size rarely mean anything other than immediate sell pressure, signaling that large players are actively derisking.
The wallet still holds 10,506 $ETH worth around $25.52 million, meaning the selling phase might not be finished yet. When large capital moves into centralized books while assets like $BTC consolidate, localized liquidity usually takes the hit first.
How are you adjusting your spot exposure when on-chain exchange inflows spike like this?
#Ethereum #CryptoTrading #OnChainAnalysis
See translation
Whale Wallets Are Accumulating. Here Is What the Data Actually Tells Us.
On-chain data is one of the few edges retail investors have over traditional markets — if they know how to read it.
When large wallets holding 1,000+ $BTC quietly accumulate during range-bound price action, it rarely makes headlines. But the pattern is consistent: distribution phases get sold into retail euphoria, while accumulation phases happen in silence — during boring sideways markets exactly like the ones most people abandon.
For $ETH , tracking the ratio of addresses holding more than 1,000 ETH versus exchange supply tells a cleaner story than most price indicators. When that ratio rises while exchange reserves fall, it signals conviction, not speculation.
On-chain velocity — how frequently tokens change hands — drops sharply during deep accumulation phases. Coins stop moving. That stillness is the signal.
What most traders miss: whales do not need price movement to profit. They need time and patience. By the time retail sees the move, the positioning is already complete.
Watch exchange net flows, track large wallet cohorts, and pay attention to when the market turns unusually quiet. In $SOL , $ETH , or any liquid asset, silence in on-chain data is often louder than any chart pattern.
Data does not lie. It just requires patience to hear it.
#Crypto #OnChainAnalysis #Bitcoin #BinanceSquare #CryptoInsights
On-chain data is one of the few edges retail investors have over traditional markets — if they know how to read it.
When large wallets holding 1,000+ $BTC quietly accumulate during range-bound price action, it rarely makes headlines. But the pattern is consistent: distribution phases get sold into retail euphoria, while accumulation phases happen in silence — during boring sideways markets exactly like the ones most people abandon.
For $ETH , tracking the ratio of addresses holding more than 1,000 ETH versus exchange supply tells a cleaner story than most price indicators. When that ratio rises while exchange reserves fall, it signals conviction, not speculation.
On-chain velocity — how frequently tokens change hands — drops sharply during deep accumulation phases. Coins stop moving. That stillness is the signal.
What most traders miss: whales do not need price movement to profit. They need time and patience. By the time retail sees the move, the positioning is already complete.
Watch exchange net flows, track large wallet cohorts, and pay attention to when the market turns unusually quiet. In $SOL , $ETH , or any liquid asset, silence in on-chain data is often louder than any chart pattern.
Data does not lie. It just requires patience to hear it.
#Crypto #OnChainAnalysis #Bitcoin #BinanceSquare #CryptoInsights
See translation
Why is nobody paying attention to the massive supply divergence happening right under our noses?
Most traders keep getting chopped up trying to time short-term momentum, completely missing where smart liquidity is quietly repositioning.
While the broader market remains fixated on daily candles, $ETH reserves across exchanges have plummeted by over 1.4M coins since June. At the same time, $BTC exchange balances have actually crept higher. When supply drops during an upward price trend, it signals direct accumulation and evaporating sell-side liquidity rather than temporary retail speculation.
If you are planning your next moves, start filtering out the social noise and track exchange outflows directly. Focus on pairs where circulating float is drying up first, because when demand returns, supply-constrained assets react the fastest.
Are you positioning for this liquidity crunch, or sticking strictly with $BTC dominance?
#Ethereum #CryptoTrading #OnChainAnalysis
Most traders keep getting chopped up trying to time short-term momentum, completely missing where smart liquidity is quietly repositioning.
While the broader market remains fixated on daily candles, $ETH reserves across exchanges have plummeted by over 1.4M coins since June. At the same time, $BTC exchange balances have actually crept higher. When supply drops during an upward price trend, it signals direct accumulation and evaporating sell-side liquidity rather than temporary retail speculation.
If you are planning your next moves, start filtering out the social noise and track exchange outflows directly. Focus on pairs where circulating float is drying up first, because when demand returns, supply-constrained assets react the fastest.
Are you positioning for this liquidity crunch, or sticking strictly with $BTC dominance?
#Ethereum #CryptoTrading #OnChainAnalysis


See translation
A single entity is currently sitting on nearly 5% of the entire circulating supply of Ethereum, and almost nobody is talking about what happens if they ever need liquidity.
Most retail traders see massive corporate accumulation and immediately FOMO into long positions at local tops. Chasing green candles without understanding treasury concentration usually ends in getting caught on the wrong side of sudden market dumps.
BitMine just scooped up another 53,501 $ETH , pushing their total holdings to a massive 5.90M coins. That represents roughly 4.9% of the entire circulating supply locked inside one treasury. While this looks like pure bullish momentum on surface charts alongside $BTC movements, centralizing that much weight creates a serious structural risk.
When a single balance sheet controls that much market depth, any future debt restructuring, credit event, or strategic rebalancing could cascade across decentralized liquidity pools and spot order books. Supply shock cuts both ways, and having so much float concentrated in one place means the exit door becomes dangerously narrow if macro conditions flip.
Do you see corporate treasury concentration like this as a healthy catalyst or a structural risk for spot holders?
#Ethereum #CryptoTrading #OnChainAnalysis
Most retail traders see massive corporate accumulation and immediately FOMO into long positions at local tops. Chasing green candles without understanding treasury concentration usually ends in getting caught on the wrong side of sudden market dumps.
BitMine just scooped up another 53,501 $ETH , pushing their total holdings to a massive 5.90M coins. That represents roughly 4.9% of the entire circulating supply locked inside one treasury. While this looks like pure bullish momentum on surface charts alongside $BTC movements, centralizing that much weight creates a serious structural risk.
When a single balance sheet controls that much market depth, any future debt restructuring, credit event, or strategic rebalancing could cascade across decentralized liquidity pools and spot order books. Supply shock cuts both ways, and having so much float concentrated in one place means the exit door becomes dangerously narrow if macro conditions flip.
Do you see corporate treasury concentration like this as a healthy catalyst or a structural risk for spot holders?
#Ethereum #CryptoTrading #OnChainAnalysis

See translation
A single corporate entity now controls nearly 5% of all circulating Ethereum supply.
Most retail traders get blinded by bullish accumulation headlines, completely missing how aggressive treasury centralisation creates massive structural exit risks for anyone holding spot.
BitMine just scooped up another 53,501 $ETH , marking their 65th consecutive week of buying and pushing their total reserves to 5.90M tokens. On paper, having a $15.6B balance sheet with 5.07M tokens locked in staking to pull $335M in annualized yield sounds like unstoppable institutional backing. They even hold 211 $BTC on the side to diversify their cash reserves.
Here is the part people ignore: when one balance sheet holds that much supply, the entire ecosystem becomes hostage to their corporate liquidity health. If macro pressures ever force a restructuring or collateral liquidation, unwinding millions of staked assets cannot happen smoothly on-chain without devastating the order books.
How do you hedge against single-entity supply concentration when holding major caps long term?
#Ethereum #CryptoTreasury #OnChainAnalysis
Most retail traders get blinded by bullish accumulation headlines, completely missing how aggressive treasury centralisation creates massive structural exit risks for anyone holding spot.
BitMine just scooped up another 53,501 $ETH , marking their 65th consecutive week of buying and pushing their total reserves to 5.90M tokens. On paper, having a $15.6B balance sheet with 5.07M tokens locked in staking to pull $335M in annualized yield sounds like unstoppable institutional backing. They even hold 211 $BTC on the side to diversify their cash reserves.
Here is the part people ignore: when one balance sheet holds that much supply, the entire ecosystem becomes hostage to their corporate liquidity health. If macro pressures ever force a restructuring or collateral liquidation, unwinding millions of staked assets cannot happen smoothly on-chain without devastating the order books.
How do you hedge against single-entity supply concentration when holding major caps long term?
#Ethereum #CryptoTreasury #OnChainAnalysis

See translation
Most of the market is buzzing about this $1B Polymarket raise, but they're missing the real signal.
Forget the headline figures. Smart money isn't just looking at the valuation; they're watching the *flow*. On-chain data shows significant accumulation in prediction markets leading up to this announcement, suggesting sophisticated players were already positioning themselves. This isn't just VC money; it's a vote of confidence from those who understand the underlying utility. #PredictionMarkets #CryptoNews #OnChainAnalysis
This $1 billion influx into Polymarket, reportedly with a Trump Jr.-linked firm at the helm, isn't just about a new valuation. It signals a maturation of the decentralized prediction market space. When established players, even those with political ties, pour this much capital in, it validates the infrastructure and potential for real-world applications beyond speculation. Expect increased liquidity and more sophisticated event contracts.
Keep a close eye on Polymarket's smart contract activity and the volume of settled predictions. These on-chain metrics will tell us more than any press release. #Polymarket
Are we on the cusp of prediction markets becoming a mainstream financial instrument, or is this just another speculative bubble inflated by hype?
Forget the headline figures. Smart money isn't just looking at the valuation; they're watching the *flow*. On-chain data shows significant accumulation in prediction markets leading up to this announcement, suggesting sophisticated players were already positioning themselves. This isn't just VC money; it's a vote of confidence from those who understand the underlying utility. #PredictionMarkets #CryptoNews #OnChainAnalysis
This $1 billion influx into Polymarket, reportedly with a Trump Jr.-linked firm at the helm, isn't just about a new valuation. It signals a maturation of the decentralized prediction market space. When established players, even those with political ties, pour this much capital in, it validates the infrastructure and potential for real-world applications beyond speculation. Expect increased liquidity and more sophisticated event contracts.
Keep a close eye on Polymarket's smart contract activity and the volume of settled predictions. These on-chain metrics will tell us more than any press release. #Polymarket
Are we on the cusp of prediction markets becoming a mainstream financial instrument, or is this just another speculative bubble inflated by hype?
See translation
A 6,950 $BTC transfer to Binance looks bearish at first glance, but the last two 5K+ Bitcoin inflow spikes since January showed up near major price lows.
That’s the trap a lot of traders fall into. They see exchange inflows, panic sell, or FOMO the wrong side of the move without asking whether the market is actually getting ready to stabilize. In crypto, the headline is rarely the full signal.
Here’s the useful part: large $BTC deposits to Binance can mean distribution, but they can also mark moments when bigger holders are positioning for liquidity, not just dumping. If this third surge follows the same pattern as the earlier two, it could be more of a pressure test than a clean sell signal.
Still, that doesn’t make it bullish by default. If spot demand doesn’t show up, inflows like this can turn into real downside fast, especially when $BTC is already fragile and traders are overlevered. The risk is assuming every exchange move means the same thing when context is what actually matters.
What’s your take on this one?
#BTC #Bitcoin #OnChainAnalysis
That’s the trap a lot of traders fall into. They see exchange inflows, panic sell, or FOMO the wrong side of the move without asking whether the market is actually getting ready to stabilize. In crypto, the headline is rarely the full signal.
Here’s the useful part: large $BTC deposits to Binance can mean distribution, but they can also mark moments when bigger holders are positioning for liquidity, not just dumping. If this third surge follows the same pattern as the earlier two, it could be more of a pressure test than a clean sell signal.
Still, that doesn’t make it bullish by default. If spot demand doesn’t show up, inflows like this can turn into real downside fast, especially when $BTC is already fragile and traders are overlevered. The risk is assuming every exchange move means the same thing when context is what actually matters.
What’s your take on this one?
#BTC #Bitcoin #OnChainAnalysis

See translation
Exchange Outflows Are Telling a Story — Are You Reading It?
One of the most reliable on-chain signals in crypto is deceptively simple: when coins leave exchanges, conviction is rising. When they flow in, selling pressure builds.
Persistent exchange outflows for $BTC and $ETH compress the liquid float available for spot sellers. Every coin that moves to cold storage or self-custody is a coin that won't hit an order book at the first sign of volatility. That structural shift quietly raises the price floor over time.
For $SOL , staking ratio tells a parallel story. When a high percentage of supply is staked and locked in validator economics, circulating sell-side inventory shrinks — not because of sentiment, but because of mechanics.
Exchange balances hit multi-year lows during every major bull run. The traders watching order books are playing one game. The investors tracking on-chain flows are playing a longer one.
What to watch:
— BTC exchange reserves trending down = structural accumulation
— ETH staking ratio rising = supply-side friction building
— SOL stake rate + validator growth = ecosystem confidence signal
Accumulation is quiet by design. Conviction shows up in the data long before it shows up in the chart.
#OnChainAnalysis #CryptoInvesting #BitcoinAccumulation #CryptoInsights #HODL
One of the most reliable on-chain signals in crypto is deceptively simple: when coins leave exchanges, conviction is rising. When they flow in, selling pressure builds.
Persistent exchange outflows for $BTC and $ETH compress the liquid float available for spot sellers. Every coin that moves to cold storage or self-custody is a coin that won't hit an order book at the first sign of volatility. That structural shift quietly raises the price floor over time.
For $SOL , staking ratio tells a parallel story. When a high percentage of supply is staked and locked in validator economics, circulating sell-side inventory shrinks — not because of sentiment, but because of mechanics.
Exchange balances hit multi-year lows during every major bull run. The traders watching order books are playing one game. The investors tracking on-chain flows are playing a longer one.
What to watch:
— BTC exchange reserves trending down = structural accumulation
— ETH staking ratio rising = supply-side friction building
— SOL stake rate + validator growth = ecosystem confidence signal
Accumulation is quiet by design. Conviction shows up in the data long before it shows up in the chart.
#OnChainAnalysis #CryptoInvesting #BitcoinAccumulation #CryptoInsights #HODL
See translation
A $40M Bitcoin move looks bearish at first glance, but the real clue is that it didn’t go straight to an exchange.
That’s where traders get burned. People see old coins wake up and instantly FOMO out or panic short, even though a wallet move is not the same thing as sell pressure.
With $BTC , the destination matters more than the headline. If coins land in a fresh self-custody wallet or an OTC route, that can mean treasury reshuffling, security changes, or internal transfers. If they hit exchange deposits, that’s when the market should care. Same idea shows up across $ETH and $BNB too.
The risk is reacting to motion instead of intent. A dormant wallet moving $40M can shake sentiment, but the wrong read can leave you buying the top or exiting too early.
What do you think this kind of movement usually signals first, distribution or just housekeeping?
#Bitcoin #Crypto #OnChainAnalysis
That’s where traders get burned. People see old coins wake up and instantly FOMO out or panic short, even though a wallet move is not the same thing as sell pressure.
With $BTC , the destination matters more than the headline. If coins land in a fresh self-custody wallet or an OTC route, that can mean treasury reshuffling, security changes, or internal transfers. If they hit exchange deposits, that’s when the market should care. Same idea shows up across $ETH and $BNB too.
The risk is reacting to motion instead of intent. A dormant wallet moving $40M can shake sentiment, but the wrong read can leave you buying the top or exiting too early.
What do you think this kind of movement usually signals first, distribution or just housekeeping?
#Bitcoin #Crypto #OnChainAnalysis
See translation
Seeing 40 million dollars in ancient Bitcoin suddenly move after a decade usually triggers pure panic across the market. Most traders immediately brace for an aggressive dump, panic-selling their hard-earned positions right before the market stabilizes.
We have seen this movie play out in every major cycle. Six dormant wallets waking up after ten years sounds alarming on paper, but the critical detail is where those coins went: they never hit centralized exchanges. On-chain data from Galaxy actually reveals that dormant $BTC activity is sitting at its lowest level since 2022, signaling that long-term conviction remains rock solid rather than pointing to an imminent liquidation wave.
Smart money often reorganizes custody, consolidates UTXOs, or shifts reserves into cold storage while retail market participants panic over raw volume movement. Even as volatility spills into assets like $ETH and large caps, on-chain mechanics tell a completely different story than surface-level transaction alerts.
How do you usually react when you see ancient whale wallets wake up during quiet market conditions?
#Bitcoin #CryptoTrading #OnChainAnalysis
We have seen this movie play out in every major cycle. Six dormant wallets waking up after ten years sounds alarming on paper, but the critical detail is where those coins went: they never hit centralized exchanges. On-chain data from Galaxy actually reveals that dormant $BTC activity is sitting at its lowest level since 2022, signaling that long-term conviction remains rock solid rather than pointing to an imminent liquidation wave.
Smart money often reorganizes custody, consolidates UTXOs, or shifts reserves into cold storage while retail market participants panic over raw volume movement. Even as volatility spills into assets like $ETH and large caps, on-chain mechanics tell a completely different story than surface-level transaction alerts.
How do you usually react when you see ancient whale wallets wake up during quiet market conditions?
#Bitcoin #CryptoTrading #OnChainAnalysis

See translation
Most alpha groups don't make you early, they just turn you into exit liquidity for the people who got there first.
We all know the pain of jumping into a trending chat, buying the hype, and watching your balance get chopped in half because you were reacting to noise instead of real data.
When you look at community hubs like Town Chat on the Robinhood chain for tokens like $HOODER, finding plays before they hit main feeds sounds great on paper. But trading straight from the trenches comes with serious blindspots. Unverified chat chatter often disguises coordinated dumps, and if you aren't cross-referencing activity on explorers before entering $ETH or $SOL ecosystem plays, you're essentially trading blind.
Information moves fast, but smart money usually leaves right when public chat sentiment peaks. Treating social discovery as an entry signal without waiting for on-chain volume confirmation is how most retail portfolios get drained.
How do you separate actual early signals from exit liquidity traps when browsing new token communities?
#CryptoTrading #OnChainAnalysis #RiskManagement
We all know the pain of jumping into a trending chat, buying the hype, and watching your balance get chopped in half because you were reacting to noise instead of real data.
When you look at community hubs like Town Chat on the Robinhood chain for tokens like $HOODER, finding plays before they hit main feeds sounds great on paper. But trading straight from the trenches comes with serious blindspots. Unverified chat chatter often disguises coordinated dumps, and if you aren't cross-referencing activity on explorers before entering $ETH or $SOL ecosystem plays, you're essentially trading blind.
Information moves fast, but smart money usually leaves right when public chat sentiment peaks. Treating social discovery as an entry signal without waiting for on-chain volume confirmation is how most retail portfolios get drained.
How do you separate actual early signals from exit liquidity traps when browsing new token communities?
#CryptoTrading #OnChainAnalysis #RiskManagement

See translation
🚨 $AVICI PROTOCOL SUFFERS $1.02M ON-CHAIN EXPLOIT AS FUNDS FLOW TO MIXERS 🔻
On-chain tracking reveals a critical exploit within the $AVICI framework, draining approximately $1.02M in liquidity. 🔍 The malicious actor routed 10,000 $SOL through stablecoins before executing a cross-chain swap into 418 $ETH .
The stolen capital has officially entered privacy protocols, confirming institutional capital flight and rapid washing mechanisms. 📉 Smart money dynamics always demand strict risk parameters when fundamental protocols experience severe structural breaches. 💬 How do you evaluate security risk before placing capital into emerging project vaults? 👇
⚠️ Not financial advice. Always manage your risk. 🛡️
🏷️ #AVICI #DeFiSecurity #OnChainAnalysis #CryptoExploit
🚨 🛡️
On-chain tracking reveals a critical exploit within the $AVICI framework, draining approximately $1.02M in liquidity. 🔍 The malicious actor routed 10,000 $SOL through stablecoins before executing a cross-chain swap into 418 $ETH .
The stolen capital has officially entered privacy protocols, confirming institutional capital flight and rapid washing mechanisms. 📉 Smart money dynamics always demand strict risk parameters when fundamental protocols experience severe structural breaches. 💬 How do you evaluate security risk before placing capital into emerging project vaults? 👇
⚠️ Not financial advice. Always manage your risk. 🛡️
🏷️ #AVICI #DeFiSecurity #OnChainAnalysis #CryptoExploit
🚨 🛡️
See translation
Whale Accumulation Patterns Tell a Story Most Charts Miss
On-chain data reveals something price charts cannot: the difference between distribution and accumulation happening in silence.
When $BTC and $ETH spot prices consolidate in a range for weeks, casual observers call it "boring." But wallet cohort analysis during those same periods often shows a very different picture — addresses holding 100–1,000 BTC quietly increasing their balances, while exchange reserves drift lower. That divergence is structurally bullish.
The pattern repeats across cycles. Large holders do not accumulate when sentiment is euphoric — they accumulate when retail exits, when headlines turn negative, and when volatility compresses. By the time the crowd re-enters, the setup is already built.
$SOL shows similar dynamics at the ecosystem level. Developer commits, validator staking ratios, and protocol TVL growth often lead price by 60–90 days. These are the on-chain equivalents of insider accumulation.
What to watch:
• Exchange outflows sustained over 2–3 weeks
• UTXO age bands shifting toward longer-held coins
• Staking participation rising during price stagnation
• Wallet cohort growth at mid-tier address sizes
Noise and signal are always present simultaneously. The edge belongs to those who know which one to track.
#OnChainAnalysis #CryptoAccumulation #BitcoinWhales #SmartMoney #CryptoInsights
On-chain data reveals something price charts cannot: the difference between distribution and accumulation happening in silence.
When $BTC and $ETH spot prices consolidate in a range for weeks, casual observers call it "boring." But wallet cohort analysis during those same periods often shows a very different picture — addresses holding 100–1,000 BTC quietly increasing their balances, while exchange reserves drift lower. That divergence is structurally bullish.
The pattern repeats across cycles. Large holders do not accumulate when sentiment is euphoric — they accumulate when retail exits, when headlines turn negative, and when volatility compresses. By the time the crowd re-enters, the setup is already built.
$SOL shows similar dynamics at the ecosystem level. Developer commits, validator staking ratios, and protocol TVL growth often lead price by 60–90 days. These are the on-chain equivalents of insider accumulation.
What to watch:
• Exchange outflows sustained over 2–3 weeks
• UTXO age bands shifting toward longer-held coins
• Staking participation rising during price stagnation
• Wallet cohort growth at mid-tier address sizes
Noise and signal are always present simultaneously. The edge belongs to those who know which one to track.
#OnChainAnalysis #CryptoAccumulation #BitcoinWhales #SmartMoney #CryptoInsights

See translation
Why Onchain Volume Can Lie to You
A token can show millions of dollars in daily trading volume and still have surprisingly little genuine demand.
That is why volume alone can be misleading.
Onchain activity can be inflated by:
✓ Wash trading
✓ Bots repeatedly moving assets
✓ Incentive farmers cycling capital
✓ The same capital moving between wallets
✓ Liquidity being recycled across protocols
The blockchain tells you what happened.
It does not automatically tell you why it happened.
And that difference matters.
A real example makes this clearer.
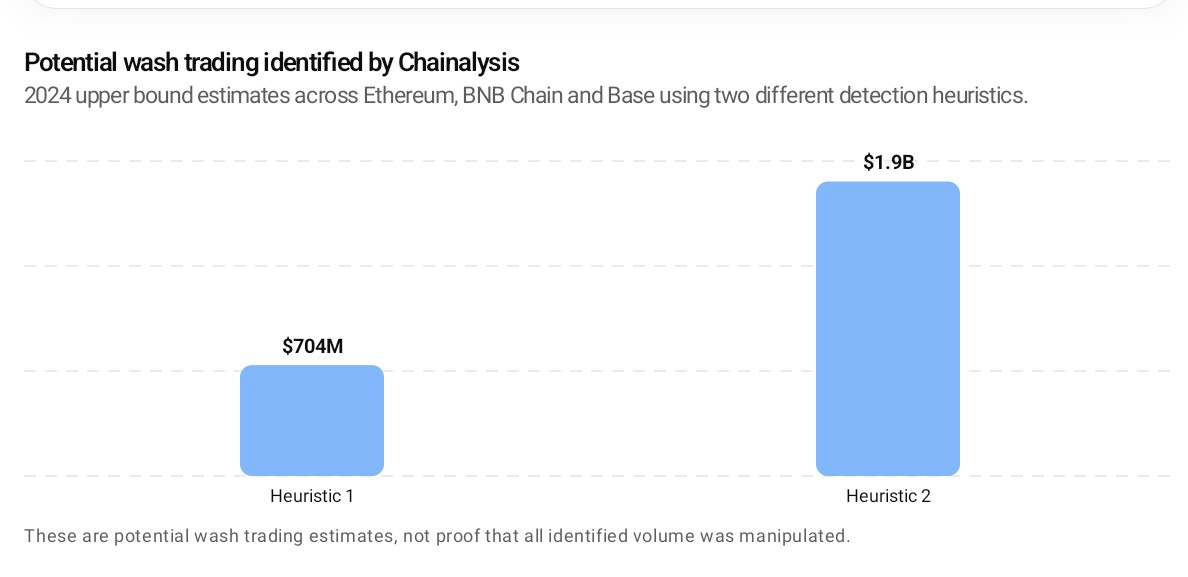
Chainalysis analyzed potential wash trading across Ethereum, BNB Chain and Base in 2024.
Their analysis identified:
✓ ~$704M in potential wash trading using one detection method
✓ ~$1.87B using another method
✓ ~$2.57B combined as an upper bound, because some activity may overlap
The lesson is not that every dollar of volume is fake.
The lesson is that volume needs context.
So instead of asking:
“How much volume does this token have?”
Ask:
✓ How many unique wallets are generating it?
✓ How much capital is actually staying?
✓ Is liquidity growing organically?
✓ Do users return after incentives disappear?
✓ Is protocol revenue growing alongside activity?
Volume is a signal.
It is not proof of adoption.
The real edge in onchain analysis is not finding the biggest number on a dashboard.
It is understanding what is happening behind that number.
Which onchain metric do you trust more than volume when measuring real demand?
#Crypto #OnChainAnalysis $NVDA.US
A token can show millions of dollars in daily trading volume and still have surprisingly little genuine demand.
That is why volume alone can be misleading.
Onchain activity can be inflated by:
✓ Wash trading
✓ Bots repeatedly moving assets
✓ Incentive farmers cycling capital
✓ The same capital moving between wallets
✓ Liquidity being recycled across protocols
The blockchain tells you what happened.
It does not automatically tell you why it happened.
And that difference matters.
A real example makes this clearer.
Chainalysis analyzed potential wash trading across Ethereum, BNB Chain and Base in 2024.
Their analysis identified:
✓ ~$704M in potential wash trading using one detection method
✓ ~$1.87B using another method
✓ ~$2.57B combined as an upper bound, because some activity may overlap
The lesson is not that every dollar of volume is fake.
The lesson is that volume needs context.
So instead of asking:
“How much volume does this token have?”
Ask:
✓ How many unique wallets are generating it?
✓ How much capital is actually staying?
✓ Is liquidity growing organically?
✓ Do users return after incentives disappear?
✓ Is protocol revenue growing alongside activity?
Volume is a signal.
It is not proof of adoption.
The real edge in onchain analysis is not finding the biggest number on a dashboard.
It is understanding what is happening behind that number.
Which onchain metric do you trust more than volume when measuring real demand?
#Crypto #OnChainAnalysis $NVDA.US
NVDAUS+1.35%
See translation
On-Chain Behavior Never Lies — But Most People Misread It
Price is opinion. On-chain data is fact.
The problem is that most traders cherry-pick the on-chain signals that confirm what they already believe. A few principles cut through the noise:
📌 Exchange netflow tells you pressure, not direction. Large outflows reduce available supply — but if those coins move to OTC desks, not cold wallets, the signal flips.
📌 Long-term holder (LTH) behavior is the clearest cycle gauge. When LTHs begin distributing into strength, it is not a reason to sell immediately — it is a reason to tighten your plan. History shows distribution phases can last 6–12 months.
📌 MVRV Z-score extremes are reliable bookends. Near historical lows, risk is structurally low. Near historical peaks, position sizing — not conviction — should change.
📌 Miner behavior as a secondary signal. When miners hold rather than sell, they are expressing operational confidence. When sell pressure spikes, watch spot absorption carefully.
None of these signals work in isolation. The edge comes from layering them — corroborating, not confirming bias.
$BTC $ETH $SOL are transparent ledgers. The data is public. The discipline to read it honestly is the real differentiator.
#Bitcoin #OnChainAnalysis #CryptoTrading #MarketCycles #BinanceSquare
Price is opinion. On-chain data is fact.
The problem is that most traders cherry-pick the on-chain signals that confirm what they already believe. A few principles cut through the noise:
📌 Exchange netflow tells you pressure, not direction. Large outflows reduce available supply — but if those coins move to OTC desks, not cold wallets, the signal flips.
📌 Long-term holder (LTH) behavior is the clearest cycle gauge. When LTHs begin distributing into strength, it is not a reason to sell immediately — it is a reason to tighten your plan. History shows distribution phases can last 6–12 months.
📌 MVRV Z-score extremes are reliable bookends. Near historical lows, risk is structurally low. Near historical peaks, position sizing — not conviction — should change.
📌 Miner behavior as a secondary signal. When miners hold rather than sell, they are expressing operational confidence. When sell pressure spikes, watch spot absorption carefully.
None of these signals work in isolation. The edge comes from layering them — corroborating, not confirming bias.
$BTC $ETH $SOL are transparent ledgers. The data is public. The discipline to read it honestly is the real differentiator.
#Bitcoin #OnChainAnalysis #CryptoTrading #MarketCycles #BinanceSquare

On-Chain Analysis: Reading Holder Distribution and AI Infrastructure Potential 🔍in agent @Virtuals Protocol
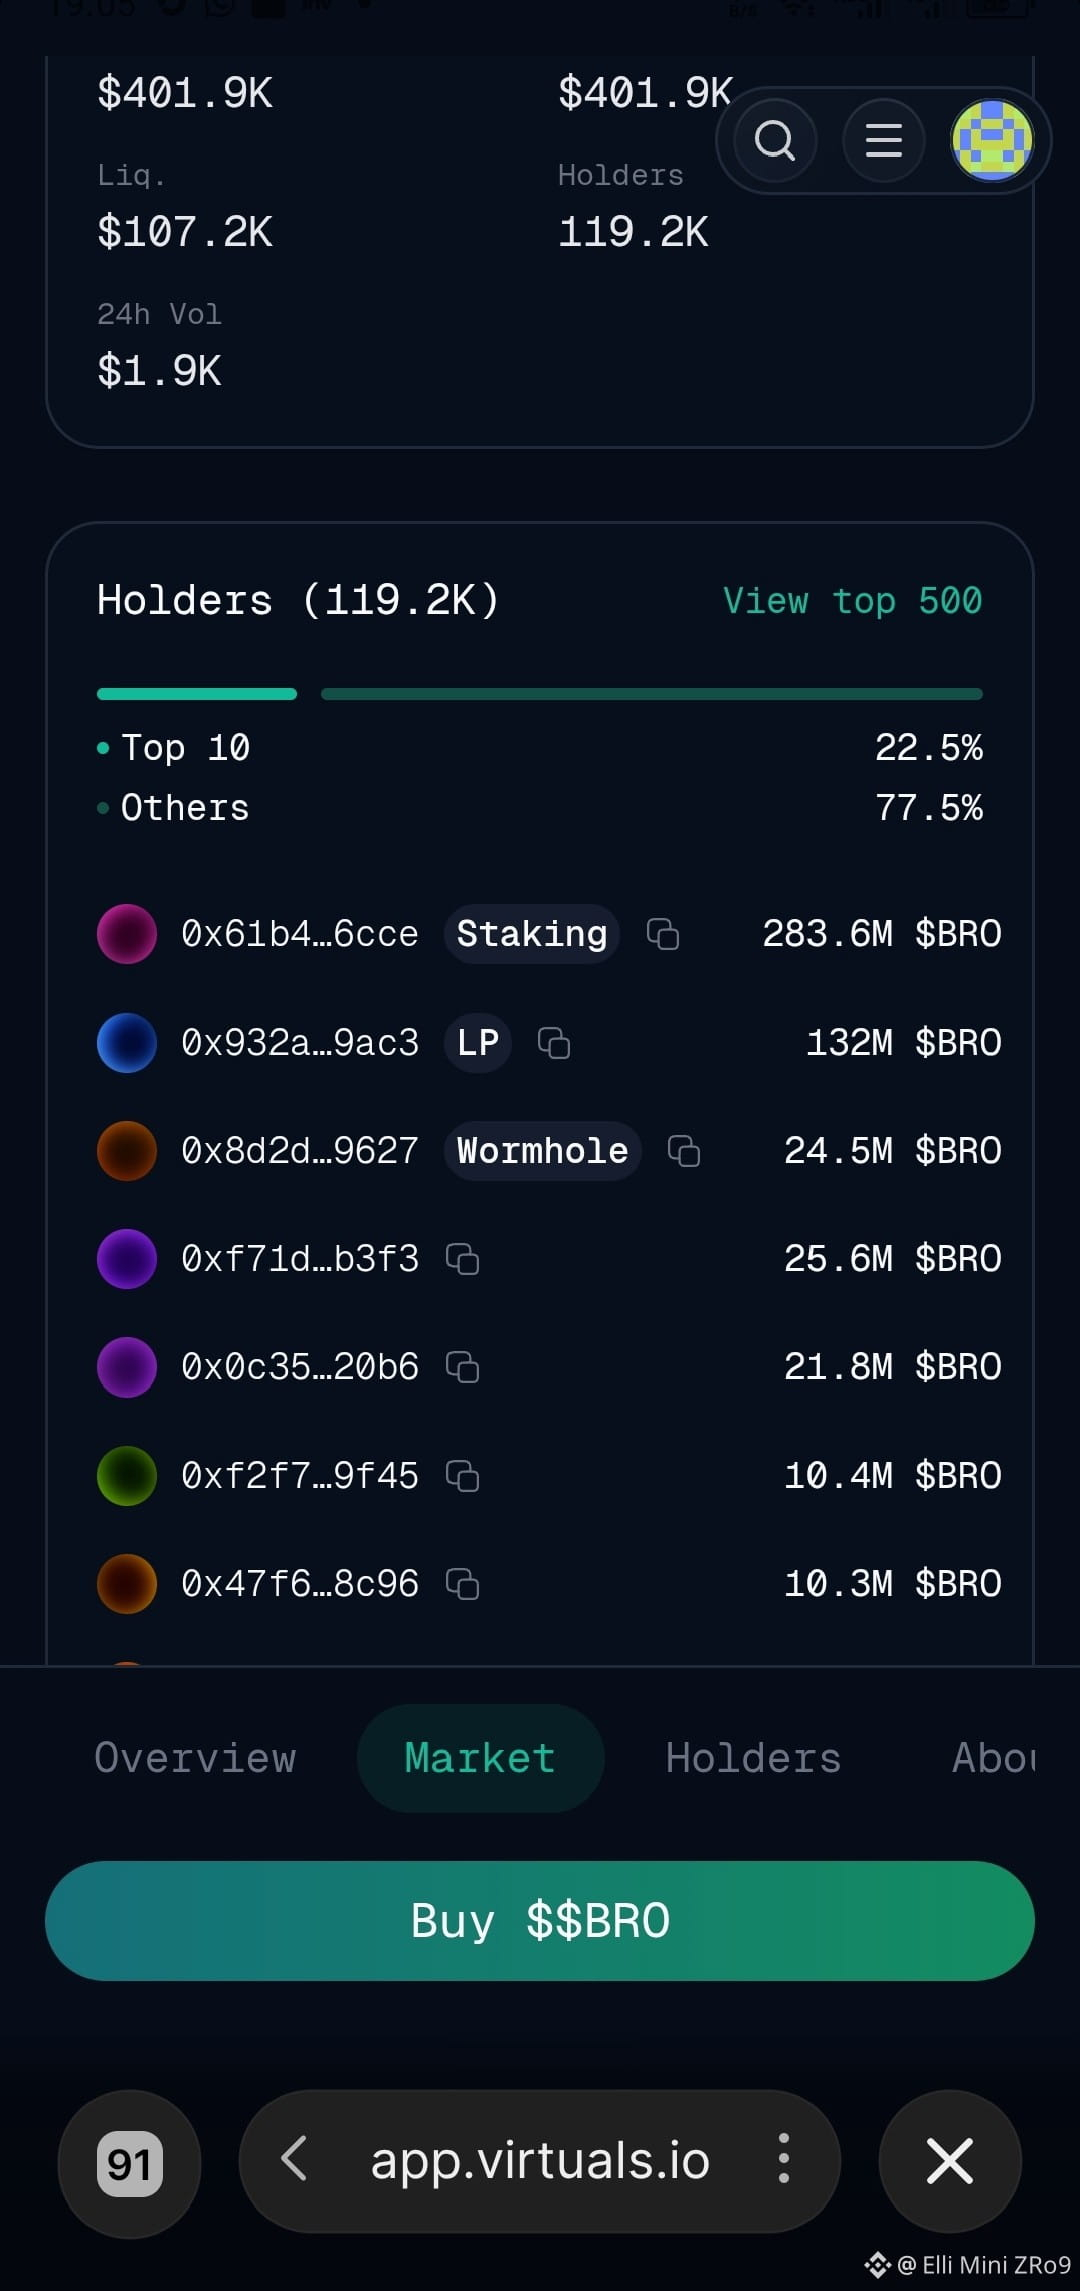
The AI sector within web3 continues to evolve, one of which is through an innovative project at $VIRTUAL . The image below shows transparency metrics of holders from one of the leading AI agents, Neurobro ($bro)
There are several important fundamental points we can break down from this data:
Mobile Accessibility: The supporting application for this ecosystem is user-friendly and designed to be available on Google Play Store and iOS, to reach hundreds of thousands of retail users.
Whale Tracking Feature (Whale Tracking): On-chain data transparently reveals the top wallets. This monitoring helps us detect whether there is accumulation or aggressive distribution among holders of the largest asset stakes.
Liquidity Health: Most of the top supply is locked within essential ecosystem functions such as Staking and Liquidity Pool (LP), reducing the risk of sudden selling pressure from internal parties.
Leveraging public transparency data like this is the key to minimizing the risk of getting trapped in market volatility driven by emotional whale movements.
Share your opinions in the comments section! ⚙️🌐DYOR
#Binance #Web3 #AI #WhaleTracking #OnChainAnalysis
The AI sector within web3 continues to evolve, one of which is through an innovative project at $VIRTUAL . The image below shows transparency metrics of holders from one of the leading AI agents, Neurobro ($bro)
There are several important fundamental points we can break down from this data:
Mobile Accessibility: The supporting application for this ecosystem is user-friendly and designed to be available on Google Play Store and iOS, to reach hundreds of thousands of retail users.
Whale Tracking Feature (Whale Tracking): On-chain data transparently reveals the top wallets. This monitoring helps us detect whether there is accumulation or aggressive distribution among holders of the largest asset stakes.
Liquidity Health: Most of the top supply is locked within essential ecosystem functions such as Staking and Liquidity Pool (LP), reducing the risk of sudden selling pressure from internal parties.
Leveraging public transparency data like this is the key to minimizing the risk of getting trapped in market volatility driven by emotional whale movements.
Share your opinions in the comments section! ⚙️🌐DYOR
#Binance #Web3 #AI #WhaleTracking #OnChainAnalysis
Log in to explore more content