

#huma
huma
4.9M views
14,182 Discussing
Hot
Latest


·
--
See translation
$HUMA
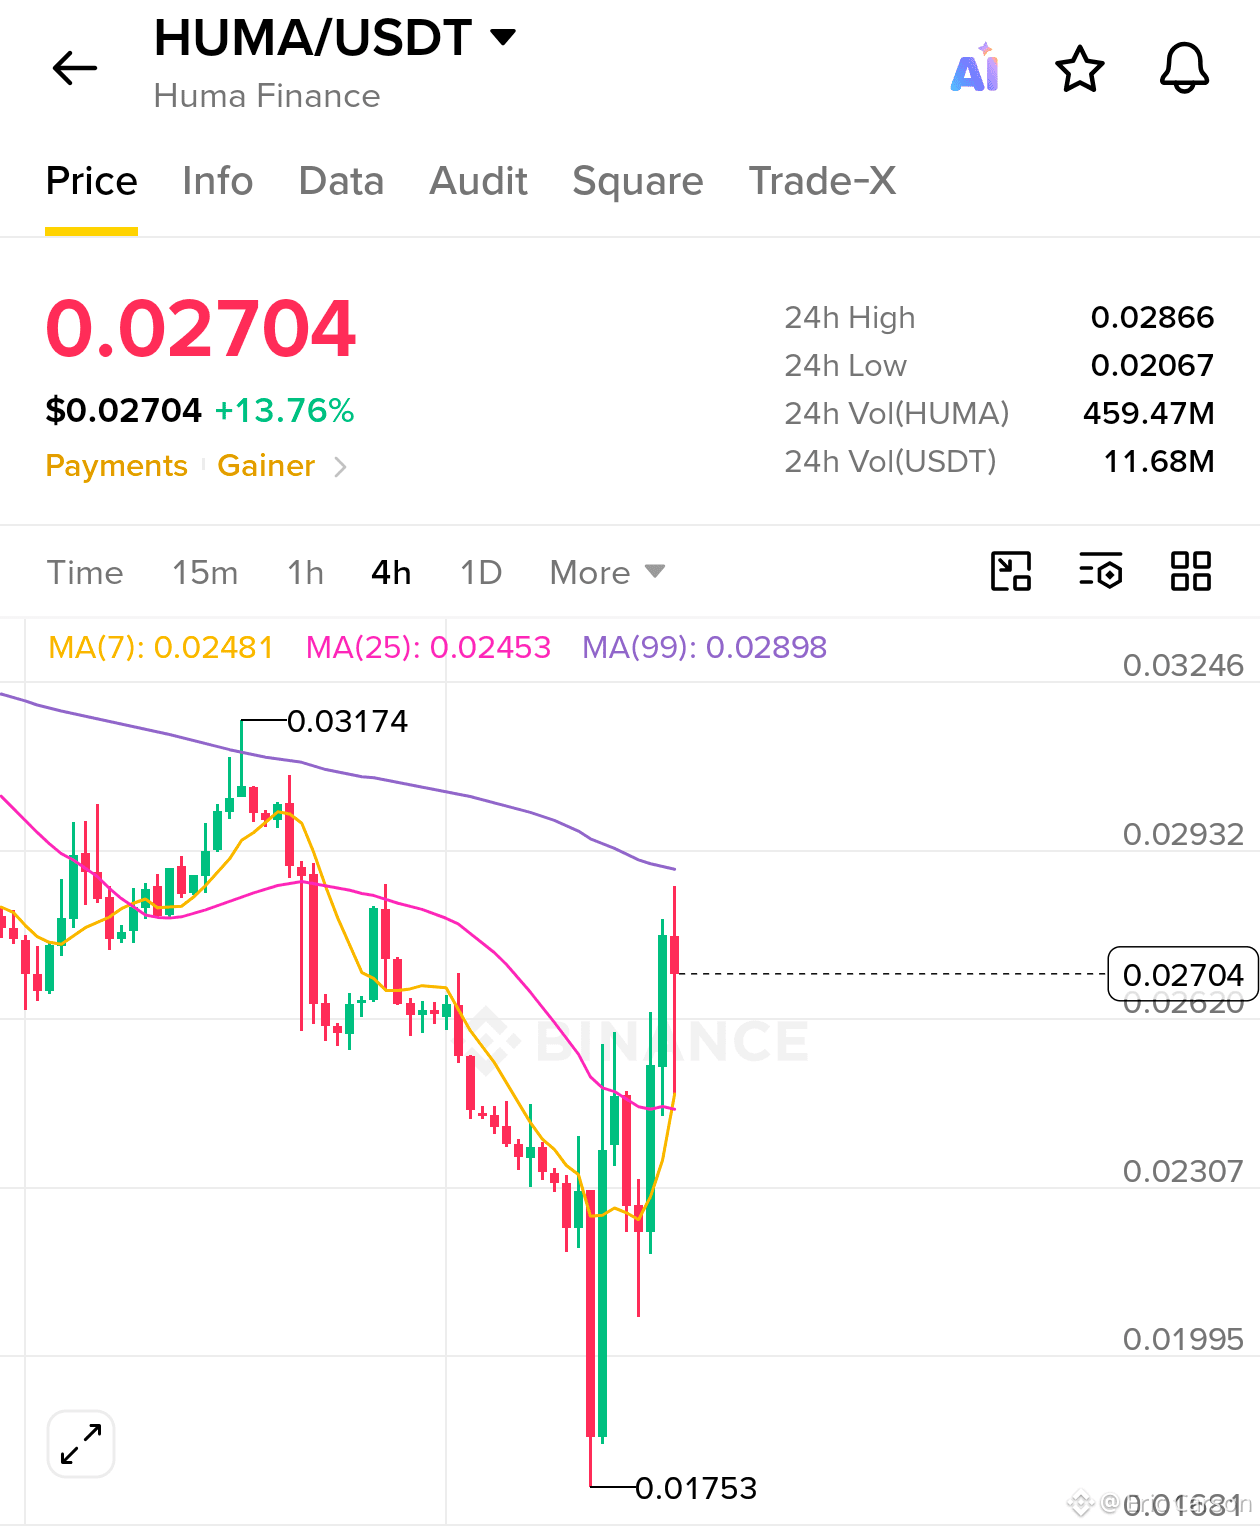
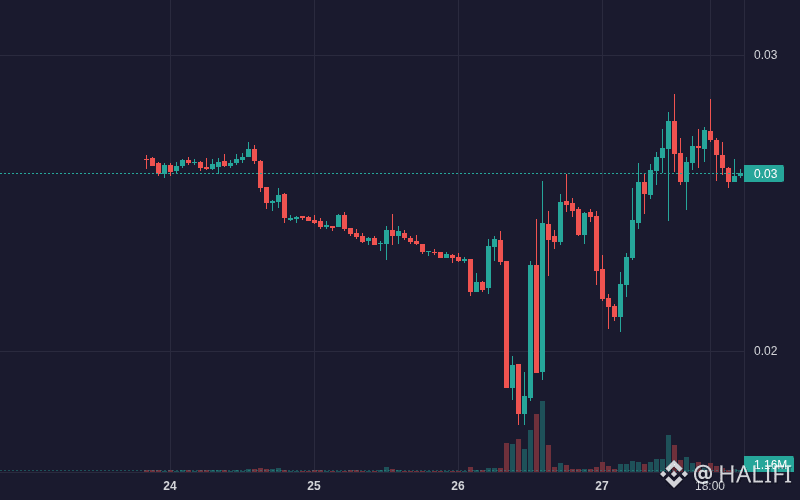
Aggressive V-shape recovery off the 0.0175 demand flush, slicing cleanly through short-term moving averages. Momentum is heavily favoring bulls on the 4H, but price is running straight into overhead supply at the MA(99) near 0.0290.
Expect brief consolidation around the local pivot before continuation. A shallow retracement into reclaimed support offers high-R:R positioning. Breakout risk sits at dynamic resistance; a clean 4H close above 0.0290 triggers rapid expansion toward the range highs.
Trade Setup:
• Entry Zone: 0.0248 - 0.0258 • TP1: 0.0288 • TP2: 0.0315 • TP3: 0.0345 • Stop-Loss: 0.0232
Manage risk accordingly and trail stops into strength.
#HUMA #WriteToEarnUpgrade
3
215

See translation
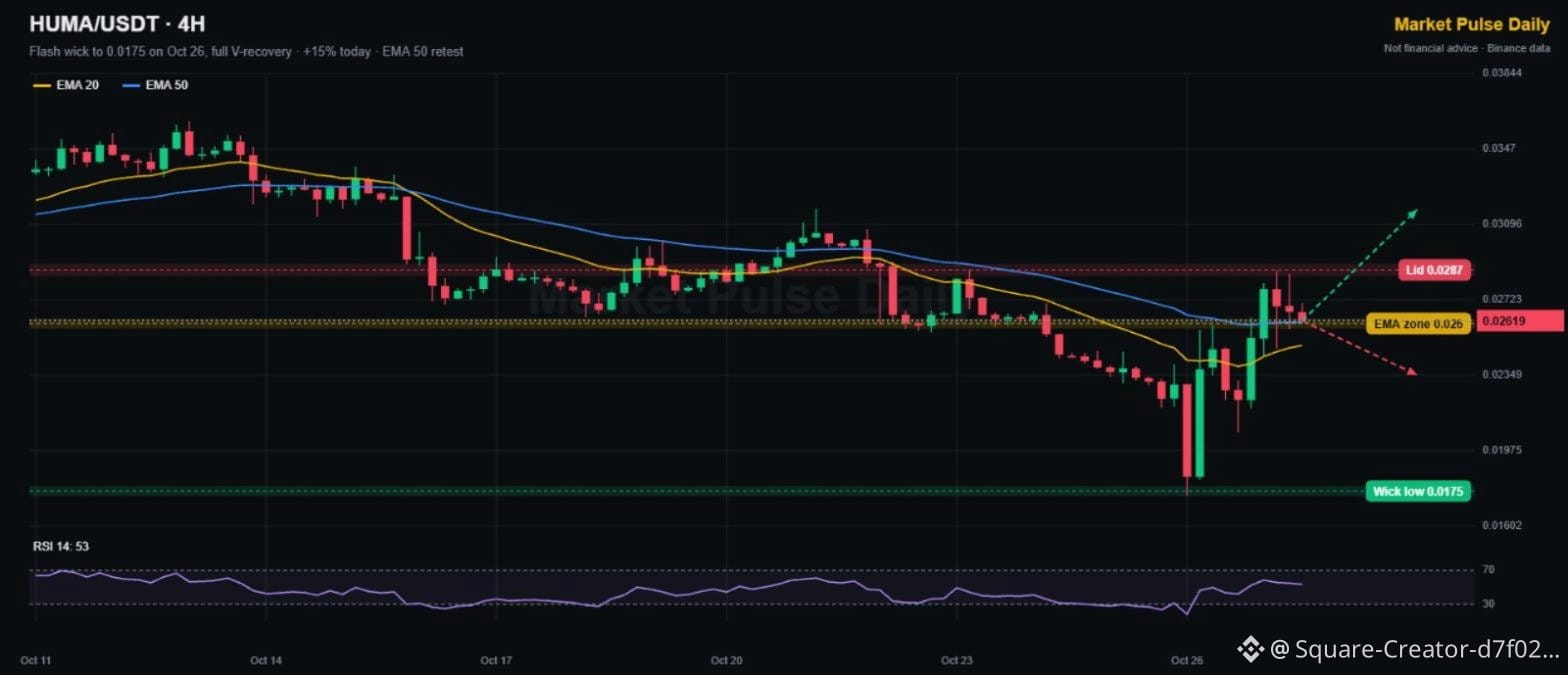
$HUMA flash-crashed to 0.0175 on Oct 26, then erased the whole drop. +15% today ⚡
The story (4H):
• One candle wicked from about 0.023 to 0.0175, a 25% plunge
• Buyers bought it instantly. Price is back at 0.0262
• Now sitting right on EMA 50 (0.0261), with EMA 20 (0.0250) turning up
• Lid: 0.0287, rejected twice today
• RSI 53
A V-shaped recovery from a liquidation wick often marks a local bottom. The test is whether the EMA 50 holds as support.
Levels for $HUMA :
🟢 Hold 0.026 + 4H close above 0.0287 → 0.031 (Oct 21 high)
🔴 Lose 0.026 → back to 0.0235
Wick lows like 0.0175 often get revisited later, so keep stops sensible.
Would you trade $HUMA after a wick like that? 👇
NFA
#HUMA #Altcoins #TechnicalAnalysis
No Binance account yet? Get 20% of your trading fees back 👉 [Sign up on Binance](https://www.binance.com/register?ref=TGCSTKKM)
$HUMA flash-crashed to 0.0175 on Oct 26, then erased the whole drop. +15% today ⚡
The story (4H):
• One candle wicked from about 0.023 to 0.0175, a 25% plunge
• Buyers bought it instantly. Price is back at 0.0262
• Now sitting right on EMA 50 (0.0261), with EMA 20 (0.0250) turning up
• Lid: 0.0287, rejected twice today
• RSI 53
A V-shaped recovery from a liquidation wick often marks a local bottom. The test is whether the EMA 50 holds as support.
Levels for $HUMA :
🟢 Hold 0.026 + 4H close above 0.0287 → 0.031 (Oct 21 high)
🔴 Lose 0.026 → back to 0.0235
Wick lows like 0.0175 often get revisited later, so keep stops sensible.
Would you trade $HUMA after a wick like that? 👇
NFA
#HUMA #Altcoins #TechnicalAnalysis
No Binance account yet? Get 20% of your trading fees back 👉 Sign up on Binance
93

See translation
$HUMA
Vote here fam! 🙏
FAM, WE NEED YOUR VOTE!
Fox夕 is nominated for Best Creator! This is our chance to win this together!
It only takes 10 seconds:
Click the image below
← Tap VOTE
Your 1 vote means everything! Let's bring this trophy home!
Please share this post and ask your friends to vote too!
@monkist @eggtartcake_grape 👉👉👉👉👉👉 *HERE VOTE*
$HUMA
Vote here fam! 🙏
FAM, WE NEED YOUR VOTE!
Fox夕 is nominated for Best Creator! This is our chance to win this together!
It only takes 10 seconds:
Click the image below
← Tap VOTE
Your 1 vote means everything! Let's bring this trophy home!
Please share this post and ask your friends to vote too!
@Fox夕 @Eggtartcake夕 👉👉👉👉👉👉 *HERE VOTE*

Fox夕
·
--
Hello fam 🙏🏿😊🙏🏿
It’s an honor to be nominated as a Best Longform Creator for the Blockchain 100 Awards 2026. Your ongoing support and presence mean the world to me. If you'd like to spare a moment to cast a vote, I would truly appreciate it, but your daily readership is already a reward in itself. VOTE HERE 👈🏼👈🏼
#FOMCWatch #blockchain100awards $SOL


Rec-77:
siap bun, dari pertama da vote, saya sdh vote cak fox
2
5
13

See translation
$HUMA: Entry Quality vs Chasing
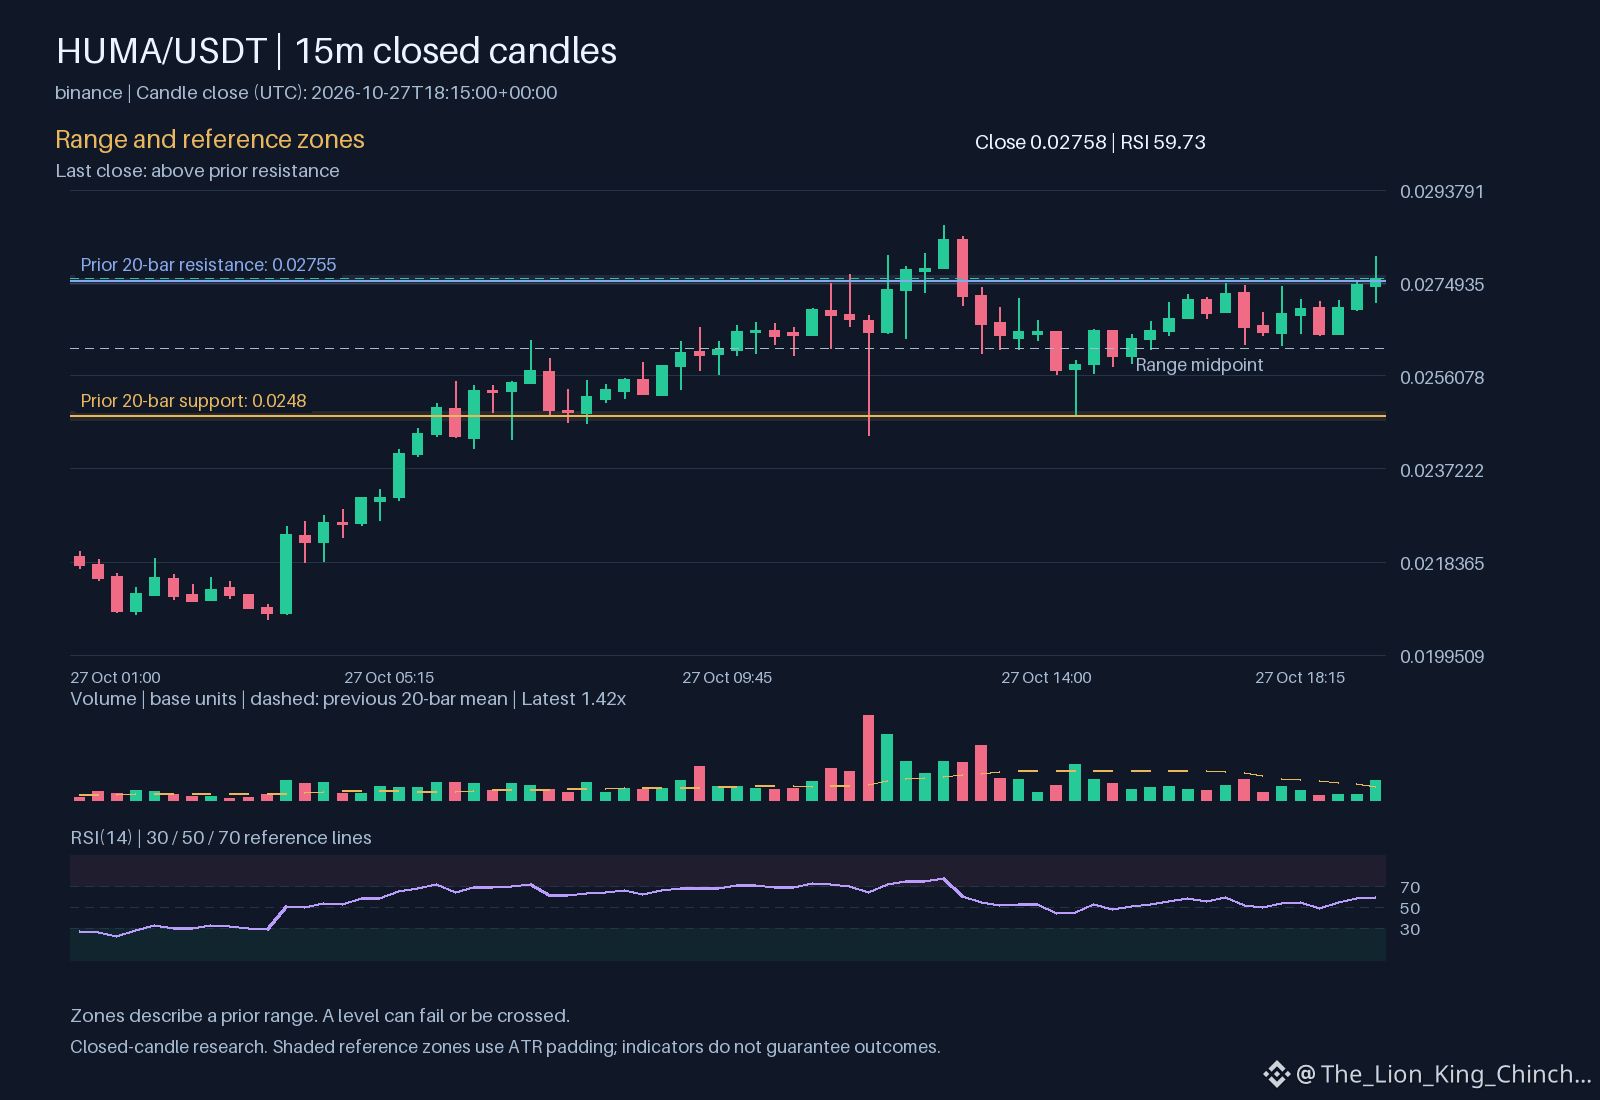
Watching $HUMA move above its resistance level feels exciting. The price is at 0.02758, and relative volume is 1.4234. This setup creates a tension between waiting for a clean pullback and acting on the immediate momentum. If buyers are strong, the price may keep rising without giving you a better entry point. This is the core trade-off: securing a good price or ensuring the trend is valid.
Consider a thought experiment. Imagine you enter immediately after the breakout. You secure a position, but the entry is near the top of the move. If the price pulls back to test the old resistance, your unrealized value drops. Alternatively, if you wait for a retest, you might miss the move entirely if the gap widens. The risk lies in assuming the volume at 1.20322e+07 sustains the new level. Volume above baseline supports the move, but it does not guarantee it will not reverse quickly. The RSI at 59.7327 indicates momentum, yet it does not tell you where the exact stop should be.
The practical decision depends on your tolerance for uncertainty. If you chase the price, you accept a narrower stop distance because the entry is high. If you wait, you accept the risk that the asset leaves the range. A concrete way to reassess this is to define your invalidation level before entering. If the price closes below the support at 0.0248, the breakout assumption fails. Without that clear boundary, you are guessing. The cost of waiting is missing the trade. The cost of chasing is a poor risk-reward ratio. Decide which risk worries you more. Do not mix the two. The structure is new, and the evidence is still forming. Focus on the quality of the signal, not just the direction.
Probabilistic market research, not a recommendation or guaranteed return.
Would you wait for clearer structure or reassess the risk first?
#HUMA #RiskManagement
$HUMA : Entry Quality vs Chasing
Watching $HUMA move above its resistance level feels exciting. The price is at 0.02758, and relative volume is 1.4234. This setup creates a tension between waiting for a clean pullback and acting on the immediate momentum. If buyers are strong, the price may keep rising without giving you a better entry point. This is the core trade-off: securing a good price or ensuring the trend is valid.
Consider a thought experiment. Imagine you enter immediately after the breakout. You secure a position, but the entry is near the top of the move. If the price pulls back to test the old resistance, your unrealized value drops. Alternatively, if you wait for a retest, you might miss the move entirely if the gap widens. The risk lies in assuming the volume at 1.20322e+07 sustains the new level. Volume above baseline supports the move, but it does not guarantee it will not reverse quickly. The RSI at 59.7327 indicates momentum, yet it does not tell you where the exact stop should be.
The practical decision depends on your tolerance for uncertainty. If you chase the price, you accept a narrower stop distance because the entry is high. If you wait, you accept the risk that the asset leaves the range. A concrete way to reassess this is to define your invalidation level before entering. If the price closes below the support at 0.0248, the breakout assumption fails. Without that clear boundary, you are guessing. The cost of waiting is missing the trade. The cost of chasing is a poor risk-reward ratio. Decide which risk worries you more. Do not mix the two. The structure is new, and the evidence is still forming. Focus on the quality of the signal, not just the direction.
Probabilistic market research, not a recommendation or guaranteed return.
Would you wait for clearer structure or reassess the risk first?
#HUMA #RiskManagement
205

See translation
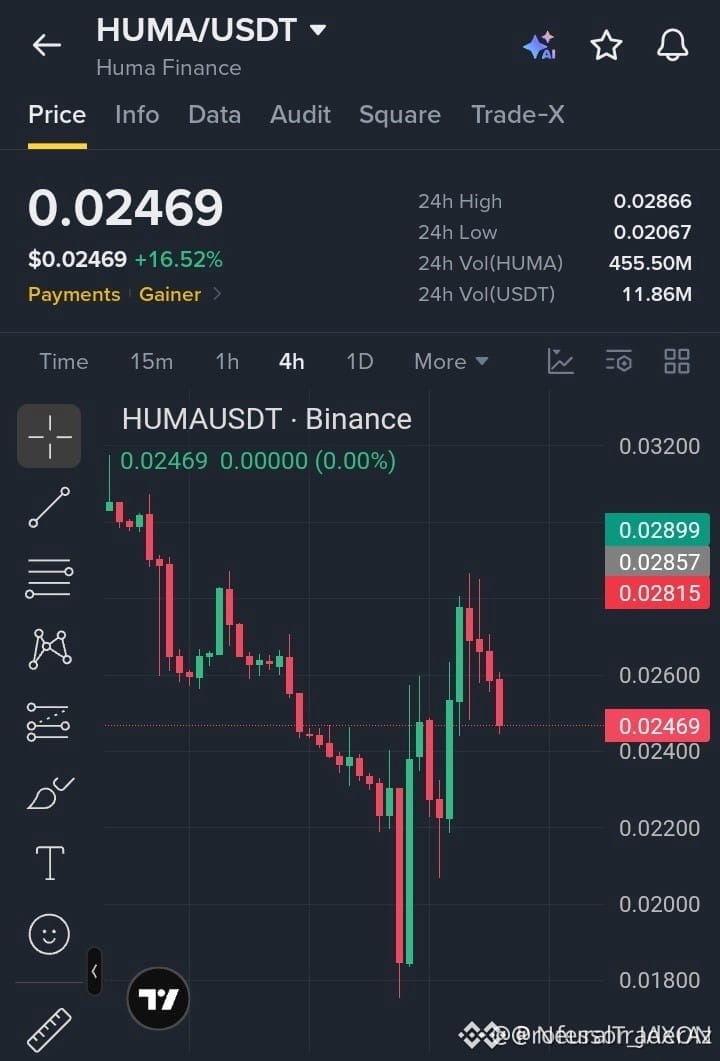
🚨 $HUMA SLIDES INTO BEARISH ZONE AS REBOUND FADES 🦈
Entry: 0.02470-0.02520 ⚡
Target: 0.02400 🎯
Target: 0.02300 🎯
Target: 0.02200 🎯
Stop Loss: 0.02620 ⚠️
📊 Smart money is draining liquidity around the 0.0250 cluster, turning the recent rally into a fleeting spark. The order block at 0.02520 has already shown absorption, and a break below 0.02400 would signal the next institutional sell‑off. 🦈
⚡ Volume on the 4H has contracted while the market structure flips bearish, confirming the pressure buildup. Expect the price to cascade toward the TP cluster, feeding the liquidity pool built near 0.02800. 📌
💬 Are you aligning your short entries with this liquidity sweep? 👇
⚠️ Not financial advice. Always manage your risk. 🛡️
🏷️ #HUMA #ShortSetup #LiquiditySweep #Crypto
🔥 💎
2

·
--
See translation
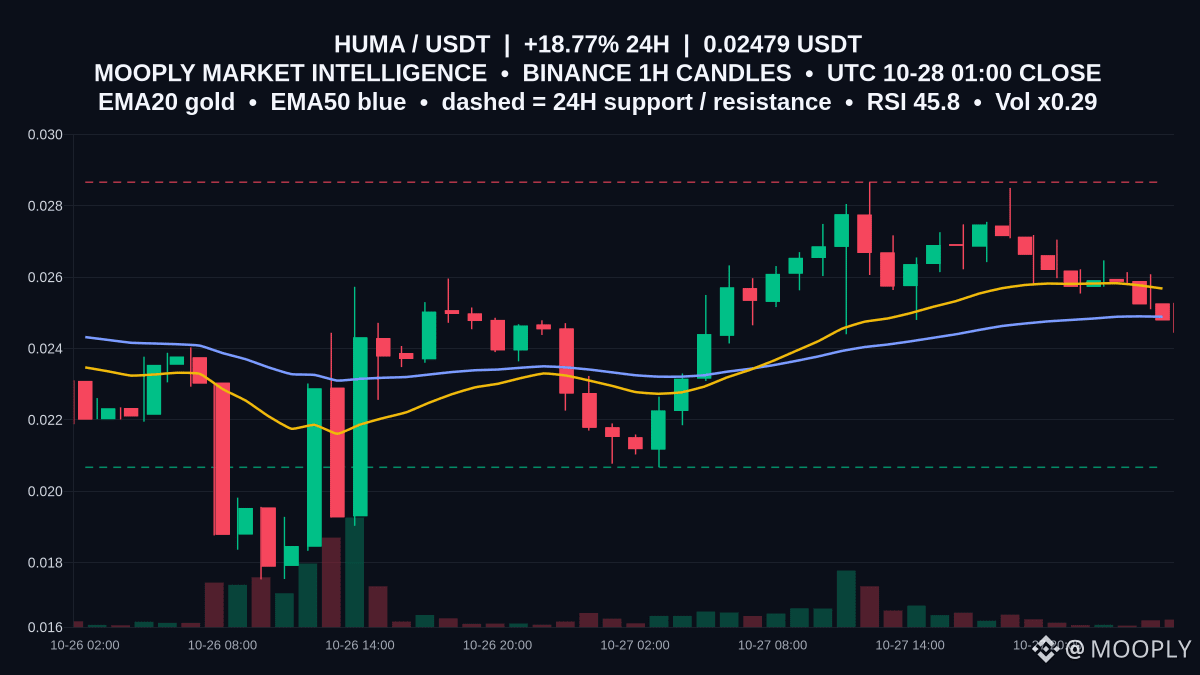
$HUMA 🔎 +18.77% in 24h; last price 0.02479 USDT, RSI 45.8, EMA20 0.02568, EMA50 0.02489; price sits between support 0.02067 and resistance 0.02866.
Price action shows 0.02479 USDT, trading below EMA20 (0.02568) and EMA50 (0.02489), with RSI 45.8. Volume remains light (volRatio 0.29) despite a +18.8% 24h move, keeping the pair drifting between support 0.02067 and resistance 0.02866.
Clear invalidation would be a daily close above 0.02866 or below 0.02067, which would shift the view beyond the current range.
Data: Binance 1H candles · Not financial advice.
#HUMA #TechnicalAnalysis #Crypto
45

See translation
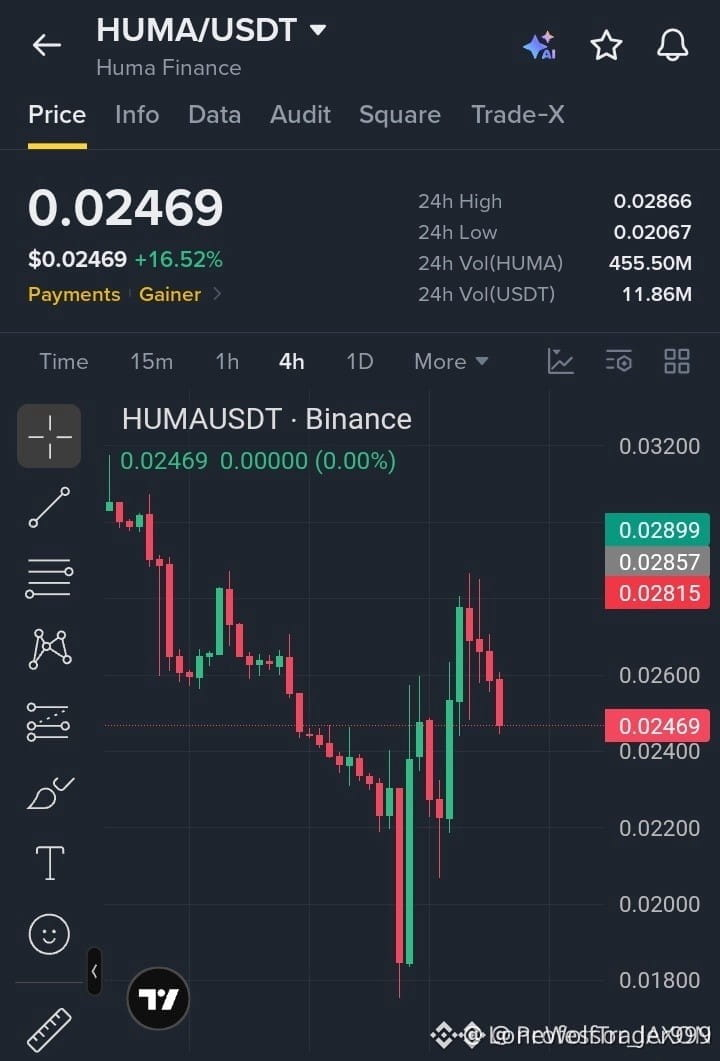
🚨 $HUMA SLIDES INTO BEARISH TRAP AS REBOUND FADES 🐻
Entry: 0.02470-0.02520 ⚡
Target: 0.02400, 0.02300, 0.02200 🚀
Stop Loss: 0.02620 ⚠️
📊 After the sharp bounce off 0.01800, sellers reclaimed the floor near 0.02800, flipping the momentum. The price now tests the 0.02470‑0.02520 band, a classic short‑entry zone where smart money has been dumping liquidity. 🦈 Volume spikes on the 1H chart confirm aggressive sell pressure, and a break below 0.02400 would cascade toward the next support cluster.
💡 Keep an eye on the 0.02400 barrier – a clean break could open the path to 0.02200, while any bounce above 0.02520 would invalidate the bearish thesis. 💬 How are you positioning for the next wave of downside? 👇
⚠️ Not financial advice. Always manage your risk. 🛡️
🏷️ #HUMA #ShortSetup #Bearish #Crypto
🐻 🔥
2

See translation
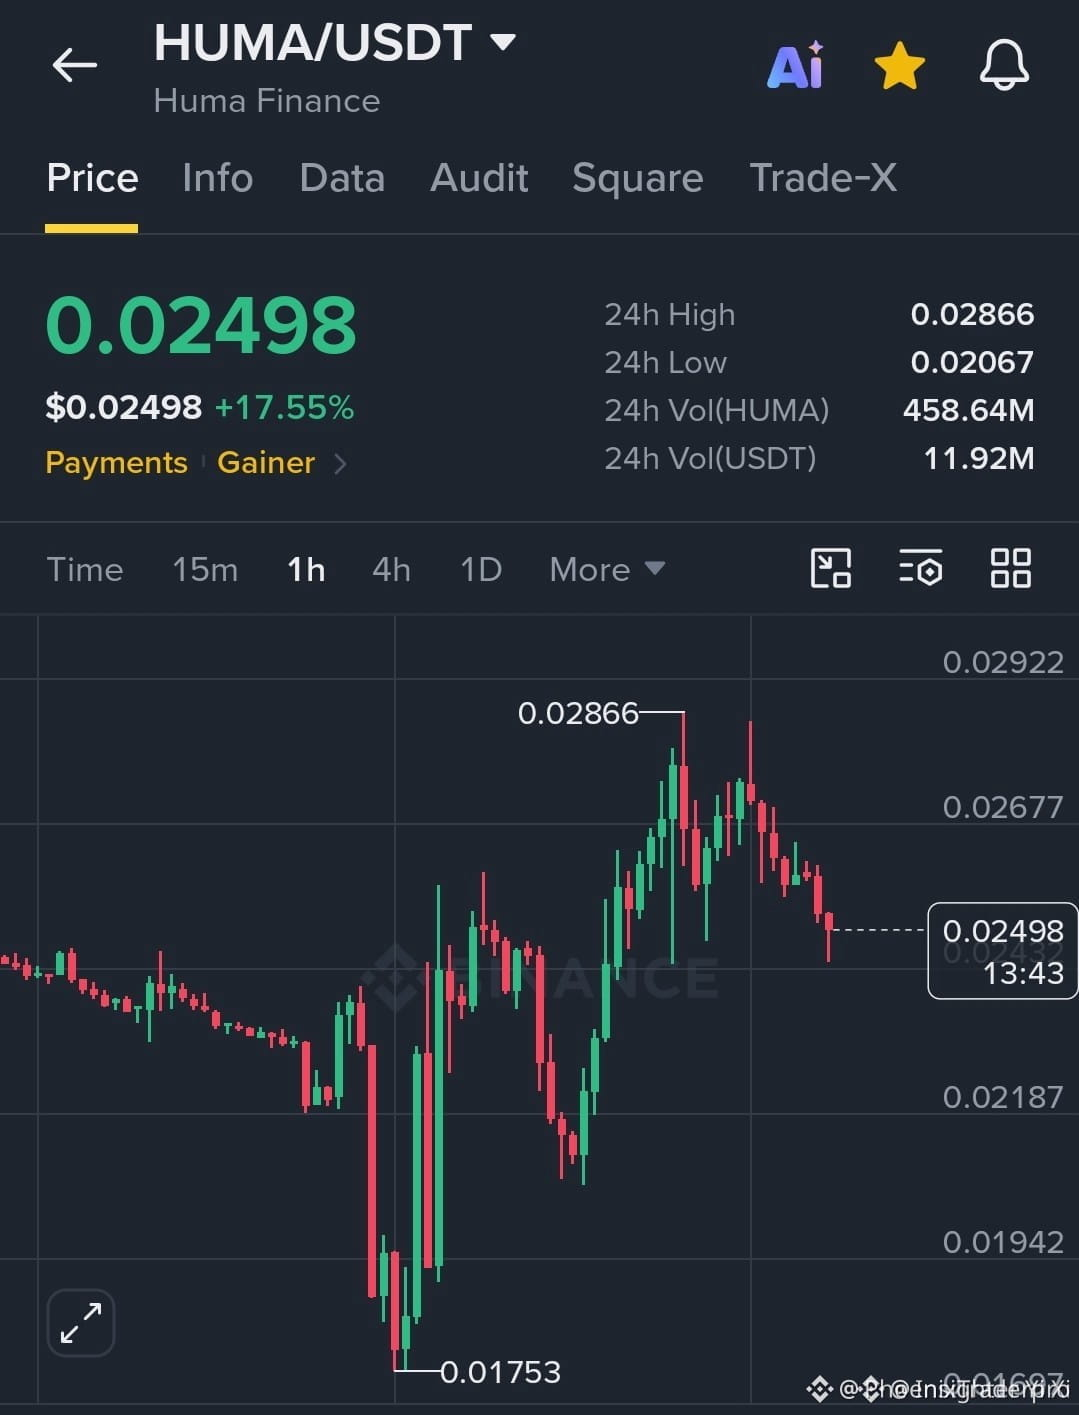
🚀 $HUMA RISING ON MOMENTUM SURGE – WILL IT BREAK $0.02866?
Entry: 0.0240-0.0250 ⚡
Target: 0.02677 / 0.02866 🚀
Stop Loss: 0.0230 ⚠️
Momentum is stacking on $HUMA as it rides a 17.5% surge, punching through the $0.0249 zone. 📊 Buyers are anchoring near the $0.0250 sweet spot, and every uptick feeds the next wave. 🦈
The next resistance walls sit at $0.02677 and $0.02866 – classic liquidity buckets that smart money loves to test. A clean pull‑back to $0.0240‑$0.0250 could set up a low‑risk entry before the next breakout. ⚡
💬 Are you ready to ride the wave or waiting for the pullback? 👇
⚠️ Not financial advice. Always manage your risk. 🛡️
🏷️ #HUMA #LongSetup #Momentum #Crypto
🔥 💎
4

See translation
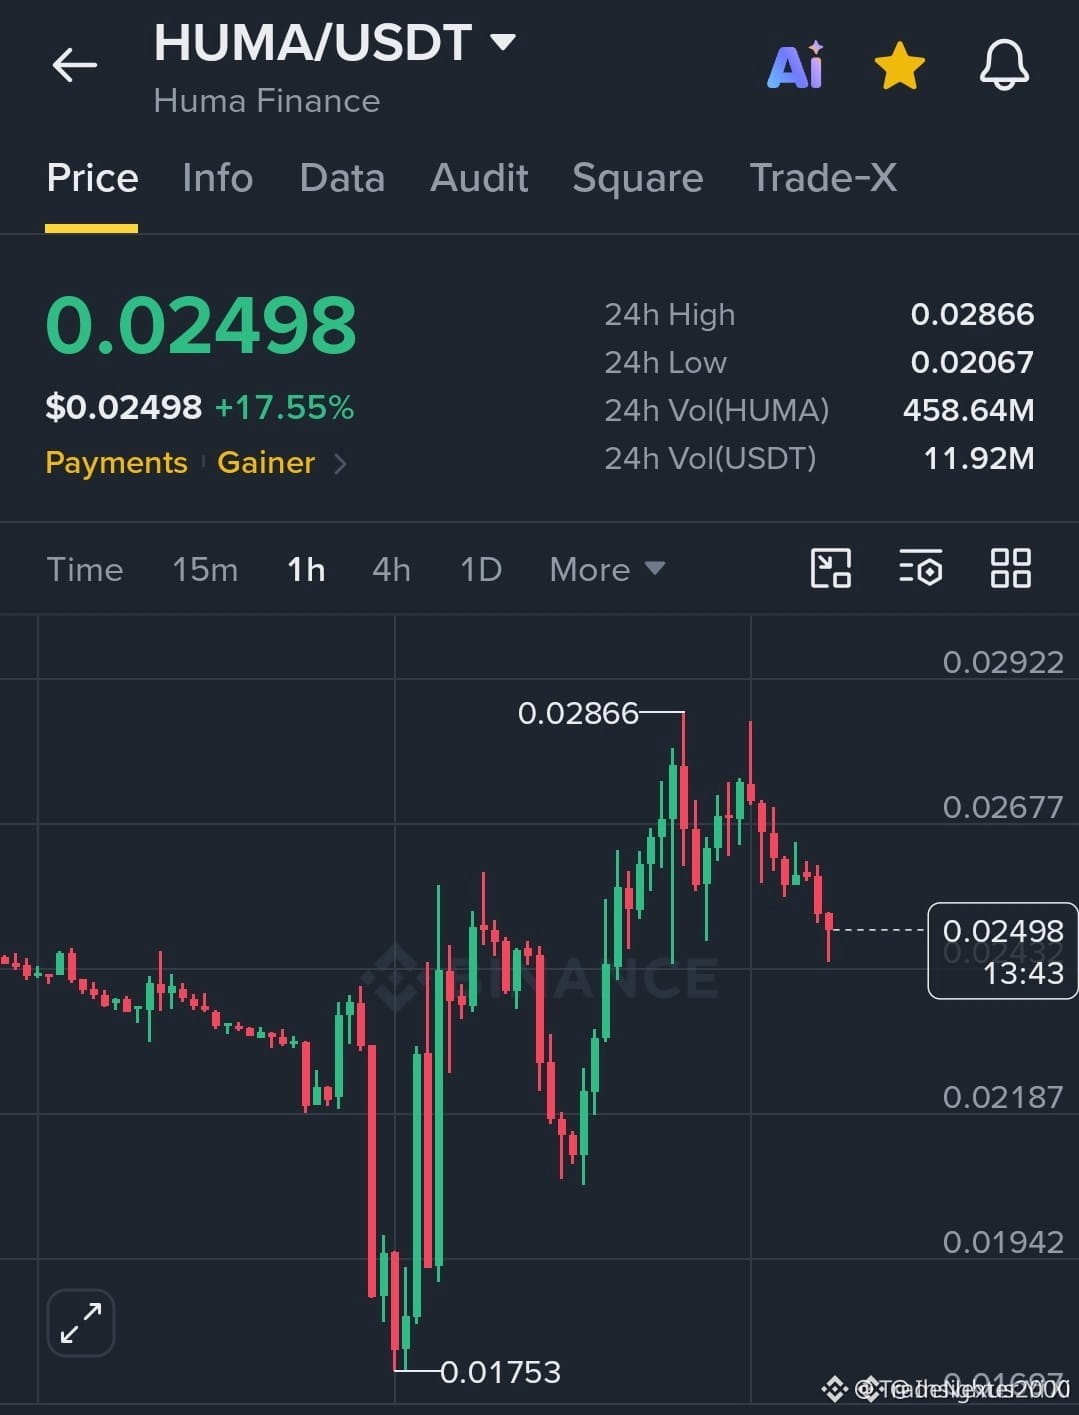
🚀 $HUMA CHARGING TOWARD LIQUIDITY ZONE – WATCH THE PULLBACK 🦈
Entry: 0.0240-0.0250 ⚡
Target: 0.02677 / 0.02866 🚀
Stop Loss: 0.0230 ⚠️
Smart money has been feeding the $HUMA demand zone around $0.0240‑$0.0250, and volume spikes 📊 confirm a genuine accumulation phase.
Resistance clusters at $0.02677 and $0.02866 act as liquidity traps; a clean pull‑back hold below $0.0250 would signal the next institutional push ⚡. Keep an eye on the order‑block retest 📌 as the catalyst for a higher‑timeframe breakout 🌊.
💬 Are you ready to ride the next liquidity sweep or waiting for a tighter entry? 👇
⚠️ Not financial advice. Always manage your risk. 🛡️
🏷️ #HUMA #LongSetup #Liquidity #Crypto
🔥 💎
2

·
--
Bullish
See translation
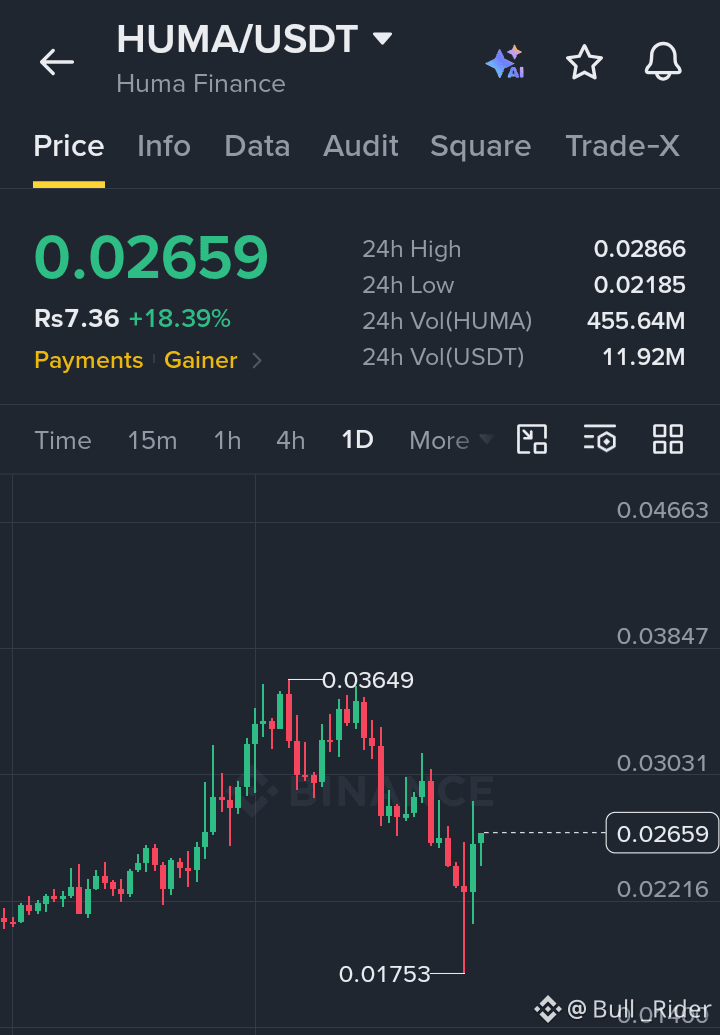
$HUMA is showing strength after bouncing from support, with buyers stepping in and momentum building for a potential continuation move. Price is recovering toward resistance, so watch for a breakout confirmation before entering.
Entry: 0.02659
TP1: 0.02800
TP2: 0.03030
TP3: 0.03400
SL: 0.02450
Buy and Trade $AGT
{alpha}(560x5dbde81fce337ff4bcaaee4ca3466c00aecae274)
#HUMA $AIN
{alpha}(560x9558a9254890b2a8b057a789f413631b9084f4a3)
{future}(HUMAUSDT)
$HUMA is showing strength after bouncing from support, with buyers stepping in and momentum building for a potential continuation move. Price is recovering toward resistance, so watch for a breakout confirmation before entering.
Entry: 0.02659
TP1: 0.02800
TP2: 0.03030
TP3: 0.03400
SL: 0.02450
Buy and Trade $AGT
#HUMA $AIN
Entry: 0.02659
TP1: 0.02800
TP2: 0.03030
TP3: 0.03400
SL: 0.02450
Buy and Trade $AGT
#HUMA $AIN
1
10
See translation
Comparing Activity Levels for $HUMA and Peers
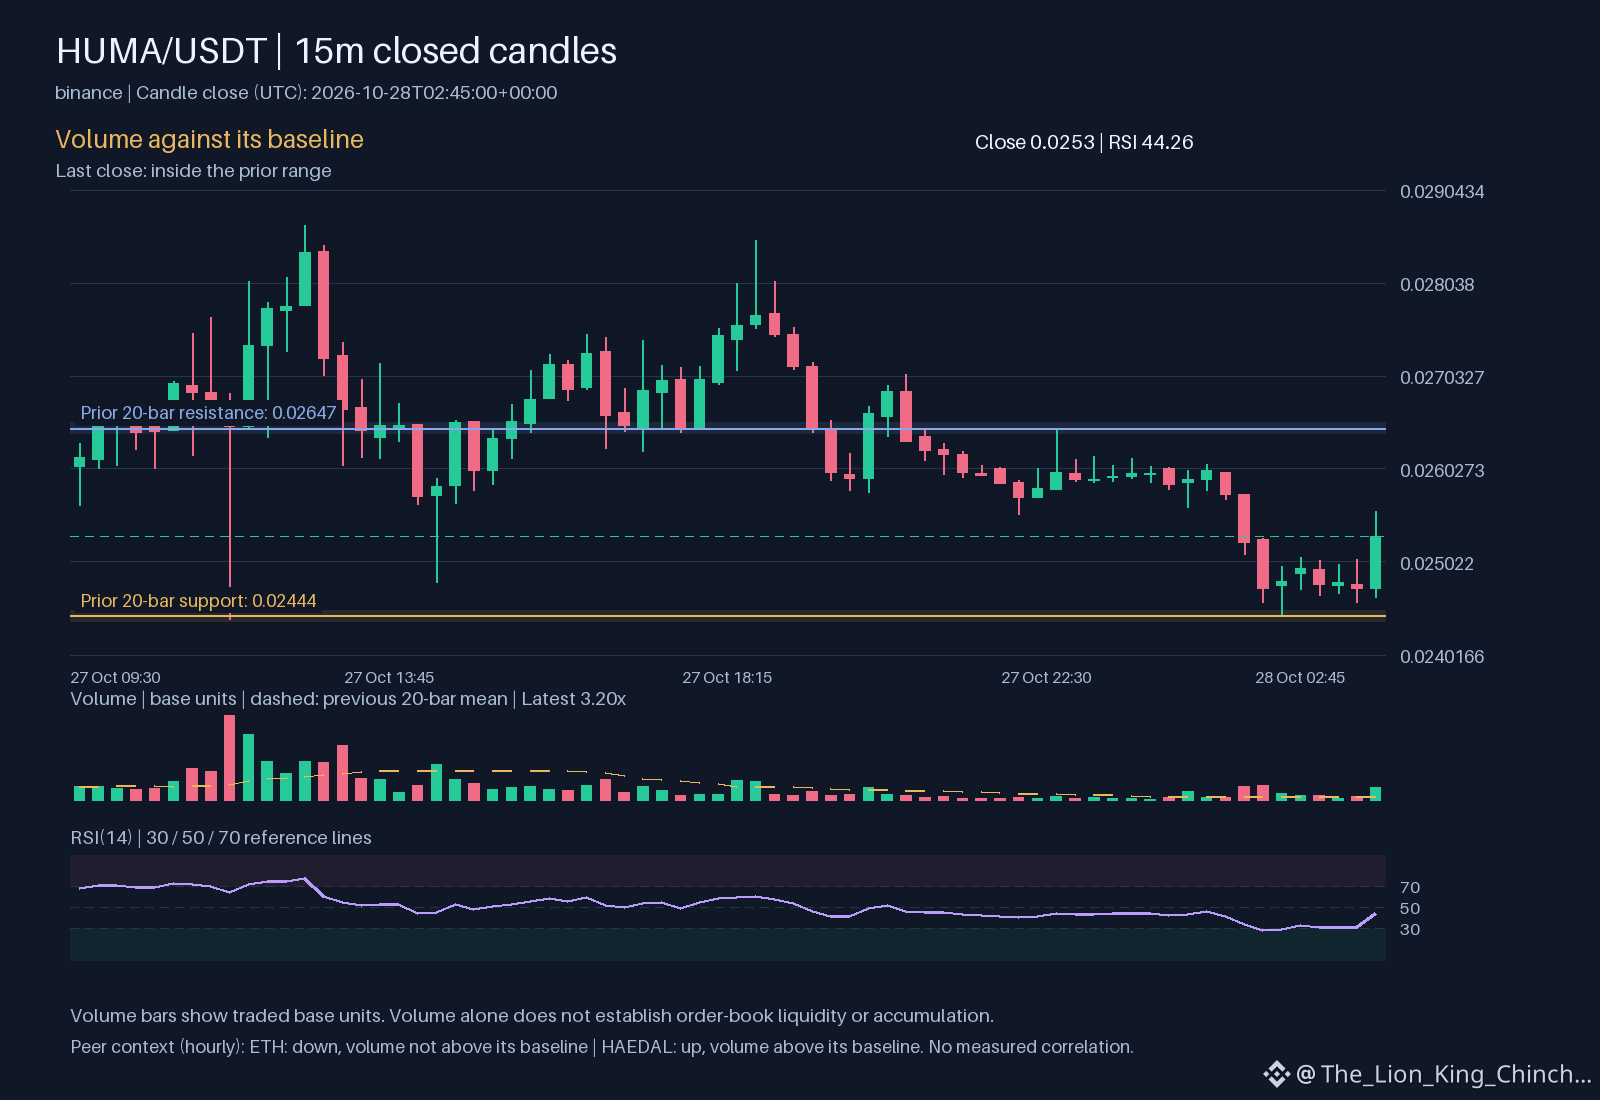
The primary question for $HUMA involves its current hourly direction and high activity. While the price at 0.0253 stays inside its recorded range, the hourly direction is up. The volume sits above the baseline, shown by a relative volume of 3.19862. This suggests that more participants are active right now than usual. However, looking at the daily change of 18.9469 and the seven-day change of -15.1899 provides a wider view of how the asset behaves over time.
Adding peer observations helps clarify the environment. While $HUMA moves up on high volume, ETH moves down with volume not above its baseline. Meanwhile, HAEDAL moves up with volume above its baseline. These differences on the same venue show that market activity is not uniform. The mechanism of relative volume compares current trade counts to a historical average. When volume spikes, it often means a temporary increase in liquidity, but it does not guarantee the move will last.
This comparison cannot establish a common cause or capital rotation. A shared direction between $HUMA and HAEDAL is an observation, not a measured correlation. One way to reassess this interpretation is to check if the RSI of 44.2642 moves into extreme territory or if the price reaches the resistance at 0.02647. Watching how the hourly move holds against the daily trend helps separate noise from a meaningful shift in sentiment. 📈
Probabilistic market research, not a recommendation or guaranteed return.
The comparison to keep in mind: $ETH has hourly direction down and volume not above its baseline; $HAEDAL has hourly direction up and volume above its baseline. This alone does not establish correlation.
Which matters more in this comparison: direction or how the move holds?
#HUMA #ETH
132

See translation
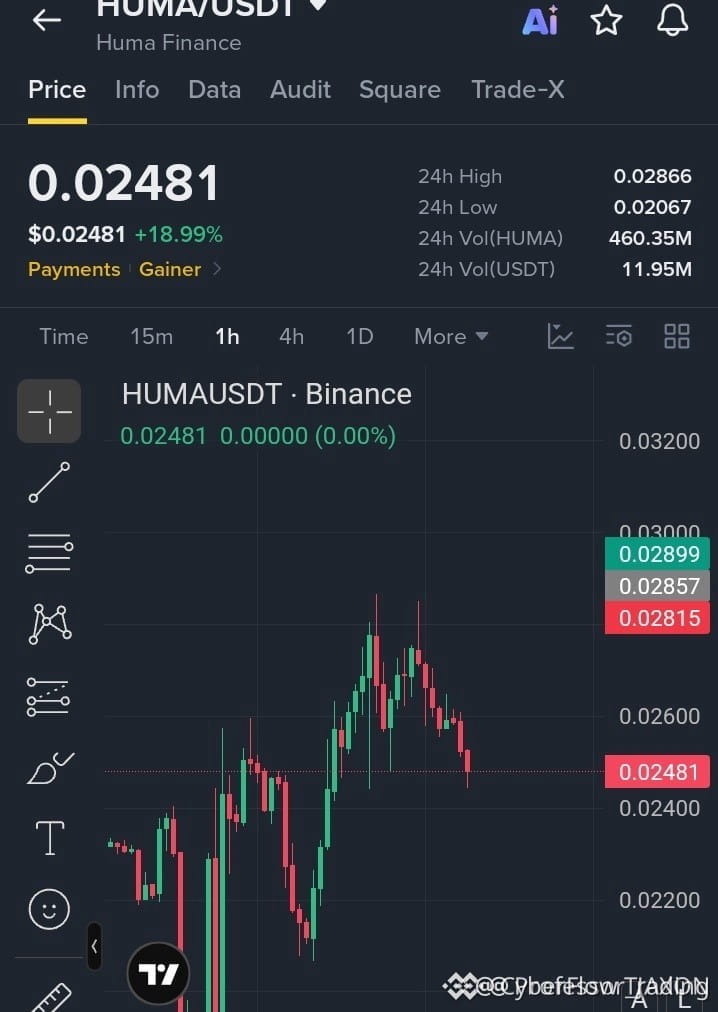
🚨 $HUMA BEARS THE DRAG ON THE DESCENT! 🔴
Entry: 0.02480-0.02520 ⚡
Target: 0.02400 🚀
Target: 0.02300 🎯
Target: 0.02200 💥
Stop Loss: 0.02610 ⚠️
📊 The price is slipping off the 0.02800 ceiling, and a string of bearish candles is draining the last bits of buying vigor. Once the 0.02400 barrier cracks, liquidity hunters will likely push the market deeper into the 0.02200 basin, feeding the short wave. 🦈 Keep an eye on volume spikes as they confirm the sellers’ dominance. 💡 A clean break below 0.02400 could ignite a rapid cascade toward the next support cluster.
💬 Are you ready to ride the downside or waiting for the next liquidity sweep to confirm? 👇
⚠️ Not financial advice. Always manage your risk. 🛡️
🏷️ #HUMA #ShortSetup #BearishMomentum #Crypto
🔥 💎

·
--
See translation
An 18.71% daily gain on $HUMA hides a cooling 0.47x volume ratio.
Momentum is visible at $0.02481, but the latest hourly candle dropped 2.51% as volume slowed.
If buyers reclaim the $0.02866 high, continuation toward higher liquidity becomes a constructive scenario to monitor. Conversely, a drop below the $0.02067 low would invalidate the immediate bullish setup and signal deeper consolidation.
Will the $0.02866 high break first, or will volume fade enough to test the $0.02067 low?
Tap $HUMA for the live chart. #HUMA #BinanceSquare
47
See translation
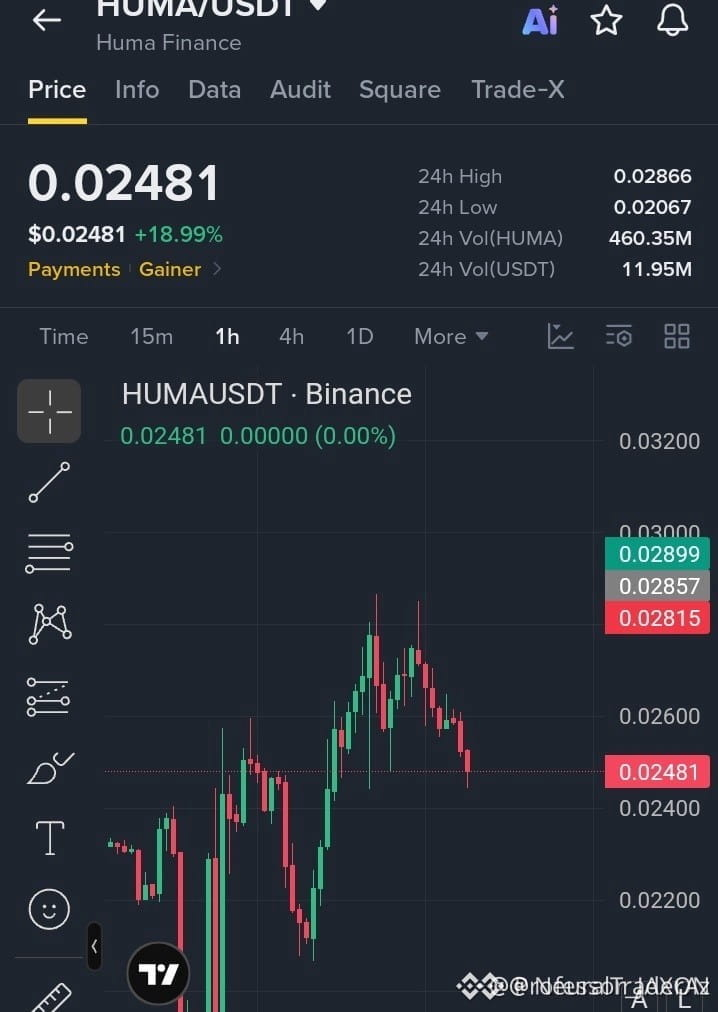
🔴 $HUMA SLIDES DEEPER AS SELLING PRESSURE RISES 🚨
Entry: 0.02480‑0.02520 ⚡
Target: 0.02400 🚀
Target: 0.02300 🚀
Target: 0.02200 🚀
Stop Loss: 0.02610 ⚠️
📊 The pair retreated from the 0.02800 resistance, and a string of bearish candles has eroded bullish momentum. Smart money is sweeping the 0.02400 order block, exposing fresh liquidity for the short side. 🌊 A decisive break below 0.02400 could trigger a cascade toward the lower targets, with volume confirming the shift.
💡 Entry sits in a tight zone where sellers dominate, offering a clean risk‑to‑reward profile. 📌 Keep an eye on the 0.02400 trigger before committing. 💬 How are you positioning for the next liquidity dump? 👇
⚠️ Not financial advice. Always manage your risk. 🛡️
🏷️ #HUMA #ShortSetup #LiquiditySweep #Crypto
🦈 ⚡
14

See translation
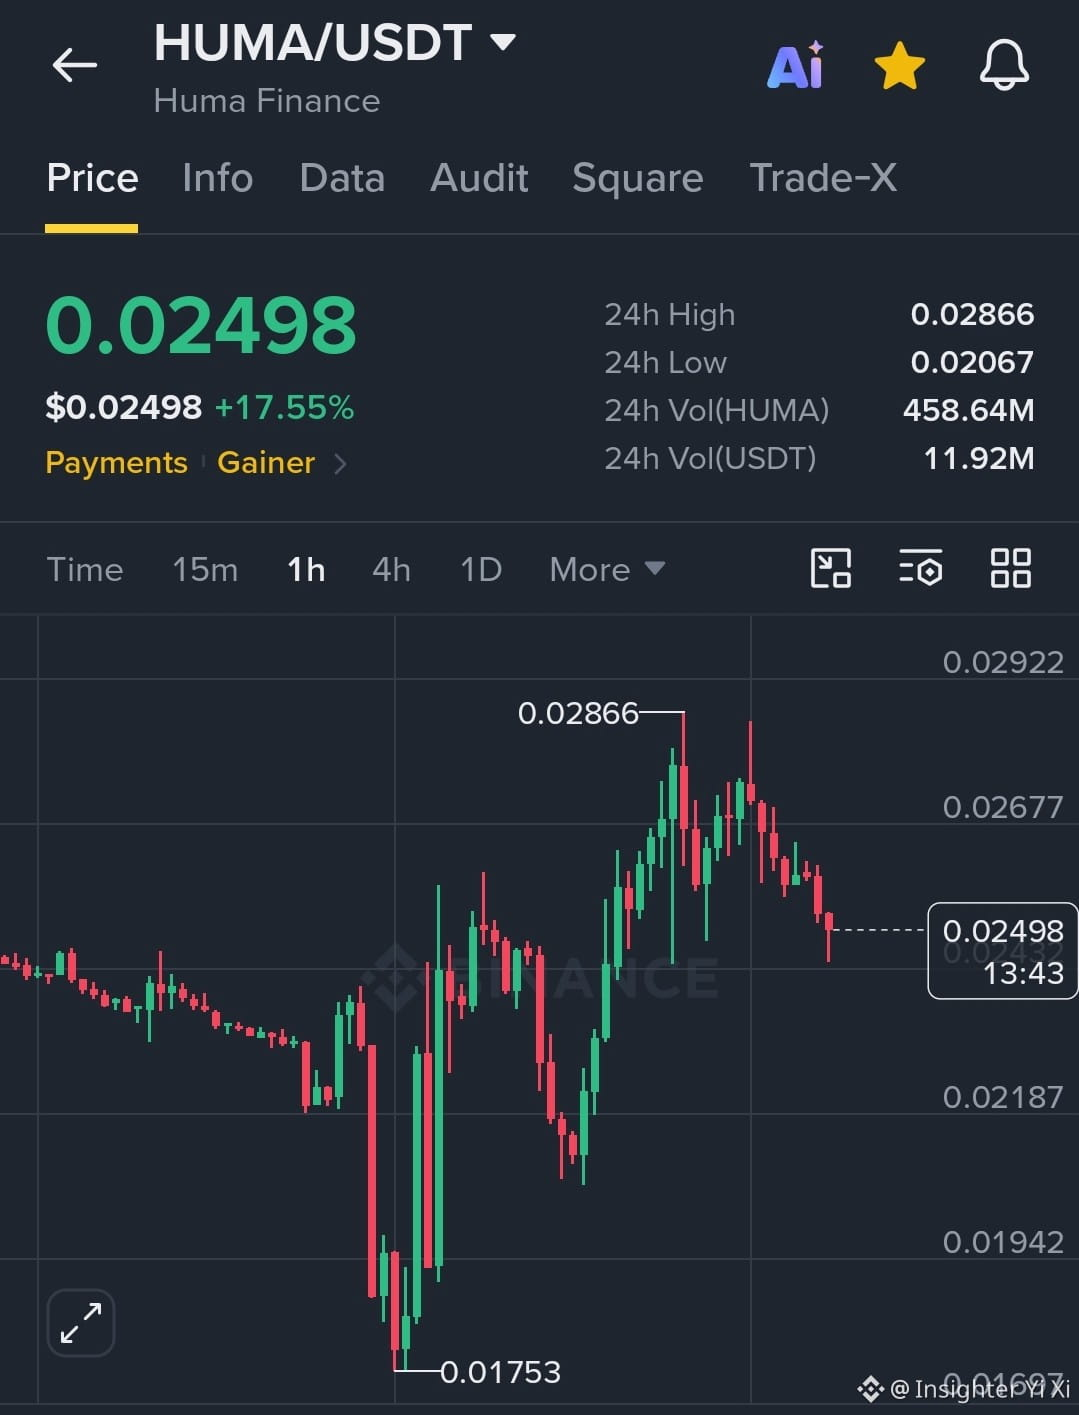
$HUMA USDT Momentum Is Building
#HUMA is up 17.55% at $0.02498, with resistance near $0.02677 and $0.02866. I’d watch for a pullback hold before considering a LONG rather than chasing the pump.
{future}(HUMAUSDT)
Entry: $0.0240–$0.0250 | SL: $0.0230 | TP: $0.02677 / $0.02866
Risk management is essential. This is not financial advice; do your own research.
$HUMA USDT Momentum Is Building
#HUMA is up 17.55% at $0.02498, with resistance near $0.02677 and $0.02866. I’d watch for a pullback hold before considering a LONG rather than chasing the pump.
Entry: $0.0240–$0.0250 | SL: $0.0230 | TP: $0.02677 / $0.02866
Risk management is essential. This is not financial advice; do your own research.
1
391

·
--
Verified
See translation
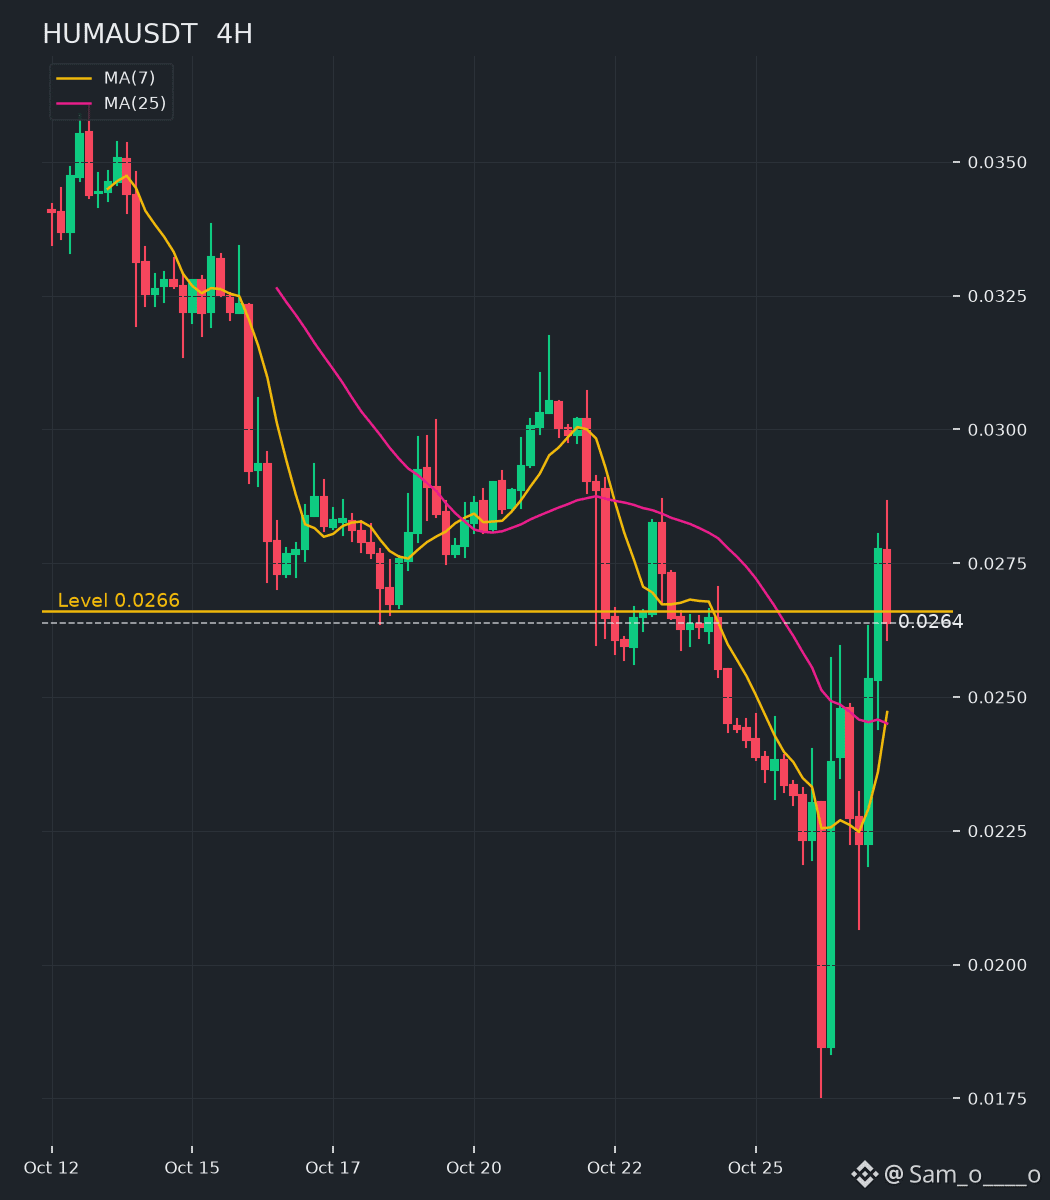
$HUMA is moving because Huma's PayFi network just crossed $20B in cumulative payment volume, and the token is up huge in the last 24 hours. That's a massive daily candle, and it bounced hard from around $0.0175 to around $0.0264.
I'm neutral right here. I don't like chasing a big move, but the volume milestone is real and the first unlock got pushed to Nov 26, so near-term supply pressure is delayed.
The level to reclaim is $0.0266, I'm watching it try to flip. Resistance is $0.03. If price reclaims $0.0266, I'm watching for a push at $0.03 into the Nov 26 governance and unlock date. A close below $0.022 would prove the bounce is fake and I'd back off.
Are you watching HUMA here or waiting for a retest? #HUMA #PayFi #Crypto
1
160
See translation
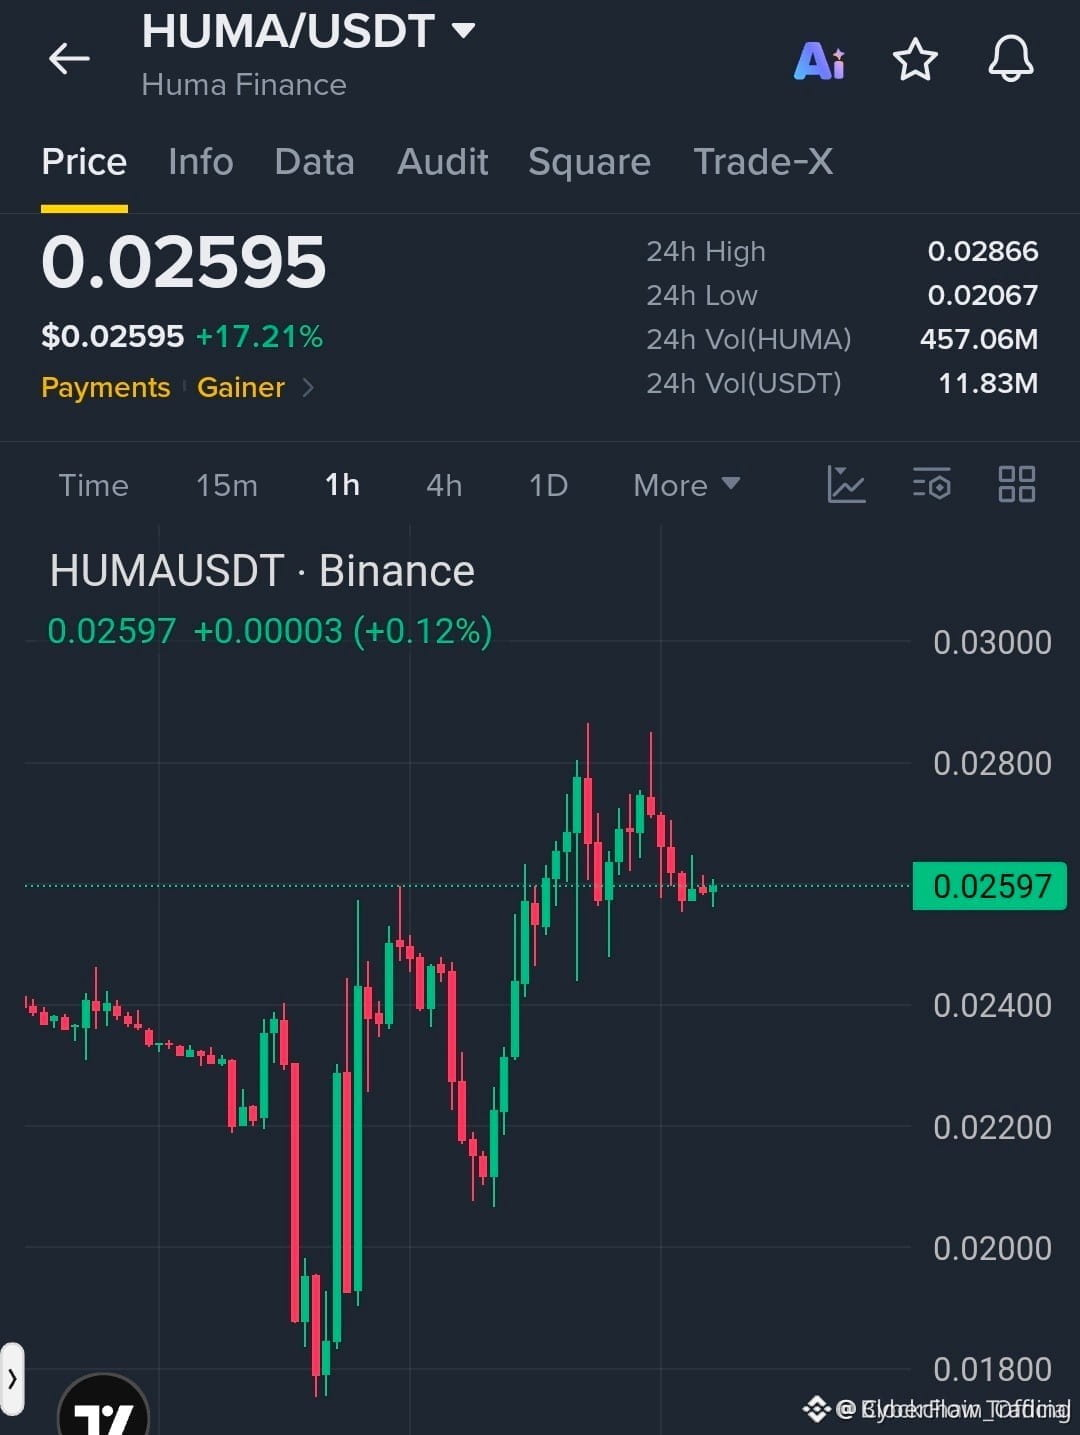
🚀 $HUMA ON THE CUSP OF A $0.0286 BREAKOUT! 🟢
Entry: 0.026 ⚡
Target: 0.0286 🚀
📊 Buyers have reclaimed the 0.026 zone after a sharp recovery, carving a clean bullish structure that’s holding firm. 🌊 Smart money is stacking liquidity just above 0.028, and each uptick is feeding the order‑flow engine, setting the stage for a rapid push toward 0.0286. ⚡ Momentum is ticking up on the 4H chart, and the next breakout candle could light the path for higher highs.
💬 Are you ready to ride the wave when $HUMA cracks the 0.028 barrier? 👇
⚠️ Not financial advice. Always manage your risk. 🛡️
🏷️ #HUMA #LongSetup #Breakout #Crypto
🔥 💎
1
See translation
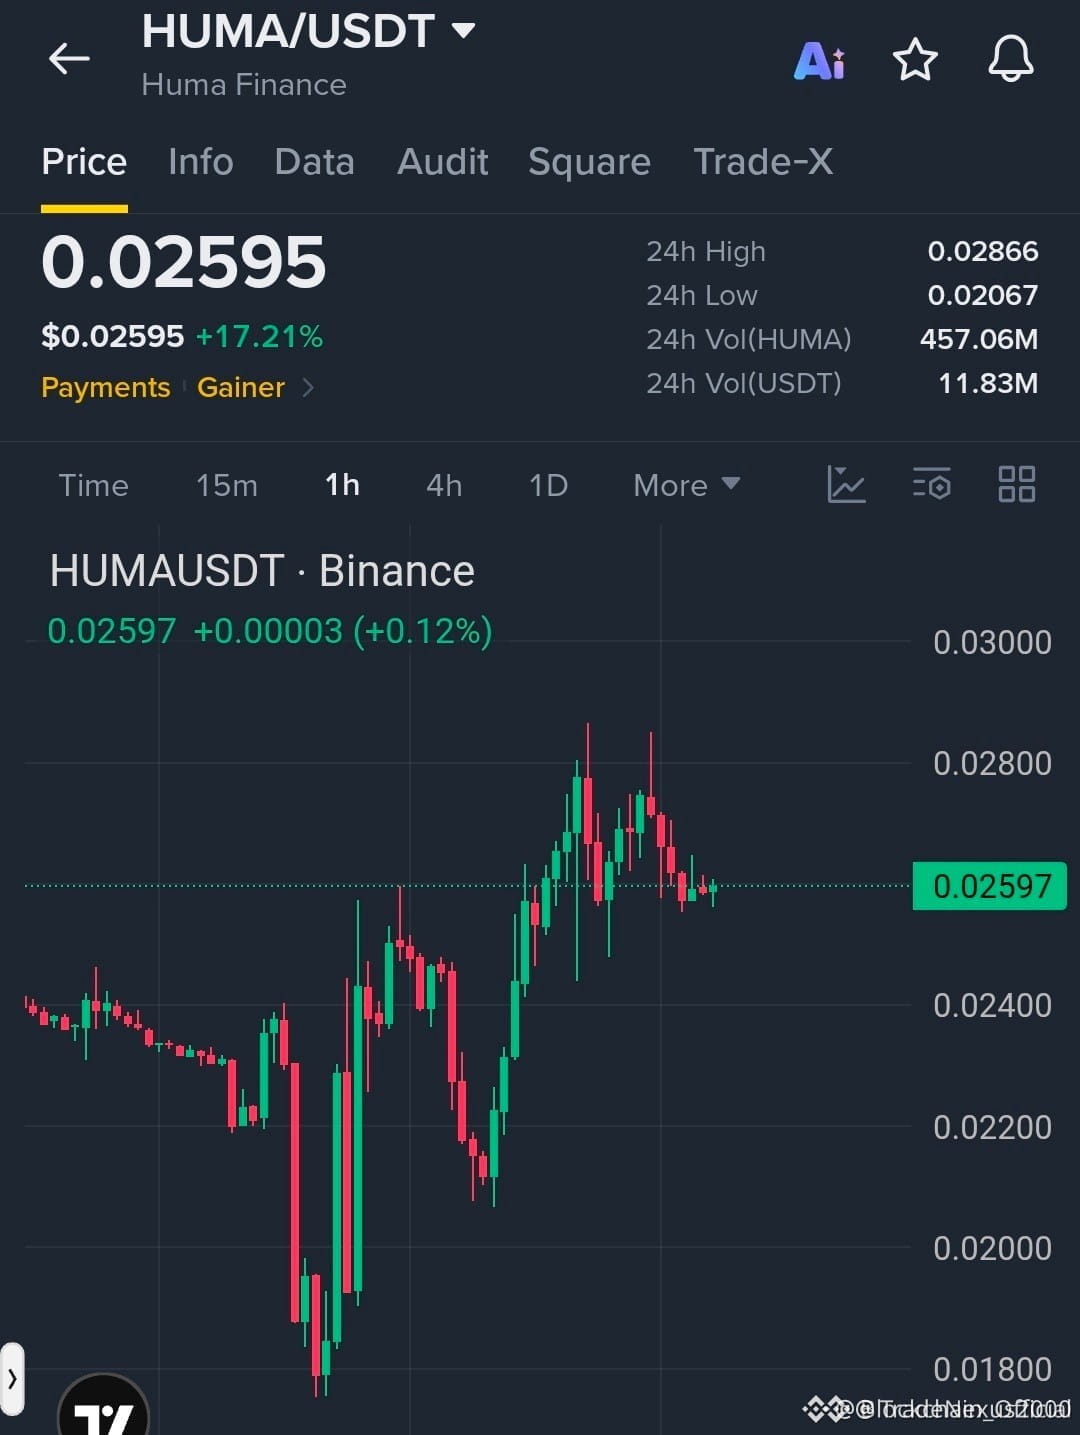
🚨 $HUMA POISED FOR BREAKOUT ABOVE $0.028 💥
Entry: 0.026 ⚡
Target: 0.0286 🚀
📊 The 0.026 zone now acts as a fresh order block, having soaked three rounds of sell pressure since the recent rally. Smart‑money 🦈 activity is evident as buyers re‑stack positions, stabilizing the market and priming a liquidity sweep. 📈 A decisive close above $0.028 would trigger the next imbalance, filling the fair‑value gap and propelling price toward $0.0286 and beyond. 💡 Patience and precise entries remain the edge in this structure.
⚠️ Not financial advice. Always manage your risk. 🛡️
🏷️ #HUMA #LongSetup #Breakout #Crypto
🔥 🦈
31

·
--
See translation
$HUMA HUMA is showing bullish movement: 6.25% (Crypto).
Volume: 12.20M | Last: $0.026030
Key signals: strong momentum, high volatility, high trader activity.
Bias Daily: BULLISH 🟢 | Weekly: BULLISH 🟢
HUMA gained 13.9% in 24h following perpetual contract listings, though impending unlock supply presents intermediate headwinds.
**Derivatives listing expansion (High)**: Major exchange rollout of perpetual contracts expanded market access → speculative demand drove intraday volume spike above 6.45M USDT
- **Bullish trend breakout (Medium)**: Price crossed above **EMA 7**, **EMA 25**, and **EMA 99** alongside a positive **MACD** crossover → accelerated buying momentum towards 0.02775
- **Net capital inflows (Medium)**: Sustained hourly net inflows between 0.02200 and 0.02700 absorbed localized selling pressure
#HUMA #CryptoCommunity #BinanceSquare #altcoins #Crypto
6

See translation
$HUMA - Huma Finance
The Future Of Global Payments! 🌍
HUMA is building PayFi - real-world payments
on blockchain. Fast, instant, global.
Real utility. Real adoption.
Not just hype, real finance!
Are you holding $HUMA? 👇
Bullish or Bearish?
#HUMA #HumaFinance #PayFi #crypto #BinanceSquare #Bullish
$HUMA - Huma Finance
The Future Of Global Payments! 🌍
HUMA is building PayFi - real-world payments
on blockchain. Fast, instant, global.
Real utility. Real adoption.
Not just hype, real finance!
Are you holding $HUMA? 👇
Bullish or Bearish?
#HUMA #HumaFinance #PayFi #crypto #BinanceSquare #Bullish
The Future Of Global Payments! 🌍
HUMA is building PayFi - real-world payments
on blockchain. Fast, instant, global.
Real utility. Real adoption.
Not just hype, real finance!
Are you holding $HUMA? 👇
Bullish or Bearish?
#HUMA #HumaFinance #PayFi #crypto #BinanceSquare #Bullish

1
84
Log in to explore more content
Join global crypto users on Binance Square
⚡️ Get latest and useful information about crypto.
💬 Trusted by the world’s largest crypto exchange.
👍 Discover real insights from verified creators.
Email / Phone number
Trending Topics
1
#CanMicrosoftDeliverOnAI
146,008 views
1,136 Discussing
2
#CanGoogleDefindItsCore
72,781 views
799 Discussing
3
#FOMCWatch
9.1M views
28,415 Discussing
4
#SKHynixUnveils$45BShareholderReturns
62 views
4 Discussing
5
#OSMOPlansToBurn100MTokensFromCommunityPool
2,661 views
99 Discussing
6
#EthereumDropsBelow$2300
12,516 views
166 Discussing
7
#BitcoinSlipsBelow$80KAgain
35,417 views
133 Discussing
8
#ThailandLaunchesWORPTStablecoinToQRPaymentApp
77,775 views
921 Discussing
9
#StrategySkipsBitcoinPurchasesSpends$205MOnSTRCBuybacks
14,064 views
101 Discussing
10
#BitmineAdds10452ETH
130,160 views
1,353 Discussing