
#bnbchart
bnbchart
2,288 views
19 Discussing
Hot
Latest

·
--
Bearish
See translation
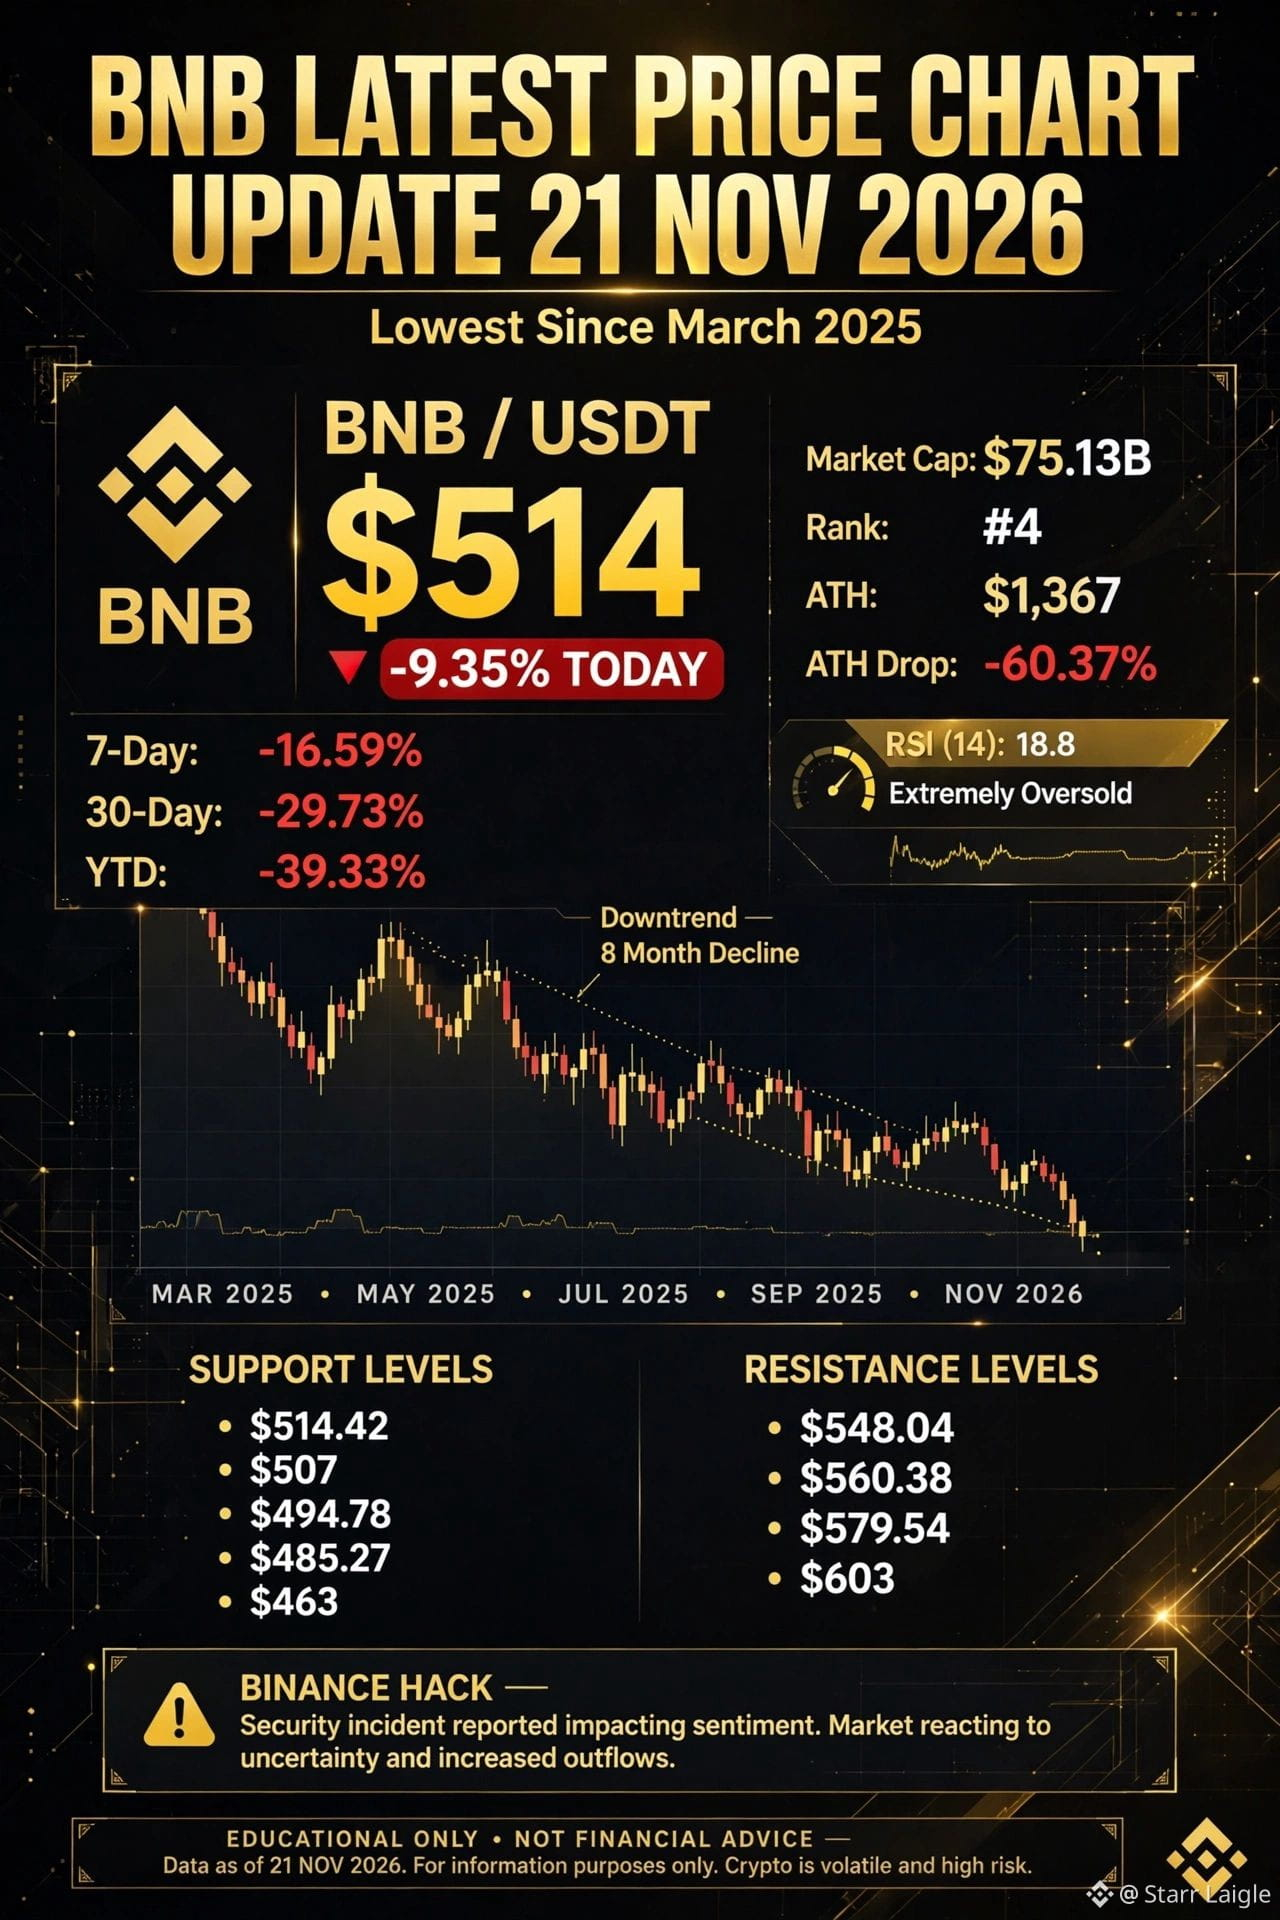
*🟡 $BNB - LATEST PRICE CHART UPDATE - 21 NOV 2026*
$BNB is at its *lowest price since March 2025*. All 2026 gains are now wiped out. This is the most painful coin in Top 5 today.
*$BNB PRICE RIGHT NOW:*
BNB is trading at *$514 - $542*, down *-4.11% to -9.35%* in 24h. 24h range was *$503.75 - $575.49* - a $71 swing. In 7 days BNB is down *-16.59%*. In 30 days down *-29.73% to -30.80%*. YTD down *-39.33%*. 1 Year down *-36.85%*. Market Cap *$67.60B - $75.13B*, Rank *#4*. 24h Volume *$1.14B - $1.20B*. BNB in PKR = *144,500 PKR* approx.
*BNB vs ATH:*
BNB ATH is *$1,367* on 5 Oct 2025. BNB is now *-60.37%* below ATH. If you bought $1000 at ATH, now it's only $396. BNB is down *-37%* from $809 just a few weeks ago.
*BNB CHART - WHAT IT SAYS:*
Daily chart: *STRONG BEARISH BIAS* on 1h, 4h, Daily, Weekly. Trend bearish since *29 Oct close* - exactly the day of Binance hack. BNB is *below ALL moving averages* - 7-day SMA $573.69, 20-day SMA $640.95, 50-day SMA $701.14, 200-day SMA $656.98. Price below SMA 200 = long-term bearish.
RSI (14) is *18.8 - 20.7* - *EXTREMELY OVERSOLD*. This is the lowest RSI in months. MACD *-44.83*, negative. Stochastic *11.49 / 9.19* - pinned low. Bollinger Band lower is *$523.41*, price is *hugging the lower band* with %B 0.0132. This means sellers are exhausted, but buyers are scared to step in.
Volume Profile: POC was $590, now broken. BNB lost $580, $560, $540 in 3 days.
*2. MARKET-WIDE SELL-OFF*
Total market cap down -7.21%. BTC ETF outflows $582M. Nasdaq down -4%. BNB cannot escape this.
*3. LIQUIDATIONS*
BNB longs liquidated when $580 support broke on 18 Nov. Once $580 broke, cascade to $530, then to $503.
Are you buying BNB at $514 or waiting for $463?
Comment "BNB BUY" / "BNB WAIT" / "BNB HOLD"
#bnb
#BİNANCE #bnbchart
{spot}(BNBUSDT)
*🟡 $BNB - LATEST PRICE CHART UPDATE - 21 NOV 2026*
$BNB is at its *lowest price since March 2025*. All 2026 gains are now wiped out. This is the most painful coin in Top 5 today.
*$BNB PRICE RIGHT NOW:*
BNB is trading at *$514 - $542*, down *-4.11% to -9.35%* in 24h. 24h range was *$503.75 - $575.49* - a $71 swing. In 7 days BNB is down *-16.59%*. In 30 days down *-29.73% to -30.80%*. YTD down *-39.33%*. 1 Year down *-36.85%*. Market Cap *$67.60B - $75.13B*, Rank *#4*. 24h Volume *$1.14B - $1.20B*. BNB in PKR = *144,500 PKR* approx.
*BNB vs ATH:*
BNB ATH is *$1,367* on 5 Oct 2025. BNB is now *-60.37%* below ATH. If you bought $1000 at ATH, now it's only $396. BNB is down *-37%* from $809 just a few weeks ago.
*BNB CHART - WHAT IT SAYS:*
Daily chart: *STRONG BEARISH BIAS* on 1h, 4h, Daily, Weekly. Trend bearish since *29 Oct close* - exactly the day of Binance hack. BNB is *below ALL moving averages* - 7-day SMA $573.69, 20-day SMA $640.95, 50-day SMA $701.14, 200-day SMA $656.98. Price below SMA 200 = long-term bearish.
RSI (14) is *18.8 - 20.7* - *EXTREMELY OVERSOLD*. This is the lowest RSI in months. MACD *-44.83*, negative. Stochastic *11.49 / 9.19* - pinned low. Bollinger Band lower is *$523.41*, price is *hugging the lower band* with %B 0.0132. This means sellers are exhausted, but buyers are scared to step in.
Volume Profile: POC was $590, now broken. BNB lost $580, $560, $540 in 3 days.
*2. MARKET-WIDE SELL-OFF*
Total market cap down -7.21%. BTC ETF outflows $582M. Nasdaq down -4%. BNB cannot escape this.
*3. LIQUIDATIONS*
BNB longs liquidated when $580 support broke on 18 Nov. Once $580 broke, cascade to $530, then to $503.
Are you buying BNB at $514 or waiting for $463?
Comment "BNB BUY" / "BNB WAIT" / "BNB HOLD"
#bnb
#BİNANCE #bnbchart
$BNB is at its *lowest price since March 2025*. All 2026 gains are now wiped out. This is the most painful coin in Top 5 today.
*$BNB PRICE RIGHT NOW:*
BNB is trading at *$514 - $542*, down *-4.11% to -9.35%* in 24h. 24h range was *$503.75 - $575.49* - a $71 swing. In 7 days BNB is down *-16.59%*. In 30 days down *-29.73% to -30.80%*. YTD down *-39.33%*. 1 Year down *-36.85%*. Market Cap *$67.60B - $75.13B*, Rank *#4*. 24h Volume *$1.14B - $1.20B*. BNB in PKR = *144,500 PKR* approx.
*BNB vs ATH:*
BNB ATH is *$1,367* on 5 Oct 2025. BNB is now *-60.37%* below ATH. If you bought $1000 at ATH, now it's only $396. BNB is down *-37%* from $809 just a few weeks ago.
*BNB CHART - WHAT IT SAYS:*
Daily chart: *STRONG BEARISH BIAS* on 1h, 4h, Daily, Weekly. Trend bearish since *29 Oct close* - exactly the day of Binance hack. BNB is *below ALL moving averages* - 7-day SMA $573.69, 20-day SMA $640.95, 50-day SMA $701.14, 200-day SMA $656.98. Price below SMA 200 = long-term bearish.
RSI (14) is *18.8 - 20.7* - *EXTREMELY OVERSOLD*. This is the lowest RSI in months. MACD *-44.83*, negative. Stochastic *11.49 / 9.19* - pinned low. Bollinger Band lower is *$523.41*, price is *hugging the lower band* with %B 0.0132. This means sellers are exhausted, but buyers are scared to step in.
Volume Profile: POC was $590, now broken. BNB lost $580, $560, $540 in 3 days.
*2. MARKET-WIDE SELL-OFF*
Total market cap down -7.21%. BTC ETF outflows $582M. Nasdaq down -4%. BNB cannot escape this.
*3. LIQUIDATIONS*
BNB longs liquidated when $580 support broke on 18 Nov. Once $580 broke, cascade to $530, then to $503.
Are you buying BNB at $514 or waiting for $463?
Comment "BNB BUY" / "BNB WAIT" / "BNB HOLD"
#bnb
#BİNANCE #bnbchart
17


See translation
$BNB Chart Observation: Technical Levels 📊
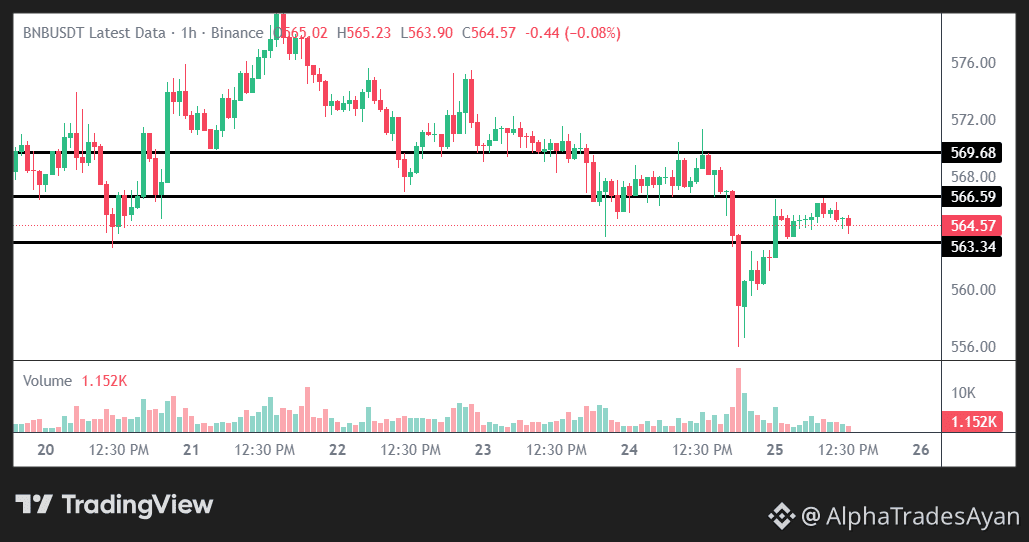
Looking at the $BNB chart, the price is currently moving within a very tight, narrow range. We are observing the price action between these key technical levels.
Technical Levels on the Chart:
🚧 Upper Resistance Level: $569.68
🚧 Immediate Resistance Level: $566.59
🛡️ Immediate Support Level: $563.34
$BNB
{future}(BNBUSDT)
The price is currently hovering between the $563.34 and $566.59 levels.
What is your technical perspective on this structure? Do you see the price continuing this sideways movement or breaking this range? Share your chart views in the comments below! 👇
(Educational chart observation only | NFA | DYOR)
#bnb #BNB_Market_Update #bnbchart #bnbscalping #crypto
$BNB Chart Observation: Technical Levels 📊
Looking at the $BNB chart, the price is currently moving within a very tight, narrow range. We are observing the price action between these key technical levels.
Technical Levels on the Chart:
🚧 Upper Resistance Level: $569.68
🚧 Immediate Resistance Level: $566.59
🛡️ Immediate Support Level: $563.34
$BNB
The price is currently hovering between the $563.34 and $566.59 levels.
What is your technical perspective on this structure? Do you see the price continuing this sideways movement or breaking this range? Share your chart views in the comments below! 👇
(Educational chart observation only | NFA | DYOR)
#bnb #BNB_Market_Update #bnbchart #bnbscalping #crypto
Looking at the $BNB chart, the price is currently moving within a very tight, narrow range. We are observing the price action between these key technical levels.
Technical Levels on the Chart:
🚧 Upper Resistance Level: $569.68
🚧 Immediate Resistance Level: $566.59
🛡️ Immediate Support Level: $563.34
$BNB
The price is currently hovering between the $563.34 and $566.59 levels.
What is your technical perspective on this structure? Do you see the price continuing this sideways movement or breaking this range? Share your chart views in the comments below! 👇
(Educational chart observation only | NFA | DYOR)
#bnb #BNB_Market_Update #bnbchart #bnbscalping #crypto
93
Log in to explore more content
Join global crypto users on Binance Square
⚡️ Get latest and useful information about crypto.
💬 Trusted by the world’s largest crypto exchange.
👍 Discover real insights from verified creators.
Email / Phone number
Trending Topics
1
#NvidiaLoses$2.7TrillionInMonthAndAHalf
5,208 views
68 Discussing
2
#CanBTCReboundAfterFallingBelow60K?
611,302 views
2,609 Discussing
3
#GlobalStocksFaceLongestLosingStreakSince2023
214,271 views
1,787 Discussing
4
#BlackRockIBITPostsRecord$541MSingleDayOutflow
20,803 views
62 Discussing
5
#AnthropicPlungesTowardIPOPriceonDay2
106,425 views
1,057 Discussing
6
#TwentyOneCapitalAdds172.25BTC
44,955 views
544 Discussing
7
#HKBillWouldExcludeTokenizedDepositsFromVirtualAssets
5,006 views
48 Discussing
8
#BNBDropsBelow540USDTWith8.46%DailyDecline
60,939 views
561 Discussing
9
#HKBillProposesHK$100KFineForUnauthorizedCryptoTitles
2,033 views
20 Discussing
10
#BitMineFaces$10.1BUnrealizedETHLoss
4,291 views
25 Discussing