
#bitcoi
bitcoi
127,494 views
586 Discussing
Hot
Latest

·
--
Article
See translation
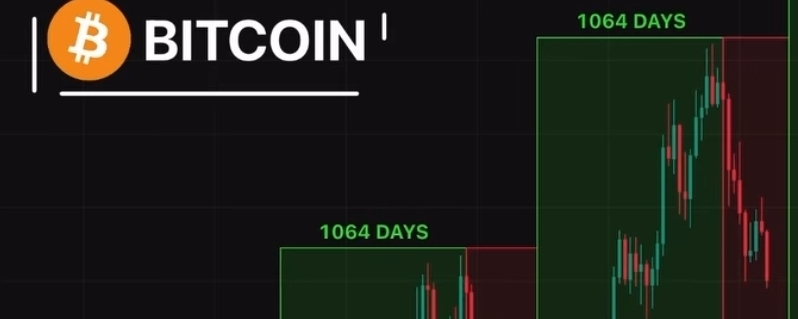
28/10/2026Bitcoin Halving in Plain English
Bitcoin has a hard cap of 21 million coins. New coins are created as rewards for miners, and about every four years (every 210,000 blocks) that reward is cut in half. That event is the halving.
Past halvings:
2012: 50 → 25 BTC per block
2016: 25 → 12.5
2020: 12.5 → 6.25
2024: 6.25 → 3.125
Why it matters: New supply slows down, which makes Bitcoin’s issuance more predictable and scarcer over time. But price depends on demand, news, and the wider market too, and past results don’t guarantee future ones.
Educational content, not financial advice.
#Binance ce #Bitcoi n #BT C #HalvingUpdate ving
28/10/2026
Bitcoin Halving in Plain English
Bitcoin has a hard cap of 21 million coins. New coins are created as rewards for miners, and about every four years (every 210,000 blocks) that reward is cut in half. That event is the halving.
Past halvings:
2012: 50 → 25 BTC per block
2016: 25 → 12.5
2020: 12.5 → 6.25
2024: 6.25 → 3.125
Why it matters: New supply slows down, which makes Bitcoin’s issuance more predictable and scarcer over time. But price depends on demand, news, and the wider market too, and past results don’t guarantee future ones.
Educational content, not financial advice.
#Binance ce #Bitcoi n #BT C #HalvingUpdate ving
Bitcoin has a hard cap of 21 million coins. New coins are created as rewards for miners, and about every four years (every 210,000 blocks) that reward is cut in half. That event is the halving.
Past halvings:
2012: 50 → 25 BTC per block
2016: 25 → 12.5
2020: 12.5 → 6.25
2024: 6.25 → 3.125
Why it matters: New supply slows down, which makes Bitcoin’s issuance more predictable and scarcer over time. But price depends on demand, news, and the wider market too, and past results don’t guarantee future ones.
Educational content, not financial advice.
#Binance ce #Bitcoi n #BT C #HalvingUpdate ving
79

·
--
See translation
🚨 BITCOIN TRADERS: WHY DO LIQUIDATIONS HAPPEN? 📉📈
One of the biggest risks in crypto futures trading is LEVERAGE.
You can be right about the long-term direction of Bitcoin and still lose money if your position gets liquidated before the market moves in your favor.
Let's understand how it works. 👇
🔥 1️⃣ WHAT IS A LIQUIDATION?
Liquidation happens when an exchange forcibly closes a leveraged position because its margin is no longer sufficient under the exchange's rules.
It can happen to both LONG and SHORT traders.
📉 2️⃣ HOW CAN A LONG POSITION GET LIQUIDATED?
Imagine you open a leveraged LONG position expecting Bitcoin to rise.
If BTC falls sharply, your losses increase. If your margin becomes insufficient, the exchange may close your position.
📈 3️⃣ WHAT ABOUT SHORT POSITIONS?
A SHORT trader expects the price to fall.
If Bitcoin rises sharply instead, the short position can suffer losses and may also be liquidated.
⚠️ 4️⃣ WHY DOES LEVERAGE INCREASE RISK?
Higher leverage means a smaller price move can have a larger impact on your margin.
For example, with 10x leverage, a 1% adverse move represents roughly 10% of the initial position margin before fees and other factors. Actual liquidation depends on exchange rules, maintenance margin, and position details.
📊 5️⃣ WHAT SHOULD TRADERS WATCH?
✅ BTC price action
✅ Open interest
✅ Funding rates
✅ Liquidation data
✅ Position size and available margin
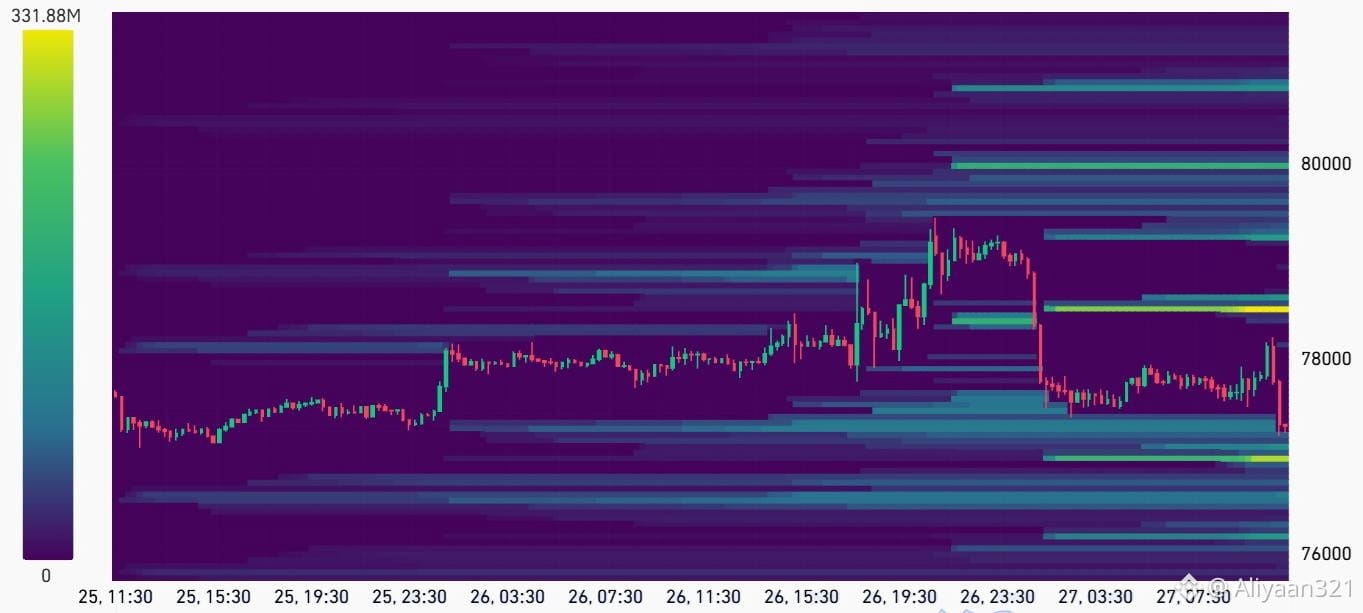
Recent market data for October 19–25 reported substantial liquidations of both long and short positions on Binance. This shows why leveraged trading deserves caution.
🧠 THE BIG LESSON
High liquidation activity does not automatically mean Bitcoin will rise or fall next.
Use data to understand market conditions, not to predict guaranteed profits.
👇 QUESTION FOR TRADERS:
Which do you prefer?
A) Spot trading — no leverage
B) Futures trading — with leverage
C) Still learning before trading
Comment A, B, or C!
📌 Follow for real crypto trading education, market data, and risk-management lessons.
#Bitcoi #BTC
🚨 BITCOIN TRADERS: WHY DO LIQUIDATIONS HAPPEN? 📉📈
One of the biggest risks in crypto futures trading is LEVERAGE.
You can be right about the long-term direction of Bitcoin and still lose money if your position gets liquidated before the market moves in your favor.
Let's understand how it works. 👇
🔥 1️⃣ WHAT IS A LIQUIDATION?
Liquidation happens when an exchange forcibly closes a leveraged position because its margin is no longer sufficient under the exchange's rules.
It can happen to both LONG and SHORT traders.
📉 2️⃣ HOW CAN A LONG POSITION GET LIQUIDATED?
Imagine you open a leveraged LONG position expecting Bitcoin to rise.
If BTC falls sharply, your losses increase. If your margin becomes insufficient, the exchange may close your position.
📈 3️⃣ WHAT ABOUT SHORT POSITIONS?
A SHORT trader expects the price to fall.
If Bitcoin rises sharply instead, the short position can suffer losses and may also be liquidated.
⚠️ 4️⃣ WHY DOES LEVERAGE INCREASE RISK?
Higher leverage means a smaller price move can have a larger impact on your margin.
For example, with 10x leverage, a 1% adverse move represents roughly 10% of the initial position margin before fees and other factors. Actual liquidation depends on exchange rules, maintenance margin, and position details.
📊 5️⃣ WHAT SHOULD TRADERS WATCH?
✅ BTC price action
✅ Open interest
✅ Funding rates
✅ Liquidation data
✅ Position size and available margin
Recent market data for October 19–25 reported substantial liquidations of both long and short positions on Binance. This shows why leveraged trading deserves caution.
🧠 THE BIG LESSON
High liquidation activity does not automatically mean Bitcoin will rise or fall next.
Use data to understand market conditions, not to predict guaranteed profits.
👇 QUESTION FOR TRADERS:
Which do you prefer?
A) Spot trading — no leverage
B) Futures trading — with leverage
C) Still learning before trading
Comment A, B, or C!
📌 Follow for real crypto trading education, market data, and risk-management lessons.
#Bitcoi #BTC
One of the biggest risks in crypto futures trading is LEVERAGE.
You can be right about the long-term direction of Bitcoin and still lose money if your position gets liquidated before the market moves in your favor.
Let's understand how it works. 👇
🔥 1️⃣ WHAT IS A LIQUIDATION?
Liquidation happens when an exchange forcibly closes a leveraged position because its margin is no longer sufficient under the exchange's rules.
It can happen to both LONG and SHORT traders.
📉 2️⃣ HOW CAN A LONG POSITION GET LIQUIDATED?
Imagine you open a leveraged LONG position expecting Bitcoin to rise.
If BTC falls sharply, your losses increase. If your margin becomes insufficient, the exchange may close your position.
📈 3️⃣ WHAT ABOUT SHORT POSITIONS?
A SHORT trader expects the price to fall.
If Bitcoin rises sharply instead, the short position can suffer losses and may also be liquidated.
⚠️ 4️⃣ WHY DOES LEVERAGE INCREASE RISK?
Higher leverage means a smaller price move can have a larger impact on your margin.
For example, with 10x leverage, a 1% adverse move represents roughly 10% of the initial position margin before fees and other factors. Actual liquidation depends on exchange rules, maintenance margin, and position details.
📊 5️⃣ WHAT SHOULD TRADERS WATCH?
✅ BTC price action
✅ Open interest
✅ Funding rates
✅ Liquidation data
✅ Position size and available margin
Recent market data for October 19–25 reported substantial liquidations of both long and short positions on Binance. This shows why leveraged trading deserves caution.
🧠 THE BIG LESSON
High liquidation activity does not automatically mean Bitcoin will rise or fall next.
Use data to understand market conditions, not to predict guaranteed profits.
👇 QUESTION FOR TRADERS:
Which do you prefer?
A) Spot trading — no leverage
B) Futures trading — with leverage
C) Still learning before trading
Comment A, B, or C!
📌 Follow for real crypto trading education, market data, and risk-management lessons.
#Bitcoi #BTC
18

·
--
Bearish
See translation
🚨 CRYPTO MARKET UPDATE 🚨
📉 Bitcoin Faces Key $80K Support 💸 $773M+ Flows Out of Spot BTC ETFs in Two Sessions ⚠️ Ethereum Continues to Underperform BTC
👀 What to watch next: • BTC price reaction near $80K • ETF inflows vs. outflows • Upcoming US Federal Reserve decision
The next move depends on whether buyers step in or selling pressure continues.
#Bitcoi
{spot}(BTCUSDT)
#Bitcoi #BTC #EthereumNews #CryptoNewss #BinanceSquare
🚨 CRYPTO MARKET UPDATE 🚨
📉 Bitcoin Faces Key $80K Support 💸 $773M+ Flows Out of Spot BTC ETFs in Two Sessions ⚠️ Ethereum Continues to Underperform BTC
👀 What to watch next: • BTC price reaction near $80K • ETF inflows vs. outflows • Upcoming US Federal Reserve decision
The next move depends on whether buyers step in or selling pressure continues.
#Bitcoi
#Bitcoi #BTC #EthereumNews #CryptoNewss #BinanceSquare
📉 Bitcoin Faces Key $80K Support 💸 $773M+ Flows Out of Spot BTC ETFs in Two Sessions ⚠️ Ethereum Continues to Underperform BTC
👀 What to watch next: • BTC price reaction near $80K • ETF inflows vs. outflows • Upcoming US Federal Reserve decision
The next move depends on whether buyers step in or selling pressure continues.
#Bitcoi
#Bitcoi #BTC #EthereumNews #CryptoNewss #BinanceSquare

93

·
--
See translation
🚨 BITCOIN ALERT: Major Liquidations & Global Turmoil! Is $BTC Safe? ⚠️
🌍 Global macro shockwaves are hitting the markets! With nearly $2 trillion washing out of traditional assets and Asian stock markets retreating, risk-on assets like crypto are feeling the pressure. But behind the scenes, Bitcoin is putting up a surprisingly strong fight! 🛡️⚡️
📉 $500 Million Liquidated in a Flash
A modest $2,000 drop in Bitcoin was enough to trigger nearly $500,000,000 in liquidations across futures markets! 💥 However, because a large portion of these liquidations were short positions on the upside, BTC managed to avoid a total collapse. This buffer kept prices from plunging straight below the critical $80,000 support level. 📊🧲
⏳ The Real Test Is Just Beginning!
While Bitcoin is holding its ground for now, the storm isn’t over yet. The market is likely entering a consolidation phase to hunt for deeper liquidity before making its next major move. If traditional financial markets face a broader global crisis, crypto volatility will spike significantly. 🌊🌪️
💡 How to Handle the Market Volatility:
🧘♂️ Stay Patient: Don't let short-term wicks throw off your long-term plan.
🛡️ Manage Risk: Keep leverage low to avoid getting caught in sudden liquidation sweeps.
🔍 Do Your Own Research (DYOR): Keep a close eye on macroeconomic trends alongside technical charts! 🧠💼
👇 Do you think $BTC will hold strong above $80K, or are we heading deeper into a correction? Share your thoughts below! 💬👇
#Bitcoi n #BTC #CryptoNews #BinanceSquare #MarketUpdate #MacroEconomy #DYOR
🚨 BITCOIN ALERT: Major Liquidations & Global Turmoil! Is $BTC Safe? ⚠️
🌍 Global macro shockwaves are hitting the markets! With nearly $2 trillion washing out of traditional assets and Asian stock markets retreating, risk-on assets like crypto are feeling the pressure. But behind the scenes, Bitcoin is putting up a surprisingly strong fight! 🛡️⚡️
📉 $500 Million Liquidated in a Flash
A modest $2,000 drop in Bitcoin was enough to trigger nearly $500,000,000 in liquidations across futures markets! 💥 However, because a large portion of these liquidations were short positions on the upside, BTC managed to avoid a total collapse. This buffer kept prices from plunging straight below the critical $80,000 support level. 📊🧲
⏳ The Real Test Is Just Beginning!
While Bitcoin is holding its ground for now, the storm isn’t over yet. The market is likely entering a consolidation phase to hunt for deeper liquidity before making its next major move. If traditional financial markets face a broader global crisis, crypto volatility will spike significantly. 🌊🌪️
💡 How to Handle the Market Volatility:
🧘♂️ Stay Patient: Don't let short-term wicks throw off your long-term plan.
🛡️ Manage Risk: Keep leverage low to avoid getting caught in sudden liquidation sweeps.
🔍 Do Your Own Research (DYOR): Keep a close eye on macroeconomic trends alongside technical charts! 🧠💼
👇 Do you think $BTC will hold strong above $80K, or are we heading deeper into a correction? Share your thoughts below! 💬👇
#Bitcoi n #BTC #CryptoNews #BinanceSquare #MarketUpdate #MacroEconomy #DYOR
🌍 Global macro shockwaves are hitting the markets! With nearly $2 trillion washing out of traditional assets and Asian stock markets retreating, risk-on assets like crypto are feeling the pressure. But behind the scenes, Bitcoin is putting up a surprisingly strong fight! 🛡️⚡️
📉 $500 Million Liquidated in a Flash
A modest $2,000 drop in Bitcoin was enough to trigger nearly $500,000,000 in liquidations across futures markets! 💥 However, because a large portion of these liquidations were short positions on the upside, BTC managed to avoid a total collapse. This buffer kept prices from plunging straight below the critical $80,000 support level. 📊🧲
⏳ The Real Test Is Just Beginning!
While Bitcoin is holding its ground for now, the storm isn’t over yet. The market is likely entering a consolidation phase to hunt for deeper liquidity before making its next major move. If traditional financial markets face a broader global crisis, crypto volatility will spike significantly. 🌊🌪️
💡 How to Handle the Market Volatility:
🧘♂️ Stay Patient: Don't let short-term wicks throw off your long-term plan.
🛡️ Manage Risk: Keep leverage low to avoid getting caught in sudden liquidation sweeps.
🔍 Do Your Own Research (DYOR): Keep a close eye on macroeconomic trends alongside technical charts! 🧠💼
👇 Do you think $BTC will hold strong above $80K, or are we heading deeper into a correction? Share your thoughts below! 💬👇
#Bitcoi n #BTC #CryptoNews #BinanceSquare #MarketUpdate #MacroEconomy #DYOR
43

·
--
See translation
🚀 CRYPTO BEGINNERS, LET'S LEARN TOGETHER! 💰
Have you ever wondered how Bitcoin works?
₿ Bitcoin is a digital asset that operates on a decentralized network called blockchain.
📚 Before investing, always learn about the risks, volatility, and security of crypto.
💬 Question for everyone:
What would you like to learn next?
A) Bitcoin basics
B) Blockchain explained
C) Crypto wallet security
Comment A, B, or C below! 👇
#Bitcoi #BTC #cryptoeducation #BinanceSquare
🚀 CRYPTO BEGINNERS, LET'S LEARN TOGETHER! 💰
Have you ever wondered how Bitcoin works?
₿ Bitcoin is a digital asset that operates on a decentralized network called blockchain.
📚 Before investing, always learn about the risks, volatility, and security of crypto.
💬 Question for everyone:
What would you like to learn next?
A) Bitcoin basics
B) Blockchain explained
C) Crypto wallet security
Comment A, B, or C below! 👇
#Bitcoi #BTC #cryptoeducation #BinanceSquare
Have you ever wondered how Bitcoin works?
₿ Bitcoin is a digital asset that operates on a decentralized network called blockchain.
📚 Before investing, always learn about the risks, volatility, and security of crypto.
💬 Question for everyone:
What would you like to learn next?
A) Bitcoin basics
B) Blockchain explained
C) Crypto wallet security
Comment A, B, or C below! 👇
#Bitcoi #BTC #cryptoeducation #BinanceSquare

1
81

Article
See translation
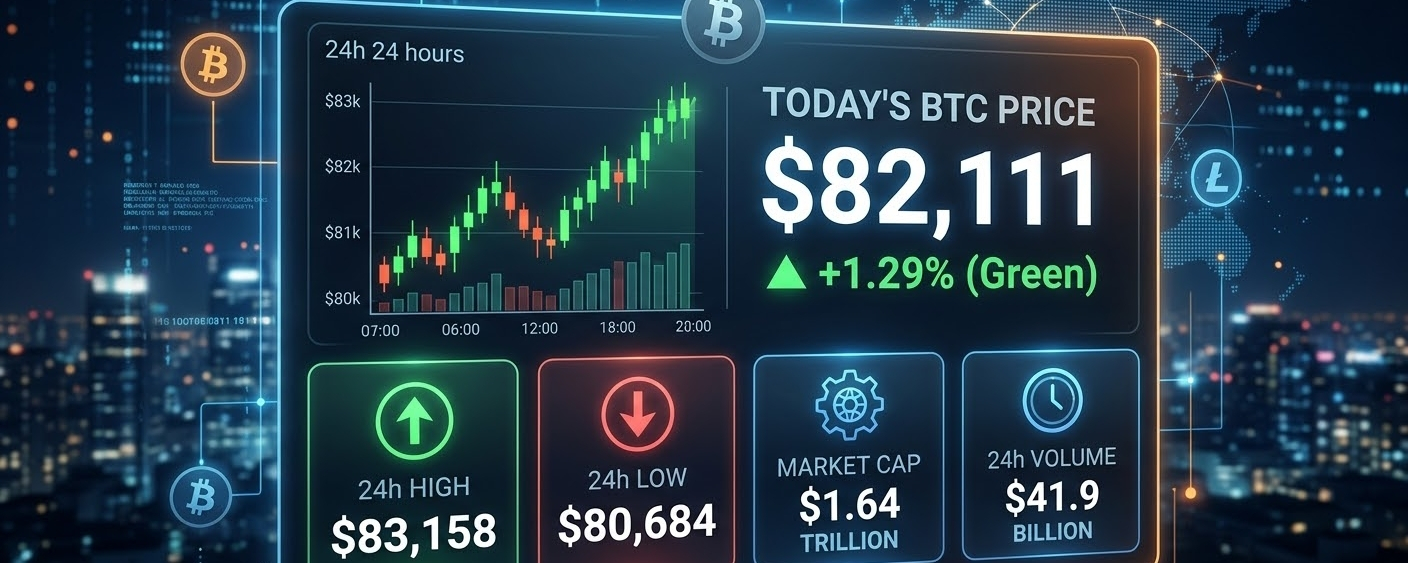
Today's Price: $82,111 (+1.29%)
· 24h High: $83,158
· 24h Low: $80,684
· Market Cap: $1.64 TrillionToday's Price: $82,111 (+1.29%)
24h High: $83,158
24h Low: $80,684
Market Cap: $1.64 Trillion
What Happened Today?
BTC bounced from $80.5k low to $83k high - strong recovery
Opened at $81,063, now up +$1,047 in a day.24h Trading Volume: $18.18 Billion.Sentiment still in Extreme Fear (25), but RSI at 47 - neutral zone coming.Nasdaq & S&P 500 also surged today, tech rebound helped BTC
Bitcoin is holding above $81k support. If it breaks $83,076 (today's high), next target $84.5k. Drop below $80.5k could mean retest of $79k.
Is this the bottom before next leg up? 👀
#Bitcoi #BTCPrice #CryptoUpdate #bitcointoday
Today's Price: $82,111 (+1.29%) · 24h High: $83,158 · 24h Low: $80,684 · Market Cap: $1.64 Trillion
Today's Price: $82,111 (+1.29%)
24h High: $83,158
24h Low: $80,684
Market Cap: $1.64 Trillion
What Happened Today?
BTC bounced from $80.5k low to $83k high - strong recovery
Opened at $81,063, now up +$1,047 in a day.24h Trading Volume: $18.18 Billion.Sentiment still in Extreme Fear (25), but RSI at 47 - neutral zone coming.Nasdaq & S&P 500 also surged today, tech rebound helped BTC
Bitcoin is holding above $81k support. If it breaks $83,076 (today's high), next target $84.5k. Drop below $80.5k could mean retest of $79k.
Is this the bottom before next leg up? 👀
#Bitcoi #BTCPrice #CryptoUpdate #bitcointoday
24h High: $83,158
24h Low: $80,684
Market Cap: $1.64 Trillion
What Happened Today?
BTC bounced from $80.5k low to $83k high - strong recovery
Opened at $81,063, now up +$1,047 in a day.24h Trading Volume: $18.18 Billion.Sentiment still in Extreme Fear (25), but RSI at 47 - neutral zone coming.Nasdaq & S&P 500 also surged today, tech rebound helped BTC
Bitcoin is holding above $81k support. If it breaks $83,076 (today's high), next target $84.5k. Drop below $80.5k could mean retest of $79k.
Is this the bottom before next leg up? 👀
#Bitcoi #BTCPrice #CryptoUpdate #bitcointoday
99

Boring sideways movement for Bitcoin $BTC near $81,250 after successfully touching support at $81,000, as we warned earlier. 📉🎯
Holding at these levels is critical in determining the next direction for #Bitcoi n. Stick to risk management and stop-loss orders, as I explained in my previous article.
Do you expect a bounce from this bottom, or will we see a deeper drop? Share your analyses in the comments! 👇
#BTC $BTC TC #Bitcoin #BinanceSquare
Boring sideways movement for Bitcoin $BTC near $81,250 after successfully touching support at $81,000, as we warned earlier. 📉🎯
Holding at these levels is critical in determining the next direction for #Bitcoi n. Stick to risk management and stop-loss orders, as I explained in my previous article.
Do you expect a bounce from this bottom, or will we see a deeper drop? Share your analyses in the comments! 👇
#BTC $BTC TC #Bitcoin #BinanceSquare
Holding at these levels is critical in determining the next direction for #Bitcoi n. Stick to risk management and stop-loss orders, as I explained in my previous article.
Do you expect a bounce from this bottom, or will we see a deeper drop? Share your analyses in the comments! 👇
#BTC $BTC TC #Bitcoin #BinanceSquare
1
114

Is Bitcoin trapped by inflation or ready to rebound?
The crypto market has taken a severe hit after the higher-than-expected U.S. CPI report, causing $BTC to lose the $81,000 level and trade in the $80,900 range. Uncertainty over whether the Federal Reserve will raise interest rates this month has triggered outflows of more than $150 million from spot Bitcoin ETFs in a single day, pulling retail market liquidity down toward critical support zones.
My Analysis
I’ll be brutally honest: most traders are going to get liquidated in the coming hours because they trade on gut instinct, not on actual order book data. My stance on $BTC is cautious, with a moderate bullish bias—but only if we manage to defend the macro psychological support level at $80,000. Technically, the market is oversold in the short term due to macroeconomic panic, but institutional flows remain unstable.
Don’t buy thinking that $BTC C’s bottom is guaranteed; there are no certainties in this business. If the price breaks decisively below the $80,000 support level with institutional liquidation volume, the structure will be completely invalidated, and the price will head for $75,000. Manage your risk, keep leverage to a minimum, and remember that accepting a small loss in time is the only way to survive long enough to see the next trend.
{spot}(BTCUSDT)
Follow me for more trading content.
#Bitcoi n #crypt o #Trading
Is Bitcoin trapped by inflation or ready to rebound?
The crypto market has taken a severe hit after the higher-than-expected U.S. CPI report, causing $BTC to lose the $81,000 level and trade in the $80,900 range. Uncertainty over whether the Federal Reserve will raise interest rates this month has triggered outflows of more than $150 million from spot Bitcoin ETFs in a single day, pulling retail market liquidity down toward critical support zones.
My Analysis
I’ll be brutally honest: most traders are going to get liquidated in the coming hours because they trade on gut instinct, not on actual order book data. My stance on $BTC is cautious, with a moderate bullish bias—but only if we manage to defend the macro psychological support level at $80,000. Technically, the market is oversold in the short term due to macroeconomic panic, but institutional flows remain unstable.
Don’t buy thinking that $BTC C’s bottom is guaranteed; there are no certainties in this business. If the price breaks decisively below the $80,000 support level with institutional liquidation volume, the structure will be completely invalidated, and the price will head for $75,000. Manage your risk, keep leverage to a minimum, and remember that accepting a small loss in time is the only way to survive long enough to see the next trend.
Follow me for more trading content.
#Bitcoi n #crypt o #Trading
The crypto market has taken a severe hit after the higher-than-expected U.S. CPI report, causing $BTC to lose the $81,000 level and trade in the $80,900 range. Uncertainty over whether the Federal Reserve will raise interest rates this month has triggered outflows of more than $150 million from spot Bitcoin ETFs in a single day, pulling retail market liquidity down toward critical support zones.
My Analysis
I’ll be brutally honest: most traders are going to get liquidated in the coming hours because they trade on gut instinct, not on actual order book data. My stance on $BTC is cautious, with a moderate bullish bias—but only if we manage to defend the macro psychological support level at $80,000. Technically, the market is oversold in the short term due to macroeconomic panic, but institutional flows remain unstable.
Don’t buy thinking that $BTC C’s bottom is guaranteed; there are no certainties in this business. If the price breaks decisively below the $80,000 support level with institutional liquidation volume, the structure will be completely invalidated, and the price will head for $75,000. Manage your risk, keep leverage to a minimum, and remember that accepting a small loss in time is the only way to survive long enough to see the next trend.
Follow me for more trading content.
#Bitcoi n #crypt o #Trading
180

·
--
See translation
{spot}(BTCUSDT)
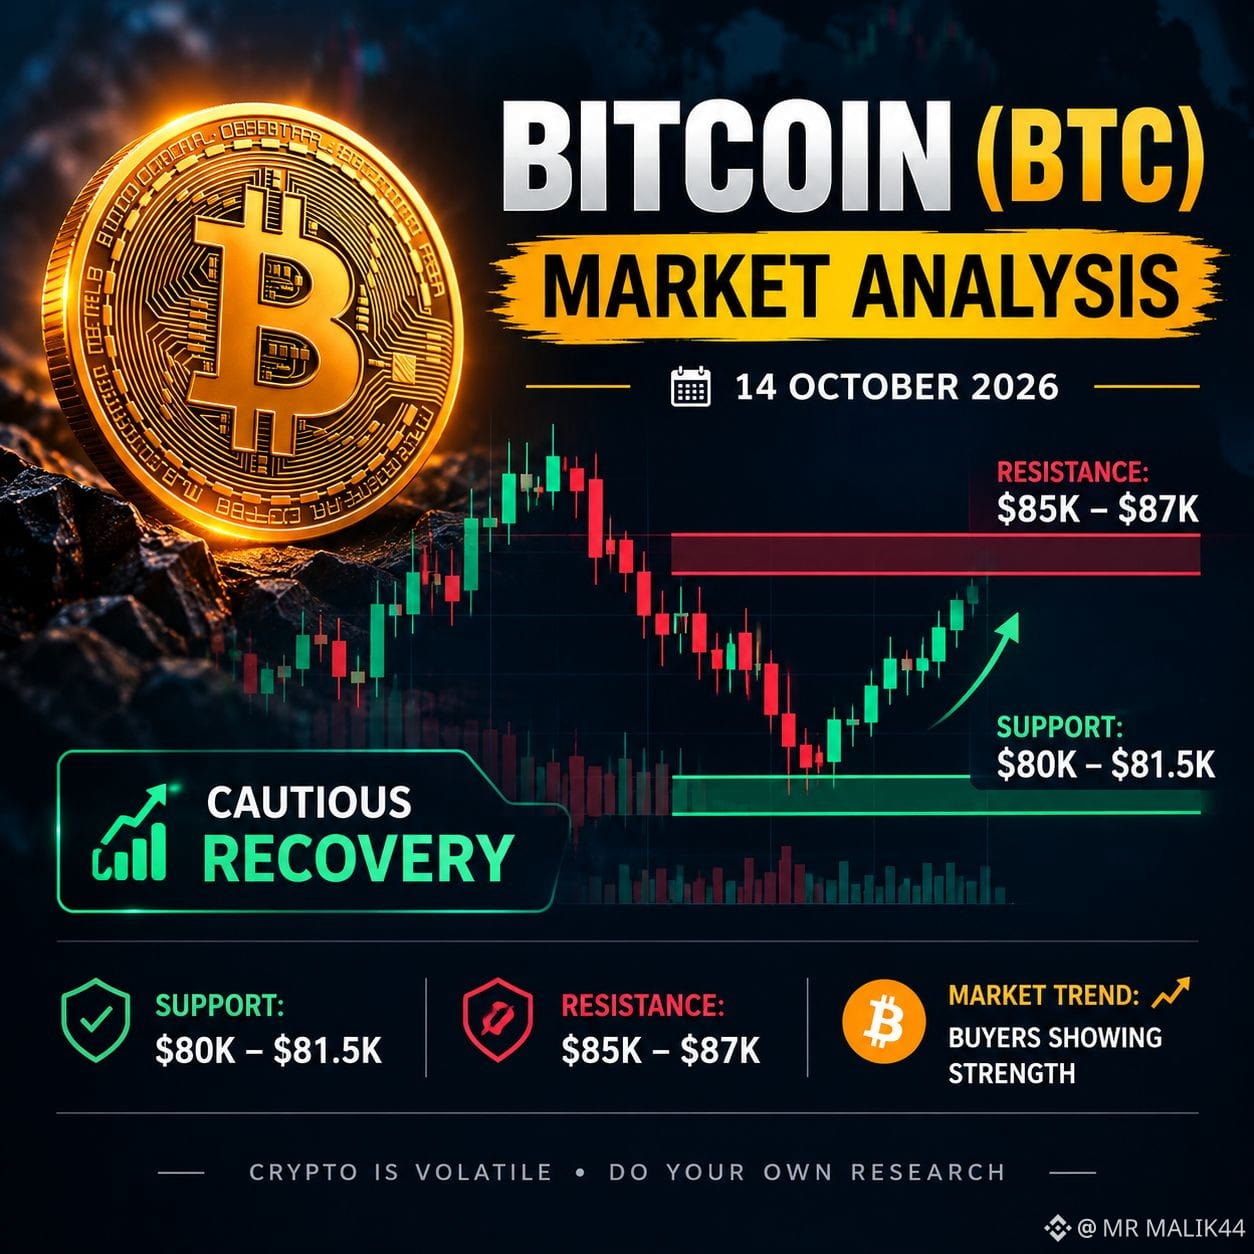
$BTC is showing signs of recovery after testing the $81,000 support zone.
🔹 Support: $80,000–$81,500
🔹 Resistance: $85,000–$87,000
🔹 Outlook: Cautious — a breakout above resistance could strengthen bullish momentum, while a break below support may lead to further downside.
⚠️ Risk Warning: Cryptocurrency is highly volatile. This is market commentary, not financial advice. Always do your own research before investing.
#Bitcoi #BTC #CryptoAnalysis #BinanceSquare #CPIWatch
$BTC is showing signs of recovery after testing the $81,000 support zone.
🔹 Support: $80,000–$81,500
🔹 Resistance: $85,000–$87,000
🔹 Outlook: Cautious — a breakout above resistance could strengthen bullish momentum, while a break below support may lead to further downside.
⚠️ Risk Warning: Cryptocurrency is highly volatile. This is market commentary, not financial advice. Always do your own research before investing.
#Bitcoi #BTC #CryptoAnalysis #BinanceSquare #CPIWatch
$BTC is showing signs of recovery after testing the $81,000 support zone.
🔹 Support: $80,000–$81,500
🔹 Resistance: $85,000–$87,000
🔹 Outlook: Cautious — a breakout above resistance could strengthen bullish momentum, while a break below support may lead to further downside.
⚠️ Risk Warning: Cryptocurrency is highly volatile. This is market commentary, not financial advice. Always do your own research before investing.
#Bitcoi #BTC #CryptoAnalysis #BinanceSquare #CPIWatch
98

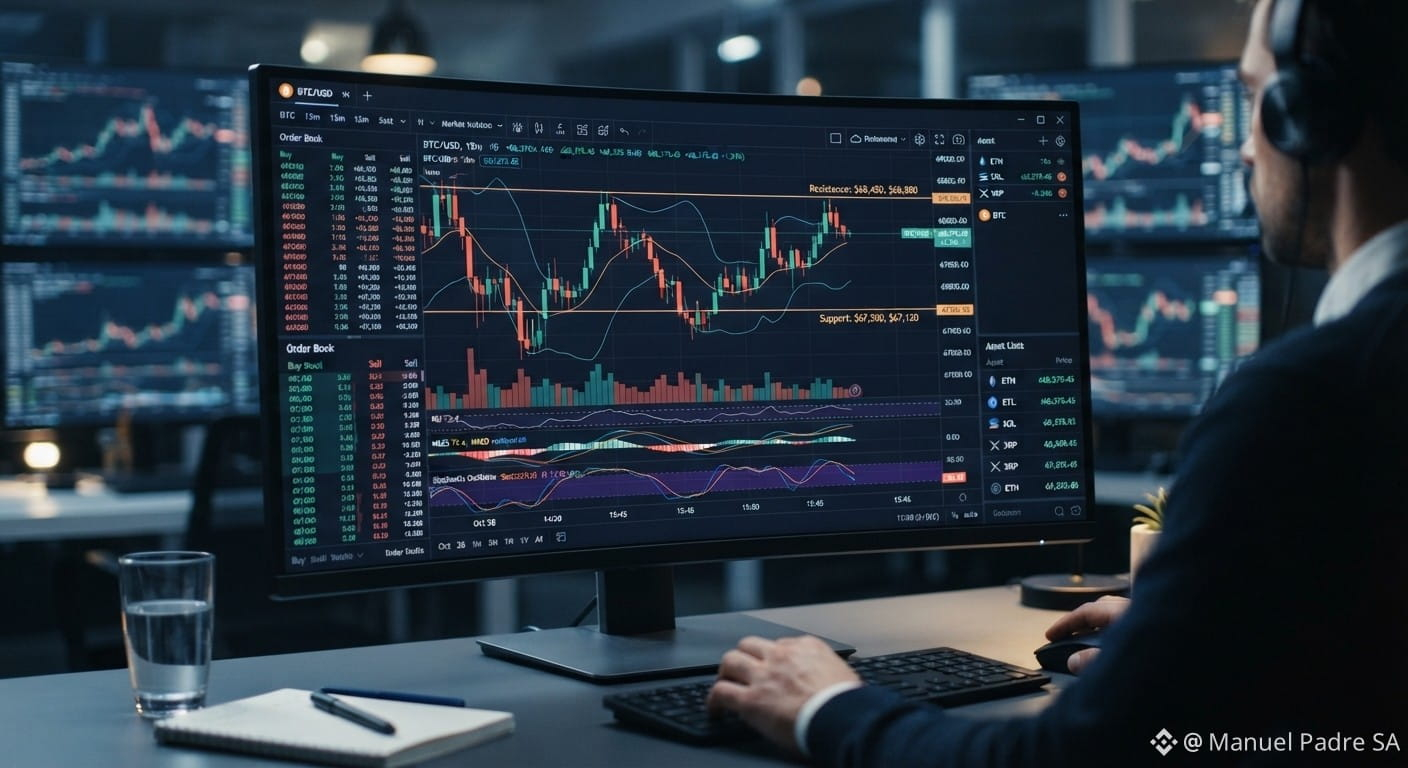
📊 #BTC Daily Update: The Market Under Macro Pressure
Bitcoin continues to consolidate and is testing important support areas. The macroeconomic landscape continues to put pressure on risk assets, driven by interest rate expectations and volatility in global markets.
What to watch today:
🎯 Short-Term Resistance: The $83,500–$84,000 area (a high-volume breakout is needed to sustain an upward move).
🛡️ Critical Support: The $75,000–$76,000 area (a crucial level to avoid deeper corrections).
⚡ Risk Alert: Leveraged altcoin positions continue to face significant liquidations as Bitcoin dominance rises.
💡 Strategy: During periods of macro uncertainty, risk management and the use of stop-losses are essential.
What’s your move today: buying the dip or waiting for confirmation? 👇
#Bitcoi n #CryptoAnalysis #BinanceSquare #Trading
📊 #BTC Daily Update: The Market Under Macro Pressure
Bitcoin continues to consolidate and is testing important support areas. The macroeconomic landscape continues to put pressure on risk assets, driven by interest rate expectations and volatility in global markets.
What to watch today:
🎯 Short-Term Resistance: The $83,500–$84,000 area (a high-volume breakout is needed to sustain an upward move).
🛡️ Critical Support: The $75,000–$76,000 area (a crucial level to avoid deeper corrections).
⚡ Risk Alert: Leveraged altcoin positions continue to face significant liquidations as Bitcoin dominance rises.
💡 Strategy: During periods of macro uncertainty, risk management and the use of stop-losses are essential.
What’s your move today: buying the dip or waiting for confirmation? 👇
#Bitcoi n #CryptoAnalysis #BinanceSquare #Trading
Bitcoin continues to consolidate and is testing important support areas. The macroeconomic landscape continues to put pressure on risk assets, driven by interest rate expectations and volatility in global markets.
What to watch today:
🎯 Short-Term Resistance: The $83,500–$84,000 area (a high-volume breakout is needed to sustain an upward move).
🛡️ Critical Support: The $75,000–$76,000 area (a crucial level to avoid deeper corrections).
⚡ Risk Alert: Leveraged altcoin positions continue to face significant liquidations as Bitcoin dominance rises.
💡 Strategy: During periods of macro uncertainty, risk management and the use of stop-losses are essential.
What’s your move today: buying the dip or waiting for confirmation? 👇
#Bitcoi n #CryptoAnalysis #BinanceSquare #Trading
90


Article
See translation
Bitcoin’s $84.7K Test: Recovery Toward $86.6K or Another Bull Trap?$BTC
{future}(BTCUSDT)
Bitcoin is recovering, but buyers still have an important level to clear before this bounce can develop into a stronger upside move.
Based on the October 12 chart captured at approximately 9:43 AM Pakistan time, BTCUSDT perpetual futures were trading near $84,065, with daily RSI around 55.80.
My near-term outlook is cautiously bullish while BTC holds the $83,458–$82,823 support area. The first upside test is around $84,677–$84,706. However, a recovery into resistance does not automatically confirm a full trend reversal.
These levels refer to the supplied market snapshot, rather than a continuously updated live price.
What is the daily chart telling us?
Bitcoin recently pulled back from the $86,600 region, briefly traded below $82,823, and then recovered above that level. Price has also moved back above $83,458, giving buyers an opportunity to rebuild momentum.
There is still a reason to remain selective: price appears to have slipped beneath the lower boundary of the previously drawn ascending channel. Recovering horizontal support is constructive, but reclaiming the channel and breaking resistance would provide stronger confirmation.
For now, I view this as a recovery attempt within the recent trading range.
Momentum is improving, but confirmation matters
Daily RSI has rebounded above 50 to approximately 55.80. My interpretation is that momentum has improved from the recent pullback, although this is not an exceptionally strong bullish reading.
The accompanying dashboard also records BTC perpetual RSI near 58 on the 4-hour timeframe and 62 on the 1-hour timeframe. Those earlier readings suggest improving shorter-term momentum.
RSI should support the price structure assessment, rather than serve as a standalone entry signal.
The current daily candle is still open. Its price, RSI and volume can change substantially before the close, so the unfinished candle should not be treated as confirmed breakout evidence.
The liquidity levels that matter
The supplied dashboard identifies two nearby areas to monitor:
• Upper liquidity: approximately $84,677–$84,706
• Lower liquidity: approximately $82,195–$82,236
These are potential reaction areas, not guaranteed destinations. Liquidity estimates can also change as positions are opened and closed.
If BTC reaches the upper zone, the key question is whether buyers can hold above it. A brief wick followed by a return below resistance would carry a different message from a sustained breakout and successful retest.
Key levels on my chart
• $84,677–$84,706: Immediate upside test.
• $86,606: Major resistance within the recent range.
• $87,200: Next overhead resistance.
• $88,308: Higher resistance if the recovery extends.
• $83,458: First important support.
• $82,823: Lower support and a key breakdown threshold.
• $82,195–$82,236: Dashboard’s lower liquidity area.
• $80,963: Next major chart support.
• $79,719: Deeper downside support.
The higher targets would require follow-through and could take more than one session to reach.
My preferred bullish scenario
If BTC continues holding above $83,458, I would watch for a move toward $84,700.
A confirmed break above that zone, followed by a retest that holds, would strengthen the case for a recovery toward $86,606. Beyond that, $87,200 and $88,308 become relevant.
However, buying directly into $84,700 before confirmation leaves the trade exposed to rejection at the first resistance.
Conditional trade signal: Breakout long
• Trigger: A 1-hour candle closes above $84,750, followed by a successful retest.
• Planned entry zone: $84,650–$84,800, only after the retest shows support.
• Stop-loss: $84,150.
• Take-profit 1: $85,500 — an intermediate profit-taking level.
• Take-profit 2: $86,600.
• Take-profit 3: $87,200.
Using an example entry of $84,700, the risk is $550 per BTC. The approximate reward-to-risk ratios are 1.45R, 3.45R and 4.55R, before fees and slippage.
This setup is not active simply because price touches the entry zone. Without the breakout and successful retest, there is no confirmed long entry.
What would weaken the recovery?
A move back below $83,458 would be an early warning that buyers are losing control.
A confirmed breakdown below $82,823 would weaken the bullish scenario more clearly and bring the lower liquidity area near $82,236 into focus. Continued selling could then expose $80,963.
Conditional trade signal: Breakdown short
• Trigger: A 1-hour candle closes below $82,800, followed by a failed attempt to reclaim $82,823.
• Planned entry zone: $82,700–$82,850, after rejection is confirmed.
• Stop-loss: $83,300.
• Take-profit 1: $82,250.
• Take-profit 2: $80,963.
• Take-profit 3: $79,719.
Using an example entry of $82,800, risk is $500 per BTC. The approximate reward-to-risk ratios are 1.10R, 3.67R and 6.16R, before fees and slippage.
The first target is close, so the setup depends on sufficient room for continuation. Avoid chasing a sharp drop after price has already reached the first target.
How I would manage these setups
These are alternative scenarios, not instructions to open both trades. I would wait for the market to activate one clearly.
Keep risk small—for example, 0.5% of account equity on a single idea—and calculate position size from the stop-loss distance. Leverage does not reduce the underlying risk. Never widen the stop to keep a losing position open.
My working bias remains a recovery toward $84.7K while support holds. Acceptance above that level would improve the outlook toward $86.6K. Losing $82.8K would shift my attention back toward downside continuation.
Are you watching a confirmed breakout above $84.7K, or waiting for another support test?
Educational market commentary only. These are conditional trade plans, not guaranteed outcomes.
#Bitcoi #btc70k #BTCUSDTAnalysis #CryptoTradingInsights #BitcoinAnalysis2026 $BNB
Bitcoin’s $84.7K Test: Recovery Toward $86.6K or Another Bull Trap?
$BTC
Bitcoin is recovering, but buyers still have an important level to clear before this bounce can develop into a stronger upside move.
Based on the October 12 chart captured at approximately 9:43 AM Pakistan time, BTCUSDT perpetual futures were trading near $84,065, with daily RSI around 55.80.
My near-term outlook is cautiously bullish while BTC holds the $83,458–$82,823 support area. The first upside test is around $84,677–$84,706. However, a recovery into resistance does not automatically confirm a full trend reversal.
These levels refer to the supplied market snapshot, rather than a continuously updated live price.
What is the daily chart telling us?
Bitcoin recently pulled back from the $86,600 region, briefly traded below $82,823, and then recovered above that level. Price has also moved back above $83,458, giving buyers an opportunity to rebuild momentum.
There is still a reason to remain selective: price appears to have slipped beneath the lower boundary of the previously drawn ascending channel. Recovering horizontal support is constructive, but reclaiming the channel and breaking resistance would provide stronger confirmation.
For now, I view this as a recovery attempt within the recent trading range.
Momentum is improving, but confirmation matters
Daily RSI has rebounded above 50 to approximately 55.80. My interpretation is that momentum has improved from the recent pullback, although this is not an exceptionally strong bullish reading.
The accompanying dashboard also records BTC perpetual RSI near 58 on the 4-hour timeframe and 62 on the 1-hour timeframe. Those earlier readings suggest improving shorter-term momentum.
RSI should support the price structure assessment, rather than serve as a standalone entry signal.
The current daily candle is still open. Its price, RSI and volume can change substantially before the close, so the unfinished candle should not be treated as confirmed breakout evidence.
The liquidity levels that matter
The supplied dashboard identifies two nearby areas to monitor:
• Upper liquidity: approximately $84,677–$84,706
• Lower liquidity: approximately $82,195–$82,236
These are potential reaction areas, not guaranteed destinations. Liquidity estimates can also change as positions are opened and closed.
If BTC reaches the upper zone, the key question is whether buyers can hold above it. A brief wick followed by a return below resistance would carry a different message from a sustained breakout and successful retest.
Key levels on my chart
• $84,677–$84,706: Immediate upside test.
• $86,606: Major resistance within the recent range.
• $87,200: Next overhead resistance.
• $88,308: Higher resistance if the recovery extends.
• $83,458: First important support.
• $82,823: Lower support and a key breakdown threshold.
• $82,195–$82,236: Dashboard’s lower liquidity area.
• $80,963: Next major chart support.
• $79,719: Deeper downside support.
The higher targets would require follow-through and could take more than one session to reach.
My preferred bullish scenario
If BTC continues holding above $83,458, I would watch for a move toward $84,700.
A confirmed break above that zone, followed by a retest that holds, would strengthen the case for a recovery toward $86,606. Beyond that, $87,200 and $88,308 become relevant.
However, buying directly into $84,700 before confirmation leaves the trade exposed to rejection at the first resistance.
Conditional trade signal: Breakout long
• Trigger: A 1-hour candle closes above $84,750, followed by a successful retest.
• Planned entry zone: $84,650–$84,800, only after the retest shows support.
• Stop-loss: $84,150.
• Take-profit 1: $85,500 — an intermediate profit-taking level.
• Take-profit 2: $86,600.
• Take-profit 3: $87,200.
Using an example entry of $84,700, the risk is $550 per BTC. The approximate reward-to-risk ratios are 1.45R, 3.45R and 4.55R, before fees and slippage.
This setup is not active simply because price touches the entry zone. Without the breakout and successful retest, there is no confirmed long entry.
What would weaken the recovery?
A move back below $83,458 would be an early warning that buyers are losing control.
A confirmed breakdown below $82,823 would weaken the bullish scenario more clearly and bring the lower liquidity area near $82,236 into focus. Continued selling could then expose $80,963.
Conditional trade signal: Breakdown short
• Trigger: A 1-hour candle closes below $82,800, followed by a failed attempt to reclaim $82,823.
• Planned entry zone: $82,700–$82,850, after rejection is confirmed.
• Stop-loss: $83,300.
• Take-profit 1: $82,250.
• Take-profit 2: $80,963.
• Take-profit 3: $79,719.
Using an example entry of $82,800, risk is $500 per BTC. The approximate reward-to-risk ratios are 1.10R, 3.67R and 6.16R, before fees and slippage.
The first target is close, so the setup depends on sufficient room for continuation. Avoid chasing a sharp drop after price has already reached the first target.
How I would manage these setups
These are alternative scenarios, not instructions to open both trades. I would wait for the market to activate one clearly.
Keep risk small—for example, 0.5% of account equity on a single idea—and calculate position size from the stop-loss distance. Leverage does not reduce the underlying risk. Never widen the stop to keep a losing position open.
My working bias remains a recovery toward $84.7K while support holds. Acceptance above that level would improve the outlook toward $86.6K. Losing $82.8K would shift my attention back toward downside continuation.
Are you watching a confirmed breakout above $84.7K, or waiting for another support test?
Educational market commentary only. These are conditional trade plans, not guaranteed outcomes.
#Bitcoi #btc70k #BTCUSDTAnalysis #CryptoTradingInsights #BitcoinAnalysis2026 $BNB
Bitcoin is recovering, but buyers still have an important level to clear before this bounce can develop into a stronger upside move.
Based on the October 12 chart captured at approximately 9:43 AM Pakistan time, BTCUSDT perpetual futures were trading near $84,065, with daily RSI around 55.80.
My near-term outlook is cautiously bullish while BTC holds the $83,458–$82,823 support area. The first upside test is around $84,677–$84,706. However, a recovery into resistance does not automatically confirm a full trend reversal.
These levels refer to the supplied market snapshot, rather than a continuously updated live price.
What is the daily chart telling us?
Bitcoin recently pulled back from the $86,600 region, briefly traded below $82,823, and then recovered above that level. Price has also moved back above $83,458, giving buyers an opportunity to rebuild momentum.
There is still a reason to remain selective: price appears to have slipped beneath the lower boundary of the previously drawn ascending channel. Recovering horizontal support is constructive, but reclaiming the channel and breaking resistance would provide stronger confirmation.
For now, I view this as a recovery attempt within the recent trading range.
Momentum is improving, but confirmation matters
Daily RSI has rebounded above 50 to approximately 55.80. My interpretation is that momentum has improved from the recent pullback, although this is not an exceptionally strong bullish reading.
The accompanying dashboard also records BTC perpetual RSI near 58 on the 4-hour timeframe and 62 on the 1-hour timeframe. Those earlier readings suggest improving shorter-term momentum.
RSI should support the price structure assessment, rather than serve as a standalone entry signal.
The current daily candle is still open. Its price, RSI and volume can change substantially before the close, so the unfinished candle should not be treated as confirmed breakout evidence.
The liquidity levels that matter
The supplied dashboard identifies two nearby areas to monitor:
• Upper liquidity: approximately $84,677–$84,706
• Lower liquidity: approximately $82,195–$82,236
These are potential reaction areas, not guaranteed destinations. Liquidity estimates can also change as positions are opened and closed.
If BTC reaches the upper zone, the key question is whether buyers can hold above it. A brief wick followed by a return below resistance would carry a different message from a sustained breakout and successful retest.
Key levels on my chart
• $84,677–$84,706: Immediate upside test.
• $86,606: Major resistance within the recent range.
• $87,200: Next overhead resistance.
• $88,308: Higher resistance if the recovery extends.
• $83,458: First important support.
• $82,823: Lower support and a key breakdown threshold.
• $82,195–$82,236: Dashboard’s lower liquidity area.
• $80,963: Next major chart support.
• $79,719: Deeper downside support.
The higher targets would require follow-through and could take more than one session to reach.
My preferred bullish scenario
If BTC continues holding above $83,458, I would watch for a move toward $84,700.
A confirmed break above that zone, followed by a retest that holds, would strengthen the case for a recovery toward $86,606. Beyond that, $87,200 and $88,308 become relevant.
However, buying directly into $84,700 before confirmation leaves the trade exposed to rejection at the first resistance.
Conditional trade signal: Breakout long
• Trigger: A 1-hour candle closes above $84,750, followed by a successful retest.
• Planned entry zone: $84,650–$84,800, only after the retest shows support.
• Stop-loss: $84,150.
• Take-profit 1: $85,500 — an intermediate profit-taking level.
• Take-profit 2: $86,600.
• Take-profit 3: $87,200.
Using an example entry of $84,700, the risk is $550 per BTC. The approximate reward-to-risk ratios are 1.45R, 3.45R and 4.55R, before fees and slippage.
This setup is not active simply because price touches the entry zone. Without the breakout and successful retest, there is no confirmed long entry.
What would weaken the recovery?
A move back below $83,458 would be an early warning that buyers are losing control.
A confirmed breakdown below $82,823 would weaken the bullish scenario more clearly and bring the lower liquidity area near $82,236 into focus. Continued selling could then expose $80,963.
Conditional trade signal: Breakdown short
• Trigger: A 1-hour candle closes below $82,800, followed by a failed attempt to reclaim $82,823.
• Planned entry zone: $82,700–$82,850, after rejection is confirmed.
• Stop-loss: $83,300.
• Take-profit 1: $82,250.
• Take-profit 2: $80,963.
• Take-profit 3: $79,719.
Using an example entry of $82,800, risk is $500 per BTC. The approximate reward-to-risk ratios are 1.10R, 3.67R and 6.16R, before fees and slippage.
The first target is close, so the setup depends on sufficient room for continuation. Avoid chasing a sharp drop after price has already reached the first target.
How I would manage these setups
These are alternative scenarios, not instructions to open both trades. I would wait for the market to activate one clearly.
Keep risk small—for example, 0.5% of account equity on a single idea—and calculate position size from the stop-loss distance. Leverage does not reduce the underlying risk. Never widen the stop to keep a losing position open.
My working bias remains a recovery toward $84.7K while support holds. Acceptance above that level would improve the outlook toward $86.6K. Losing $82.8K would shift my attention back toward downside continuation.
Are you watching a confirmed breakout above $84.7K, or waiting for another support test?
Educational market commentary only. These are conditional trade plans, not guaranteed outcomes.
#Bitcoi #btc70k #BTCUSDTAnalysis #CryptoTradingInsights #BitcoinAnalysis2026 $BNB
94

·
--
See translation
#RussiaRequiresCryptoMinersToSeekFourthCategoryGridConnections
🇷🇺 Russia is tightening electricity rules for Bitcoin miners — and power access could become a bigger risk.
Under the reported new rules, crypto miners must request grid connections under the “Fourth Category,” putting them at risk of mandatory power cuts when the electricity system comes under stress.
That could change the economics of mining operations, especially in energy-intensive regions like Siberia.
⚠️ Here’s what matters for the industry:
⚡ Power risk: Miners could face interruptions when electricity demand spikes.
📉 Profitability pressure: Forced shutdowns could reduce operating efficiency and squeeze margins.
🌍 Migration risk: Operators may consider jurisdictions offering more predictable access to electricity and regulation.
The bigger picture? Bitcoin mining isn't just about $BTC prices and ASIC efficiency anymore. Access to reliable, affordable power can be just as important.
👀 If more regions adopt similar restrictions, could electricity access become one of the biggest factors shaping where Bitcoin mining happens?
$BTC
{spot}(BTCUSDT)
#Bitcoi #BTC #BitcoinMining #Russia #CryptoNews
#RussiaRequiresCryptoMinersToSeekFourthCategoryGridConnections
🇷🇺 Russia is tightening electricity rules for Bitcoin miners — and power access could become a bigger risk.
Under the reported new rules, crypto miners must request grid connections under the “Fourth Category,” putting them at risk of mandatory power cuts when the electricity system comes under stress.
That could change the economics of mining operations, especially in energy-intensive regions like Siberia.
⚠️ Here’s what matters for the industry:
⚡ Power risk: Miners could face interruptions when electricity demand spikes.
📉 Profitability pressure: Forced shutdowns could reduce operating efficiency and squeeze margins.
🌍 Migration risk: Operators may consider jurisdictions offering more predictable access to electricity and regulation.
The bigger picture? Bitcoin mining isn't just about $BTC prices and ASIC efficiency anymore. Access to reliable, affordable power can be just as important.
👀 If more regions adopt similar restrictions, could electricity access become one of the biggest factors shaping where Bitcoin mining happens?
$BTC
#Bitcoi #BTC #BitcoinMining #Russia #CryptoNews
🇷🇺 Russia is tightening electricity rules for Bitcoin miners — and power access could become a bigger risk.
Under the reported new rules, crypto miners must request grid connections under the “Fourth Category,” putting them at risk of mandatory power cuts when the electricity system comes under stress.
That could change the economics of mining operations, especially in energy-intensive regions like Siberia.
⚠️ Here’s what matters for the industry:
⚡ Power risk: Miners could face interruptions when electricity demand spikes.
📉 Profitability pressure: Forced shutdowns could reduce operating efficiency and squeeze margins.
🌍 Migration risk: Operators may consider jurisdictions offering more predictable access to electricity and regulation.
The bigger picture? Bitcoin mining isn't just about $BTC prices and ASIC efficiency anymore. Access to reliable, affordable power can be just as important.
👀 If more regions adopt similar restrictions, could electricity access become one of the biggest factors shaping where Bitcoin mining happens?
$BTC
#Bitcoi #BTC #BitcoinMining #Russia #CryptoNews

119


Article
Whale Moves on Binance: What Does the CDD Indicator Tell Us About the $BTC Price?Are you wondering what’s happening behind the scenes of Bitcoin price movement? Let’s take a closer look at the data!
Looking at the attached chart for the Binance Exchange Inflow CDD indicator, we notice very important indications
🔹 What do we see in the chart?
The black line chart (Bitcoin price $BTC) is shown versus the green bars, which represent the "Coin Days Destroyed" (CDD) indicator when they enter the platform
Whale Moves on Binance: What Does the CDD Indicator Tell Us About the $BTC Price?
Are you wondering what’s happening behind the scenes of Bitcoin price movement? Let’s take a closer look at the data!
Looking at the attached chart for the Binance Exchange Inflow CDD indicator, we notice very important indications
🔹 What do we see in the chart?
The black line chart (Bitcoin price $BTC ) is shown versus the green bars, which represent the "Coin Days Destroyed" (CDD) indicator when they enter the platform
Looking at the attached chart for the Binance Exchange Inflow CDD indicator, we notice very important indications
🔹 What do we see in the chart?
The black line chart (Bitcoin price $BTC ) is shown versus the green bars, which represent the "Coin Days Destroyed" (CDD) indicator when they enter the platform
65

See translation
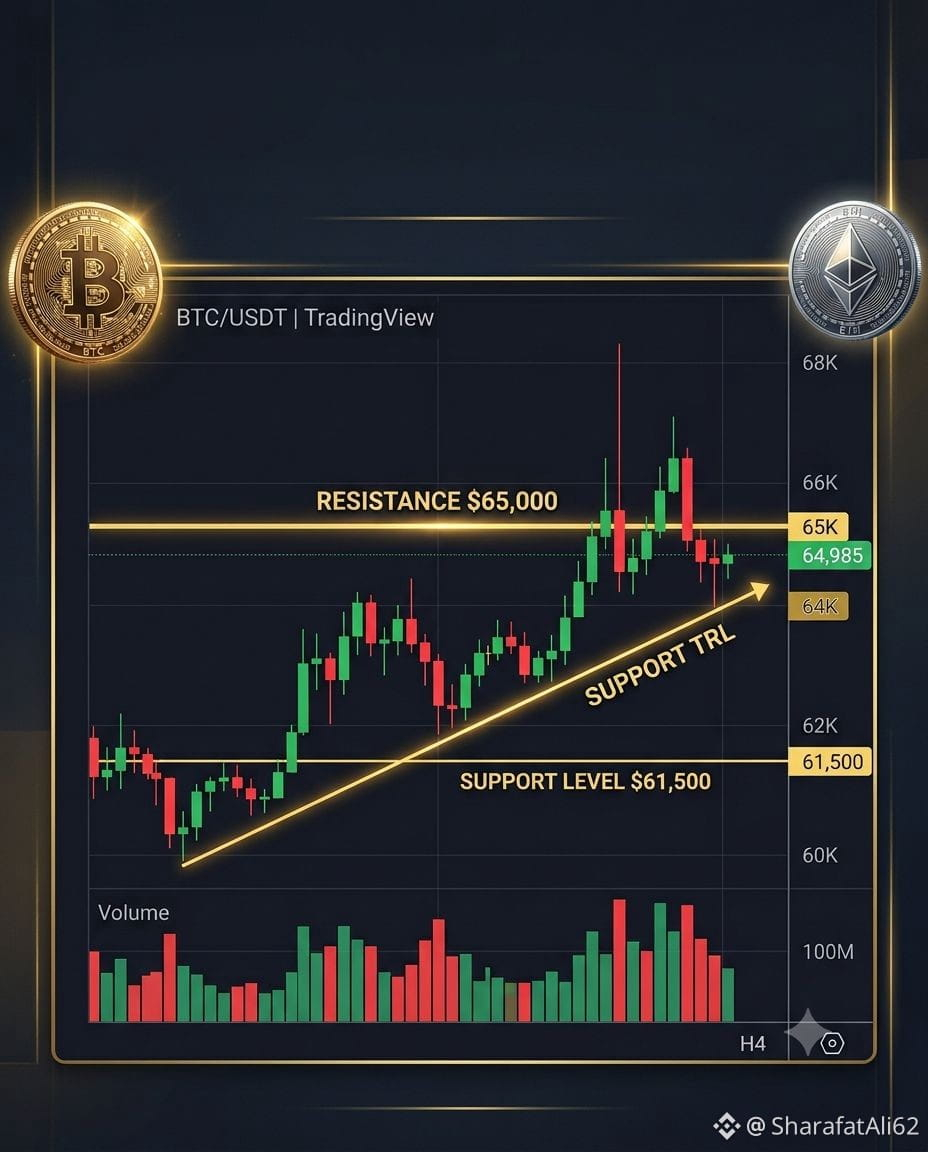
🚨 $Bitcoin Tests Key Resistance Near $65K. Bitcoin is approaching a major resistance level near 65K, while Ethereum continues to show relatively stronger momentum. Traders are closely watching this zone for a confirmed breakout or a possible rejection. 📊 My Analysis: A breakout above resistance could improve short-term market sentiment, however confirmation through price action and trading volume is important before making trading decisions. ❓ Question: What do you think? Will Bitcoin break above65K or will sellers defend this level once again? Share your thoughts below. 💲
: $BTC $ETH $BNB #hashtags : #Bitcoi , #Ethereum , #crypto , #DYOR*
{spot}(ETHUSDT)
🚨 $Bitcoin Tests Key Resistance Near $65K. Bitcoin is approaching a major resistance level near 65K, while Ethereum continues to show relatively stronger momentum. Traders are closely watching this zone for a confirmed breakout or a possible rejection. 📊 My Analysis: A breakout above resistance could improve short-term market sentiment, however confirmation through price action and trading volume is important before making trading decisions. ❓ Question: What do you think? Will Bitcoin break above65K or will sellers defend this level once again? Share your thoughts below. 💲
: $BTC $ETH $BNB #hashtags : #Bitcoi , #Ethereum , #crypto , #DYOR*
: $BTC $ETH $BNB #hashtags : #Bitcoi , #Ethereum , #crypto , #DYOR*
127

See translation
🚨 BITCOIN IS GETTING READY FOR A BIG MOVE?
The market is quiet… but that doesn't mean nothing is happening. 👀
Big moves often come after periods of low volatility.
Watch these 3 things:
📊 Volume
💧 Liquidity
📈 Market Structure
Don't FOMO into the move.
Wait for confirmation — then act. 🧠
What do you think comes next?
🟢 BREAKOUT
🔴 BREAKDOWN
🟡 MORE SIDEWAYS
$BTC
{future}(BTCUSDT)
$ETH
{spot}(ETHUSDT)
$BNB
{future}(BNBUSDT)
#Bitcoi n #BTC #crypto #BinanceSquar #CryptoTrading
🚨 BITCOIN IS GETTING READY FOR A BIG MOVE?
The market is quiet… but that doesn't mean nothing is happening. 👀
Big moves often come after periods of low volatility.
Watch these 3 things:
📊 Volume
💧 Liquidity
📈 Market Structure
Don't FOMO into the move.
Wait for confirmation — then act. 🧠
What do you think comes next?
🟢 BREAKOUT
🔴 BREAKDOWN
🟡 MORE SIDEWAYS
$BTC
$ETH
$BNB
#Bitcoi n #BTC #crypto #BinanceSquar #CryptoTrading
The market is quiet… but that doesn't mean nothing is happening. 👀
Big moves often come after periods of low volatility.
Watch these 3 things:
📊 Volume
💧 Liquidity
📈 Market Structure
Don't FOMO into the move.
Wait for confirmation — then act. 🧠
What do you think comes next?
🟢 BREAKOUT
🔴 BREAKDOWN
🟡 MORE SIDEWAYS
$BTC
$ETH
$BNB
#Bitcoi n #BTC #crypto #BinanceSquar #CryptoTrading
111

·
--
🚀 **Technical Analysis $BTC – Upcoming Buy Opportunity?**
Hello my dear followers! 🙌
Bitcoin is currently trading at **$94,475.89** with a bullish trend on the hourly timeframe.
📊 **Technical Indicators:**
- ✅ RSI at 62 (Safe buy zone)
- ✅ 50 Moving Average trending upwards
- ✅ Strong support at $93,500
🎯 **My Strategy:**
- Buy entry on a breakout at $95,000
- First target: $96,200
- Second target: $97,500
- Stop loss: $93,000
📈 **Actual Trade I Made Today:**
I went long with 0.1 BTC at $94,200 and achieved a profit of +2.3%, thank God.
💡 **My Advice:** Never enter without a Stop Loss! Risk management is key.
What do you think of my analysis? Share your predictions in the comments 👇
#BTC #Bitcoi #تحليل_فني #TradersShiftBTCToStablecoins
#BTC
{spot}(BTCUSDT)
$BTC
🚀 **Technical Analysis $BTC – Upcoming Buy Opportunity?**
Hello my dear followers! 🙌
Bitcoin is currently trading at **$94,475.89** with a bullish trend on the hourly timeframe.
📊 **Technical Indicators:**
- ✅ RSI at 62 (Safe buy zone)
- ✅ 50 Moving Average trending upwards
- ✅ Strong support at $93,500
🎯 **My Strategy:**
- Buy entry on a breakout at $95,000
- First target: $96,200
- Second target: $97,500
- Stop loss: $93,000
📈 **Actual Trade I Made Today:**
I went long with 0.1 BTC at $94,200 and achieved a profit of +2.3%, thank God.
💡 **My Advice:** Never enter without a Stop Loss! Risk management is key.
What do you think of my analysis? Share your predictions in the comments 👇
#BTC #Bitcoi #تحليل_فني #TradersShiftBTCToStablecoins
#BTC
$BTC
Hello my dear followers! 🙌
Bitcoin is currently trading at **$94,475.89** with a bullish trend on the hourly timeframe.
📊 **Technical Indicators:**
- ✅ RSI at 62 (Safe buy zone)
- ✅ 50 Moving Average trending upwards
- ✅ Strong support at $93,500
🎯 **My Strategy:**
- Buy entry on a breakout at $95,000
- First target: $96,200
- Second target: $97,500
- Stop loss: $93,000
📈 **Actual Trade I Made Today:**
I went long with 0.1 BTC at $94,200 and achieved a profit of +2.3%, thank God.
💡 **My Advice:** Never enter without a Stop Loss! Risk management is key.
What do you think of my analysis? Share your predictions in the comments 👇
#BTC #Bitcoi #تحليل_فني #TradersShiftBTCToStablecoins
#BTC
$BTC
1
135

·
--
Bullish
See translation
🧠 5 Simple Facts About Bitcoin
Bitcoin is a decentralized digital currency that operates without a central bank.
🔹 Bitcoin uses blockchain technology
🔹 The maximum supply is 21 million BTC
🔹 Transactions are recorded on the blockchain
🔹 BTC price changes based on market demand and supply
🔹 Always do your own research before making crypto decisions
When did you first hear about Bitcoin? 👇
#Bitcoi #BTC #cryptouniverseofficial #CryptoEducation💡🚀 #BinanceSquare $NVDAB $AAPLB $NVDA.US
🧠 5 Simple Facts About Bitcoin
Bitcoin is a decentralized digital currency that operates without a central bank.
🔹 Bitcoin uses blockchain technology
🔹 The maximum supply is 21 million BTC
🔹 Transactions are recorded on the blockchain
🔹 BTC price changes based on market demand and supply
🔹 Always do your own research before making crypto decisions
When did you first hear about Bitcoin? 👇
#Bitcoi #BTC #cryptouniverseofficial #CryptoEducation💡🚀 #BinanceSquare $NVDAB $AAPLB $NVDA.US
Bitcoin is a decentralized digital currency that operates without a central bank.
🔹 Bitcoin uses blockchain technology
🔹 The maximum supply is 21 million BTC
🔹 Transactions are recorded on the blockchain
🔹 BTC price changes based on market demand and supply
🔹 Always do your own research before making crypto decisions
When did you first hear about Bitcoin? 👇
#Bitcoi #BTC #cryptouniverseofficial #CryptoEducation💡🚀 #BinanceSquare $NVDAB $AAPLB $NVDA.US
96

·
--
Article
See translation
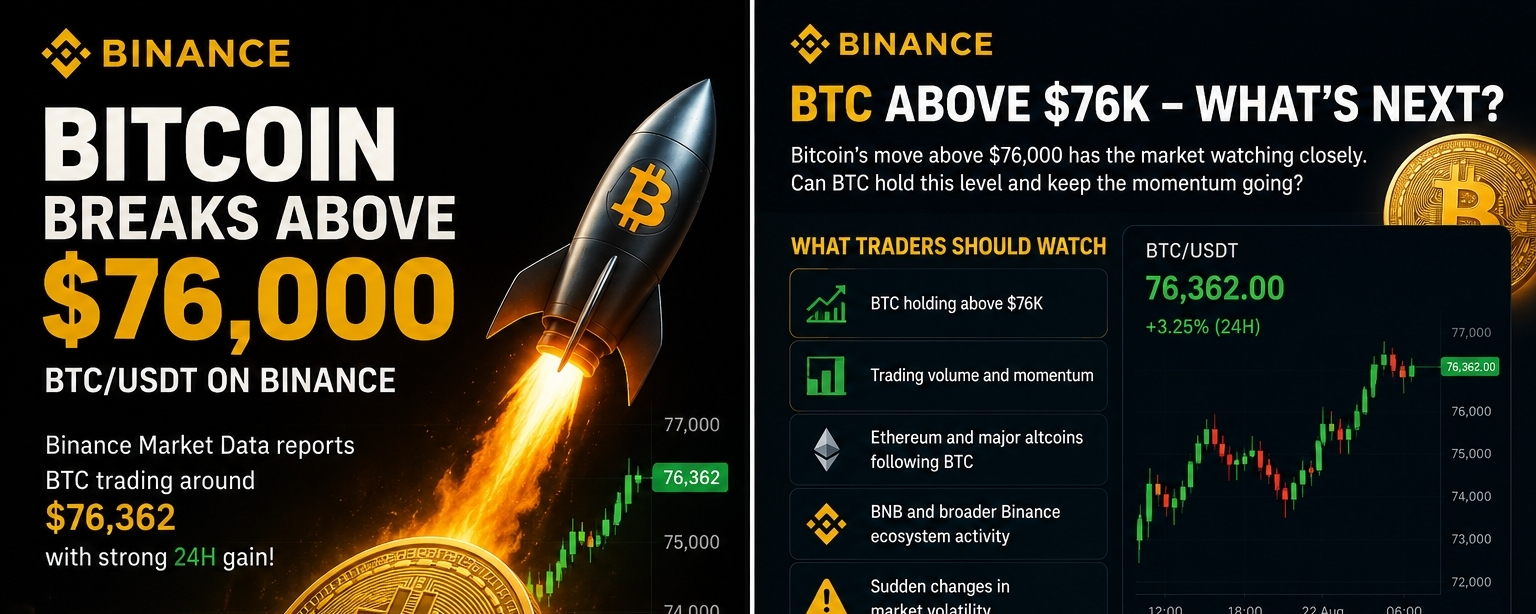
Bitcoin Breaks $76K: Is the Next Crypto Move Starting?Bitcoin is back in the spotlight after moving above the $76,000 USDT level on Binance. Binance Market Data reported BTC trading around $76,362, with a strong 24-hour gain at the time of its update.
Why This Move Matters
A move above a major psychological level like $76,000 can attract renewed attention from traders and investors. Strong price momentum can also increase volatility, meaning both opportunities and risks can rise quickly.
The bigger question now is whether Bitcoin can hold above $NVDAB 76K rather than simply touch the level.
If buyers maintain momentum, the market could continue watching higher resistance zones. But if Bitcoin falls back below the breakout area, traders may look for signs that the move was only temporary.
What Traders Should Watch
🔹 BTC holding above $NVDAB 76K
🔹 Trading volume and momentum
🔹 Ethereum and major altcoins following BTC
🔹 BNB and broader Binance ecosystem activity
🔹 Sudden changes in market volatility
Binance has also recently been making a number of market and listing-related updates, including spot-pair removals and other trading changes, so traders should check official announcements before acting on individual tokens.
Final Thoughts
Bitcoin’s move above $NVDAB 76,000 has put the crypto market back under the spotlight. The key now is confirmation: can BTC stay above this level and build further momentum?
Crypto markets can move rapidly in either direction, so traders should manage risk carefully and avoid treating short-term price action as a guaranteed prediction.
What do you think — will Bitcoin hold above $76K or see a pullback? 👇
#Bitcoi n #BTC #Binan ce #Crypt o #CryptoNews #BinanceSquar e #Altc #BNB
Bitcoin Breaks $76K: Is the Next Crypto Move Starting?
Bitcoin is back in the spotlight after moving above the $76,000 USDT level on Binance. Binance Market Data reported BTC trading around $76,362, with a strong 24-hour gain at the time of its update.
Why This Move Matters
A move above a major psychological level like $76,000 can attract renewed attention from traders and investors. Strong price momentum can also increase volatility, meaning both opportunities and risks can rise quickly.
The bigger question now is whether Bitcoin can hold above $NVDAB 76K rather than simply touch the level.
If buyers maintain momentum, the market could continue watching higher resistance zones. But if Bitcoin falls back below the breakout area, traders may look for signs that the move was only temporary.
What Traders Should Watch
🔹 BTC holding above $NVDAB 76K
🔹 Trading volume and momentum
🔹 Ethereum and major altcoins following BTC
🔹 BNB and broader Binance ecosystem activity
🔹 Sudden changes in market volatility
Binance has also recently been making a number of market and listing-related updates, including spot-pair removals and other trading changes, so traders should check official announcements before acting on individual tokens.
Final Thoughts
Bitcoin’s move above $NVDAB 76,000 has put the crypto market back under the spotlight. The key now is confirmation: can BTC stay above this level and build further momentum?
Crypto markets can move rapidly in either direction, so traders should manage risk carefully and avoid treating short-term price action as a guaranteed prediction.
What do you think — will Bitcoin hold above $76K or see a pullback? 👇
#Bitcoi n #BTC #Binan ce #Crypt o #CryptoNews #BinanceSquar e #Altc #BNB
Why This Move Matters
A move above a major psychological level like $76,000 can attract renewed attention from traders and investors. Strong price momentum can also increase volatility, meaning both opportunities and risks can rise quickly.
The bigger question now is whether Bitcoin can hold above $NVDAB 76K rather than simply touch the level.
If buyers maintain momentum, the market could continue watching higher resistance zones. But if Bitcoin falls back below the breakout area, traders may look for signs that the move was only temporary.
What Traders Should Watch
🔹 BTC holding above $NVDAB 76K
🔹 Trading volume and momentum
🔹 Ethereum and major altcoins following BTC
🔹 BNB and broader Binance ecosystem activity
🔹 Sudden changes in market volatility
Binance has also recently been making a number of market and listing-related updates, including spot-pair removals and other trading changes, so traders should check official announcements before acting on individual tokens.
Final Thoughts
Bitcoin’s move above $NVDAB 76,000 has put the crypto market back under the spotlight. The key now is confirmation: can BTC stay above this level and build further momentum?
Crypto markets can move rapidly in either direction, so traders should manage risk carefully and avoid treating short-term price action as a guaranteed prediction.
What do you think — will Bitcoin hold above $76K or see a pullback? 👇
#Bitcoi n #BTC #Binan ce #Crypt o #CryptoNews #BinanceSquar e #Altc #BNB
1
132


Article
What Is Bitcoin and Why It Still Matters in 2026When you hear the word Bitcoin, you probably think about investments or people who became millionaires. However, Bitcoin represents much more than a cryptocurrency: it was the first decentralized digital money system, designed to work without relying on banks or governments.
In 2026, Bitcoin continues to be the most well-known digital asset and a reference point for the entire cryptocurrency market.
What is Bitcoin?
Bitcoin (BTC) is a digital currency created in 2009 by an individual or group under the pseudonym Satoshi Nakamoto.
What Is Bitcoin and Why It Still Matters in 2026
When you hear the word Bitcoin, you probably think about investments or people who became millionaires. However, Bitcoin represents much more than a cryptocurrency: it was the first decentralized digital money system, designed to work without relying on banks or governments.
In 2026, Bitcoin continues to be the most well-known digital asset and a reference point for the entire cryptocurrency market.
What is Bitcoin?
Bitcoin (BTC) is a digital currency created in 2009 by an individual or group under the pseudonym Satoshi Nakamoto.
In 2026, Bitcoin continues to be the most well-known digital asset and a reference point for the entire cryptocurrency market.
What is Bitcoin?
Bitcoin (BTC) is a digital currency created in 2009 by an individual or group under the pseudonym Satoshi Nakamoto.
2
315


·
--
See translation
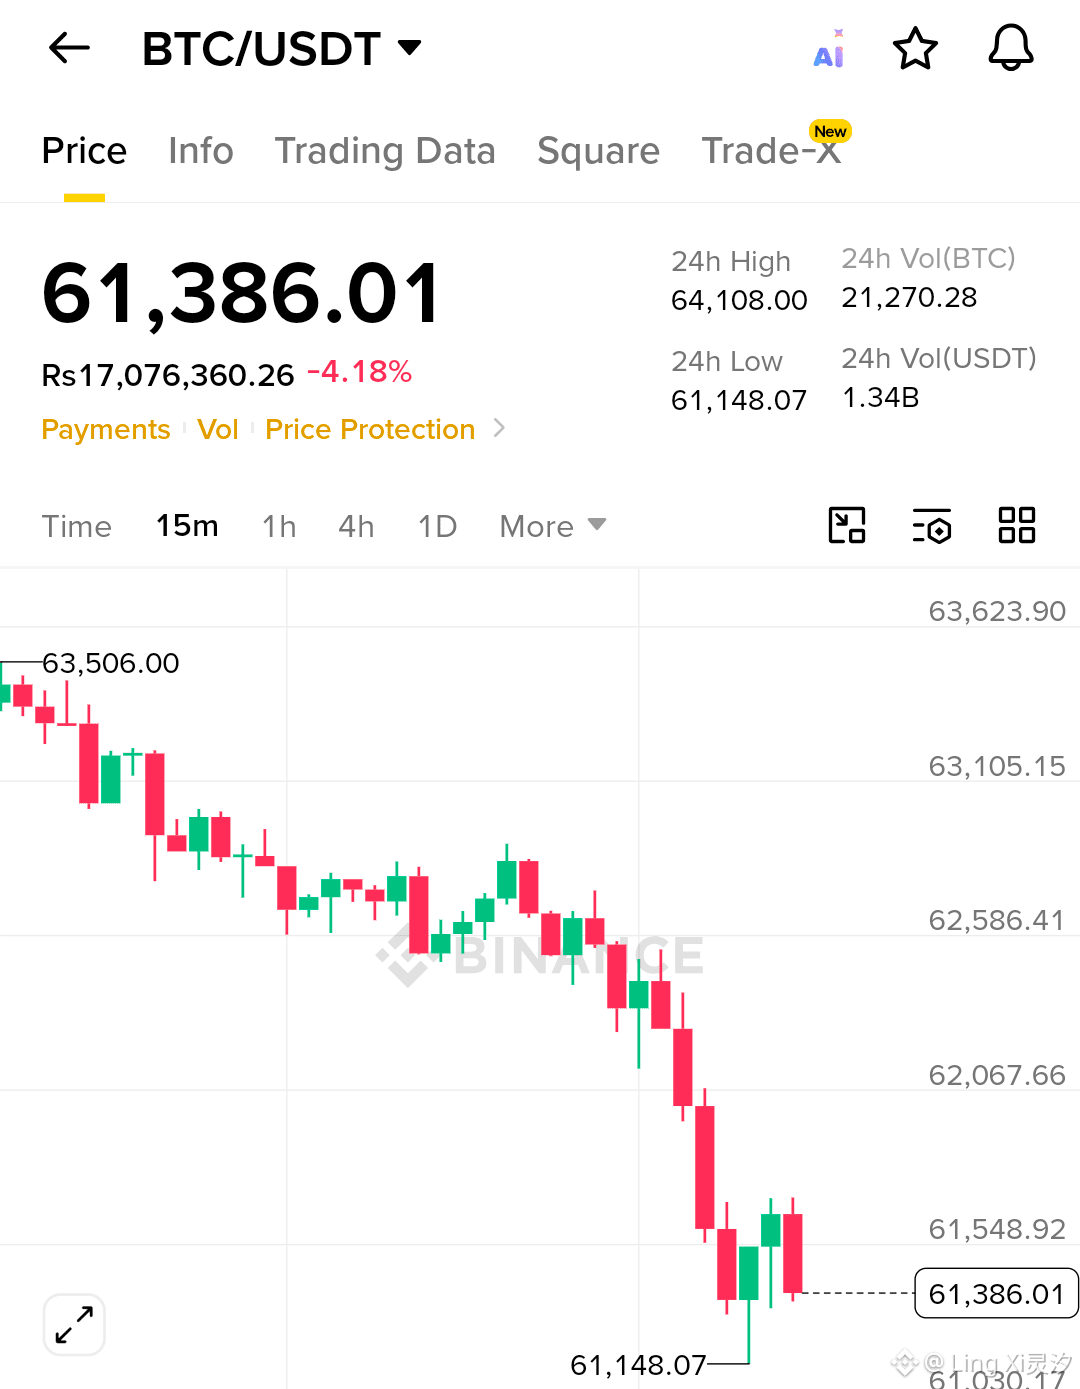
$BTC Market Update
💰 Price: $61,451 | 🔻 -4.06%
📊 Market Overview: BTC is facing short-term selling pressure but remains above a key support zone. The overall trend is still neutral-to-bullish if buyers defend current levels.
🔑 Support: $60,000 | $58,500
🚧 Resistance: $63,000 | $65,000
🎯 Targets: • TG1: $63,000
• TG2: $65,000
• TG3: $68,000
📈 Next Move: A bounce from $60K could trigger a recovery rally. Losing this level may bring further downside.
💡 Pro Tip: Watch BTC closely—its direction will likely decide the next move for the entire crypto market.
#BTC #crypto #trading #Bitcoi $BTC
{spot}(BTCUSDT)
$BTC Market Update
💰 Price: $61,451 | 🔻 -4.06%
📊 Market Overview: BTC is facing short-term selling pressure but remains above a key support zone. The overall trend is still neutral-to-bullish if buyers defend current levels.
🔑 Support: $60,000 | $58,500
🚧 Resistance: $63,000 | $65,000
🎯 Targets: • TG1: $63,000
• TG2: $65,000
• TG3: $68,000
📈 Next Move: A bounce from $60K could trigger a recovery rally. Losing this level may bring further downside.
💡 Pro Tip: Watch BTC closely—its direction will likely decide the next move for the entire crypto market.
#BTC #crypto #trading #Bitcoi $BTC
💰 Price: $61,451 | 🔻 -4.06%
📊 Market Overview: BTC is facing short-term selling pressure but remains above a key support zone. The overall trend is still neutral-to-bullish if buyers defend current levels.
🔑 Support: $60,000 | $58,500
🚧 Resistance: $63,000 | $65,000
🎯 Targets: • TG1: $63,000
• TG2: $65,000
• TG3: $68,000
📈 Next Move: A bounce from $60K could trigger a recovery rally. Losing this level may bring further downside.
💡 Pro Tip: Watch BTC closely—its direction will likely decide the next move for the entire crypto market.
#BTC #crypto #trading #Bitcoi $BTC
1
305
Log in to explore more content
Join global crypto users on Binance Square
⚡️ Get latest and useful information about crypto.
💬 Trusted by the world’s largest crypto exchange.
👍 Discover real insights from verified creators.
Email / Phone number
Trending Topics
1
#JobsReportRaisesHikeOdds
315,403 views
2,421 Discussing
2
#CPITestsDecemberRateOutlook
46,992 views
572 Discussing
3
#BitcoinRebounds$75KAsChipsLead
25,915 views
253 Discussing
4
#US Data Center Rules May Constrain AI Expansion
47,678 views
179 Discussing
5
#ARKPlans14ThematicETFsCoveringAIAndTokenizedMarkets
593 views
28 Discussing
6
#WillAnthropicListOnTime
83,161 views
968 Discussing
7
#WillUS-IranTensionsBoostSafe-HavenDemand?
23,907 views
239 Discussing
8
#BitcoinETFsSee$412MNetOutflows
6,265 views
47 Discussing
9
#HKSFCPlansToRestrictCryptoAndExchangeTerms
21,858 views
338 Discussing
10
#TradFiForBeginners
50,791 views
749 Discussing