
#marketanalysis
marketanalysis
10M views
54,335 Discussing
Hot
Latest

See translation
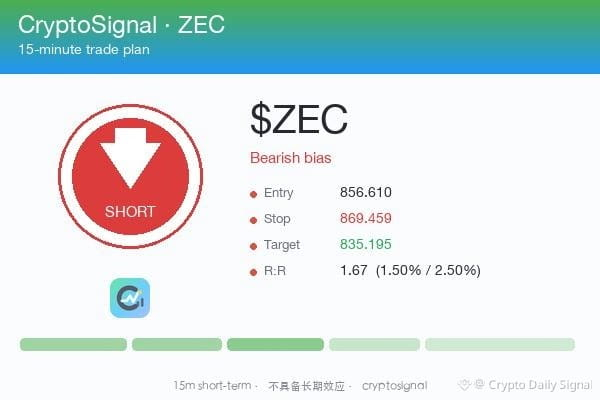
$ZEC short. Look, I'm fading this setup. Three candles back, upper wicks aggressively rejecting that range ceiling—sellers are holding firm up top. Plus, the recent action shows lower highs building right near the peak. This consolidation feels stretched out in the upper quartile. I'm waiting for it to dip below that minor support to confirm the bearish shift. If it snaps above that high, though? I'm out.
Plan (15m only): entry ~856.610 · SL 869.459 · TP 835.195 · R:R 1.67
15m only — not a swing call.
#MarketAnalysis
Plan (15m only): entry ~856.610 · SL 869.459 · TP 835.195 · R:R 1.67
15m only — not a swing call.
#MarketAnalysis
See translation
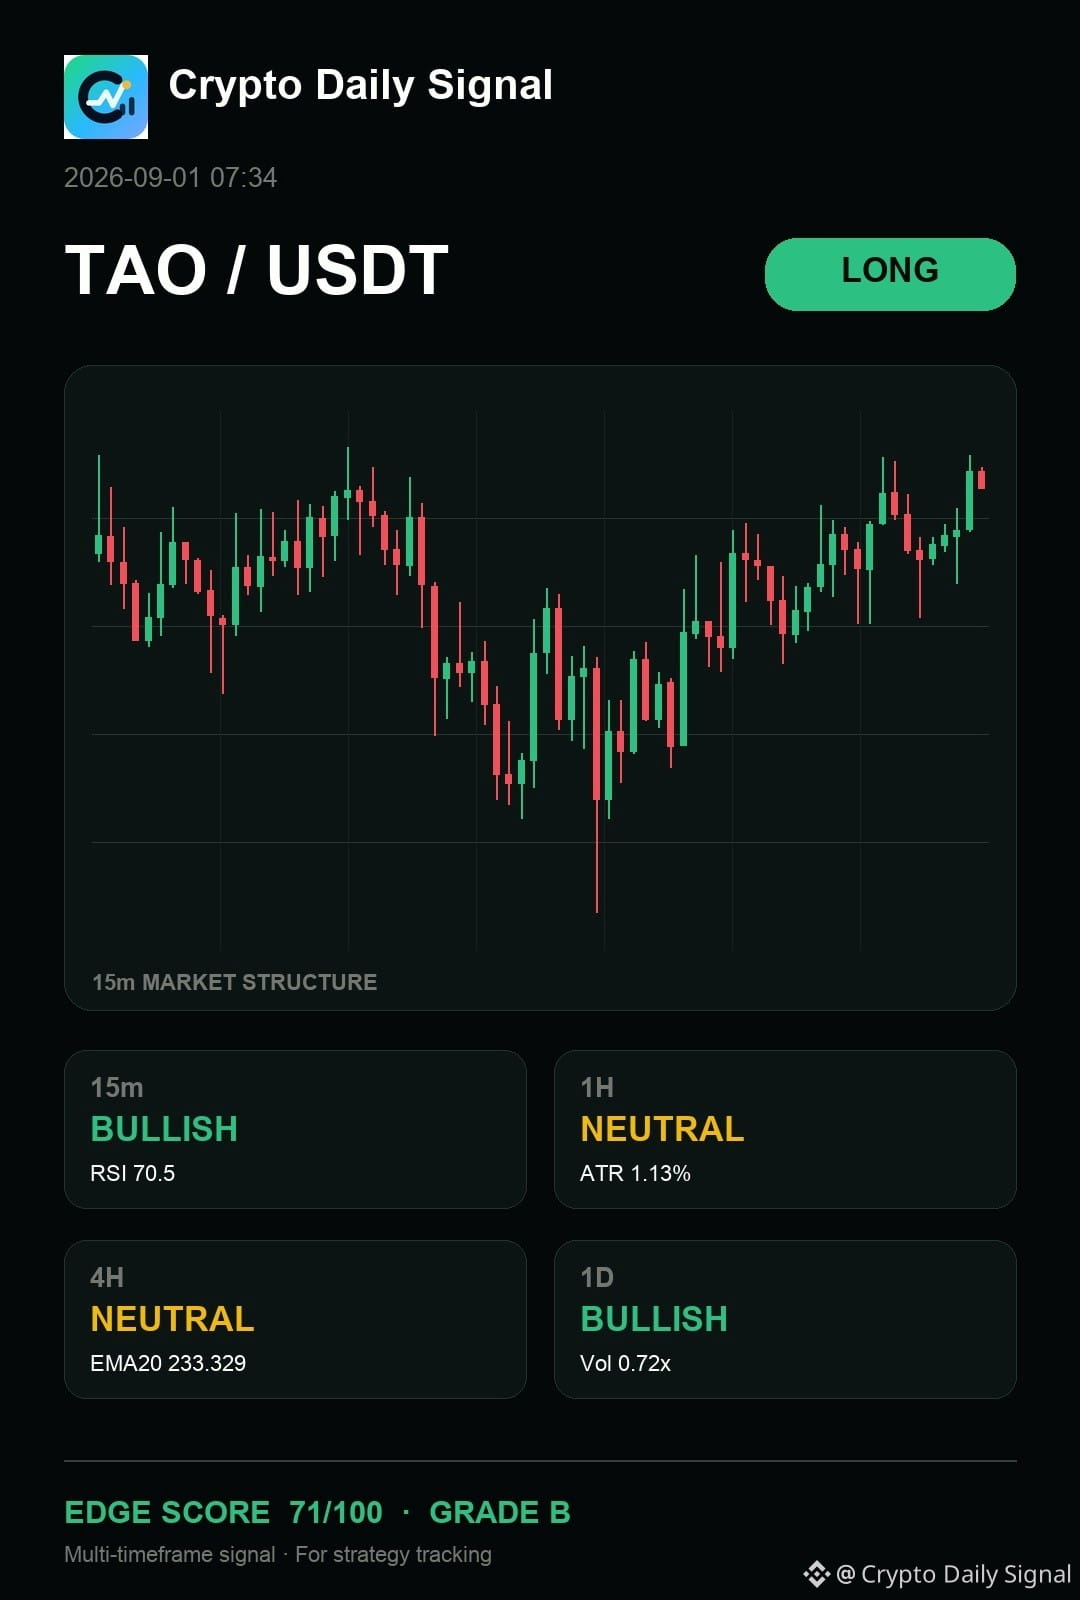
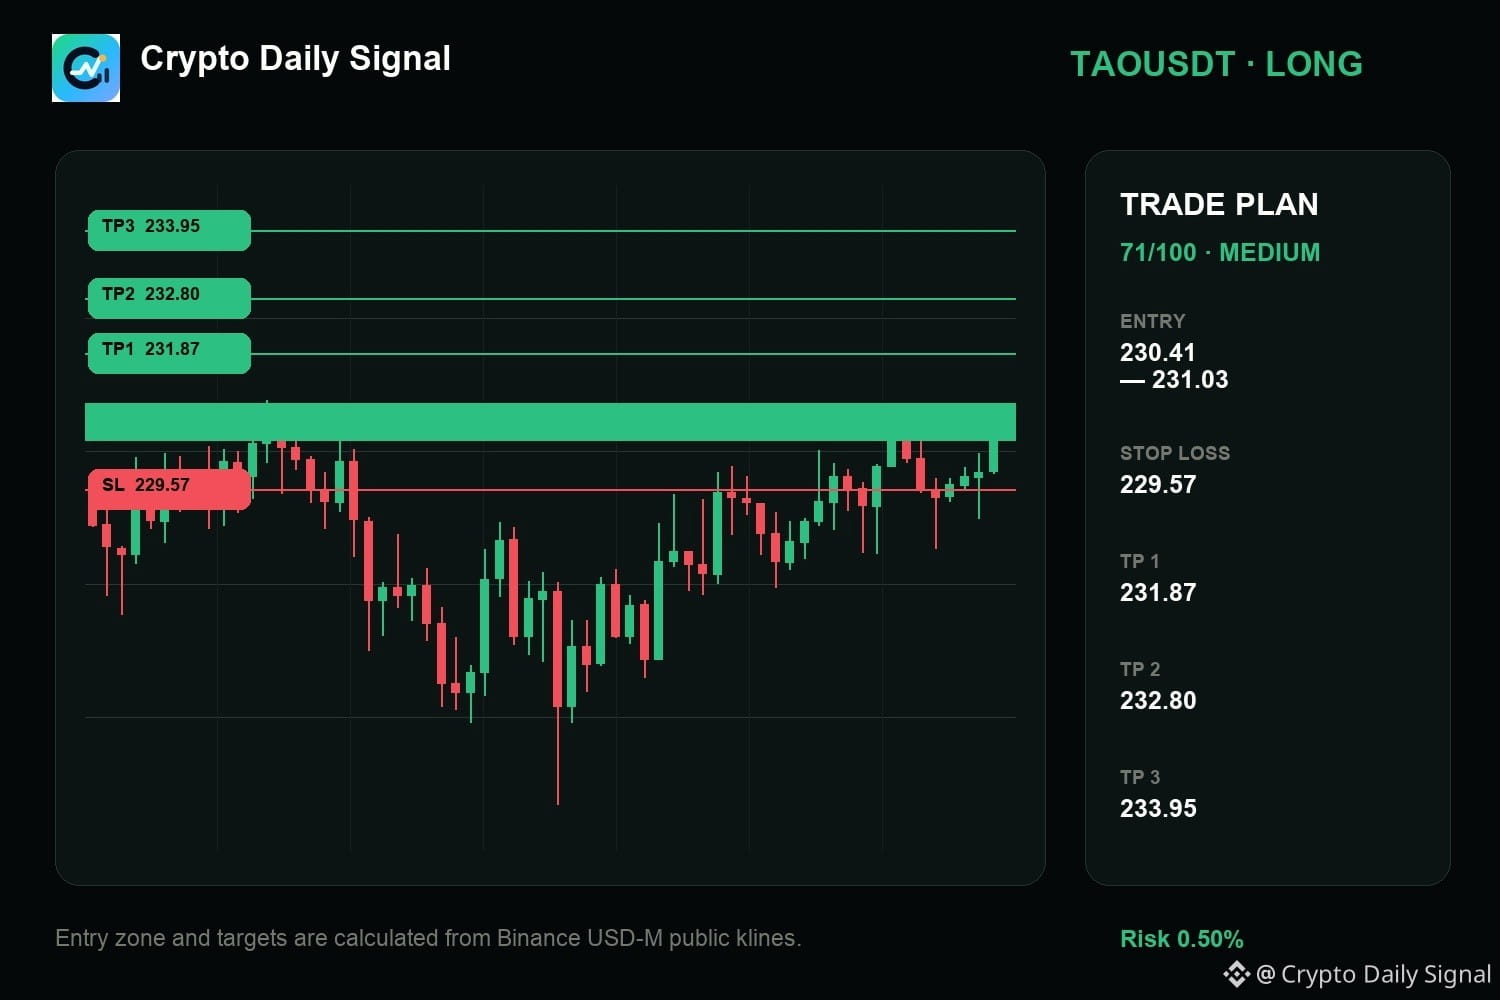
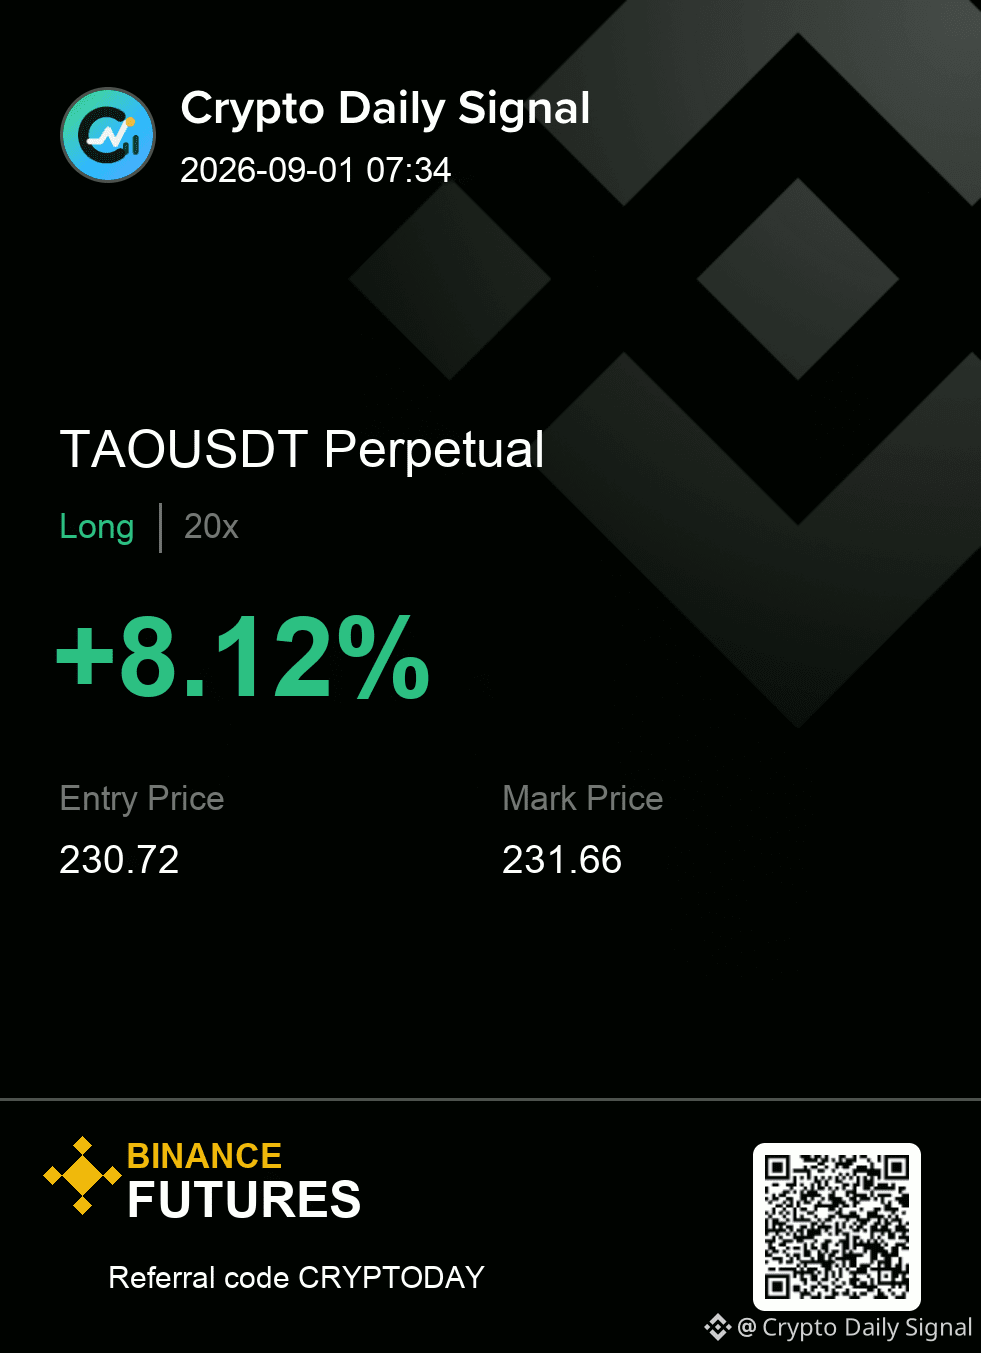
$TAO continues to favor the long case as the price held firm above the range bottom, and the recent buying momentum suggests immediate strength. A decisive move above the consolidation high would confirm expansion, though a break back below the floor invalidates that directional bias. If the bullish candle body continues to drive buying pressure higher, the immediate move aligns with the stronger daily trend.
TAOUSDT LONG map
Entry → 230.41 - 231.03
SL → 229.57
TP → 231.87 · 232.80 · 233.95
#MarketAnalysis
TAOUSDT LONG map
Entry → 230.41 - 231.03
SL → 229.57
TP → 231.87 · 232.80 · 233.95
#MarketAnalysis

See translation
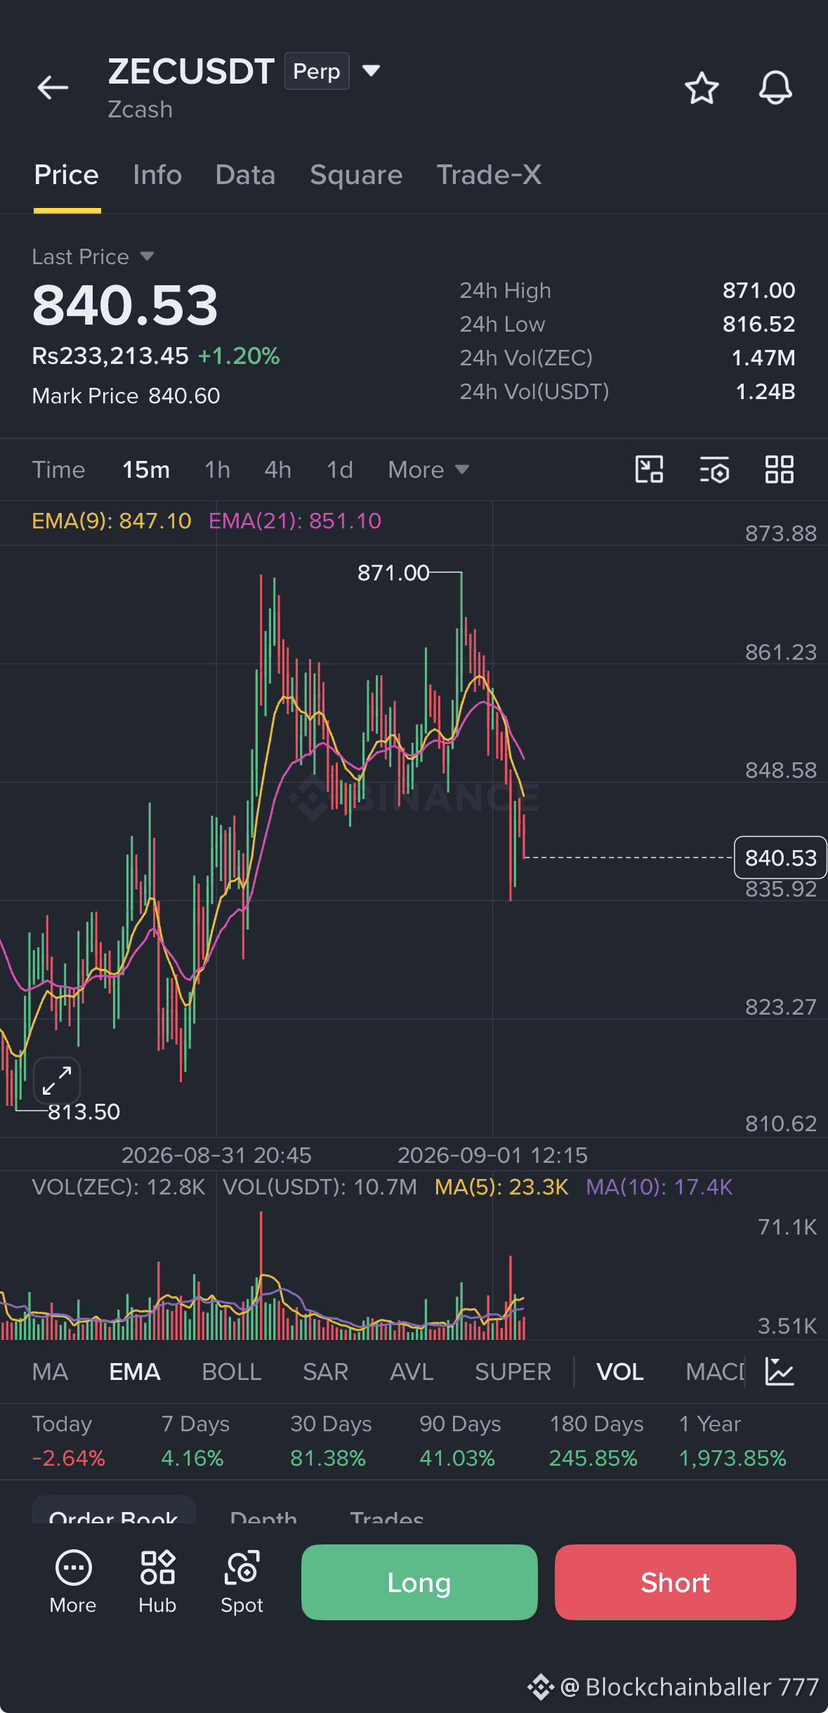
📉 $ZEC SHORT SETUP
Watching ZEC around $840.60 for a potential short setup.
📍 Entry: $840.60
🛑 SL / Invalidation: $865
🎯 TP1: $820
🎯 TP2: $795
🎯 TP3: $760
⚠️ Technical setup only — manage risk carefully and avoid excessive leverage.
Will ZEC lose momentum from here? 🐻👇
#ZEC #Crypto #Trading #MarketAnalysis #BinanceSquare
Watching ZEC around $840.60 for a potential short setup.
📍 Entry: $840.60
🛑 SL / Invalidation: $865
🎯 TP1: $820
🎯 TP2: $795
🎯 TP3: $760
⚠️ Technical setup only — manage risk carefully and avoid excessive leverage.
Will ZEC lose momentum from here? 🐻👇
#ZEC #Crypto #Trading #MarketAnalysis #BinanceSquare
See translation
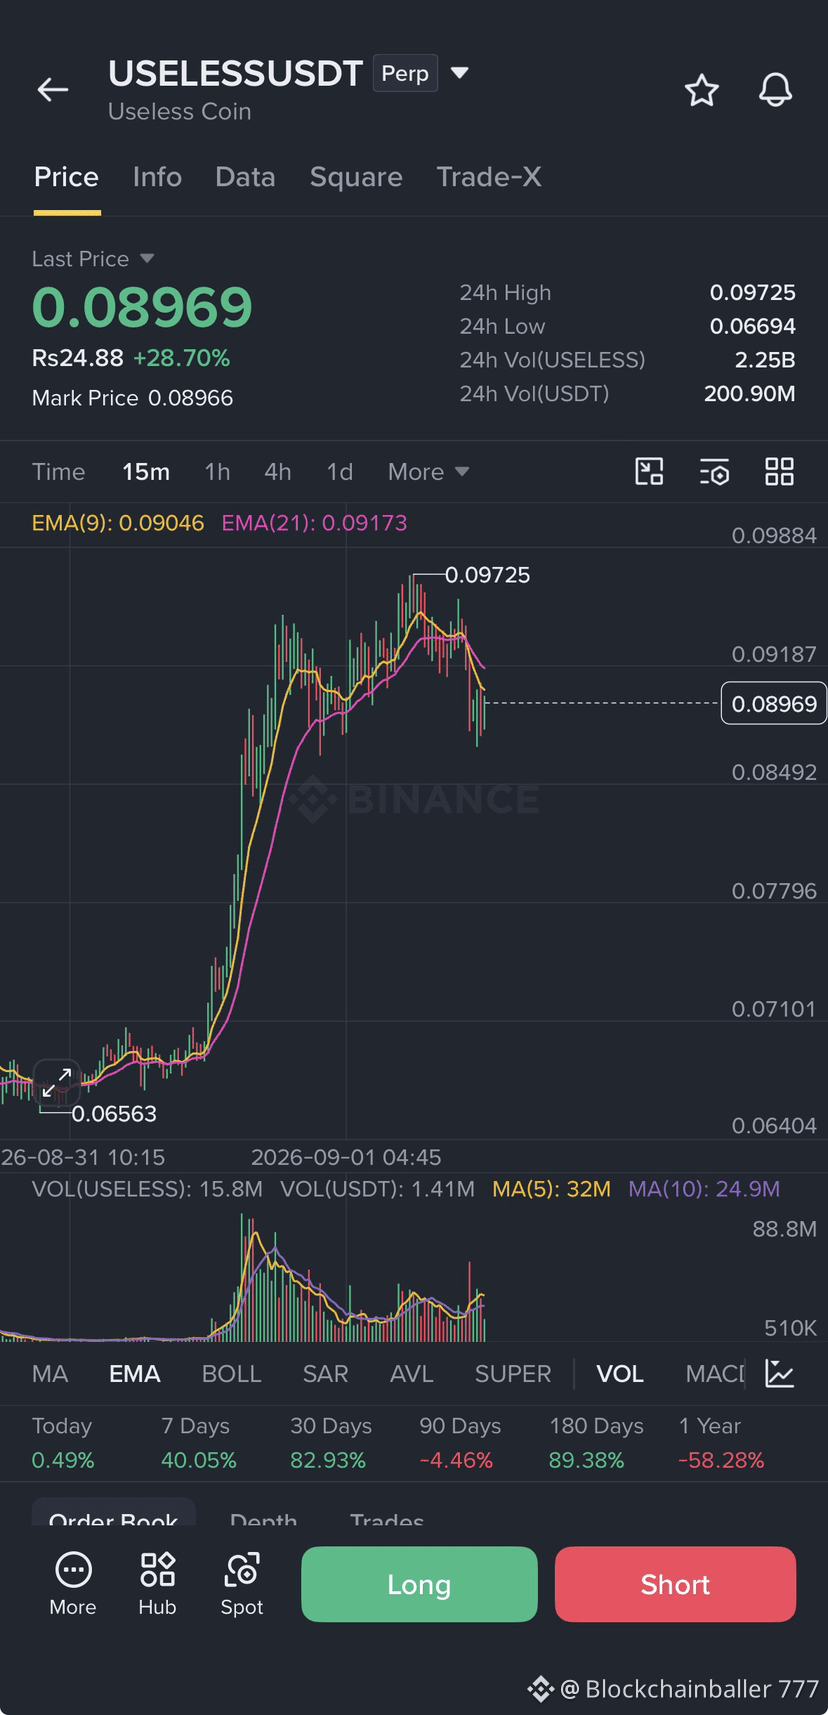
📊 $USELESS SHORT SETUP
Watching $USELESS around $0.08969 for a potential short setup.
📍 Entry: $0.08969
🛑 SL / Invalidation: $0.09250
🎯 TP1: $0.08650
🎯 TP2: $0.08300
🎯 TP3: $0.07950
⚠️ High volatility setup. This is market analysis, not financial advice. Manage risk and avoid overleveraging.
Bearish from here, or can bulls reclaim the resistance? 👇
#USELESS #Crypto #Trading #MarketAnalysis #BinanceSquare
Watching $USELESS around $0.08969 for a potential short setup.
📍 Entry: $0.08969
🛑 SL / Invalidation: $0.09250
🎯 TP1: $0.08650
🎯 TP2: $0.08300
🎯 TP3: $0.07950
⚠️ High volatility setup. This is market analysis, not financial advice. Manage risk and avoid overleveraging.
Bearish from here, or can bulls reclaim the resistance? 👇
#USELESS #Crypto #Trading #MarketAnalysis #BinanceSquare

See translation
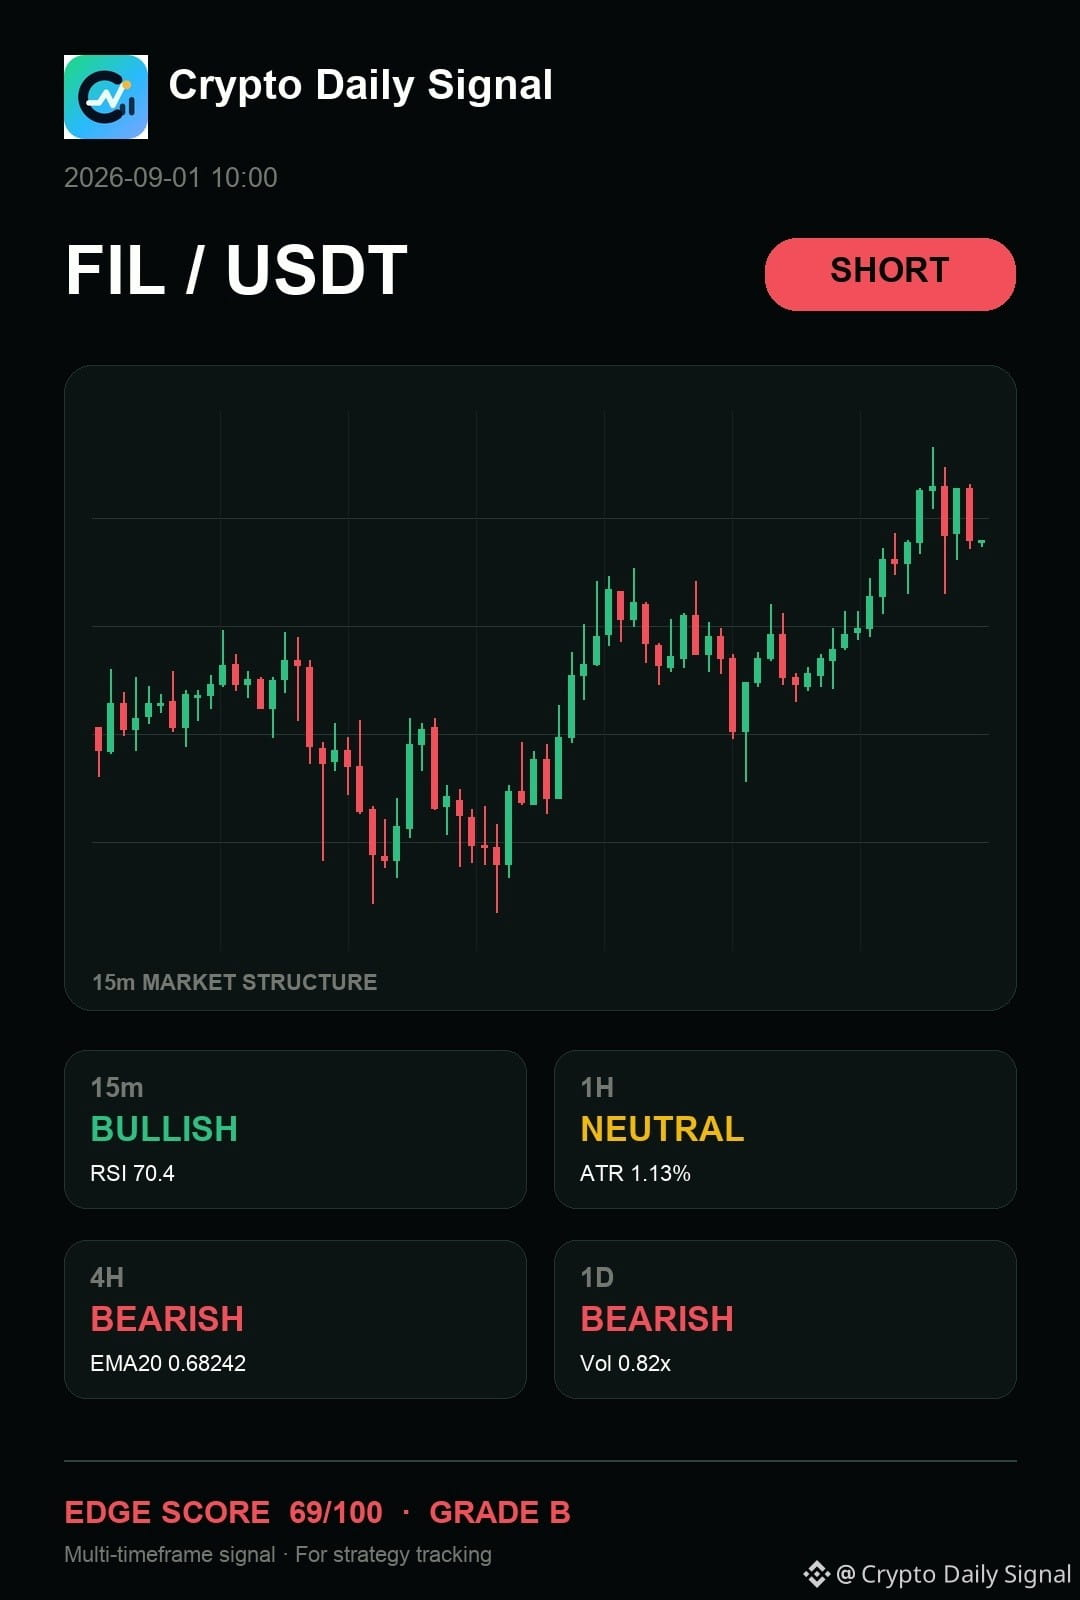
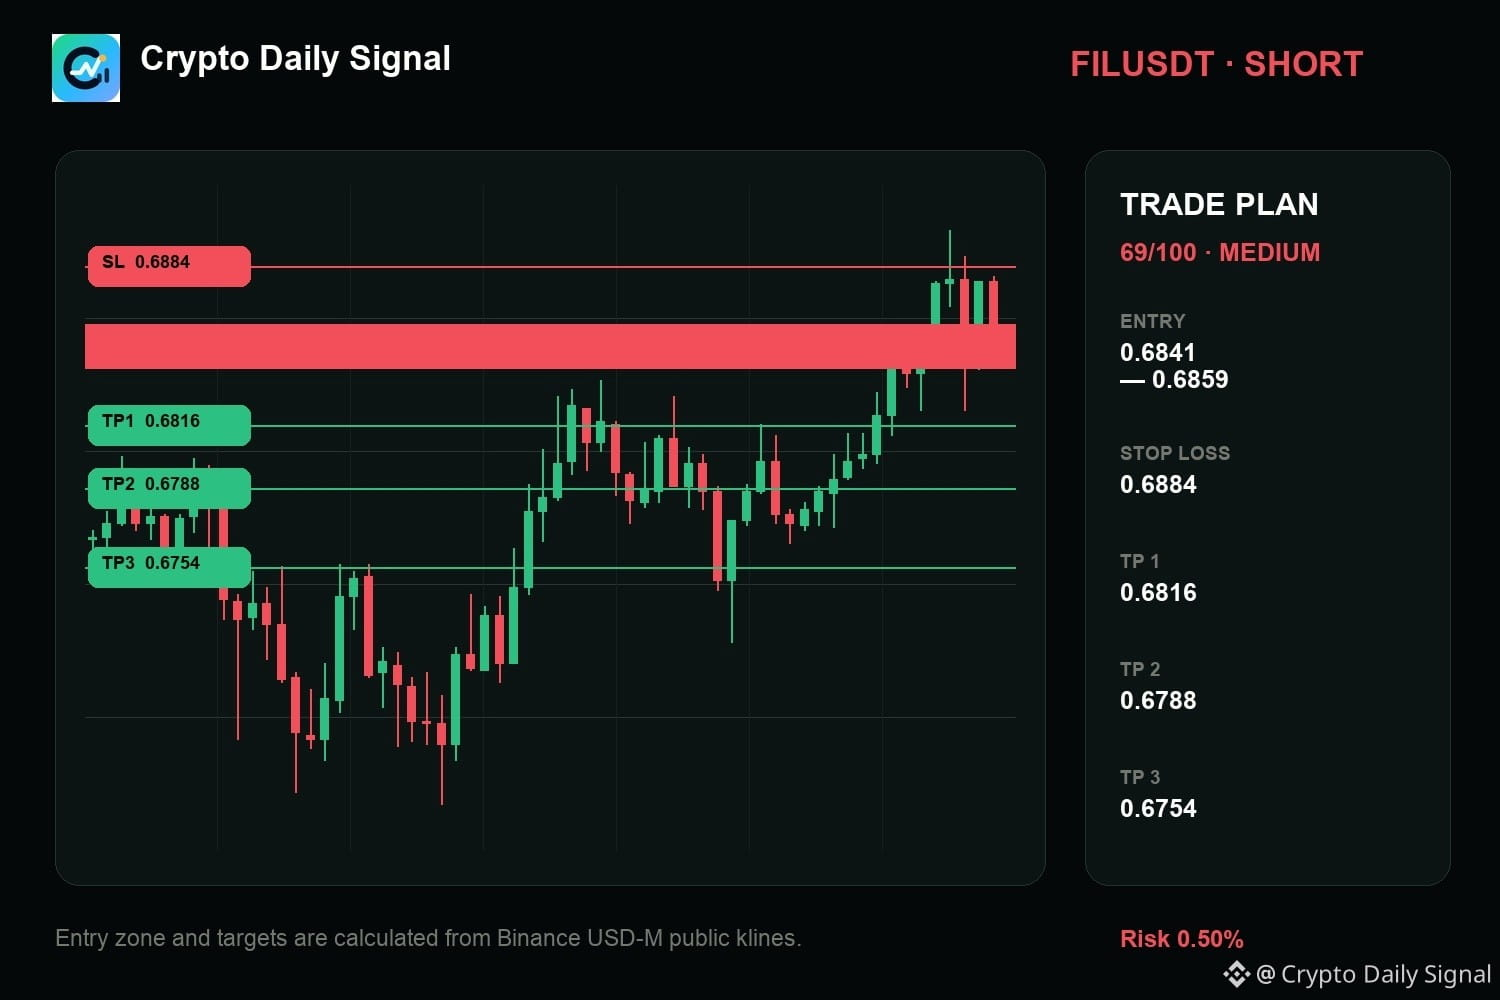
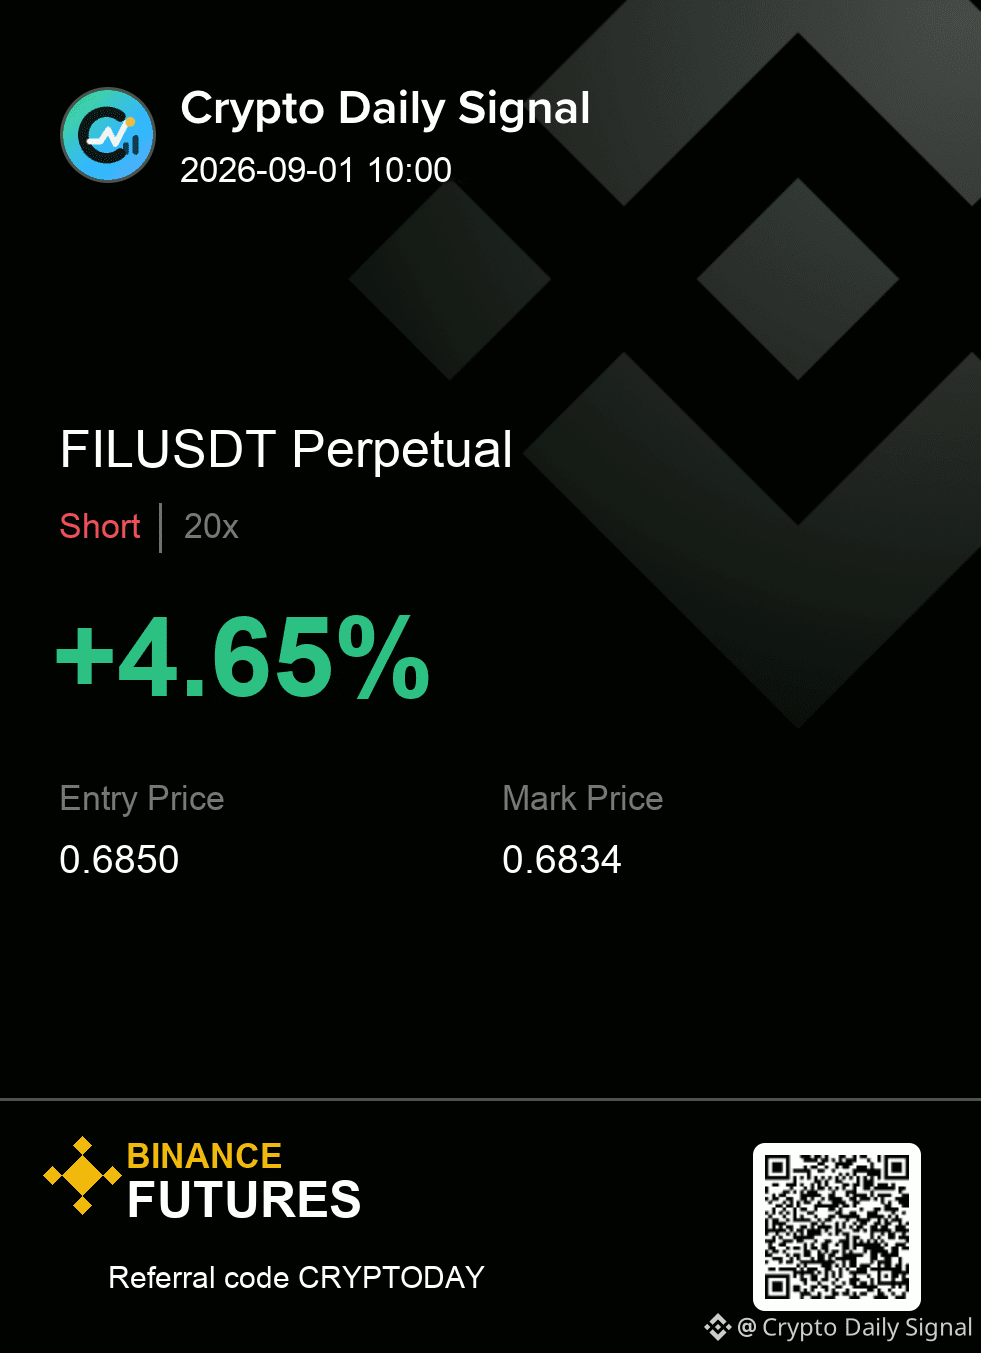
$FIL — real talk, I am treating it like it has not invalidated the short case even though the recent candles appear undecided near the range top. The bullish momentum on the fifteen-minute chart looks tempting, but the bigger picture remains bearish on both the four-hour and daily views. A cleaner bearish setup depends on the price failing to push through that immediate short-term resistance level.
No chase outside the zone; the stop defines the whole idea.
SHORT plan for FILUSDT
0.6841 - 0.6859 entry | 0.6884 stop
0.6816 → 0.6788 → 0.6754
#MarketAnalysis
No chase outside the zone; the stop defines the whole idea.
SHORT plan for FILUSDT
0.6841 - 0.6859 entry | 0.6884 stop
0.6816 → 0.6788 → 0.6754
#MarketAnalysis
See translation
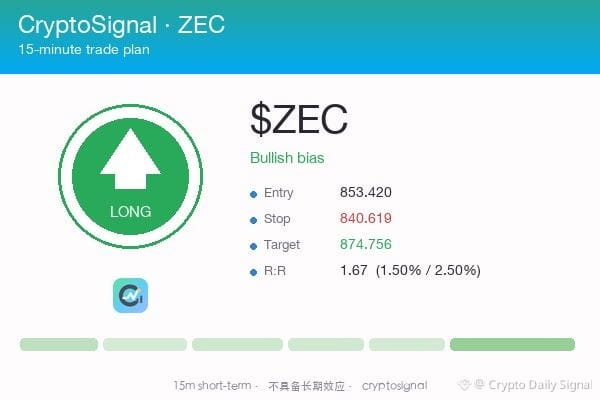
$ZEC — honestly, this is a long for me. Price held up nice near the bottom of the range, which is key. Plus, I'm seeing rejection wicks showing up right at that lower support area. Short-term MAs are starting to hug each other too, hinting at an upward move from this base. I'm waiting for it to push past the old high for a trigger. If it blasts through that range high I'm in, but if it dumps below the floor on a big red, I'm outta there.
Plan (15m only): entry ~853.420 · SL 840.619 · TP 874.756 · R:R 1.67
15m only — not a swing call.
#MarketAnalysis
Plan (15m only): entry ~853.420 · SL 840.619 · TP 874.756 · R:R 1.67
15m only — not a swing call.
#MarketAnalysis

See translation
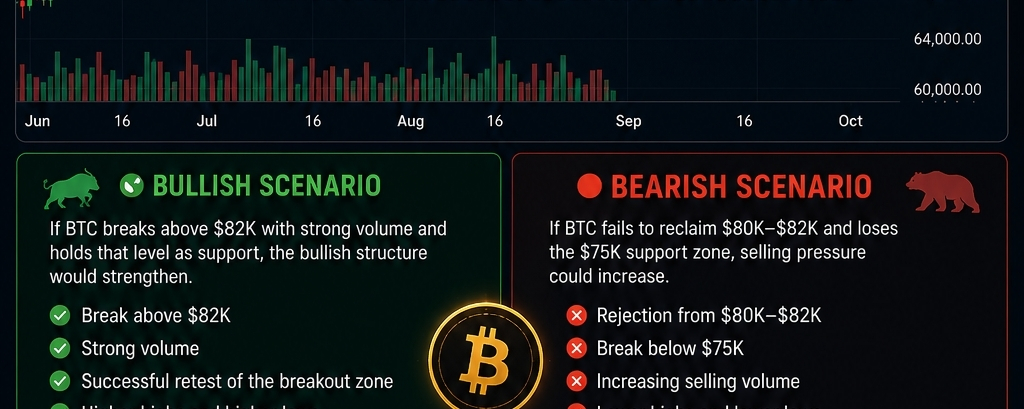
🚀 Crypto Market Outlook: Navigating $BTC Volatility
Bitcoin is currently testing key price levels, keeping the entire market on high alert. Whether you are trading short-term swings or holding for the long run, structure and risk management remain key.
* Market Analysis: $BTC is holding near critical support, showing signs of potential consolidation before the next major impulse move.
* Altcoin Focus: Keep a close watch on ETH andBNB, as capital rotation often triggers strong breakouts in major altcoins following market stability.
* Strategy Note: Avoid over-leveraging during high-volatility phases—focus on clear market confirmation and proper stop-loss placement.
💡 Market Poll: Are you anticipating a bullish breakout this week, or are you preparing for a deeper pullback? Share your technical analysis below! 👇
#crypto #bitcoin #BinanceSquare #TradingStrategy #MarketAnalysis
Bitcoin is currently testing key price levels, keeping the entire market on high alert. Whether you are trading short-term swings or holding for the long run, structure and risk management remain key.
* Market Analysis: $BTC is holding near critical support, showing signs of potential consolidation before the next major impulse move.
* Altcoin Focus: Keep a close watch on ETH andBNB, as capital rotation often triggers strong breakouts in major altcoins following market stability.
* Strategy Note: Avoid over-leveraging during high-volatility phases—focus on clear market confirmation and proper stop-loss placement.
💡 Market Poll: Are you anticipating a bullish breakout this week, or are you preparing for a deeper pullback? Share your technical analysis below! 👇
#crypto #bitcoin #BinanceSquare #TradingStrategy #MarketAnalysis
See translation
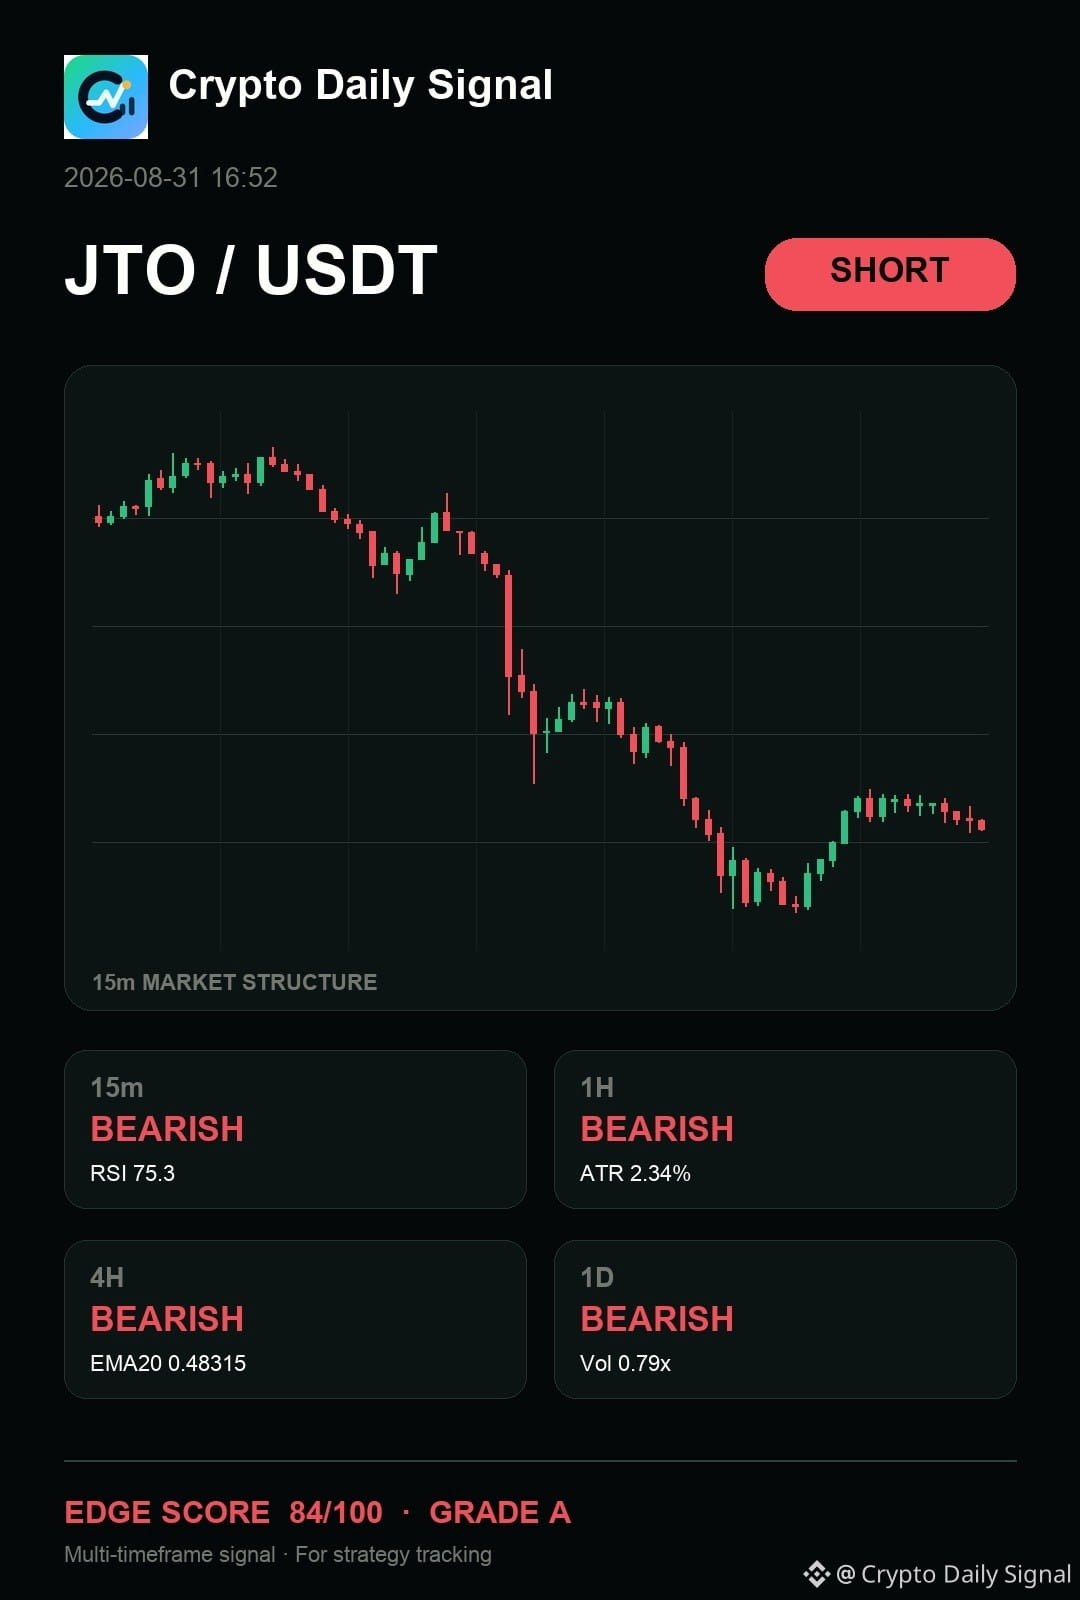
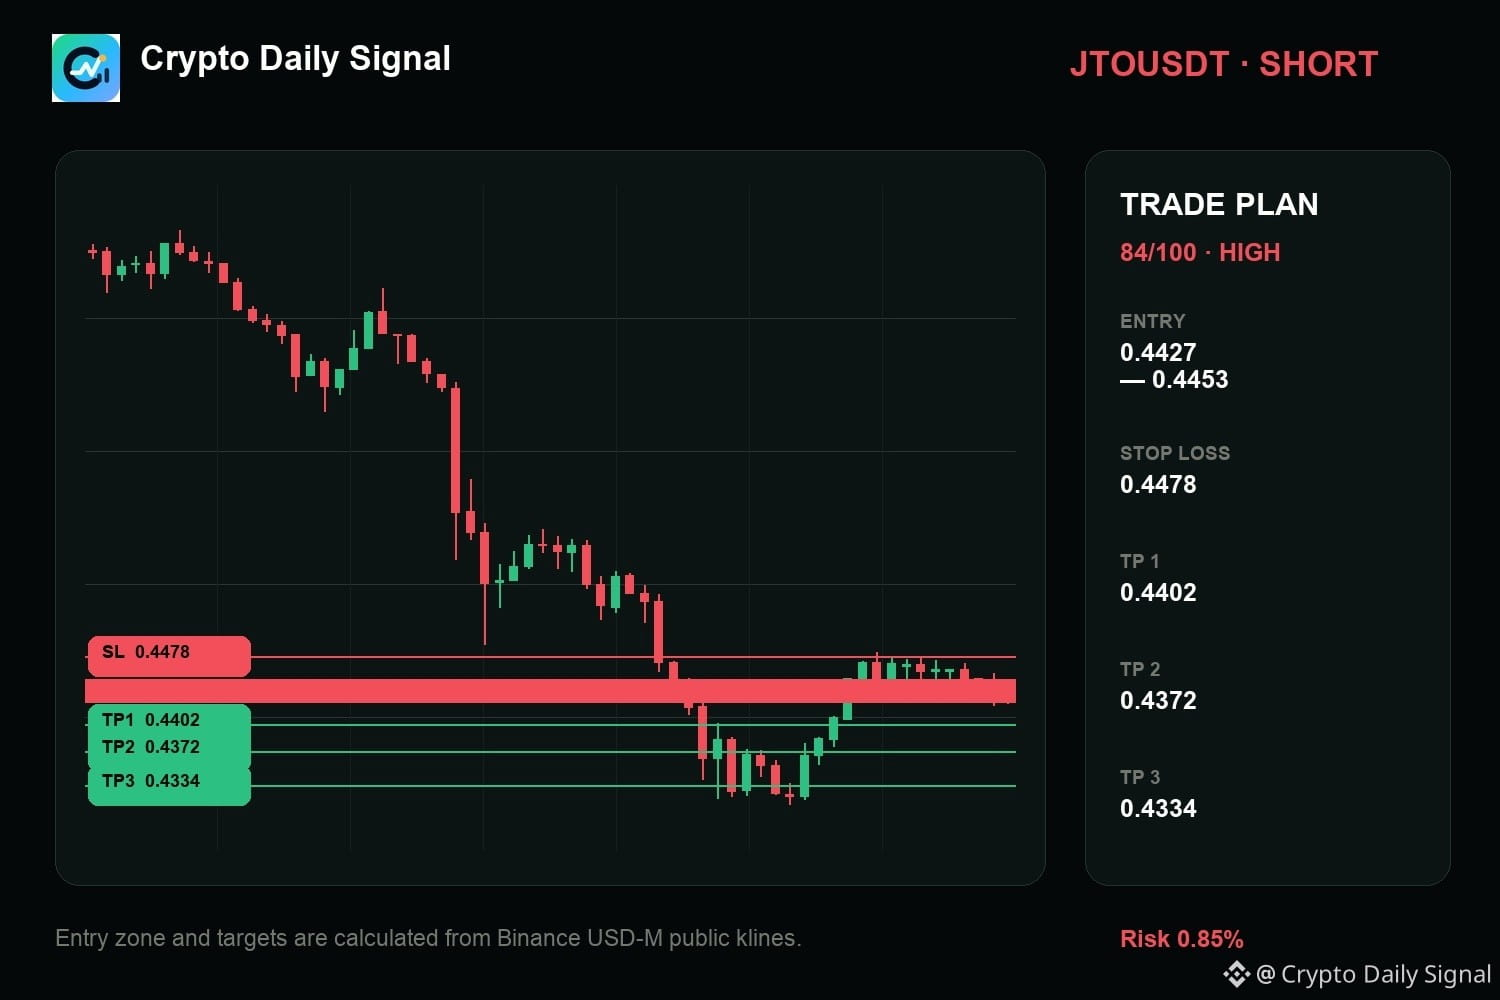
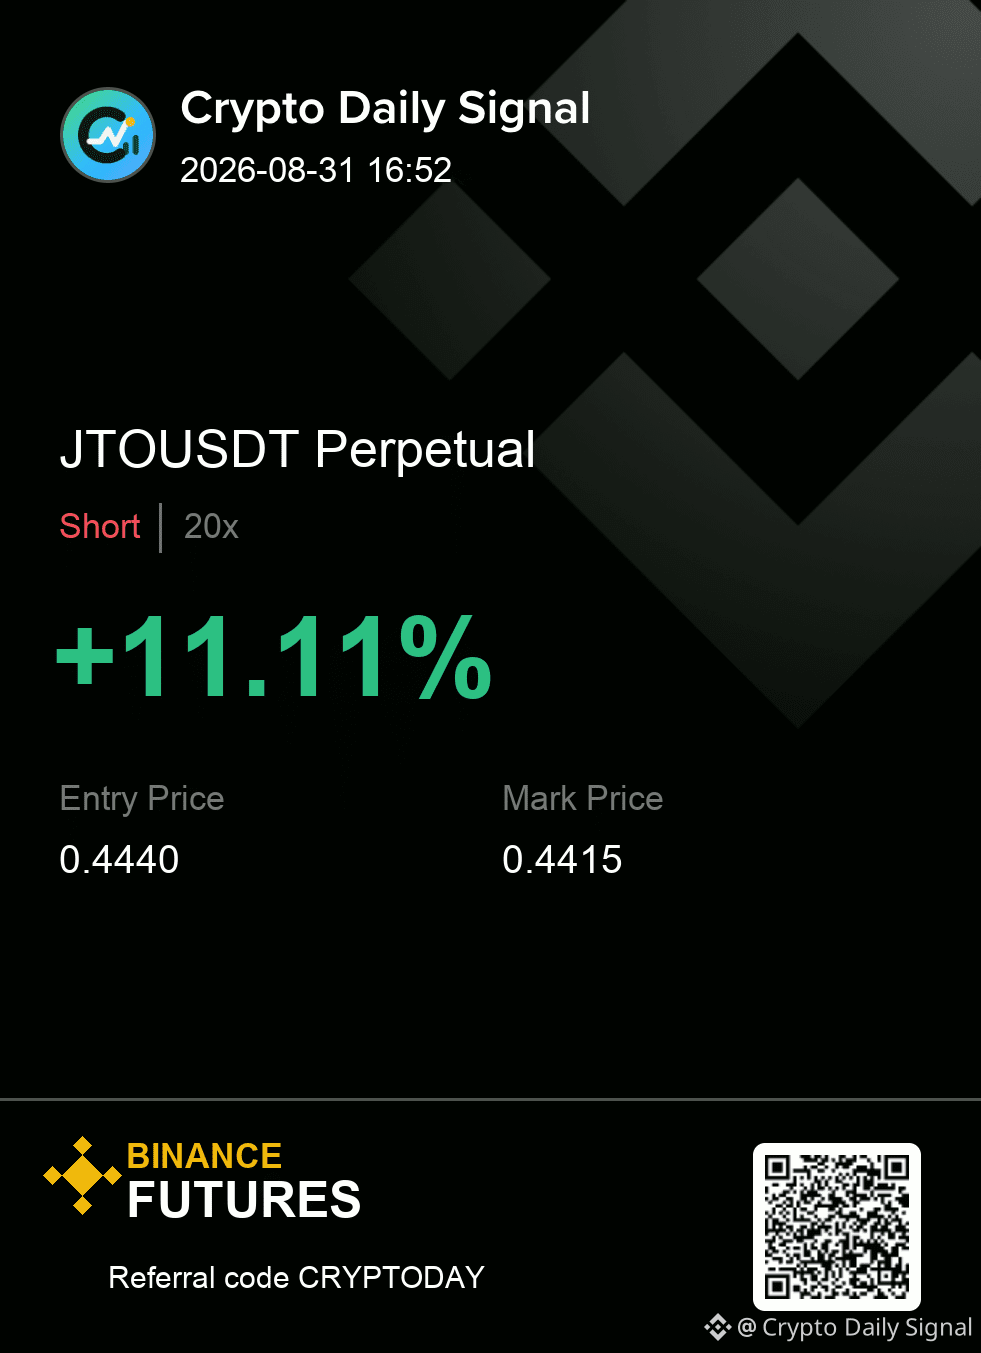
$JTO — bro, here's my read: it has my attention on the sell side because the entire structure is built on lower highs and lower lows. The recent candle showed a rejection off the swing high, though the shorter-term volume is lagging. A clean break below the last low makes this a signal to fade.
Execution is simple here: respect the zone and respect the cut.
Levels — JTOUSDT
Zone: 0.4427 - 0.4453
Cut: 0.4478
Scale: 0.4402 | 0.4372 | 0.4334
#MarketAnalysis
Execution is simple here: respect the zone and respect the cut.
Levels — JTOUSDT
Zone: 0.4427 - 0.4453
Cut: 0.4478
Scale: 0.4402 | 0.4372 | 0.4334
#MarketAnalysis
See translation
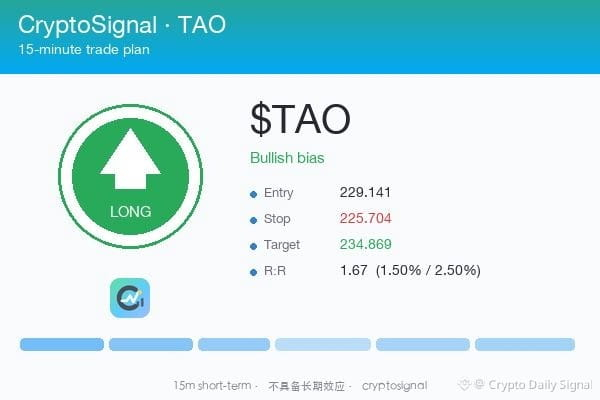
$TAO — honestly, this is a long for me. Price bounced clean right off that range floor earlier. Plus, the current candle is showing a strong move up compared to the bearish stuff before. I'm waiting for it to decisively close over that resistance level though. If it drops below the established floor though, I'm out immediately. This setup looks solid for a bounce.
Plan (15m only): entry ~229.141 · SL 225.704 · TP 234.869 · R:R 1.67
15m only — not a swing call.
#MarketAnalysis
Plan (15m only): entry ~229.141 · SL 225.704 · TP 234.869 · R:R 1.67
15m only — not a swing call.
#MarketAnalysis
See translation
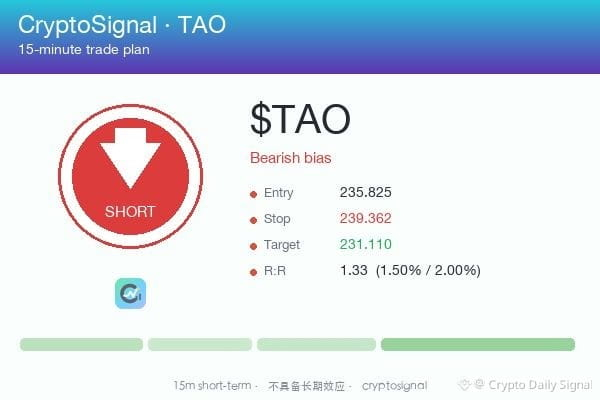
$TAO — look, I'm fading this. Formed a clear pattern of lower highs in this tight zone. Selling pressure's still strong at the upper boundary of the consolidation. The bounce off the mid-range level failed to build momentum higher. I think we'll get dumped before finding real footing again.
Plan (15m only): entry ~235.825 · SL 239.362 · TP 231.110 · R:R 1.33
15m only — not a swing call.
#MarketAnalysis
Plan (15m only): entry ~235.825 · SL 239.362 · TP 231.110 · R:R 1.33
15m only — not a swing call.
#MarketAnalysis
See translation
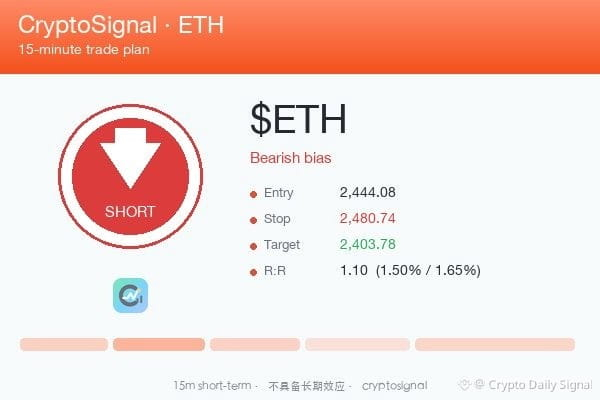
$ETH — honestly, this is a short for me. It's still stuck below that last swing high. Strong selling pressure in these recent candles, big bearish bodies hitting. Plus, the short-term MAs are sloping down, matching the downtrend structure. I'm fading this bounce attempt completely. If it dips below that structural low on a solid red candle, I'm in. Watching for that clean break below.
Plan (15m only): entry ~2,444.08 · SL 2,480.74 · TP 2,403.78 · R:R 1.10
15m only — not a swing call.
#MarketAnalysis
Plan (15m only): entry ~2,444.08 · SL 2,480.74 · TP 2,403.78 · R:R 1.10
15m only — not a swing call.
#MarketAnalysis

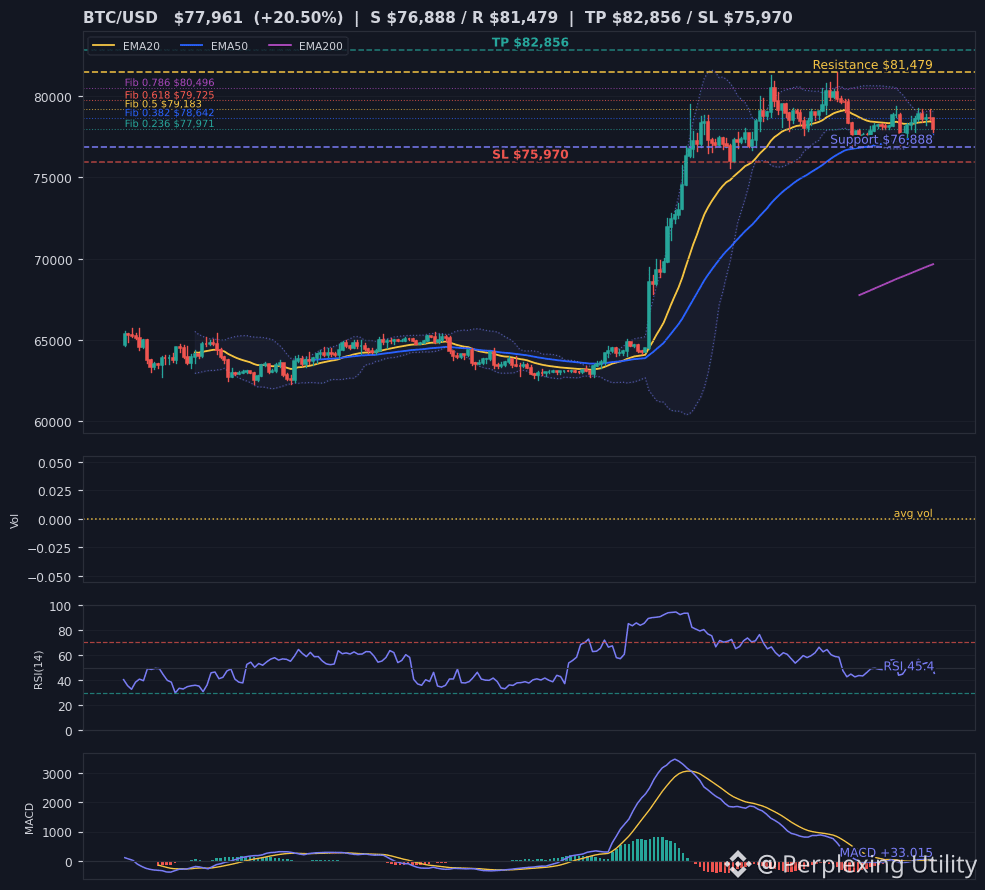
🔥 Bitcoin on track for the best August since 2017 despite renewed US-Iran hostilities — Bitcoin's best August since 2017 amid geopolitical tensions is the dominant macro narrative driving current BTC price action and sentiment.
Yaar, right now, in the crypto market, there’s a whole different vibe going on. Bitcoin is performing so strongly in the month of August this year—first time since 2017—and all of this is happening amid fresh tensions between the US and Iran. Basically, when there’s chaos in the world, people start looking at Bitcoin to keep their money safe. This macro narrative is currently driving the price action, and sentiment is also revolving around the same theme. Now, let’s look at the technical side: the price is currently around $77,959, which is above an important support zone. In my chart, support is at $77,815 and resistance is near $78,052. RSI is at 45, meaning the market isn’t overbought or oversold—it's just consolidating in a neutral zone. MACD has given a bearish cross, which is a slight warning, but since volume is low, it doesn’t look like a big move is coming.
Personally, I feel like the $77,800 support level will hold because the news flow is positive and big players are buying this dip. But let’s see—if this support breaks, then the next stop is at $76,888, which is a strong floor. If resistance gets clearly broken above $78,050, then the path could open up toward $81,400. Now you all tell me—what do you think? Will Bitcoin maintain its bullish momentum amid this geopolitical tension, or will even this support level fail? Comment your view!
#Trading #Binance #Bitcoin #Crypto #MarketAnalysis
--
Disclaimer: My personal analysis, not financial advice. DYOR.
Yaar, right now, in the crypto market, there’s a whole different vibe going on. Bitcoin is performing so strongly in the month of August this year—first time since 2017—and all of this is happening amid fresh tensions between the US and Iran. Basically, when there’s chaos in the world, people start looking at Bitcoin to keep their money safe. This macro narrative is currently driving the price action, and sentiment is also revolving around the same theme. Now, let’s look at the technical side: the price is currently around $77,959, which is above an important support zone. In my chart, support is at $77,815 and resistance is near $78,052. RSI is at 45, meaning the market isn’t overbought or oversold—it's just consolidating in a neutral zone. MACD has given a bearish cross, which is a slight warning, but since volume is low, it doesn’t look like a big move is coming.
Personally, I feel like the $77,800 support level will hold because the news flow is positive and big players are buying this dip. But let’s see—if this support breaks, then the next stop is at $76,888, which is a strong floor. If resistance gets clearly broken above $78,050, then the path could open up toward $81,400. Now you all tell me—what do you think? Will Bitcoin maintain its bullish momentum amid this geopolitical tension, or will even this support level fail? Comment your view!
#Trading #Binance #Bitcoin #Crypto #MarketAnalysis
--
Disclaimer: My personal analysis, not financial advice. DYOR.

See translation
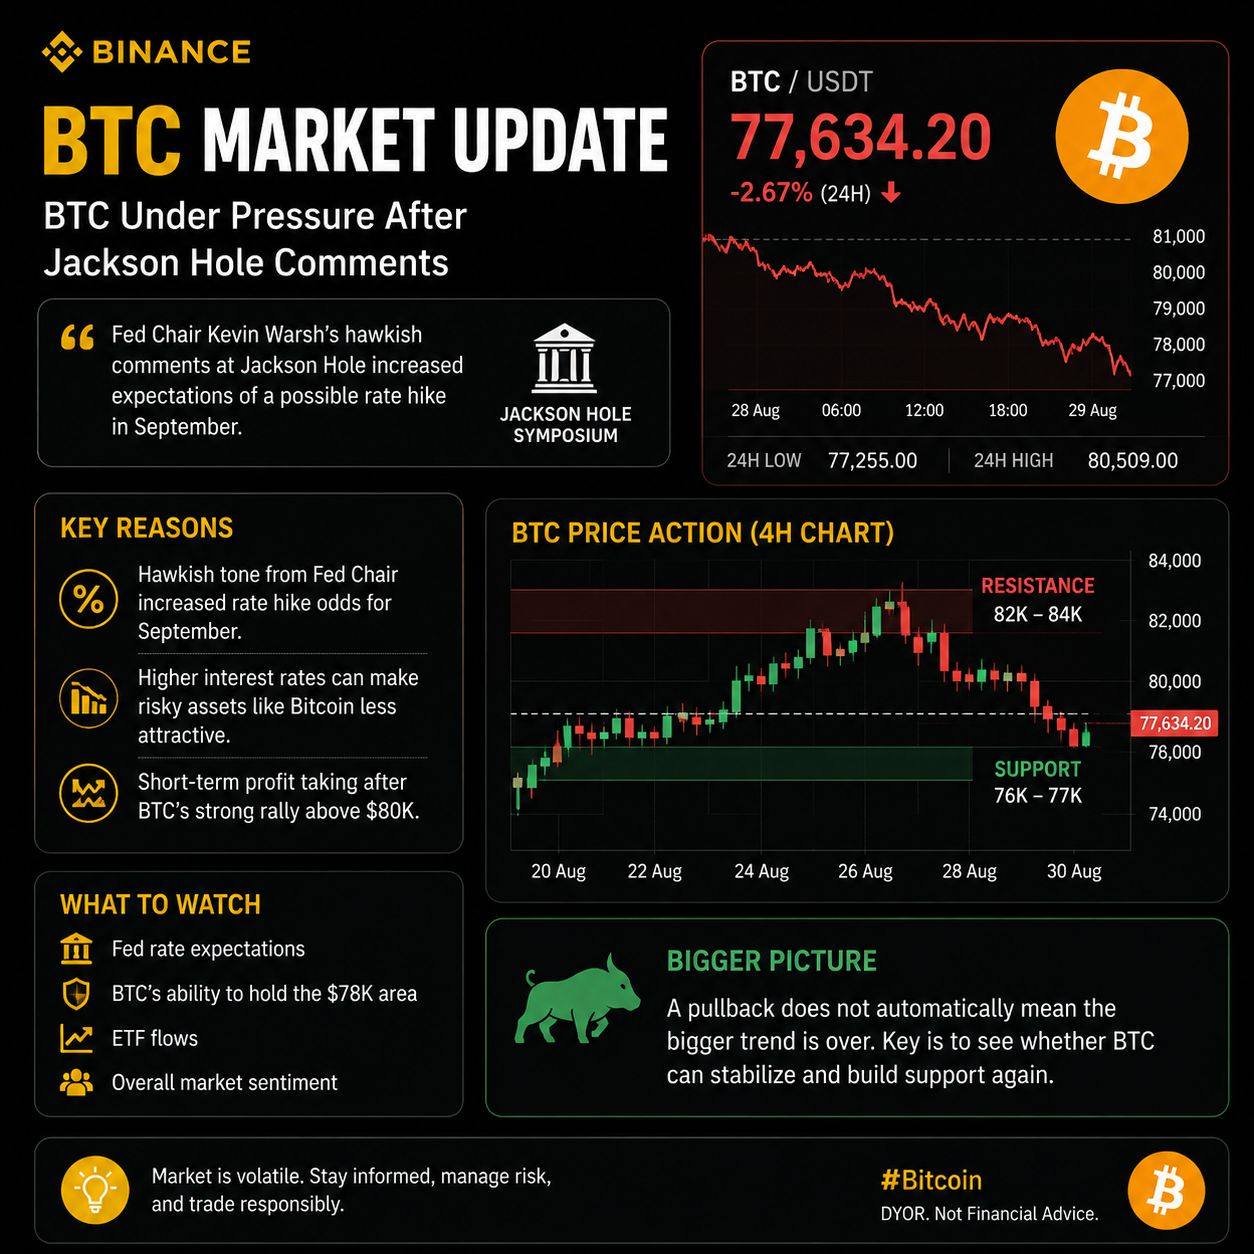
BTC Market Update
Bitcoin is under pressure again.
BTC recently dropped below $76,000 after a strong move above $80,000.
One major reason is the latest Jackson Hole message from Fed Chair Kevin Warsh.
His comments were more focused on fighting inflation, which increased market expectations for a possible rate hike in September.
This is important for Bitcoin because higher interest rates can make risky assets less attractive.
But the bigger picture is still mixed.
BTC had gained strongly during the previous week before this pullback.
So right now, I would watch:
• Fed rate expectations
• BTC's ability to hold the $78K area
• ETF flows
• Overall market sentiment
A pullback does not automatically mean the bigger trend is over.
For me, the key question is whether BTC can stabilize after the Jackson Hole shock.
Not financial advice. Just my market analysis.
#bitcoin #BTC #crypto #BinanceSquare #MarketAnalysis $BTC
Bitcoin is under pressure again.
BTC recently dropped below $76,000 after a strong move above $80,000.
One major reason is the latest Jackson Hole message from Fed Chair Kevin Warsh.
His comments were more focused on fighting inflation, which increased market expectations for a possible rate hike in September.
This is important for Bitcoin because higher interest rates can make risky assets less attractive.
But the bigger picture is still mixed.
BTC had gained strongly during the previous week before this pullback.
So right now, I would watch:
• Fed rate expectations
• BTC's ability to hold the $78K area
• ETF flows
• Overall market sentiment
A pullback does not automatically mean the bigger trend is over.
For me, the key question is whether BTC can stabilize after the Jackson Hole shock.
Not financial advice. Just my market analysis.
#bitcoin #BTC #crypto #BinanceSquare #MarketAnalysis $BTC
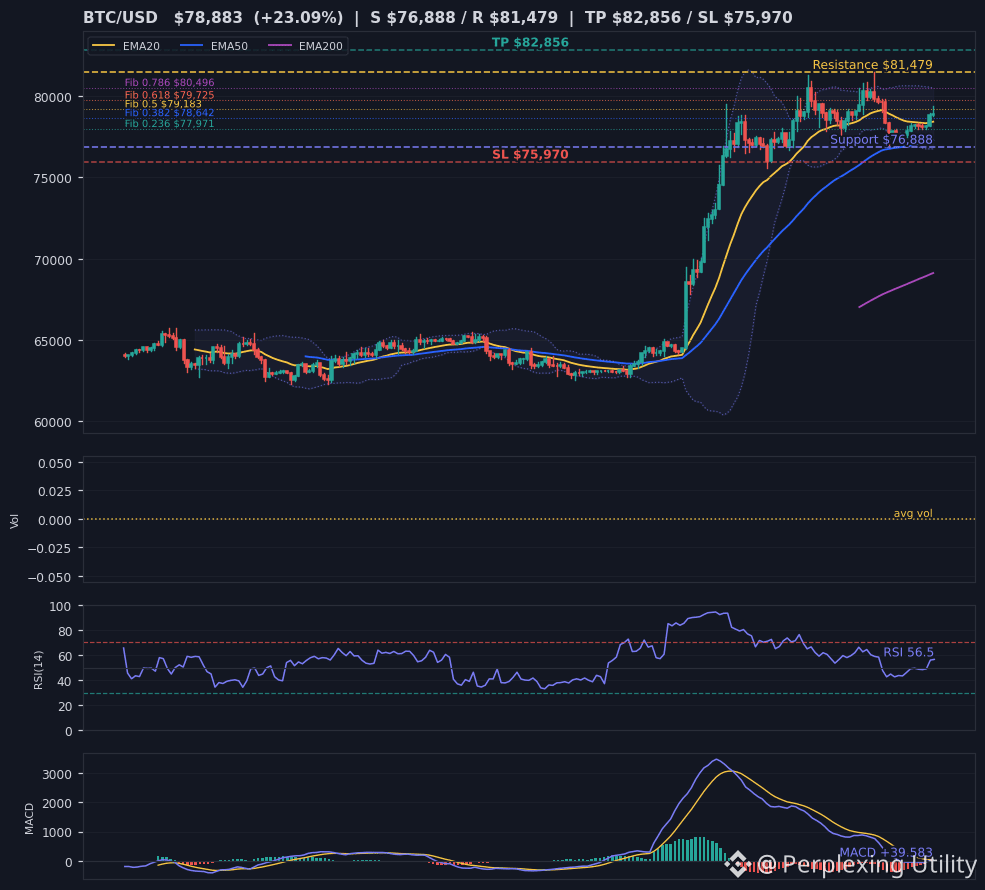
🔥 Saylor signals Strategy is ‘Back’ to Bitcoin buying — Saylor’s signal that Strategy is resuming Bitcoin buying directly drives BTC price action and market sentiment.
Bro, Michael Saylor has done the same amazing thing again — the entire market lifted the moment the ‘Back to Bitcoin buying’ signal came in. This isn’t just a tweet; it’s a sentiment bomb. When Saylor speaks, BTC listens. And right now the price is at $78,883, just below the pivot $79,011 — meaning it’s standing in the decision zone.
Now let’s talk charts: the RSI is at 56.7, neutral — neither overbought nor oversold, just breathing. The MACD is slightly bearish, but volume has been half-hearted, so that move doesn’t inspire much confidence. Support is solid at $77,815, resistance is at $79,167 — and above that lies a bigger target at $81,478. My view? This pivot will hold if the daily close is above $79k. Saylor’s news is the fuel, but volume needs to come along too. Let’s see — will it break through resistance or come back to test support first?
I think a sideways breakout is being prepared right now. What do you think — will the $79k level break today, or will there be a first retest of $77.8k? Comment and let me know!
#Trading #Binance #Bitcoin #Crypto #MarketAnalysis
--
Disclaimer: My personal analysis, not financial advice. DYOR.
Bro, Michael Saylor has done the same amazing thing again — the entire market lifted the moment the ‘Back to Bitcoin buying’ signal came in. This isn’t just a tweet; it’s a sentiment bomb. When Saylor speaks, BTC listens. And right now the price is at $78,883, just below the pivot $79,011 — meaning it’s standing in the decision zone.
Now let’s talk charts: the RSI is at 56.7, neutral — neither overbought nor oversold, just breathing. The MACD is slightly bearish, but volume has been half-hearted, so that move doesn’t inspire much confidence. Support is solid at $77,815, resistance is at $79,167 — and above that lies a bigger target at $81,478. My view? This pivot will hold if the daily close is above $79k. Saylor’s news is the fuel, but volume needs to come along too. Let’s see — will it break through resistance or come back to test support first?
I think a sideways breakout is being prepared right now. What do you think — will the $79k level break today, or will there be a first retest of $77.8k? Comment and let me know!
#Trading #Binance #Bitcoin #Crypto #MarketAnalysis
--
Disclaimer: My personal analysis, not financial advice. DYOR.
🔥 Eric Trump Says ‘The Tides Have Turned’ For Bitcoin As AI And Institutions Fuel Crypto Adoption — Eric Trump's bullish Bitcoin statement adds retail FOMO and a macro tailwind, directly boosting BTC sentiment right now.
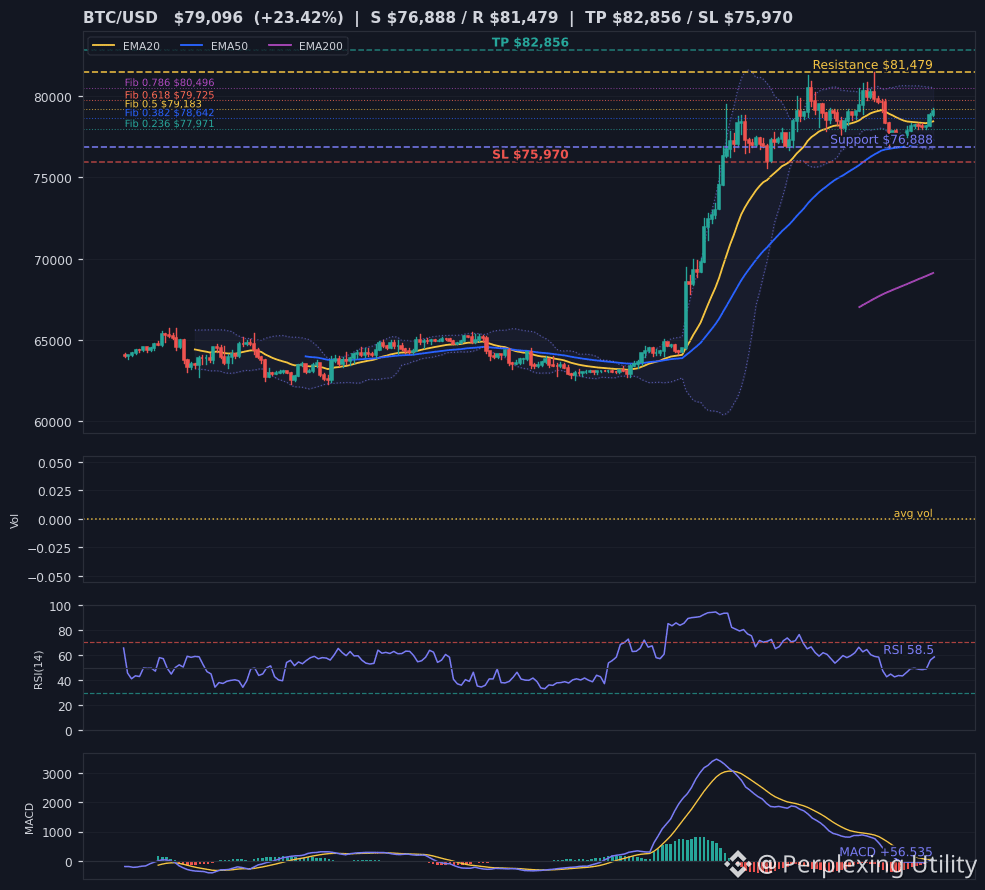
Bhai, Eric Trump ka tweet aaya hai — "The tides have turned for Bitcoin" — and this isn’t just one line; it’s like rocket fuel for retail FOMO. When the Trump family name comes alongside crypto, the market sentiment turns bullish instantly—and today BTC behaved the same way. Price is currently around $79,077, up +0.77% in the last 24 hours. And look, RSI is at 58—so it’s not overbought yet, but momentum is clearly forming. MACD also made a bullish cross, and EMA20/50/200 are all pointing above—structure looks solid.
Now let’s talk technically: Support is at $77,815, and resistance is at $79,167. The pivot is $79,032, and price is trading above it—good sign. Volume is a bit low (0.11x avg), but OBV is rising, meaning accumulation is happening. I feel this resistance will break, because the news flow and institutional adoption are both on the same side. But watch this: if $79,167 breaks, the next stop is $81,478—that road looks clear. If not, then we’ll likely come back to the $77,815 support.
My take: I’m bullish, but don’t jump in with pure FOMO. Watch the $79,167 daily close—if it stays above, this rally could push toward $81k+. Now tell me, what do you think—will this resistance break today, or will we see support tested again? Comment your side!
#Trading #Binance #Bitcoin #Crypto #MarketAnalysis
--
Disclaimer: My personal analysis, not financial advice. DYOR.
Bhai, Eric Trump ka tweet aaya hai — "The tides have turned for Bitcoin" — and this isn’t just one line; it’s like rocket fuel for retail FOMO. When the Trump family name comes alongside crypto, the market sentiment turns bullish instantly—and today BTC behaved the same way. Price is currently around $79,077, up +0.77% in the last 24 hours. And look, RSI is at 58—so it’s not overbought yet, but momentum is clearly forming. MACD also made a bullish cross, and EMA20/50/200 are all pointing above—structure looks solid.
Now let’s talk technically: Support is at $77,815, and resistance is at $79,167. The pivot is $79,032, and price is trading above it—good sign. Volume is a bit low (0.11x avg), but OBV is rising, meaning accumulation is happening. I feel this resistance will break, because the news flow and institutional adoption are both on the same side. But watch this: if $79,167 breaks, the next stop is $81,478—that road looks clear. If not, then we’ll likely come back to the $77,815 support.
My take: I’m bullish, but don’t jump in with pure FOMO. Watch the $79,167 daily close—if it stays above, this rally could push toward $81k+. Now tell me, what do you think—will this resistance break today, or will we see support tested again? Comment your side!
#Trading #Binance #Bitcoin #Crypto #MarketAnalysis
--
Disclaimer: My personal analysis, not financial advice. DYOR.
🔥 Bitcoin Buyers Step Back In As Realized Cap Gains $4.6 Billion, Is A Bull Market Finally Here? — The realized cap surging $4.6B is a direct on-chain signal of fresh buyer demand, fueling immediate BTC bull-market speculation.
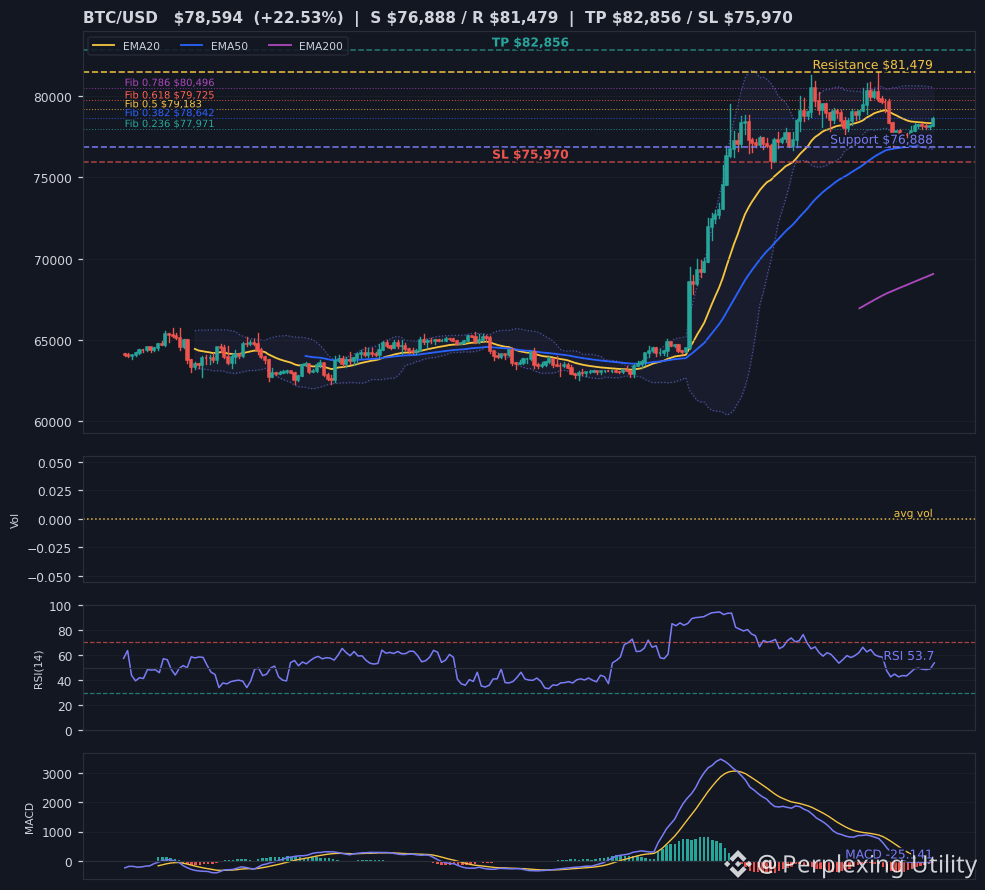
Bhai, ekdum fresh news aayi hai market mein — Bitcoin ka realized cap ek saath $4.6 billion upar chala gaya hai. Matlab on-chain data ke hisaab se naye buyers ne bhari demand dikhayi hai, aur log turant bol rahe hain "bull market wapas aa gayi kya?" I personally see this as a strong signal, because when the realized cap jumps like this, it means new money is entering—it's not just old holders selling. If you look at the chart, the price is around $78,585, and the pivot is there too—$78,495. That’s the key level. Resistance is at $79,167, and if that breaks, it could open the way up to $81,478. Support is at $77,741, and if that also fails, the price could drop to $76,888. RSI is 53—basically neutral, meaning neither overbought nor oversold, but the MACD is still slightly bearish, so the momentum hasn’t fully confirmed yet. Volume today is only 0.14x, which is very low, but OBV is rising—meaning buying is happening quietly. EMA20/50/200 are all bullish, so the long-term trend is in support. I think this pivot will hold and it will test the resistance at $79,167. If volume comes in from there, then a rally toward $81,478 is possible. But keep in mind—if $77,741 breaks, then this bullish story will fall apart. So tell me, what do you think—will the resistance at $79,167 break this week, or will price bounce back at support? Comment your prediction!
#Trading #Binance #Bitcoin #Crypto #MarketAnalysis
--
Disclaimer: My personal analysis, not financial advice. DYOR.
Bhai, ekdum fresh news aayi hai market mein — Bitcoin ka realized cap ek saath $4.6 billion upar chala gaya hai. Matlab on-chain data ke hisaab se naye buyers ne bhari demand dikhayi hai, aur log turant bol rahe hain "bull market wapas aa gayi kya?" I personally see this as a strong signal, because when the realized cap jumps like this, it means new money is entering—it's not just old holders selling. If you look at the chart, the price is around $78,585, and the pivot is there too—$78,495. That’s the key level. Resistance is at $79,167, and if that breaks, it could open the way up to $81,478. Support is at $77,741, and if that also fails, the price could drop to $76,888. RSI is 53—basically neutral, meaning neither overbought nor oversold, but the MACD is still slightly bearish, so the momentum hasn’t fully confirmed yet. Volume today is only 0.14x, which is very low, but OBV is rising—meaning buying is happening quietly. EMA20/50/200 are all bullish, so the long-term trend is in support. I think this pivot will hold and it will test the resistance at $79,167. If volume comes in from there, then a rally toward $81,478 is possible. But keep in mind—if $77,741 breaks, then this bullish story will fall apart. So tell me, what do you think—will the resistance at $79,167 break this week, or will price bounce back at support? Comment your prediction!
#Trading #Binance #Bitcoin #Crypto #MarketAnalysis
--
Disclaimer: My personal analysis, not financial advice. DYOR.
🔥 Bitcoin’s failed $81,000 breakout just put $75,000 back on the table — Bitcoin's failed breakout and slide toward $75K is the immediate price-action story traders are watching right now.
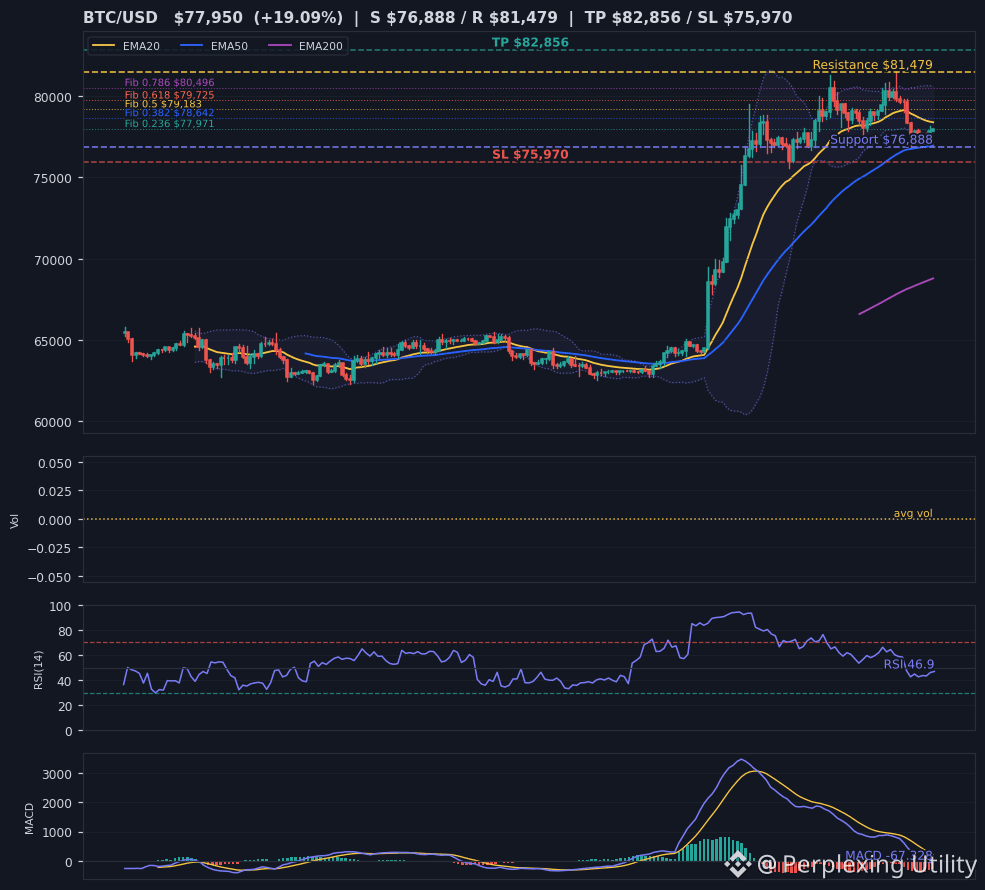
Bitcoin has started the same game we’ve seen before. It tried to break out above $81,000, but was immediately rejected there, and now the price has fallen back to around $77,950. This failed breakout is important because it brings the $75,000 level back into the discussion. In the last 24 hours, it’s down -1.2%, but the weekly trend is still slightly green.
Now let’s look at the technical picture. The price is currently at $77,971, right above the pivot point at $77,929. The first support level is $77,741, and if that breaks, there’s strong support at $76,888, marked on the chart. Resistance sits at $78,052, and above that there’s a major wall at $81,478. The RSI is at 47, meaning the market is neither overbought nor oversold—it’s just in the middle. The MACD has issued a bearish crossover, showing pressure in the short term. Volume is quite low—below average—so this move doesn’t look very convincing.
My personal view is that the $77,700 support is quite important. If it holds, Bitcoin could retest $78,000 again. But if it breaks, the psychological $75,000 level could return to the spotlight. The MACD is bearish, price is below the EMA20, so momentum isn’t in buyers’ favor right now. Personally, I’ll wait for the next move to confirm, because fakeouts are pretty common when volume is low.
What do you think, bro? Will $77,700 support hold, or will we see a drop toward $75,000? Let me know in the comments.
Disclaimer: This is only my analysis, not financial advice. Risk is always present in the market.
#Trading #Binance #Bitcoin #Crypto #MarketAnalysis
What's your read on this — bullish or bearish?
Bitcoin has started the same game we’ve seen before. It tried to break out above $81,000, but was immediately rejected there, and now the price has fallen back to around $77,950. This failed breakout is important because it brings the $75,000 level back into the discussion. In the last 24 hours, it’s down -1.2%, but the weekly trend is still slightly green.
Now let’s look at the technical picture. The price is currently at $77,971, right above the pivot point at $77,929. The first support level is $77,741, and if that breaks, there’s strong support at $76,888, marked on the chart. Resistance sits at $78,052, and above that there’s a major wall at $81,478. The RSI is at 47, meaning the market is neither overbought nor oversold—it’s just in the middle. The MACD has issued a bearish crossover, showing pressure in the short term. Volume is quite low—below average—so this move doesn’t look very convincing.
My personal view is that the $77,700 support is quite important. If it holds, Bitcoin could retest $78,000 again. But if it breaks, the psychological $75,000 level could return to the spotlight. The MACD is bearish, price is below the EMA20, so momentum isn’t in buyers’ favor right now. Personally, I’ll wait for the next move to confirm, because fakeouts are pretty common when volume is low.
What do you think, bro? Will $77,700 support hold, or will we see a drop toward $75,000? Let me know in the comments.
Disclaimer: This is only my analysis, not financial advice. Risk is always present in the market.
#Trading #Binance #Bitcoin #Crypto #MarketAnalysis
What's your read on this — bullish or bearish?
See translation
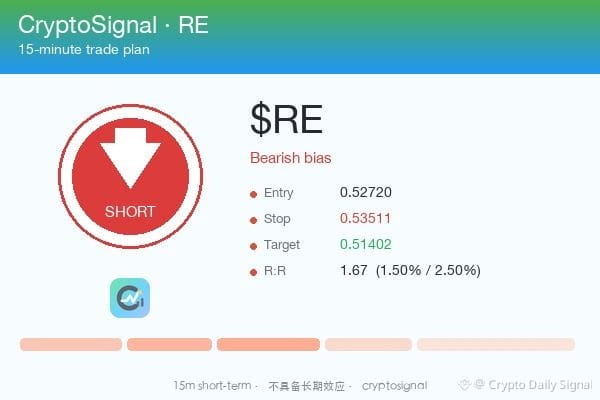
$RE look guys, this is a short setup right now. It's testing that local high that mirrors the old structural high, so overhead supply's stacked up tight. Also, the last candle got smacked hard with a big upper wick rejection against resistance. Momentum's just slowing down after that last little pump, which is what I'm playing. I'm fading this range top until it breaks down clean.
Plan (15m only): entry ~0.52720 · SL 0.53511 · TP 0.51402 · R:R 1.67
15m only — not a swing call.
#MarketAnalysis
Plan (15m only): entry ~0.52720 · SL 0.53511 · TP 0.51402 · R:R 1.67
15m only — not a swing call.
#MarketAnalysis

See translation
📊 Crypto Market Update — Real Analysis (Late August 2026)
The market has staged a strong recovery over the past couple of weeks. Here’s the current picture based on the latest data (as of August 28, 2026):
Current Snapshot
Bitcoin (BTC): Trading in the $78,500 – $80,300 range.
Surged sharply from the mid-$60,000s earlier this month and briefly broke above $81,000. Weekly gains peaked around 20–25%.
Ethereum (ETH): Holding near $2,450 – $2,500. Outperformed Bitcoin with weekly gains of roughly 28–32%.
Total Crypto Market Cap: Around $2.65 trillion – $2.70 trillion.
What’s Driving the Rally
Strong inflows into U.S. spot Bitcoin ETFs — one week alone saw approximately $1.92 billion in net inflows (strongest weekly figure since October 2025).
U.S. Treasury’s announcement to increase long-term bond buybacks improved liquidity expectations.
Short covering and relatively light positioning amplified the upward move.
Crypto Fear & Greed Index moved into the “Greed” zone (around 70–80).
Key Context
This is a solid recovery within a challenging year so far — not a new all-time-high campaign. Bitcoin remains roughly 35–37% below its October 2025 peak near $126,000.
Some analysts note the market is looking short-term overheated (profit-taking has started to appear), but institutional demand and continued ETF flows remain constructive.
Bottom Line
The market has clearly shifted direction. Institutional money is returning, but caution is still warranted. The $78,000–$80,000 zone has become an important support/resistance area to watch.
Data sources: CoinMarketCap, CoinGecko, CryptoQuant, ETF flow reports, and public market data (August 2026).
Not financial advice. Always DYOR and manage risk.
#CryptoMarket #bitcoin #Ethereum #MarketAnalysis #altcoins
The market has staged a strong recovery over the past couple of weeks. Here’s the current picture based on the latest data (as of August 28, 2026):
Current Snapshot
Bitcoin (BTC): Trading in the $78,500 – $80,300 range.
Surged sharply from the mid-$60,000s earlier this month and briefly broke above $81,000. Weekly gains peaked around 20–25%.
Ethereum (ETH): Holding near $2,450 – $2,500. Outperformed Bitcoin with weekly gains of roughly 28–32%.
Total Crypto Market Cap: Around $2.65 trillion – $2.70 trillion.
What’s Driving the Rally
Strong inflows into U.S. spot Bitcoin ETFs — one week alone saw approximately $1.92 billion in net inflows (strongest weekly figure since October 2025).
U.S. Treasury’s announcement to increase long-term bond buybacks improved liquidity expectations.
Short covering and relatively light positioning amplified the upward move.
Crypto Fear & Greed Index moved into the “Greed” zone (around 70–80).
Key Context
This is a solid recovery within a challenging year so far — not a new all-time-high campaign. Bitcoin remains roughly 35–37% below its October 2025 peak near $126,000.
Some analysts note the market is looking short-term overheated (profit-taking has started to appear), but institutional demand and continued ETF flows remain constructive.
Bottom Line
The market has clearly shifted direction. Institutional money is returning, but caution is still warranted. The $78,000–$80,000 zone has become an important support/resistance area to watch.
Data sources: CoinMarketCap, CoinGecko, CryptoQuant, ETF flow reports, and public market data (August 2026).
Not financial advice. Always DYOR and manage risk.
#CryptoMarket #bitcoin #Ethereum #MarketAnalysis #altcoins

Log in to explore more content