

#institutional
institutional
322,996 views
5,502 Discussing
Hot
Latest


·
--
See translation
$BTC - Coinbase Institutional co-CEO Brett Tejpaul says a second wave of institutional capital is arriving.
Seven major banks have integrated Coinbase infrastructure for crypto access.
Stablecoin payment rails are accelerating adoption, per Tejpaul.
Institutions still largely view Bitcoin as a speculative asset rather than treasury reserve.
The shift suggests infrastructure maturity is outpacing allocation mindset changes.
#Institutional #ETF
41

·
--
See translation
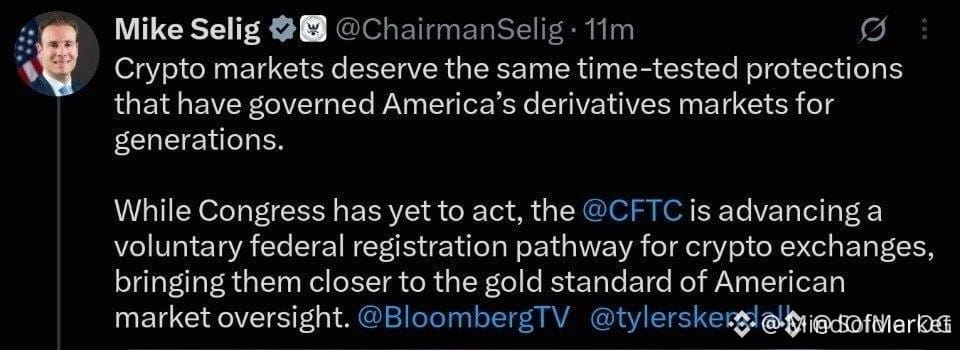
🚨 $BEAMX SET FOR INSTITUTIONAL INJECTION AFTER CFTC PROTECTION ANNOUNCEMENT 🚀
📊 The CFTC’s move to align crypto with U.S. derivatives standards creates a clear moat for institutional order flow, turning $BEAMX into a fresh liquidity magnet. ⚖️ Smart‑money hunters are already scanning the order‑block landscape for the first wave of compliant capital.
🦈 With compliance now a gatekeeper, expect tighter accumulation zones and a potential breakout as banks re‑enter the arena. 📈 The narrative flips from speculation to structured demand, setting the stage for a disciplined upside.
💬 Will you position ahead of the institutional influx or wait for the next regulatory cue? 👇
⚠️ Not financial advice. Always manage your risk. 🛡️
🏷️ #BEAMX #Regulation #Institutional #Crypto
🦈 🚀
3

See translation
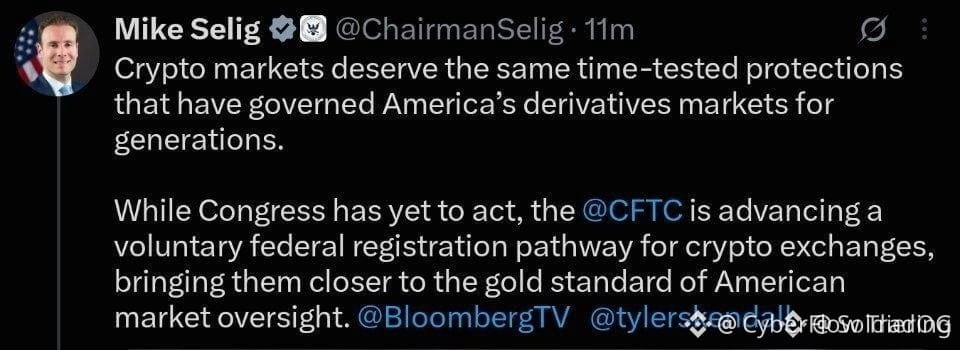
🚨 $BEAMX $CHIP $BULLA SET TO RIDE CFTC PROTECTION WAVE 🚀
📊 The CFTC’s pledge to grant crypto the same safeguards as U.S. derivatives is a game‑changer, nudging smart money toward the trio of tokens. ⚡ Institutional bids could flood in as compliance lifts the credibility shield, while the market watches for any liquidity sweep that tests the new rules. 🦈 Expect a short‑term volatility flare as traders scramble to position before the regulatory tide settles.
💬 How will the fresh regulatory guard reshape your allocation strategy for these assets? 👇
⚠️ Not financial advice. Always manage your risk. 🛡️
🏷️ #BEAMX #Regulation #Institutional #Crypto
🚀 ⚡
11

·
--
See translation
🚨 $BTC SURGES AS STRIVE LOCKS 43K IN TREASURY 🟢
Strive just pumped another 6,182 BTC into its vault, nudging the stash to a hefty 43,000. The whale move is a clear signal that smart money is still loading up, and the order book is feeling the pressure from the buy side. 📊
But the concentration is a double‑edged sword – a sudden dump could flood the market and trigger a sharp correction. Keep an eye on the liquidity pool; a sweep could flip the narrative in minutes. 🦈⚡
💬 Do you think this fresh treasury boost will fuel the next rally or set the stage for a pullback? 👇
⚠️ Not financial advice. Always manage your risk. 🛡️
🏷️ #BTC #Institutional #Accumulation #Crypto
🚀 🔥


8

Article
See translation
AETHER GLOBAL NEWS BITCOIN TECHNICAL INTELLIGENCE REPORT DATE October 25, 2026AUTHOR Farhan & Julian ASSET / PAIRBTC / USD (Spot & PERP) RELEASE DATE October 25, 2026
1. MACRO LIQUIDITY & STRUCTURAL CONTEXT
Bitcoin (BTC/USD) is executing a key structural retest of the $80,000 – $81,500 demand floor, currently trading at $80,200 following a multi-week corrective pullback from local range highs near $86,000. Macro dynamic pressures continue to shape short-term capital deployment. Elevated crude oil prices and tightening global bond yields have induced defensive cross-asset de-risking. However, high-timeframe structural health remains intact, with spot exchange reserve continuing to drain into institutional custody.
VISUAL TECHNICAL STRUCTURE & KEY LEVELS MAP
MULTI-INDICATOR ANALYTICAL BREAKDOWN
A systematic synthesis across trend, volatility, and volume indicators demonstrates that Bitcoin's recent pullback represents orderly value-area rebalancing rather than #Institutional #Liquidations On-Balance Volume (OBV) has flattened across the daily timeframe, confirming that spot allocation desks are withholding supply from the market.
INSTITUTIONAL EXECUTION PLAYBOOK
ANATOMY OF BOLLINGER BANDSANATOMY OF BOLLINGER BANDS
OPTIMAL TIMEFRAMES 1H / 4H / Daily
Developed by John Bollinger, Bollinger Bands measure market volatility dynamically. The indicator consists of a center 20-period Simple Moving Average (SMA) flanked by upper and lower envelope bands set 2 standard deviations away. Statistically, price trades within these boundaries approximately 95% of the time, making breakouts outside the bands significant volatility events.
VOLATILITY SQUEEZE & BAND EXPANSION MODEL
UNDERSTANDING VOLUME PROFILE (VPVR)
Unlike standard volume indicators that plot #trading volume over time (x-axis), Volume Profile displays trading activity across specific price levels (y-axis). It calculates where the most trading volume occurred over a given period, revealing true institutional support, resistance, and fair value zones.
CONFLUENCE FRAMEWORK: COMBINING BANDS & VOLUME PROFILE
KEY EXECUTION TAKEAWAYS & RISK RULES
When combining Bollinger Bands with Volume Profile, always prioritize volume structure over band touches. A Bollinger Band touch during a strong volume expansion is a signal of trend strength, not an overbought indicator. Only take mean-reversion counter-trend trades when price reaches outer band limits concurrently with high-volume value area boundaries (VAH/VAL).
ANATOMY OF THE MACD INDICATOR
The Moving Average Convergence Divergence (MACD) is a trend-following momentum indicator that illustrates the relationship between two exponential moving averages (EMAs) of Bitcoin's price. By combining momentum and trend evaluation, it allows traders to identify momentum acceleration, direction shifts, and exhaustion points before they manifest in price structure.
VISUAL MECHANICS & BULLISH DIVERGENCE MAPPING
CORE MACD SIGNAL REFERENCE
MULTI-TIMEFRAME INSTITUTIONAL EXECUTION STRATEGY
Because the MACD is a lagging indicator derived from historical moving averages, trading raw crossovers during sideways consolidation frequently results in false signals ("whipsaws"). To achieve institutional precision when trading Bitcoin, traders must implement a top-down multi-timeframe confirmation framework.
STEP 1: ESTABLISH HIGH-TIMEFRAME (HTF) MARKET BIAS
Examine the Daily (1D) Chart MACD posture. If the Daily MACD Line is trading above the zero line with expanding histogram bars, only look for long setups on lower timeframes. If the Daily MACD is below zero, treat rallies as corrective moves.
STEP 2: IDENTIFY STRUCTURAL CONFLUENCE ZONE
Locate key structural support or resistance on the price chart (e.g., Bitcoin's $80,000 Point of Control or 50-day SMA). Never trade a MACD crossover in mid-air without structural price backing.
STEP 3: TRIGGER LOW-TIMEFRAME (LTF) ENTRY
Drop to the 15-Minute or 1-Hour Chart. Wait for a bullish signal-line crossover occurring below the zero line, accompanied by the first light-green histogram bar print signaling momentum expansion.
ADVANCED DIVERGENCE MATRIX & RULES
STRATEGIC RISK MANAGEMENT & LIMITATIONS
Avoiding Consolidation Chop: During period of low volatility, such as when Bollinger Bands tighten into a squeeze, the MACD lines will cross back and forth repeatedly. Filter out these false entries by requiring RSI confirmation and volume expansion. Always cap single-trade exposure to 1.0%–1.5% of portfolio capital.
Fib Retracement & Extension
CORE CONCEPTS & MATHEMATICAL RATIOS
The Fibonacci Retracement indicator is built upon numerical sequence ratios found throughout nature and financial markets. Derived from dividing numbers in the Fibonacci sequence (e.g., 21/34 = 0.618), these horizontal grid levels act as dynamic algorithmic reaction zones where Bitcoin pullbacks tend to find structural support or resistance before resuming the primary trend.
FIBONACCI EXTENSION TARGET FRAMEWORK
While retracement levels identify where pullbacks complete, Fibonacci Extensions project price objectives after a breakout above prior swing highs. In Bitcoin trading, automated institutional execution algorithms use extension targets to scale out of profitable momentum positions.
CONSERVATIVE TAKE PROFIT
1.272 Fib Extension
PRIMARY MACRO TARGET
1.618 Golden Extension
BLOW-OFF PEAK TARGET
2.618 Fib Extension
STEP-BY-STEP DRAWING & CONFLUENCE EXECUTION
STEP 1: ANCHOR OBJECTIVE STRUCTURAL SWING POINTS
In an uptrend, anchor the tool from the absolute Swing Low to Swing High. Avoid drawing across subjective minor wicks; select structural swing pivots confirmed by daily timeframe volume spikes.
STEP 2: STACK MULTI-INDICATOR CONFLUENCE
Never trade a Fib level in isolation. Higher probability entries occur when the 0.618 Golden Pocket overlaps with a Volume Profile High Volume Node (HVN) or 200-period Exponential Moving Average.
STRATEGIC FIB CONFLUENCE PLAYBOOK
RISK MANAGEMENT & INVALIDATION RULES
When taking long entries within the 0.618 Golden Pocket, always place your hard stop-loss slightly below the 0.786 Fib level or the anchor 1.000 swing low. If Bitcoin liquidates past the 78.6% level on heavy volume, the original trend structure is considered structurally invalidated.
SUPPORT RESISTANCE
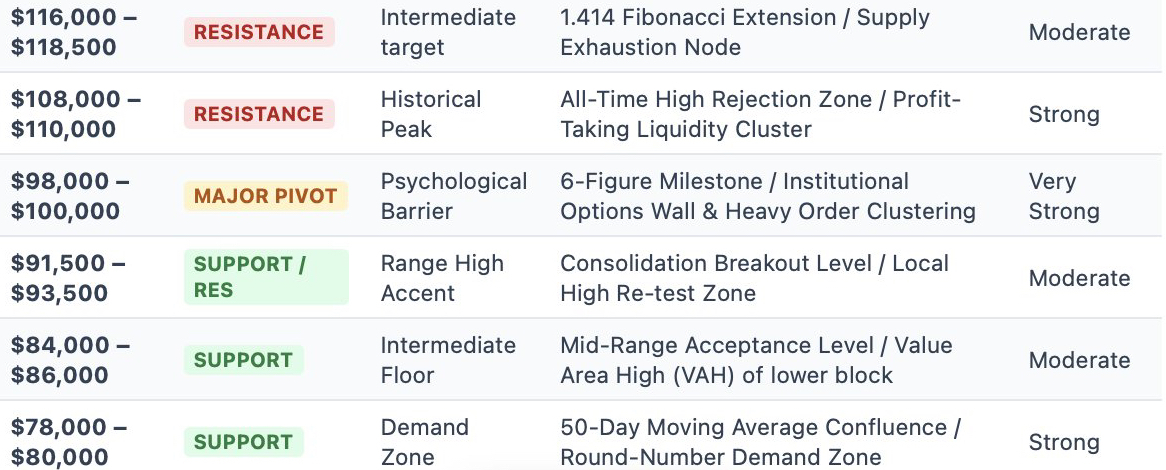
This technical report provides a mapping of key macro support and resistance levels for Bitcoin (BTC) within the range of $48,000 to $128,000. Analysis is based on high-timeframe (HTF) price action, volume profile (VPVR), key order book liquidity clusters, realized price bands, and major Fibonacci extension nodes. Understanding these zones allows institutional and retail traders to establish structural bias, plan risk management, and anticipate breakout volatility across major price cycles.
MACRO LEVEL DIRECTORY ($48,000 – $128,000)
DETAILED BREAKDOWN: MAJOR SUPPORT ZONES ($48,000 – $74,500)
ORDER BOOK & MARKET DYNAMICS (LOWER RANGE)
Structural Takeaway for Support Bands $BTC ($48k - $80k)
The $60,000 to $74,500 corridor represents the core structural engine of the bull #markets As long as weekly candle closes remain above $73,200, price action favors continuation toward six-figure targets. Loss of $60,000 opens risk to deeper re-accumulation around the $48,000 macro anchor.
DETAILED BREAKDOWN: OVERHEAD RESISTANCE ZONES ($84,000 – $128,000)
Risk & Trading Execution Framework
#Bullish Scenario: Holding above $73,500 keeps targets of $98K–$100K in play. A clean breakout above $100K opens expansion toward $108K and the macro peak target of $124K–$128K.
Bearish Correction Scenario: Loss of $73,500 signals a deeper pullback toward the high-volume node at $60,000. Risk protection stops are typically placed below key structural swing lows ($58,000 or $48,000 depending on timeframe).
$ETH
$SOL
$BNB
coming too soon
AETHER GLOBAL NEWS BITCOIN TECHNICAL INTELLIGENCE REPORT DATE October 25, 2026
AUTHOR Farhan & Julian ASSET / PAIRBTC / USD (Spot & PERP) RELEASE DATE October 25, 2026
1. MACRO LIQUIDITY & STRUCTURAL CONTEXT
Bitcoin (BTC/USD) is executing a key structural retest of the $80,000 – $81,500 demand floor, currently trading at $80,200 following a multi-week corrective pullback from local range highs near $86,000. Macro dynamic pressures continue to shape short-term capital deployment. Elevated crude oil prices and tightening global bond yields have induced defensive cross-asset de-risking. However, high-timeframe structural health remains intact, with spot exchange reserve continuing to drain into institutional custody.
VISUAL TECHNICAL STRUCTURE & KEY LEVELS MAP
MULTI-INDICATOR ANALYTICAL BREAKDOWN
A systematic synthesis across trend, volatility, and volume indicators demonstrates that Bitcoin's recent pullback represents orderly value-area rebalancing rather than #Institutional #Liquidations On-Balance Volume (OBV) has flattened across the daily timeframe, confirming that spot allocation desks are withholding supply from the market.
INSTITUTIONAL EXECUTION PLAYBOOK
ANATOMY OF BOLLINGER BANDSANATOMY OF BOLLINGER BANDS
OPTIMAL TIMEFRAMES 1H / 4H / Daily
Developed by John Bollinger, Bollinger Bands measure market volatility dynamically. The indicator consists of a center 20-period Simple Moving Average (SMA) flanked by upper and lower envelope bands set 2 standard deviations away. Statistically, price trades within these boundaries approximately 95% of the time, making breakouts outside the bands significant volatility events.
VOLATILITY SQUEEZE & BAND EXPANSION MODEL
UNDERSTANDING VOLUME PROFILE (VPVR)
Unlike standard volume indicators that plot #trading volume over time (x-axis), Volume Profile displays trading activity across specific price levels (y-axis). It calculates where the most trading volume occurred over a given period, revealing true institutional support, resistance, and fair value zones.
CONFLUENCE FRAMEWORK: COMBINING BANDS & VOLUME PROFILE
KEY EXECUTION TAKEAWAYS & RISK RULES
When combining Bollinger Bands with Volume Profile, always prioritize volume structure over band touches. A Bollinger Band touch during a strong volume expansion is a signal of trend strength, not an overbought indicator. Only take mean-reversion counter-trend trades when price reaches outer band limits concurrently with high-volume value area boundaries (VAH/VAL).
ANATOMY OF THE MACD INDICATOR
The Moving Average Convergence Divergence (MACD) is a trend-following momentum indicator that illustrates the relationship between two exponential moving averages (EMAs) of Bitcoin's price. By combining momentum and trend evaluation, it allows traders to identify momentum acceleration, direction shifts, and exhaustion points before they manifest in price structure.
VISUAL MECHANICS & BULLISH DIVERGENCE MAPPING
CORE MACD SIGNAL REFERENCE
MULTI-TIMEFRAME INSTITUTIONAL EXECUTION STRATEGY
Because the MACD is a lagging indicator derived from historical moving averages, trading raw crossovers during sideways consolidation frequently results in false signals ("whipsaws"). To achieve institutional precision when trading Bitcoin, traders must implement a top-down multi-timeframe confirmation framework.
STEP 1: ESTABLISH HIGH-TIMEFRAME (HTF) MARKET BIAS
Examine the Daily (1D) Chart MACD posture. If the Daily MACD Line is trading above the zero line with expanding histogram bars, only look for long setups on lower timeframes. If the Daily MACD is below zero, treat rallies as corrective moves.
STEP 2: IDENTIFY STRUCTURAL CONFLUENCE ZONE
Locate key structural support or resistance on the price chart (e.g., Bitcoin's $80,000 Point of Control or 50-day SMA). Never trade a MACD crossover in mid-air without structural price backing.
STEP 3: TRIGGER LOW-TIMEFRAME (LTF) ENTRY
Drop to the 15-Minute or 1-Hour Chart. Wait for a bullish signal-line crossover occurring below the zero line, accompanied by the first light-green histogram bar print signaling momentum expansion.
ADVANCED DIVERGENCE MATRIX & RULES
STRATEGIC RISK MANAGEMENT & LIMITATIONS
Avoiding Consolidation Chop: During period of low volatility, such as when Bollinger Bands tighten into a squeeze, the MACD lines will cross back and forth repeatedly. Filter out these false entries by requiring RSI confirmation and volume expansion. Always cap single-trade exposure to 1.0%–1.5% of portfolio capital.
Fib Retracement & Extension
CORE CONCEPTS & MATHEMATICAL RATIOS
The Fibonacci Retracement indicator is built upon numerical sequence ratios found throughout nature and financial markets. Derived from dividing numbers in the Fibonacci sequence (e.g., 21/34 = 0.618), these horizontal grid levels act as dynamic algorithmic reaction zones where Bitcoin pullbacks tend to find structural support or resistance before resuming the primary trend.
FIBONACCI EXTENSION TARGET FRAMEWORK
While retracement levels identify where pullbacks complete, Fibonacci Extensions project price objectives after a breakout above prior swing highs. In Bitcoin trading, automated institutional execution algorithms use extension targets to scale out of profitable momentum positions.
CONSERVATIVE TAKE PROFIT
1.272 Fib Extension
PRIMARY MACRO TARGET
1.618 Golden Extension
BLOW-OFF PEAK TARGET
2.618 Fib Extension
STEP-BY-STEP DRAWING & CONFLUENCE EXECUTION
STEP 1: ANCHOR OBJECTIVE STRUCTURAL SWING POINTS
In an uptrend, anchor the tool from the absolute Swing Low to Swing High. Avoid drawing across subjective minor wicks; select structural swing pivots confirmed by daily timeframe volume spikes.
STEP 2: STACK MULTI-INDICATOR CONFLUENCE
Never trade a Fib level in isolation. Higher probability entries occur when the 0.618 Golden Pocket overlaps with a Volume Profile High Volume Node (HVN) or 200-period Exponential Moving Average.
STRATEGIC FIB CONFLUENCE PLAYBOOK
RISK MANAGEMENT & INVALIDATION RULES
When taking long entries within the 0.618 Golden Pocket, always place your hard stop-loss slightly below the 0.786 Fib level or the anchor 1.000 swing low. If Bitcoin liquidates past the 78.6% level on heavy volume, the original trend structure is considered structurally invalidated.
SUPPORT RESISTANCE
This technical report provides a mapping of key macro support and resistance levels for Bitcoin (BTC) within the range of $48,000 to $128,000. Analysis is based on high-timeframe (HTF) price action, volume profile (VPVR), key order book liquidity clusters, realized price bands, and major Fibonacci extension nodes. Understanding these zones allows institutional and retail traders to establish structural bias, plan risk management, and anticipate breakout volatility across major price cycles.
MACRO LEVEL DIRECTORY ($48,000 – $128,000)
DETAILED BREAKDOWN: MAJOR SUPPORT ZONES ($48,000 – $74,500)
ORDER BOOK & MARKET DYNAMICS (LOWER RANGE)
Structural Takeaway for Support Bands $BTC ($48k - $80k)
The $60,000 to $74,500 corridor represents the core structural engine of the bull #markets As long as weekly candle closes remain above $73,200, price action favors continuation toward six-figure targets. Loss of $60,000 opens risk to deeper re-accumulation around the $48,000 macro anchor.
DETAILED BREAKDOWN: OVERHEAD RESISTANCE ZONES ($84,000 – $128,000)
Risk & Trading Execution Framework
#Bullish Scenario: Holding above $73,500 keeps targets of $98K–$100K in play. A clean breakout above $100K opens expansion toward $108K and the macro peak target of $124K–$128K.
Bearish Correction Scenario: Loss of $73,500 signals a deeper pullback toward the high-volume node at $60,000. Risk protection stops are typically placed below key structural swing lows ($58,000 or $48,000 depending on timeframe).
$ETH
$SOL
$BNB
coming too soon
101
See translation
🚨 INSTITUTIONAL GIANTS ARE SECURING $ETH LIQUIDITY AS GLOBAL BANKING FLIPS BULLISH! 🏦
Smart money isn't waiting around for retail confirmation. Standard Chartered just unlocked spot $ETH trading for institutional heavyweight clients in the UAE, marking the first G-SIB banking titan to step directly into the arena there. 🏦
Pairing this direct trading arm with their regional custody infrastructure creates a seamless bridge for deep institutional capital to flow straight into Ethereum networks. 📊 Traditional finance is systematically laying down the pipelines to absorb liquidity across prime global hubs. 🌊
When Tier-1 global banks begin building permanent infrastructure, retail usually finds out far too late. 💬 Will rival G-SIB giants be forced to accelerate their crypto desks to compete in the region? 👇
⚠️ Not financial advice. Always manage your risk. 🛡️
🏷️ #ETH #Ethereum #Institutional #Crypto
🦈 💎
4

See translation
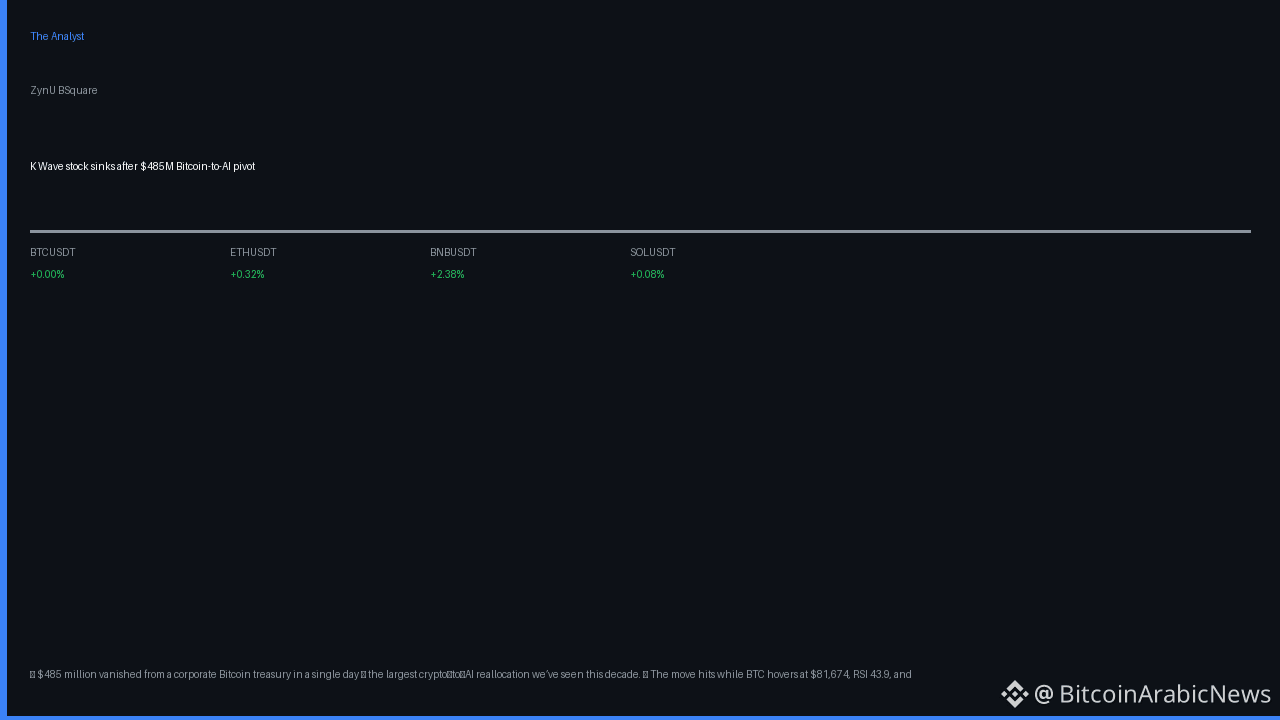
🔥 $485 million vanished from a corporate Bitcoin treasury in a single day — the largest crypto‑to‑AI reallocation we’ve seen this decade.
📊 The move hits while BTC hovers at $81,674, RSI 43.9, and a neutral 50‑point sentiment, meaning the market isn’t pricing in a massive sell‑off.
💡 Smart‑money metrics confirm the paradox: BTC futures open interest sits at $7.56 B with a +0.0100 % funding rate (longs paying), while top traders remain net long (60.8%); yet K Wave’s $485 M exit signals institutional risk‑off to AI, echoing the #BTC #AI #Institutional narrative that capital is chasing sector hype over pure crypto exposure.
🚀 Watch the $82,200 resistance on BTC — a decisive close above it, coupled with a sustained funding premium above +0.01 %, would validate that the AI‑driven capital flight is temporary and could spark a rebound; conversely, a break below $80,800 with funding turning negative would confirm a broader risk‑off, a catalyst for further K Wave stock pressure. #Funding
❓ If AI truly eclipses Bitcoin as the next institutional darling, are we about to witness a permanent re‑allocation of treasury balances or just a fleeting hype cycle?

See translation
🚨 $BTC SURGES ON FIRST INSTITUTIONAL ETF GREENLIGHT! 📈
🦈 Franklin Templeton just cleared Nasdaq for two Bitcoin ETFs, letting smart‑money flow into BTC with a capped 20% exposure. 📊 The hybrid dividend‑reinvestment structure locks in income while giving a taste of upside, a move regulators designed to temper volatility. ⚡ As the launch window narrows this quarter, liquidity seekers are already positioning for a modest demand lift, and the market’s pulse feels a cautious optimism.
💬 Will this institutional gateway shift your BTC allocation game? 👇
⚠️ Not financial advice. Always manage your risk. 🛡️
🏷️ #BTC #ETF #Institutional #Crypto
🚀 🔥


19
See translation
🔥 At 02:17 UTC, a muted ping on GSR’s inbox turned into a market tremor – SC Ventures just inked a multi‑million backing that could turn the institutional crypto frontier into a runway.
📊 Within minutes, the news hit the floor: GSR, the silent architect behind billions of crypto liquidity pools, announced the partnership to accelerate tokenization and bridge‑funding for banks eyeing digital assets. The timing is uncanny – BTC sits at $81,584 with a bearish RSI of 43.1, OI perched at $7.55 B and funding at +0.0100% as longs still dominate 68.7% of contracts, while BNB rallies +1.98% to $748, flashing a bullish RSI of 62.7. #Institutional investors are now watching GSR’s move like a beacon, #Tokenization gains a fresh runway, and #DeFi infrastructure finally gets a heavyweight sponsor.
💡 The twist? While the broader market drifts in neutral sentiment, the influx of venture capital signals that the real battle isn’t price direction but who will own the plumbing that routes the next $100 B of institutional capital into crypto.
❓ Will GSR’s new engine reshape the liquidity map fast enough to catch the next funding surge, or will the market’s bearish undercurrents swallow the momentum before it even lifts off?
1
See translation
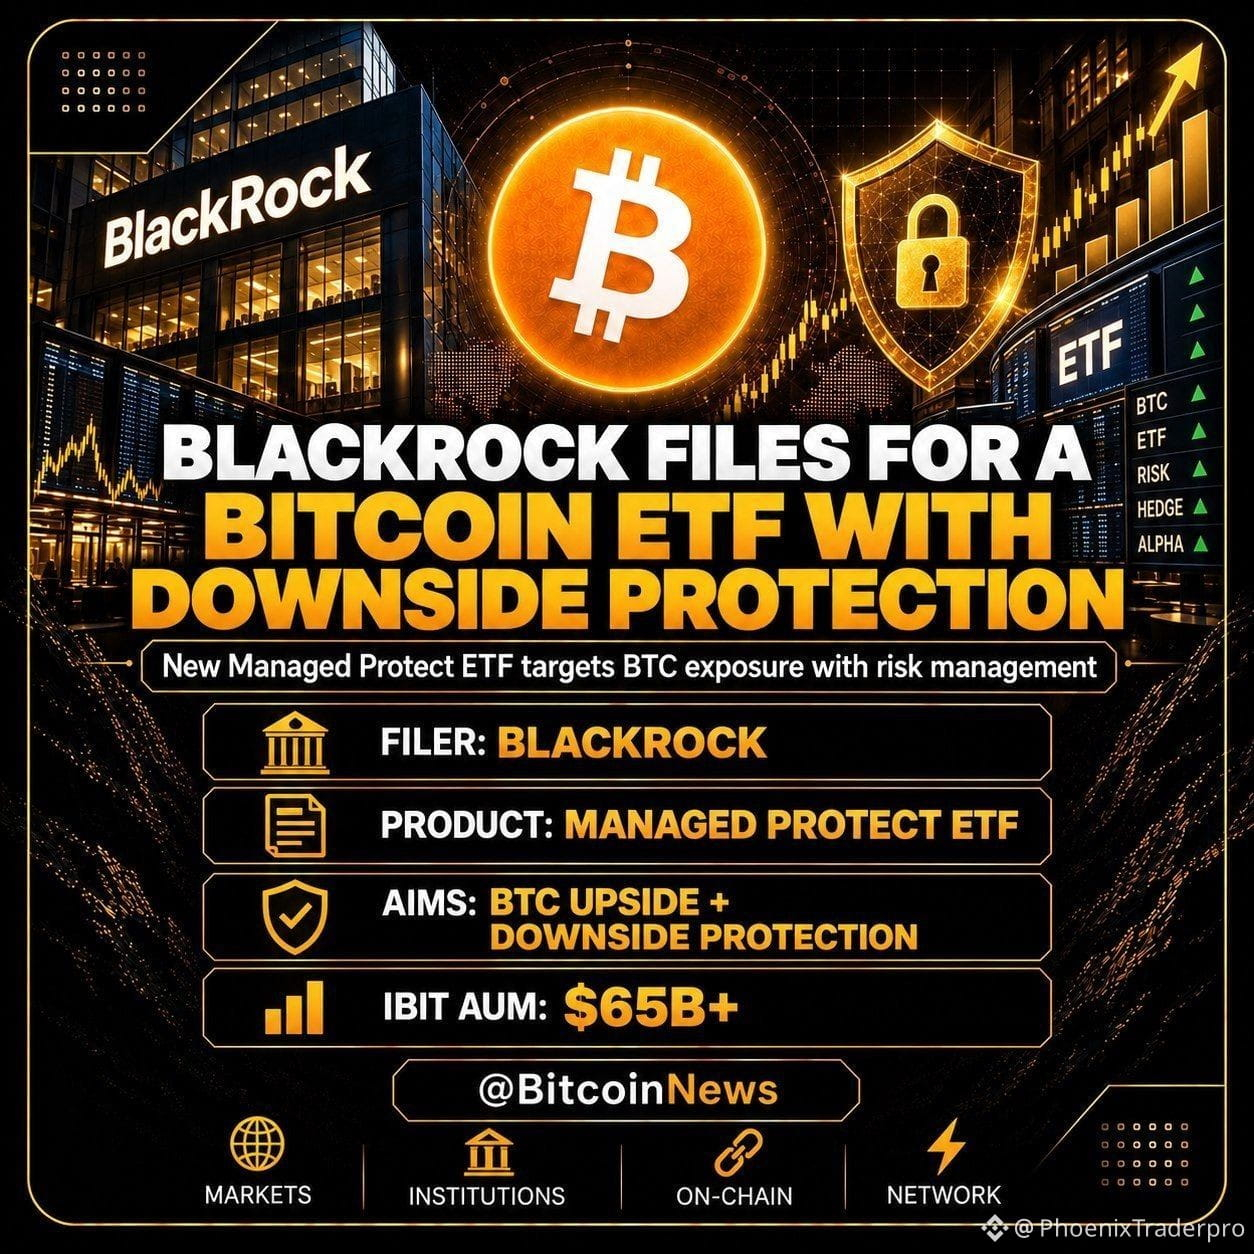
🚀 $BTC SURGE DRIVEN BY BLACKROCK'S PROTECTED ETF LAUNCH! 🟢
📊 Institutional appetite is turning the tide as BlackRock files its iShares Bitcoin Managed Protect ETF. The product promises growth exposure while capping upside and embedding a risk‑shield layer, a clear signal that Wall Street is engineering smarter BTC playbooks. 🦈
⚡ This move could tighten supply‑demand dynamics, prompting a fresh liquidity sweep as whales position before the protect‑cap kicks in. Expect volume to spike and price to test the next resistance as the market digests the protective constraints. 💡
💬 How will the capped upside reshape your BTC allocation strategy? 👇
⚠️ Not financial advice. Always manage your risk. 🛡️
🏷️ #BTC #ETF #Institutional #Crypto
🔥 💎
10

·
--
See translation
🚨 $STARK AI SAFETY SHIFT SIGNALS INSTITUTIONAL REFOCUS 🦈
StarkWare's AI chief Abdel Bakhta exits, flagging AI safety as a top‑tier systemic risk. His pivot to mathematics‑driven safety frameworks signals a potential reallocation of capital toward cryptographic safeguards 🦈.
Smart‑money eyes on $STARK could tighten as institutional labs chase verifiable intelligence. Expect tighter order‑block formations around current support as the market digests the strategic shift 📊⚡.
💬 How will this AI‑safety narrative reshape $STARK 's demand curve in the coming weeks? 👇
⚠️ Not financial advice. Always manage your risk. 🛡️
🏷️ #STARK #AI #Crypto #Institutional
🔥 💎
12

See translation
BlackRock and other ETFs just dumped $635.5M worth of $BTC
Largest daily outflow in 4 months. The selling pressure hit right as price was trying to hold the higher levels.
Big flows like this usually create short-term volatility. Question is whether this is just a one-day event or the start of more institutional selling.
You treating this as a dip or staying cautious?
#Bitcoin #Institutional
85
·
--
See translation
$BTC - The cycle's engine has changed: Wall Street now structures credit around BTC.
Allen Helm details institutional digital credit frameworks replacing retail flow.
Record ETF inflows confirm boardroom adoption accelerating.
Price discovery now hinges on corporate treasuries and fund allocators, not individual buyers - sustainability without retail remains unproven.
#ETF #Institutional
33

·
--
See translation
🚀 $BTC INSTITUTIONAL INSURANCE EVOLVES WITH POST‑QUANTUM PARTNERSHIP 🦈
Project Eleven and Relm Insurance have locked in a development partnership to embed post‑quantum controls into institutional custody, a move that could rewrite the risk calculus for digital‑asset insurers. 🦈
By separating the cryptography layer from approval rules, Strongpoint lets custodians swap signing algorithms without breaking audit trails, giving underwriters concrete evidence of quantum readiness. 📊 This early‑stage research may translate into lower premiums for firms that demonstrate robust defenses. 💡
Smart‑money institutions that adopt these safeguards now could lock in a pricing advantage before the quantum threat materializes. 📌
💬 How do you see post‑quantum readiness reshaping insurance pricing for digital assets? 👇
⚠️ Not financial advice. Always manage your risk. 🛡️
🏷️ #BTC #Institutional #PostQuantum #Insurance #Crypto
🦈 🚀
10
·
--
See translation
$BTC - Eight U.S. funds pull in 528.4M Wednesday, pushing three-day net inflows above 1B.
BlackRock and Fidelity lead as institutional demand widens across eight products.
Wednesday alone marked the largest single-day haul since July.
Broadening participation suggests deeper institutional allocation, not just a few mega-funds.
Flow momentum may persist if macro backdrop holds.
#Institutional #ETF
64

See translation
Bitcoin ETFs just printed their strongest week in months — but the fine print tells a cooler story.
U.S. spot Bitcoin ETFs pulled in $1.08 billion across three trading days this week, per SoSoValue data via CoinDesk. Monday alone drew $527 million — the biggest single-day haul since September 22.
Zoom out, though: since July 1, daily inflows have averaged just $86 million, less than half the $200M+ daily pace that accompanied every steep Bitcoin rally since January 2024. Seven $500M+ days sounds fine until you see that's one in eleven trading days, versus one in five during past rallies.
Giottus CEO Vikram Subburaj summed it up: "Institutional demand shows tentative improvement. However, flows remain volatile and sustained inflows are needed to confirm a stronger recovery."
So the real question isn't whether $1.08B is big — it's whether next week repeats. Your read: fresh institutional bid, or one good week in a thinning trend?
$BTC #Bitcoin #ETF #CryptoNews #Institutional
4
See translation
Corporate bitcoin treasuries are profitable — and they're barely buying anymore.
Glassnode's latest report puts the average cost basis of the BTC treasury companies it tracks at ~$80,200. Bitcoin has closed above that line every day since September 18 — so the group sits on unrealized profit. But their buying hasn't returned with the price: every month since June has added less than a tenth of the November 2024 peak.
Think about what that means. The October 15 sweep to $80.1K bounced right off that cost base — bids are still there when price dips. Yet the aggressive monthly accumulation that defined the treasury-company bid has vanished. In profit, underwater on appetite.
Why it matters: treasury companies became one of this cycle's structural buyers. If the group holding BTC at $80.2K decides it has enough, the next leg up needs a different buyer.
What would it take for the corporate bid to return — a break above $87K, or something else entirely? NFA, DYOR. $BTC #Bitcoin #CryptoNews #Institutional #BitcoinTreasury
14
·
--
See translation
🦈 $LIT SETS SIGHTS ON U.S. INSTITUTIONAL LICENSEES 🚨
📊 Lighter’s CEO confirmed the imminent DCM and DCO filings, aligning on‑chain mechanics with CFTC core principles. The groundwork is already in place, so the 280‑day review window could be a formality, unlocking a regulated gateway for institutional capital. ⚡
📌 The market responded instantly, spiking 15% to $3.76 as traders price in a potential partnership corridor with major U.S. platforms. Liquidity pools are reshaping, and smart money may be positioning ahead of the next compliance‑driven surge. 💬 Do you anticipate a fresh influx of institutional orders into $LIT now? 👇
⚠️ Not financial advice. Always manage your risk. 🛡️
🏷️ #LIT #Institutional #Regulation #Crypto
🔥 💎
50

See translation
🚀 $LIT SURGES 15% AFTER COMPLIANCE WIN! 🟢
📊 Lighter’s push for DCM and DCO licenses is a clear signal that institutional pipelines are opening. The CFTC dialogue has already mapped core on‑chain mechanics, so the regulator’s 280‑day review window feels more like a formality than a hurdle. ⚡
🦈 With the U.S. institutional gateway in sight, the market is pricing in tighter ties to a major broker platform, hinting at fresh liquidity inflows and deeper order books. 💡 That 15% rally to $3.76 is just the first wave of a potential liquidity sweep. 💬 How are you positioning for the next institutional surge? 👇
⚠️ Not financial advice. Always manage your risk. 🛡️
🏷️ #LIT #Institutional #Compliance #Crypto
🔥 💎
50
See translation
🚀 $ZODIA GEARING UP FOR INSTITUTIONAL SWEEP AFTER SC BUYOUT 🦈
📊 Standard Chartered’s move to lock in 100% of Zodia Custody reads like a megaphone for institutional confidence, turning the custodian into a smart‑money conduit. 🦈 The bank’s venture arm will spin off the software, keeping the custody engine tight under SC’s banner.
🌊 This integration could funnel a fresh wave of institutional liquidity into a top‑tier exchange, tightening on‑chain supply and setting the stage for a bullish pressure build‑up. 📈 Expect order flow to tighten around key custody‑related tokens as banks chase the next secure yield play.
💬 How do you see this reshaping institutional demand for crypto custody in the coming weeks? 👇
⚠️ Not financial advice. Always manage your risk. 🛡️
🏷️ #ZODIA #Custody #Institutional #Crypto
🔥 💎
2
Log in to explore more content
Join global crypto users on Binance Square
⚡️ Get latest and useful information about crypto.
💬 Trusted by the world’s largest crypto exchange.
👍 Discover real insights from verified creators.
Email / Phone number
Trending Topics
1
#BinancePick
3M views
152,590 Discussing
2
#EarningsSeason
5.3M views
25,956 Discussing
3
#AnthropicTTMRevenueGrewAbout1200%
27,752 views
397 Discussing
4
#AnthropicS1ExpectedToday
25,059 views
331 Discussing
5
#SouthKoreaReportedlyWeighsFourthCryptoTaxDelay
29,709 views
455 Discussing
6
#FranklinTempletonFilesForTwoDividendToBitcoinETFs
39,106 views
529 Discussing
7
#StrategyMSTRSurpassesNasdaqInMarketCap
29,595 views
380 Discussing
8
#CanadaProposesStablecoinRedemptionWithin3BusinessDays
1,304 views
36 Discussing
9
#ElectrumWalletBugLetRogueServersStealFunds
30,562 views
457 Discussing
10
#ArgentineCourtDismissesLIBRACaseAgainstMilei
45,809 views
569 Discussing