
#45
45
29,132 views
70 Discussing
Hot
Latest

·
--
Behind the 45% surge, the real signal is trading volume
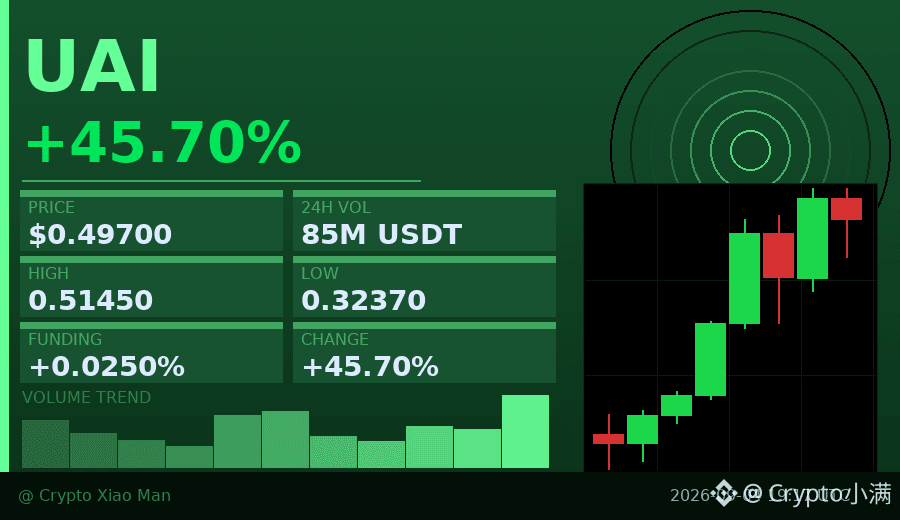
What’s most worth watching in this UAI rally is not just the price, but the support from volume. In 8 hours, it climbed from 0.38 all the way to 0.51, while trading volume expanded from 6 million to the 30 million range — this is real money coming in, not a hollow pump.
A funding rate of 0.025% is not extreme, and a long/short ratio of 56% to 44% also shows no excessive crowding. That suggests this rally still has room to run, and it’s not yet at the point where everyone is piling in.
The candlestick chart shows an 8-hour sustained uptrend, with buying interest stepping in on every pullback. This kind of pace is healthier than an overnight spike.
$UAI #成交量放大 #45% gain
Click the card below to quickly view the market行情👇
Behind the 45% surge, the real signal is trading volume
What’s most worth watching in this UAI rally is not just the price, but the support from volume. In 8 hours, it climbed from 0.38 all the way to 0.51, while trading volume expanded from 6 million to the 30 million range — this is real money coming in, not a hollow pump.
A funding rate of 0.025% is not extreme, and a long/short ratio of 56% to 44% also shows no excessive crowding. That suggests this rally still has room to run, and it’s not yet at the point where everyone is piling in.
The candlestick chart shows an 8-hour sustained uptrend, with buying interest stepping in on every pullback. This kind of pace is healthier than an overnight spike.
$UAI #成交量放大 #45% gain
Click the card below to quickly view the market行情👇
What’s most worth watching in this UAI rally is not just the price, but the support from volume. In 8 hours, it climbed from 0.38 all the way to 0.51, while trading volume expanded from 6 million to the 30 million range — this is real money coming in, not a hollow pump.
A funding rate of 0.025% is not extreme, and a long/short ratio of 56% to 44% also shows no excessive crowding. That suggests this rally still has room to run, and it’s not yet at the point where everyone is piling in.
The candlestick chart shows an 8-hour sustained uptrend, with buying interest stepping in on every pullback. This kind of pace is healthier than an overnight spike.
$UAI #成交量放大 #45% gain
Click the card below to quickly view the market行情👇
52
·
--
45% gain, but the funding rate is negative? That divergence is pretty interesting.
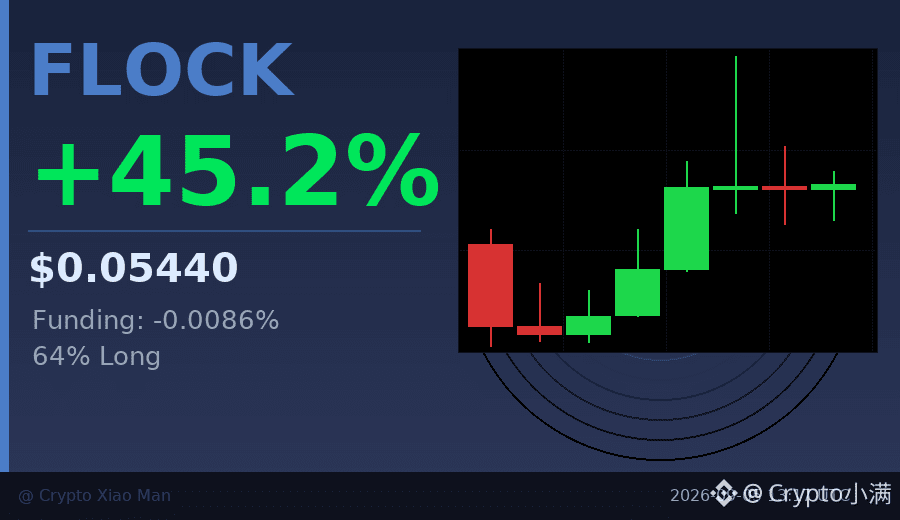
FLOCK's trading volume surged to 247 million USDT today, with the price moving from 0.036 up to 0.065 and then pulling back to 0.0544.
Longs account for 64%, but the funding rate is -0.0086%, indicating that many traders are borrowing short positions to hedge.
The overall trend has been strong over the past 8 hours, but divergence has appeared at higher levels. This kind of volume-price divergence usually means:
either big players are quietly distributing, or shorts are tentatively building positions.
I lean toward the latter — the pullback may be a good entry opportunity, but we need to wait for funding to turn positive before confirming.
$FLOCK #资金费率背离 #45% gain
Click the small card below to quickly check the market 👇
45% gain, but the funding rate is negative? That divergence is pretty interesting.
FLOCK's trading volume surged to 247 million USDT today, with the price moving from 0.036 up to 0.065 and then pulling back to 0.0544.
Longs account for 64%, but the funding rate is -0.0086%, indicating that many traders are borrowing short positions to hedge.
The overall trend has been strong over the past 8 hours, but divergence has appeared at higher levels. This kind of volume-price divergence usually means:
either big players are quietly distributing, or shorts are tentatively building positions.
I lean toward the latter — the pullback may be a good entry opportunity, but we need to wait for funding to turn positive before confirming.
$FLOCK #资金费率背离 #45% gain
Click the small card below to quickly check the market 👇
FLOCK's trading volume surged to 247 million USDT today, with the price moving from 0.036 up to 0.065 and then pulling back to 0.0544.
Longs account for 64%, but the funding rate is -0.0086%, indicating that many traders are borrowing short positions to hedge.
The overall trend has been strong over the past 8 hours, but divergence has appeared at higher levels. This kind of volume-price divergence usually means:
either big players are quietly distributing, or shorts are tentatively building positions.
I lean toward the latter — the pullback may be a good entry opportunity, but we need to wait for funding to turn positive before confirming.
$FLOCK #资金费率背离 #45% gain
Click the small card below to quickly check the market 👇
40
·
--
A 45% gain, but the funding rate is only 0.01%—this kind of divergence is uncommon.
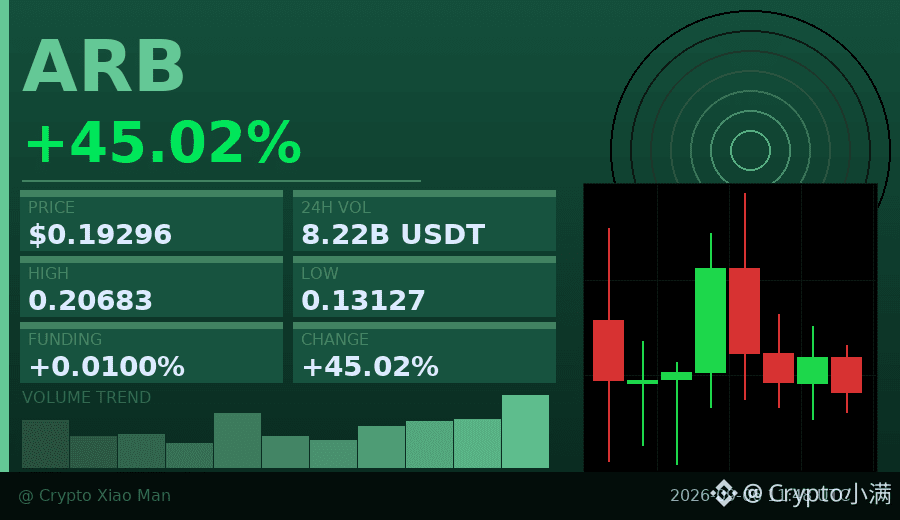
ARB’s trading volume today surged to 822 million USDT, with the price climbing from 0.13 to above 0.20,
but the long/short ratio is 52% to 48%, almost balanced. What does that mean?
Most people are buying spot, not chasing the rally with high leverage.
A low funding rate means holding costs aren’t high, so selling pressure doesn’t show up as quickly.
The candlestick chart shows short-term consolidation in the 0.19-0.20 range, waiting for a direction to be chosen.
This kind of high-volume move without crowded leverage often lasts longer than unanimous bullish sentiment.
$ARB #资金费率背离 #45%
Click the card below to quickly check the market👇
A 45% gain, but the funding rate is only 0.01%—this kind of divergence is uncommon.
ARB’s trading volume today surged to 822 million USDT, with the price climbing from 0.13 to above 0.20,
but the long/short ratio is 52% to 48%, almost balanced. What does that mean?
Most people are buying spot, not chasing the rally with high leverage.
A low funding rate means holding costs aren’t high, so selling pressure doesn’t show up as quickly.
The candlestick chart shows short-term consolidation in the 0.19-0.20 range, waiting for a direction to be chosen.
This kind of high-volume move without crowded leverage often lasts longer than unanimous bullish sentiment.
$ARB #资金费率背离 #45%
Click the card below to quickly check the market👇
ARB’s trading volume today surged to 822 million USDT, with the price climbing from 0.13 to above 0.20,
but the long/short ratio is 52% to 48%, almost balanced. What does that mean?
Most people are buying spot, not chasing the rally with high leverage.
A low funding rate means holding costs aren’t high, so selling pressure doesn’t show up as quickly.
The candlestick chart shows short-term consolidation in the 0.19-0.20 range, waiting for a direction to be chosen.
This kind of high-volume move without crowded leverage often lasts longer than unanimous bullish sentiment.
$ARB #资金费率背离 #45%
Click the card below to quickly check the market👇
36

·
--
$HOT This drop hasn’t been especially steep, but the decline in open positions is telling—OI on both the 15m and 1h timeframes is falling, with notional positions shrinking by nearly 5%. Combined with the price decline, this is a classic case of longs gradually closing out or getting stopped out, rather than shorts opening positions.
Aggressive order flow is down 11.1%, and the buy/sell ratio is 0.80. Selling pressure isn’t particularly fierce, but buyers aren’t rushing in either. The OI anomaly percentile has hit 94%, ranking #45 across the entire pool, and it hasn’t let up for several consecutive periods. Deleveraging likely isn’t over yet.
24h trading volume is $330 million, so liquidity is still there. The question is whether the market can hold after this round of long liquidation. Don’t rush to buy the dip—wait for OI to stabilize first.
$HOT This drop hasn’t been especially steep, but the decline in open positions is telling—OI on both the 15m and 1h timeframes is falling, with notional positions shrinking by nearly 5%. Combined with the price decline, this is a classic case of longs gradually closing out or getting stopped out, rather than shorts opening positions.
Aggressive order flow is down 11.1%, and the buy/sell ratio is 0.80. Selling pressure isn’t particularly fierce, but buyers aren’t rushing in either. The OI anomaly percentile has hit 94%, ranking #45 across the entire pool, and it hasn’t let up for several consecutive periods. Deleveraging likely isn’t over yet.
24h trading volume is $330 million, so liquidity is still there. The question is whether the market can hold after this round of long liquidation. Don’t rush to buy the dip—wait for OI to stabilize first.
Aggressive order flow is down 11.1%, and the buy/sell ratio is 0.80. Selling pressure isn’t particularly fierce, but buyers aren’t rushing in either. The OI anomaly percentile has hit 94%, ranking #45 across the entire pool, and it hasn’t let up for several consecutive periods. Deleveraging likely isn’t over yet.
24h trading volume is $330 million, so liquidity is still there. The question is whether the market can hold after this round of long liquidation. Don’t rush to buy the dip—wait for OI to stabilize first.
37

·
--
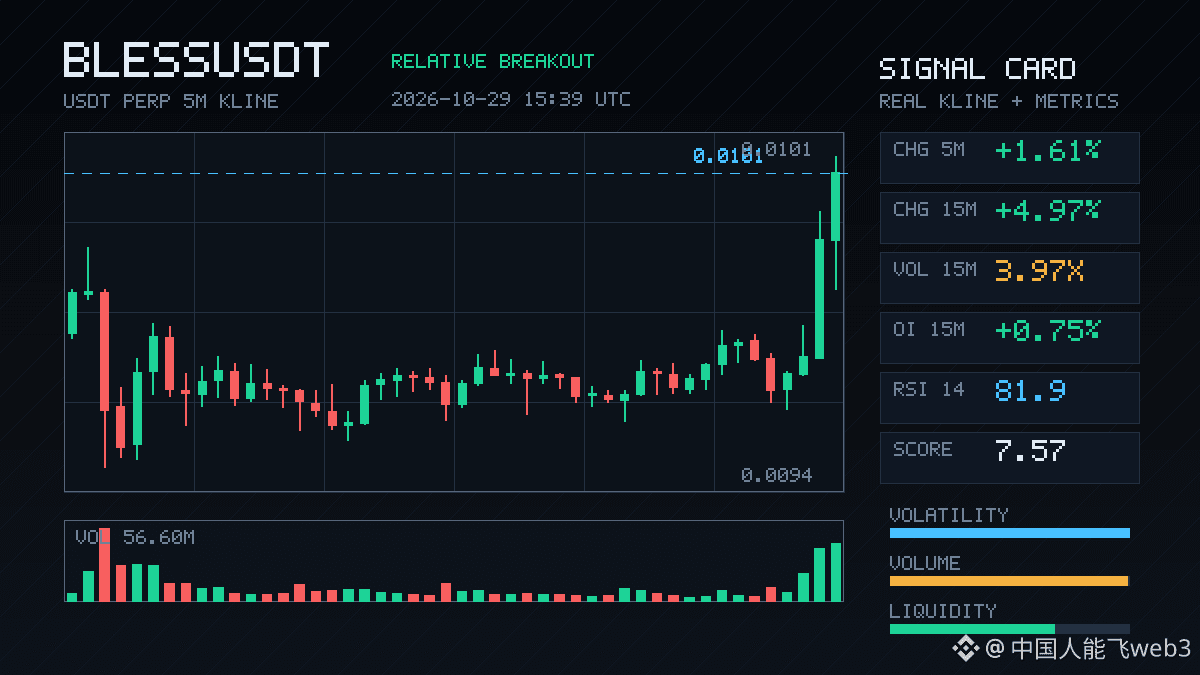
$BLESS This move came a bit out of nowhere: up 4.97% in 15m, with volume nearly 4 times the usual level, and the close above the highs of nearly 20 recent 5m candles.
The structure looks more like new leveraged longs entering. OI is up 0.75% over 15m and 0.32% over 1h, with nominal changes around 300K U in both cases. The anomaly percentile is 87.1%, ranking #45 across the entire pool. The aggressive trade imbalance is 1.8%, and the buy/sell ratio is 1.04—buyers have a slight edge, but things aren't out of control.
24h trading volume is 114M, and liquidity is sufficient. When a key level breaks on rising volume with OI climbing in tandem, it's worth watching in the short term to see whether price can hold above that level. If it can't, it's the usual false-breakout story.
$BLESS This move came a bit out of nowhere: up 4.97% in 15m, with volume nearly 4 times the usual level, and the close above the highs of nearly 20 recent 5m candles.
The structure looks more like new leveraged longs entering. OI is up 0.75% over 15m and 0.32% over 1h, with nominal changes around 300K U in both cases. The anomaly percentile is 87.1%, ranking #45 across the entire pool. The aggressive trade imbalance is 1.8%, and the buy/sell ratio is 1.04—buyers have a slight edge, but things aren't out of control.
24h trading volume is 114M, and liquidity is sufficient. When a key level breaks on rising volume with OI climbing in tandem, it's worth watching in the short term to see whether price can hold above that level. If it can't, it's the usual false-breakout story.
The structure looks more like new leveraged longs entering. OI is up 0.75% over 15m and 0.32% over 1h, with nominal changes around 300K U in both cases. The anomaly percentile is 87.1%, ranking #45 across the entire pool. The aggressive trade imbalance is 1.8%, and the buy/sell ratio is 1.04—buyers have a slight edge, but things aren't out of control.
24h trading volume is 114M, and liquidity is sufficient. When a key level breaks on rising volume with OI climbing in tandem, it's worth watching in the short term to see whether price can hold above that level. If it can't, it's the usual false-breakout story.

See translation
🚨 GOVERNANCE TAKEOVER IN PROGRESS: $YAM TREASURY UNDER IMMEDIATE THREAT! ⚠️
A stealth governance attack is unfolding on $YAM right now. 🦈 An exploiter quietly self-delegated 504,000 tokens to push proposal #45 , aiming to hijack the protocol Timelock and drain the $337k DAO treasury.
With the protocol sitting dormant, the attacker is banking on apathy to slip this malicious vote past the finish line undetected. 📊 Holders have roughly 34 hours before block 25897343 to rally the votes and veto this hijack attempt.
💡 When dormant DAOs become easy targets for governance exploits, protocol security lies entirely in community vigilance. 💬 Are you voting to defend the treasury, or is low-liquidity governance too vulnerable to salvage? 👇
⚠️ Not financial advice. Always manage your risk. 🛡️
🏷️ #YAM #DeFi #Governance #Crypto #Security
🚨 🛡️
🚨 GOVERNANCE TAKEOVER IN PROGRESS: $YAM TREASURY UNDER IMMEDIATE THREAT! ⚠️
A stealth governance attack is unfolding on $YAM right now. 🦈 An exploiter quietly self-delegated 504,000 tokens to push proposal #45 , aiming to hijack the protocol Timelock and drain the $337k DAO treasury.
With the protocol sitting dormant, the attacker is banking on apathy to slip this malicious vote past the finish line undetected. 📊 Holders have roughly 34 hours before block 25897343 to rally the votes and veto this hijack attempt.
💡 When dormant DAOs become easy targets for governance exploits, protocol security lies entirely in community vigilance. 💬 Are you voting to defend the treasury, or is low-liquidity governance too vulnerable to salvage? 👇
⚠️ Not financial advice. Always manage your risk. 🛡️
🏷️ #YAM #DeFi #Governance #Crypto #Security
🚨 🛡️
A stealth governance attack is unfolding on $YAM right now. 🦈 An exploiter quietly self-delegated 504,000 tokens to push proposal #45 , aiming to hijack the protocol Timelock and drain the $337k DAO treasury.
With the protocol sitting dormant, the attacker is banking on apathy to slip this malicious vote past the finish line undetected. 📊 Holders have roughly 34 hours before block 25897343 to rally the votes and veto this hijack attempt.
💡 When dormant DAOs become easy targets for governance exploits, protocol security lies entirely in community vigilance. 💬 Are you voting to defend the treasury, or is low-liquidity governance too vulnerable to salvage? 👇
⚠️ Not financial advice. Always manage your risk. 🛡️
🏷️ #YAM #DeFi #Governance #Crypto #Security
🚨 🛡️

·
--
$BR short 25X|+14.13% booked in 37 minutes ✅
🎯 Live trade execution record
Average entry price 0.68994 → exit 0.6860624
Direction: SHORT|Leverage: 25X|Holding time: 37 minutes
ROE: +14.13% (manually closed the position to take profit)
🧠 How this trade came about
The LLM strategy #45 analyzed it in advance. The logic was clear:
【Initial screening】24h surge of +46.57%; 1h had already turned to -3.25%; 15m RSI 57.3 / 5m RSI 51.7 pushed into overbought territory. Watched for a pullback of ≥0.8% from the high as a turning point.
【Trigger】Price pulled back -10.54% from the high of 0.74999; the 5m MACD bearish histogram expanded, and the 15m RSI turned down from a high of 47.9—pure quantitative execution, signaled in milliseconds. Entered as soon as the turning point arrived.
Plan: enter near 0.67091, TP1 0.6008755 / TP2 0.5483497 / SL 0.7146815, risk-reward ratio 2.8:1
🛡️ Risk management discipline
At 25X, don’t hold and hope. For turning-point trades, take only the juiciest part of the move. The original strategy called for a time-based stop if price didn’t leave the cost zone within 30 minutes. This time, it delivered 14 points in 37 minutes, so I manually booked profits rather than getting greedy for the last bit.
When a surging coin pulls back, the gains you capture are yours. For this move in $BR , did you go long or short alongside me? Drop your entry price in the comments—I want to see whose entry was sharper 👇
#币安合约 #实盘战报 #量化交易 #BRUSDT
$BR short 25X|+14.13% booked in 37 minutes ✅
🎯 Live trade execution record
Average entry price 0.68994 → exit 0.6860624
Direction: SHORT|Leverage: 25X|Holding time: 37 minutes
ROE: +14.13% (manually closed the position to take profit)
🧠 How this trade came about
The LLM strategy #45 analyzed it in advance. The logic was clear:
【Initial screening】24h surge of +46.57%; 1h had already turned to -3.25%; 15m RSI 57.3 / 5m RSI 51.7 pushed into overbought territory. Watched for a pullback of ≥0.8% from the high as a turning point.
【Trigger】Price pulled back -10.54% from the high of 0.74999; the 5m MACD bearish histogram expanded, and the 15m RSI turned down from a high of 47.9—pure quantitative execution, signaled in milliseconds. Entered as soon as the turning point arrived.
Plan: enter near 0.67091, TP1 0.6008755 / TP2 0.5483497 / SL 0.7146815, risk-reward ratio 2.8:1
🛡️ Risk management discipline
At 25X, don’t hold and hope. For turning-point trades, take only the juiciest part of the move. The original strategy called for a time-based stop if price didn’t leave the cost zone within 30 minutes. This time, it delivered 14 points in 37 minutes, so I manually booked profits rather than getting greedy for the last bit.
When a surging coin pulls back, the gains you capture are yours. For this move in $BR , did you go long or short alongside me? Drop your entry price in the comments—I want to see whose entry was sharper 👇
#币安合约 #实盘战报 #量化交易 #BRUSDT
🎯 Live trade execution record
Average entry price 0.68994 → exit 0.6860624
Direction: SHORT|Leverage: 25X|Holding time: 37 minutes
ROE: +14.13% (manually closed the position to take profit)
🧠 How this trade came about
The LLM strategy #45 analyzed it in advance. The logic was clear:
【Initial screening】24h surge of +46.57%; 1h had already turned to -3.25%; 15m RSI 57.3 / 5m RSI 51.7 pushed into overbought territory. Watched for a pullback of ≥0.8% from the high as a turning point.
【Trigger】Price pulled back -10.54% from the high of 0.74999; the 5m MACD bearish histogram expanded, and the 15m RSI turned down from a high of 47.9—pure quantitative execution, signaled in milliseconds. Entered as soon as the turning point arrived.
Plan: enter near 0.67091, TP1 0.6008755 / TP2 0.5483497 / SL 0.7146815, risk-reward ratio 2.8:1
🛡️ Risk management discipline
At 25X, don’t hold and hope. For turning-point trades, take only the juiciest part of the move. The original strategy called for a time-based stop if price didn’t leave the cost zone within 30 minutes. This time, it delivered 14 points in 37 minutes, so I manually booked profits rather than getting greedy for the last bit.
When a surging coin pulls back, the gains you capture are yours. For this move in $BR , did you go long or short alongside me? Drop your entry price in the comments—I want to see whose entry was sharper 👇
#币安合约 #实盘战报 #量化交易 #BRUSDT
177

·
--
M suddenly plunges 5.1% in 5 minutes! Panic or opportunity? Quick look at support levels19:05 (27 minutes ago): M fell 5.1% within 5 minutes (5-minute window: 19:00→19:05). As of 19:33:29, the current price is 0.809, down 14.2% over 24h. STRK and CTK also saw similar moves.
📅 Data as of 19:33:29 (event trigger times are indicated for each item; prices are real-time snapshots taken when this was written)
📌 In a nutshell: Short-term momentum is concentrated, and pullbacks can come fast—placing orders in batches is safer than chasing highs
Market overview: BTC 83,500.90 (+0.17%) · ETH 2,504.81 (-1.64%); across the market, 46 gainers / 447 losers over 24h; top 24h gainer: OGN +25.79%, top loser: ARC -57.44%.
M suddenly plunges 5.1% in 5 minutes! Panic or opportunity? Quick look at support levels
19:05 (27 minutes ago): M fell 5.1% within 5 minutes (5-minute window: 19:00→19:05). As of 19:33:29, the current price is 0.809, down 14.2% over 24h. STRK and CTK also saw similar moves.
📅 Data as of 19:33:29 (event trigger times are indicated for each item; prices are real-time snapshots taken when this was written)
📌 In a nutshell: Short-term momentum is concentrated, and pullbacks can come fast—placing orders in batches is safer than chasing highs
Market overview: BTC 83,500.90 (+0.17%) · ETH 2,504.81 (-1.64%); across the market, 46 gainers / 447 losers over 24h; top 24h gainer: OGN +25.79%, top loser: ARC -57.44%.
📅 Data as of 19:33:29 (event trigger times are indicated for each item; prices are real-time snapshots taken when this was written)
📌 In a nutshell: Short-term momentum is concentrated, and pullbacks can come fast—placing orders in batches is safer than chasing highs
Market overview: BTC 83,500.90 (+0.17%) · ETH 2,504.81 (-1.64%); across the market, 46 gainers / 447 losers over 24h; top 24h gainer: OGN +25.79%, top loser: ARC -57.44%.
9
·
--
M Surges 4.9% in 5 Minutes! What Happened? Key Levels Here19:00 (2 minutes ago): M surged 4.9% within 5 minutes (5-minute window: 18:55→19:00). As of 19:02:54, the current price is 0.8128, down 13.9% over 24h. Other tokens showing unusual moves around the same time include CTK and W.
📅 Data as of 19:02:54 (event trigger times are noted for each item; prices are real-time snapshots taken at the time of writing)
📌 One-line takeaway: Short-term momentum is concentrated, and pullbacks often come quickly—staggered limit orders are safer than chasing highs
Market overview: BTC 83,238.90 (-0.23%) · ETH 2,497.03 (-2.20%); across the market, 46 assets rose and 447 fell in 24h; top 24h gainer: OGN +25.19%, biggest loser: ARC -60.46%.
M Surges 4.9% in 5 Minutes! What Happened? Key Levels Here
19:00 (2 minutes ago): M surged 4.9% within 5 minutes (5-minute window: 18:55→19:00). As of 19:02:54, the current price is 0.8128, down 13.9% over 24h. Other tokens showing unusual moves around the same time include CTK and W.
📅 Data as of 19:02:54 (event trigger times are noted for each item; prices are real-time snapshots taken at the time of writing)
📌 One-line takeaway: Short-term momentum is concentrated, and pullbacks often come quickly—staggered limit orders are safer than chasing highs
Market overview: BTC 83,238.90 (-0.23%) · ETH 2,497.03 (-2.20%); across the market, 46 assets rose and 447 fell in 24h; top 24h gainer: OGN +25.19%, biggest loser: ARC -60.46%.
📅 Data as of 19:02:54 (event trigger times are noted for each item; prices are real-time snapshots taken at the time of writing)
📌 One-line takeaway: Short-term momentum is concentrated, and pullbacks often come quickly—staggered limit orders are safer than chasing highs
Market overview: BTC 83,238.90 (-0.23%) · ETH 2,497.03 (-2.20%); across the market, 46 assets rose and 447 fell in 24h; top 24h gainer: OGN +25.19%, biggest loser: ARC -60.46%.

·
--
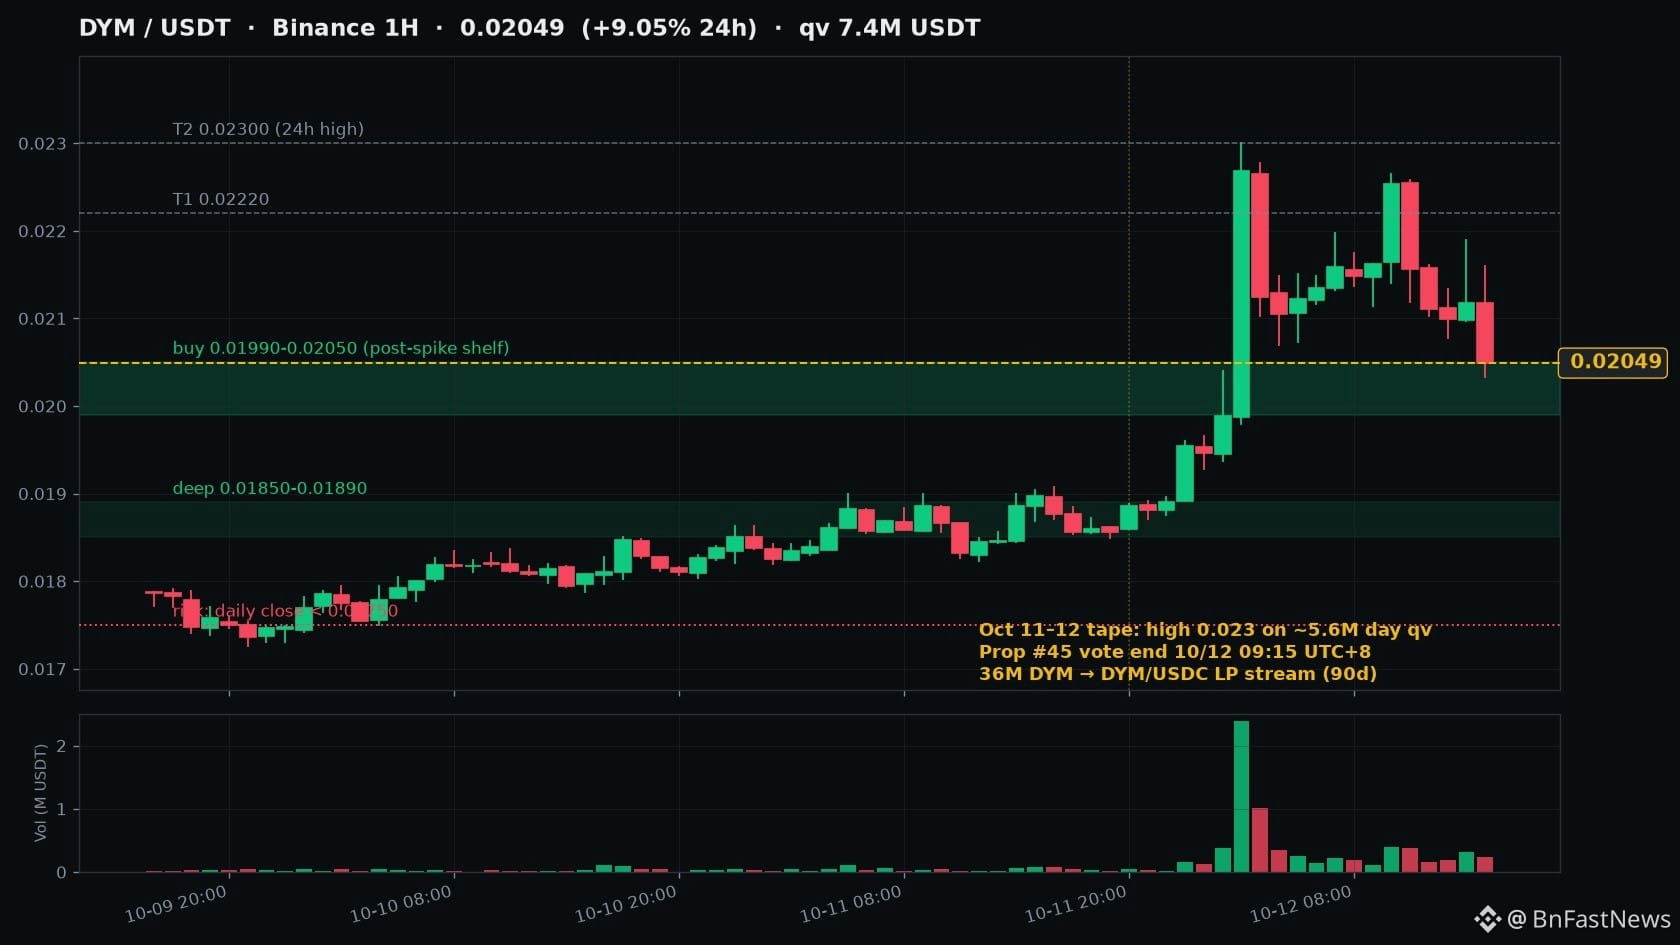
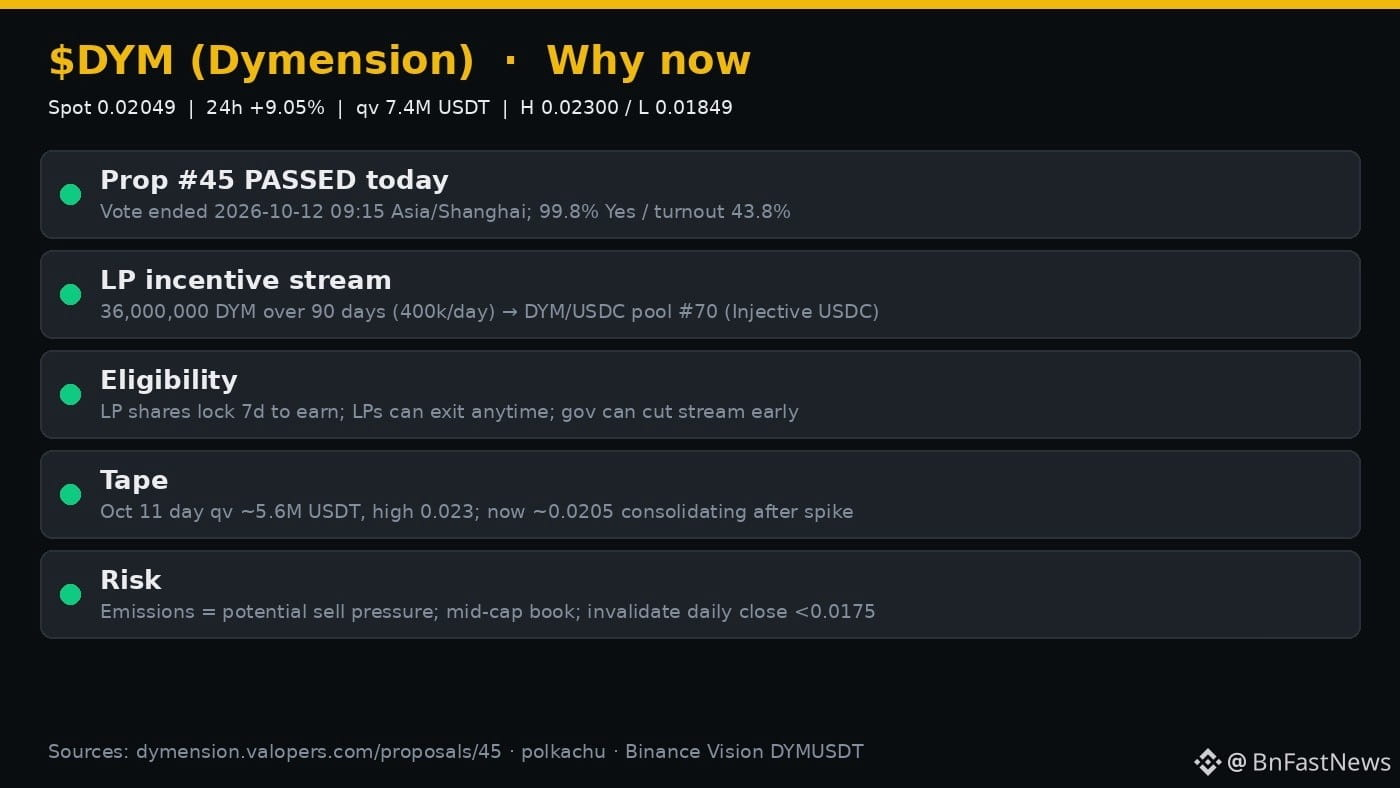
I just came across the on-chain governance results: voting on Dymension Prop #45 ended this morning, and it passed by an overwhelming margin.
Put simply, for the next 90 days, around 400,000 $DYM will flow each day—36 million in total—into the DYM/USDC liquidity pool on Injective, rewarding LPs willing to lock their funds for 7 days. The governance page shows nearly 99.8% voting Yes, with voting ending at around 09:15 Shanghai time on October 12. This isn’t just empty narrative—the emissions plan has already been approved on-chain.
The market is moving along with it, too. Binance spot trading volume was around 5.6 million USDT yesterday, with the price climbing to nearly 0.023. Today it’s still up around 9% over 24 hours, with volume at about 7.4 million, and the price has now pulled back to consolidate around 0.0205. That “news confirmed + volume-fueled surge + pullback” pattern actually feels more comfortable than a straight-line pump.
Personally, I’m watching the 0.0199–0.0205 pullback zone; if it dips further, I’d consider adding around 0.0185–0.0189, near today’s low. To the upside, I’m watching 0.0222 / 0.0230 first. If it holds above those levels, we’ll see whether there’s room to move toward 0.0245. If the daily close drops below 0.0175, I’m stepping away from this narrative for now—not sticking around for a mess.
One reminder: incentives are emissions too, and some people may dump their LP rewards in the short term. Don’t go all-in on a small- or mid-cap token with limited liquidity. If you want to trade it, keep your position size under control, and check the current price and order book at $DYM before making a move. The reason to pay attention to this now is that governance has passed, the emissions schedule is set, and the market is still offering a chance to buy the pullback.
I just came across the on-chain governance results: voting on Dymension Prop #45 ended this morning, and it passed by an overwhelming margin.
Put simply, for the next 90 days, around 400,000 $DYM will flow each day—36 million in total—into the DYM/USDC liquidity pool on Injective, rewarding LPs willing to lock their funds for 7 days. The governance page shows nearly 99.8% voting Yes, with voting ending at around 09:15 Shanghai time on October 12. This isn’t just empty narrative—the emissions plan has already been approved on-chain.
The market is moving along with it, too. Binance spot trading volume was around 5.6 million USDT yesterday, with the price climbing to nearly 0.023. Today it’s still up around 9% over 24 hours, with volume at about 7.4 million, and the price has now pulled back to consolidate around 0.0205. That “news confirmed + volume-fueled surge + pullback” pattern actually feels more comfortable than a straight-line pump.
Personally, I’m watching the 0.0199–0.0205 pullback zone; if it dips further, I’d consider adding around 0.0185–0.0189, near today’s low. To the upside, I’m watching 0.0222 / 0.0230 first. If it holds above those levels, we’ll see whether there’s room to move toward 0.0245. If the daily close drops below 0.0175, I’m stepping away from this narrative for now—not sticking around for a mess.
One reminder: incentives are emissions too, and some people may dump their LP rewards in the short term. Don’t go all-in on a small- or mid-cap token with limited liquidity. If you want to trade it, keep your position size under control, and check the current price and order book at $DYM before making a move. The reason to pay attention to this now is that governance has passed, the emissions schedule is set, and the market is still offering a chance to buy the pullback.
Put simply, for the next 90 days, around 400,000 $DYM will flow each day—36 million in total—into the DYM/USDC liquidity pool on Injective, rewarding LPs willing to lock their funds for 7 days. The governance page shows nearly 99.8% voting Yes, with voting ending at around 09:15 Shanghai time on October 12. This isn’t just empty narrative—the emissions plan has already been approved on-chain.
The market is moving along with it, too. Binance spot trading volume was around 5.6 million USDT yesterday, with the price climbing to nearly 0.023. Today it’s still up around 9% over 24 hours, with volume at about 7.4 million, and the price has now pulled back to consolidate around 0.0205. That “news confirmed + volume-fueled surge + pullback” pattern actually feels more comfortable than a straight-line pump.
Personally, I’m watching the 0.0199–0.0205 pullback zone; if it dips further, I’d consider adding around 0.0185–0.0189, near today’s low. To the upside, I’m watching 0.0222 / 0.0230 first. If it holds above those levels, we’ll see whether there’s room to move toward 0.0245. If the daily close drops below 0.0175, I’m stepping away from this narrative for now—not sticking around for a mess.
One reminder: incentives are emissions too, and some people may dump their LP rewards in the short term. Don’t go all-in on a small- or mid-cap token with limited liquidity. If you want to trade it, keep your position size under control, and check the current price and order book at $DYM before making a move. The reason to pay attention to this now is that governance has passed, the emissions schedule is set, and the market is still offering a chance to buy the pullback.
37

·
--
Treating $ONDO ’s 30-day gain of +48% as a trend reversal is the easiest mistake to make right now. The price has returned to $0.52, right where the September 25 surge in buying began. That day, volume hit $1.06B, lifting the coin from $0.41 to $0.52. And then what? For half a month, it ground along between $0.47 and $0.55, with trading volume shrinking to around $200M. This isn’t a breakout—it’s a return to the breakout point.
Here’s the real picture: this rally brought $ONDO back up from $0.35, but it’s still 75.74% below its ATH of two dollars, and it remains down 26% over the past year. The RWA narrative has been revived, but buyers aren’t showing the same conviction they did on September 25. With a market cap of $2.53B and a ranking of #45, it’s not short on attention—it’s short on fresh inflows.
So instead of arguing over whether to be bullish or bearish, watch the same number: can daily trading volume climb back above $400M? If you’re bullish, you want to see strong volume above $0.53 and a sustained hold for two consecutive days. Only then can you say that $1.06B wasn’t a one-off. If you’re bearish, watch that number too: a low-volume push higher—even if it reaches $0.55—would be a bull trap, and a retreat to $0.42 would only be a matter of time. Price can deceive; volume can’t. Wait for it to give you the answer.
Treating $ONDO ’s 30-day gain of +48% as a trend reversal is the easiest mistake to make right now. The price has returned to $0.52, right where the September 25 surge in buying began. That day, volume hit $1.06B, lifting the coin from $0.41 to $0.52. And then what? For half a month, it ground along between $0.47 and $0.55, with trading volume shrinking to around $200M. This isn’t a breakout—it’s a return to the breakout point.
Here’s the real picture: this rally brought $ONDO back up from $0.35, but it’s still 75.74% below its ATH of two dollars, and it remains down 26% over the past year. The RWA narrative has been revived, but buyers aren’t showing the same conviction they did on September 25. With a market cap of $2.53B and a ranking of #45, it’s not short on attention—it’s short on fresh inflows.
So instead of arguing over whether to be bullish or bearish, watch the same number: can daily trading volume climb back above $400M? If you’re bullish, you want to see strong volume above $0.53 and a sustained hold for two consecutive days. Only then can you say that $1.06B wasn’t a one-off. If you’re bearish, watch that number too: a low-volume push higher—even if it reaches $0.55—would be a bull trap, and a retreat to $0.42 would only be a matter of time. Price can deceive; volume can’t. Wait for it to give you the answer.
Here’s the real picture: this rally brought $ONDO back up from $0.35, but it’s still 75.74% below its ATH of two dollars, and it remains down 26% over the past year. The RWA narrative has been revived, but buyers aren’t showing the same conviction they did on September 25. With a market cap of $2.53B and a ranking of #45, it’s not short on attention—it’s short on fresh inflows.
So instead of arguing over whether to be bullish or bearish, watch the same number: can daily trading volume climb back above $400M? If you’re bullish, you want to see strong volume above $0.53 and a sustained hold for two consecutive days. Only then can you say that $1.06B wasn’t a one-off. If you’re bearish, watch that number too: a low-volume push higher—even if it reaches $0.55—would be a bull trap, and a retreat to $0.42 would only be a matter of time. Price can deceive; volume can’t. Wait for it to give you the answer.
13

·
--
See translation
$ASTER is sitting right on its 24h high of $0.7186 while its last big headlines are a month old, and I like that setup.
The news flow was all plumbing. Free vault creation, USDG deposits through the Robinhood chain, and USD1-denominated RWA perpetuals that Aster says have liquidity backing from World Liberty Financial. That last one is the project's own claim, so treat it as a pitch, not a verified number.
The tape barely noticed: 1 week is +0.61% and it's still ranked #45. Shipping without a pump is either dead money or a coiled spring, and price pressed on the high says spring.
$ASTER trades at $0.7186 right now. if it holds $0.706, the 24h low, i think it keeps pressing higher and the quiet week turns into a breakout. if it loses $0.706, i'm wrong on this and there's nothing to defend. if you're already long, that's the line where you take the loss with me.
holding $0.706 or losing it?
follow me for more calls like this.
$ASTER is sitting right on its 24h high of $0.7186 while its last big headlines are a month old, and I like that setup.
The news flow was all plumbing. Free vault creation, USDG deposits through the Robinhood chain, and USD1-denominated RWA perpetuals that Aster says have liquidity backing from World Liberty Financial. That last one is the project's own claim, so treat it as a pitch, not a verified number.
The tape barely noticed: 1 week is +0.61% and it's still ranked #45. Shipping without a pump is either dead money or a coiled spring, and price pressed on the high says spring.
$ASTER trades at $0.7186 right now. if it holds $0.706, the 24h low, i think it keeps pressing higher and the quiet week turns into a breakout. if it loses $0.706, i'm wrong on this and there's nothing to defend. if you're already long, that's the line where you take the loss with me.
holding $0.706 or losing it?
follow me for more calls like this.
The news flow was all plumbing. Free vault creation, USDG deposits through the Robinhood chain, and USD1-denominated RWA perpetuals that Aster says have liquidity backing from World Liberty Financial. That last one is the project's own claim, so treat it as a pitch, not a verified number.
The tape barely noticed: 1 week is +0.61% and it's still ranked #45. Shipping without a pump is either dead money or a coiled spring, and price pressed on the high says spring.
$ASTER trades at $0.7186 right now. if it holds $0.706, the 24h low, i think it keeps pressing higher and the quiet week turns into a breakout. if it loses $0.706, i'm wrong on this and there's nothing to defend. if you're already long, that's the line where you take the loss with me.
holding $0.706 or losing it?
follow me for more calls like this.

45

Article
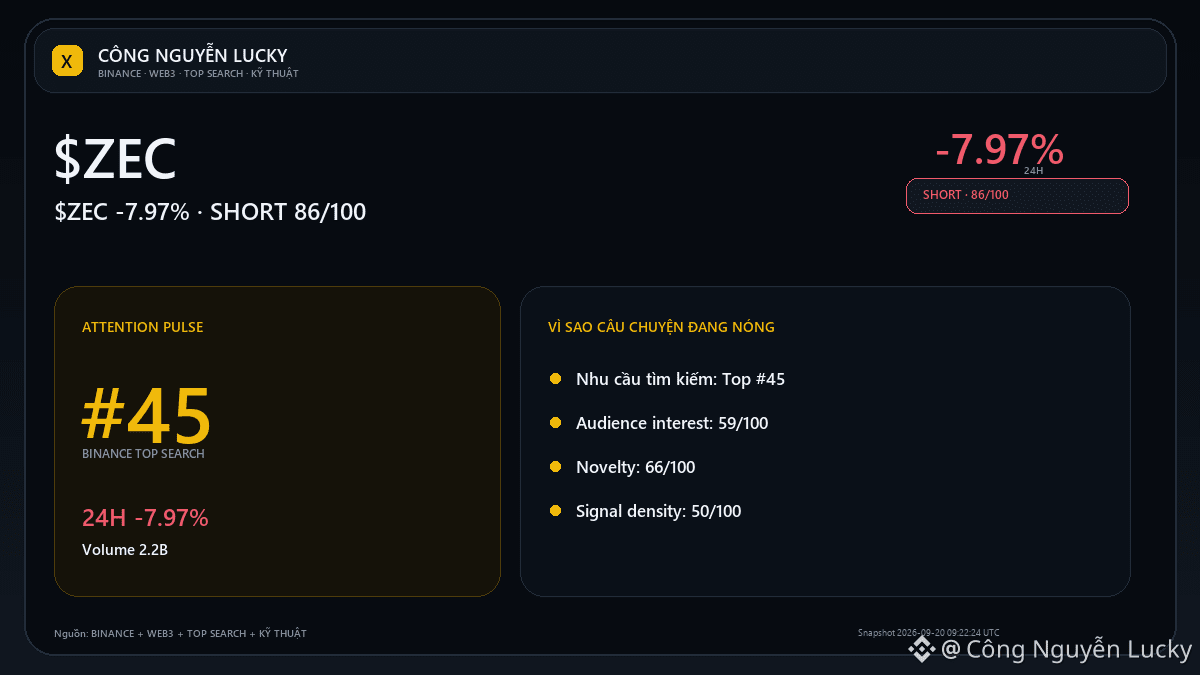
$ZEC: the LH_LL structure is controlling the chart$ZEC is hovering around 1,439.68. If we look only at the current price, we still miss the most important part: what confirms or refutes the thesis? Market: 1,439.68 · 24h -7.97% · volume ~2,177.3M USDT · 5,026,132 trades.
Swing high near 1,485.86 · swing low near 1,461.22.
EMA50 1,473.86 · RSI14 31.7 · bias SHORT 67/100. The indicator is used only to confirm the structure, not to replace it. Losing 1,434.79 or breaking above 1,485.86 is the point where the narrative changes most clearly. The technical levels selected follow the regime:
$ZEC: the LH_LL structure is controlling the chart
$ZEC is hovering around 1,439.68. If we look only at the current price, we still miss the most important part: what confirms or refutes the thesis? Market: 1,439.68 · 24h -7.97% · volume ~2,177.3M USDT · 5,026,132 trades.
Swing high near 1,485.86 · swing low near 1,461.22.
EMA50 1,473.86 · RSI14 31.7 · bias SHORT 67/100. The indicator is used only to confirm the structure, not to replace it. Losing 1,434.79 or breaking above 1,485.86 is the point where the narrative changes most clearly. The technical levels selected follow the regime:
Swing high near 1,485.86 · swing low near 1,461.22.
EMA50 1,473.86 · RSI14 31.7 · bias SHORT 67/100. The indicator is used only to confirm the structure, not to replace it. Losing 1,434.79 or breaking above 1,485.86 is the point where the narrative changes most clearly. The technical levels selected follow the regime:
138

·
--
Bearish
See translation
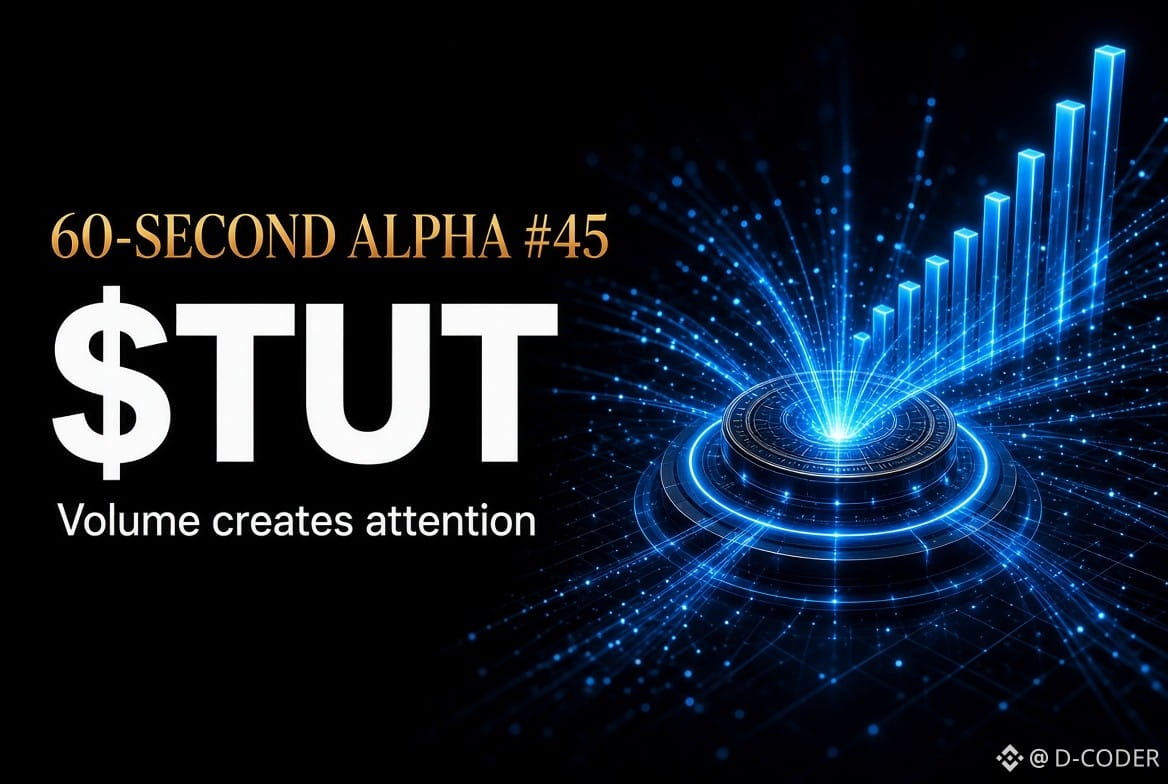
60-SECOND ALPHA #45 | $TUT
$TUT is showing a strong move with increased trading activity. When a smaller-cap token suddenly attracts large volume, the important thing isn't simply the percentage gain. You also need to ask whether the volume can sustain itself after the initial attention fades.
The lesson: A volume spike creates attention, but sustained demand is what matters.
{future}(TUTUSDT)
60-SECOND ALPHA #45 | $TUT
$TUT is showing a strong move with increased trading activity. When a smaller-cap token suddenly attracts large volume, the important thing isn't simply the percentage gain. You also need to ask whether the volume can sustain itself after the initial attention fades.
The lesson: A volume spike creates attention, but sustained demand is what matters.
$TUT is showing a strong move with increased trading activity. When a smaller-cap token suddenly attracts large volume, the important thing isn't simply the percentage gain. You also need to ask whether the volume can sustain itself after the initial attention fades.
The lesson: A volume spike creates attention, but sustained demand is what matters.
1
195

$426.17M volume 24h is making the ASTER chart heavier.
#ASTER is currently around $0.75, up 14.16347%/24h, with a daily range of $0.65–$0.79. The price is near the upper half of the range → short-term buying pressure is still present, but $0.79 is the immediate resistance level that needs to be cleared for a potential breakout.
On the flip side, $0.65 is the support level mentioned in the data. Losing this level → intraday structure weakens. With a market cap of $2.01B, ranked #45, $ASTER is not lacking liquidity; the question is whether the volume will continue to support the candles or not.
DYOR — what data are you prioritizing: $0.79, $0.65 or volume? $ASTER #Crypto #BinanceSquare #DYOR
$426.17M volume 24h is making the ASTER chart heavier.
#ASTER is currently around $0.75, up 14.16347%/24h, with a daily range of $0.65–$0.79. The price is near the upper half of the range → short-term buying pressure is still present, but $0.79 is the immediate resistance level that needs to be cleared for a potential breakout.
On the flip side, $0.65 is the support level mentioned in the data. Losing this level → intraday structure weakens. With a market cap of $2.01B, ranked #45, $ASTER is not lacking liquidity; the question is whether the volume will continue to support the candles or not.
DYOR — what data are you prioritizing: $0.79, $0.65 or volume? $ASTER #Crypto #BinanceSquare #DYOR
#ASTER is currently around $0.75, up 14.16347%/24h, with a daily range of $0.65–$0.79. The price is near the upper half of the range → short-term buying pressure is still present, but $0.79 is the immediate resistance level that needs to be cleared for a potential breakout.
On the flip side, $0.65 is the support level mentioned in the data. Losing this level → intraday structure weakens. With a market cap of $2.01B, ranked #45, $ASTER is not lacking liquidity; the question is whether the volume will continue to support the candles or not.
DYOR — what data are you prioritizing: $0.79, $0.65 or volume? $ASTER #Crypto #BinanceSquare #DYOR
185

·
--
See translation
I’ve been tracking the latest CoinGecko buzz, and three tokens jumped out. Bitcoin (BTC) surged +2.4% as it held the #1 spot, Pump.fun (PUMP) rallied +9.1% at rank #45, and Hyperliquid (HYPE) spiked +13.7% sitting comfortably in the top‑10.
I'm also keeping an eye on mid‑cap contenders. Ethena (ENA) climbed +7.3% at rank #57, The Interfold (FOLD) nudged +4.5% around #544, and Aligned (ALIGN) edged up +3.2% near #714.
🚀 Overall, the market’s momentum feels bullish, and I’m excited to see if these gains hold. I’ll keep you posted on any new spikes 🔥 and watch for breakout opportunities 🌟.
$TUT, $COTI, $TUT
I’ve been tracking the latest CoinGecko buzz, and three tokens jumped out. Bitcoin (BTC) surged +2.4% as it held the #1 spot, Pump.fun (PUMP) rallied +9.1% at rank #45, and Hyperliquid (HYPE) spiked +13.7% sitting comfortably in the top‑10.
I'm also keeping an eye on mid‑cap contenders. Ethena (ENA) climbed +7.3% at rank #57, The Interfold (FOLD) nudged +4.5% around #544, and Aligned (ALIGN) edged up +3.2% near #714.
🚀 Overall, the market’s momentum feels bullish, and I’m excited to see if these gains hold. I’ll keep you posted on any new spikes 🔥 and watch for breakout opportunities 🌟.
$TUT , $COTI , $TUT
I'm also keeping an eye on mid‑cap contenders. Ethena (ENA) climbed +7.3% at rank #57, The Interfold (FOLD) nudged +4.5% around #544, and Aligned (ALIGN) edged up +3.2% near #714.
🚀 Overall, the market’s momentum feels bullish, and I’m excited to see if these gains hold. I’ll keep you posted on any new spikes 🔥 and watch for breakout opportunities 🌟.
$TUT , $COTI , $TUT
328
·
--
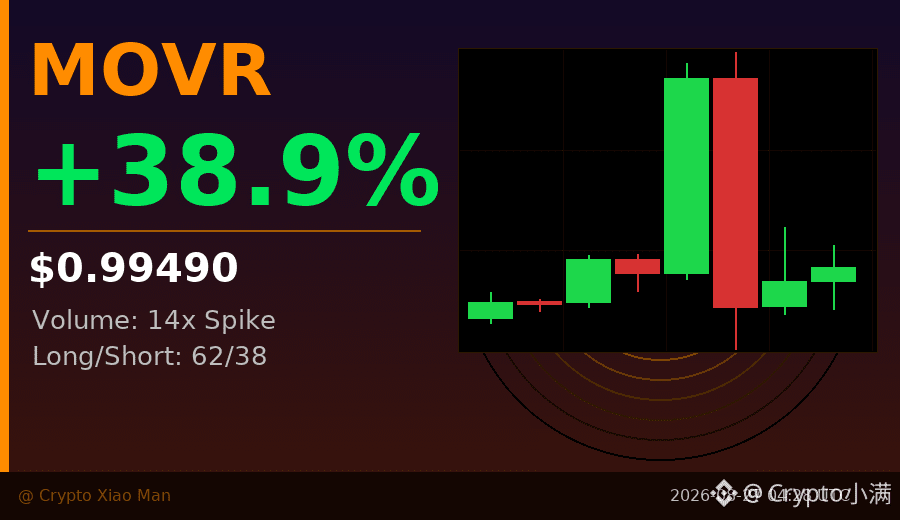
One single candlestick exploded to 14 times the volume—this pattern is kind of interesting.
Today MOVR’s low touched 0.62, then one big bullish candle shot straight to 1.17, and it ultimately closed around 1.04—up nearly 45%. This isn’t a slow, lukewarm “boil a frog” style of climb—it’s a sudden ignition with a single candle.
What explains it best is the trading volume: the previous few hourly candles were around 200,000 units, but the suddenly spiking candle’s volume jumped to 14 million, and the very next candle still had 17 million. The capital came in concentrated within the same time window—not retail traders slowly chasing it.
The current long/short ratio is 62.3% longs vs. 37.7% shorts, so longs are in the lead. However, the funding rate is only 0.005%, which is extremely low—suggesting this rally didn’t attract much leveraged contract follow-through. It’s more driven by spot buying pressure. This combination is relatively healthy, with a somewhat lower risk of a stampede.
Of course, within the huge swing from 0.62 to 1.17, anyone who bought near the low is up more than 80%. Now the people taking over are effectively at costs near the top. Three consecutive hourly bullish candles are still underway, but the position is no longer as comfortable.
Next to watch: whether the volume can keep up. And during the pullback, whether the area around 0.90–0.95 can hold. If it holds, the structure remains intact; if it can’t, then it becomes a one-off impulsive move.
$MOVR #暴量拉升 #45%涨幅
Click the small card below to quickly check the行情👇
One single candlestick exploded to 14 times the volume—this pattern is kind of interesting.
Today MOVR’s low touched 0.62, then one big bullish candle shot straight to 1.17, and it ultimately closed around 1.04—up nearly 45%. This isn’t a slow, lukewarm “boil a frog” style of climb—it’s a sudden ignition with a single candle.
What explains it best is the trading volume: the previous few hourly candles were around 200,000 units, but the suddenly spiking candle’s volume jumped to 14 million, and the very next candle still had 17 million. The capital came in concentrated within the same time window—not retail traders slowly chasing it.
The current long/short ratio is 62.3% longs vs. 37.7% shorts, so longs are in the lead. However, the funding rate is only 0.005%, which is extremely low—suggesting this rally didn’t attract much leveraged contract follow-through. It’s more driven by spot buying pressure. This combination is relatively healthy, with a somewhat lower risk of a stampede.
Of course, within the huge swing from 0.62 to 1.17, anyone who bought near the low is up more than 80%. Now the people taking over are effectively at costs near the top. Three consecutive hourly bullish candles are still underway, but the position is no longer as comfortable.
Next to watch: whether the volume can keep up. And during the pullback, whether the area around 0.90–0.95 can hold. If it holds, the structure remains intact; if it can’t, then it becomes a one-off impulsive move.
$MOVR #暴量拉升 #45%涨幅
Click the small card below to quickly check the行情👇
Today MOVR’s low touched 0.62, then one big bullish candle shot straight to 1.17, and it ultimately closed around 1.04—up nearly 45%. This isn’t a slow, lukewarm “boil a frog” style of climb—it’s a sudden ignition with a single candle.
What explains it best is the trading volume: the previous few hourly candles were around 200,000 units, but the suddenly spiking candle’s volume jumped to 14 million, and the very next candle still had 17 million. The capital came in concentrated within the same time window—not retail traders slowly chasing it.
The current long/short ratio is 62.3% longs vs. 37.7% shorts, so longs are in the lead. However, the funding rate is only 0.005%, which is extremely low—suggesting this rally didn’t attract much leveraged contract follow-through. It’s more driven by spot buying pressure. This combination is relatively healthy, with a somewhat lower risk of a stampede.
Of course, within the huge swing from 0.62 to 1.17, anyone who bought near the low is up more than 80%. Now the people taking over are effectively at costs near the top. Three consecutive hourly bullish candles are still underway, but the position is no longer as comfortable.
Next to watch: whether the volume can keep up. And during the pullback, whether the area around 0.90–0.95 can hold. If it holds, the structure remains intact; if it can’t, then it becomes a one-off impulsive move.
$MOVR #暴量拉升 #45%涨幅
Click the small card below to quickly check the行情👇
141
·
--
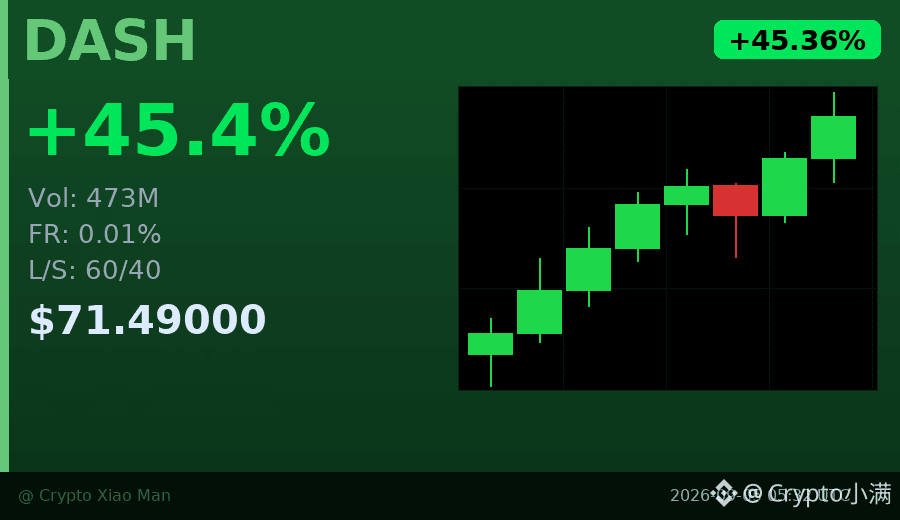
Behind the 45% rally, the funding rate is only 0.01%—what does that mean?
DASH has surged from 49 to 72 today, with trading volume of 473 million USD, but the cost of going long is almost zero.
Normally, with such a sharp move, the funding rate would already have spiked above 0.1%, and retail FOMO would be very obvious.
But the current situation is: longs account for 60%, shorts 40%, the divergence is still there, and leverage hasn’t gone wild.
The hourly chart has printed three consecutive bullish candles, with a steady pace—not the kind of move that explodes in one second.
If trading volume can hold up afterward, this combination of "low funding rate + big gains" is actually healthier.
$DASH #低费率暴涨 #45%
Click the small card below to quickly view the market 👇
Behind the 45% rally, the funding rate is only 0.01%—what does that mean?
DASH has surged from 49 to 72 today, with trading volume of 473 million USD, but the cost of going long is almost zero.
Normally, with such a sharp move, the funding rate would already have spiked above 0.1%, and retail FOMO would be very obvious.
But the current situation is: longs account for 60%, shorts 40%, the divergence is still there, and leverage hasn’t gone wild.
The hourly chart has printed three consecutive bullish candles, with a steady pace—not the kind of move that explodes in one second.
If trading volume can hold up afterward, this combination of "low funding rate + big gains" is actually healthier.
$DASH #低费率暴涨 #45%
Click the small card below to quickly view the market 👇
DASH has surged from 49 to 72 today, with trading volume of 473 million USD, but the cost of going long is almost zero.
Normally, with such a sharp move, the funding rate would already have spiked above 0.1%, and retail FOMO would be very obvious.
But the current situation is: longs account for 60%, shorts 40%, the divergence is still there, and leverage hasn’t gone wild.
The hourly chart has printed three consecutive bullish candles, with a steady pace—not the kind of move that explodes in one second.
If trading volume can hold up afterward, this combination of "low funding rate + big gains" is actually healthier.
$DASH #低费率暴涨 #45%
Click the small card below to quickly view the market 👇
42
·
--
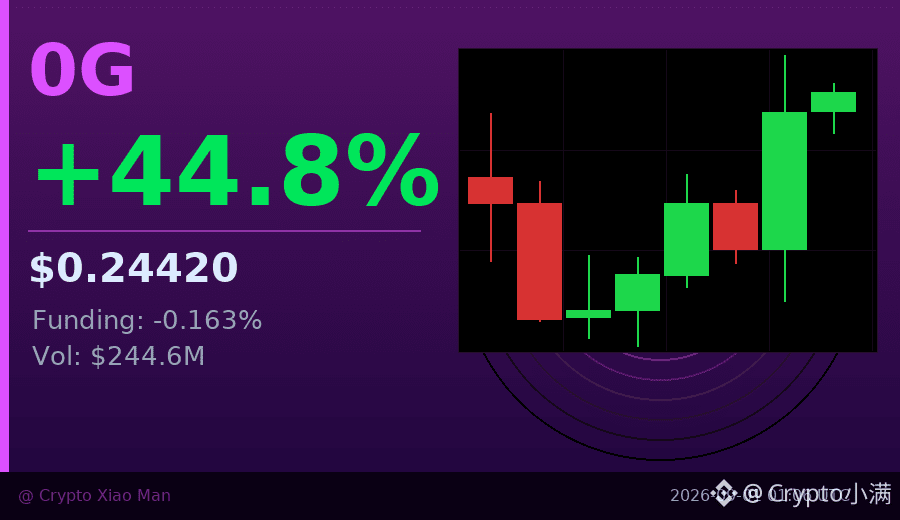
$0G Today’s surge—there are a few things worth taking a closer look at
In the past 24 hours, it’s up nearly 45%, jumping from a low of 0.1677 straight to 0.249. That’s already a pretty aggressive move.
But what interests me more isn’t the size of the move itself, but the funding rate: -0.163%, which is quite notably negative.
What does the funding rate mean? In simple terms—right now, people betting on it to drop are the ones paying money to those betting on it to rise.
In this situation, if the price is still going up, it means the shorts (those betting on a drop) are in a very passive position.
If the price keeps rising, those who are short will be forced to cut losses and close their positions, which in turn can further push the price higher.
From the candlestick structure, in the past few hours there have been consecutive bullish closes (closing within the upward momentum). And the most recent candle’s trading volume has also expanded noticeably,
indicating that incoming capital is increasing—not just small-scale activity.
Daily trading volume of $240 million (USD) isn’t small for a coin at this kind of scale—the market is taking this opportunity seriously.
Of course, after a 45% rise, risk is also increasing. What I’ll be watching for is:
Whether it can hold the 0.24 level next—if it stays above it, resistance is around 0.25;
If the funding rate continues to remain negative, be careful of pullbacks caused by a short-term overheated rebound.
$0G #资金费率异常 #45%暴涨
Click the small card below to quickly check the market👇
$0G Today’s surge—there are a few things worth taking a closer look at
In the past 24 hours, it’s up nearly 45%, jumping from a low of 0.1677 straight to 0.249. That’s already a pretty aggressive move.
But what interests me more isn’t the size of the move itself, but the funding rate: -0.163%, which is quite notably negative.
What does the funding rate mean? In simple terms—right now, people betting on it to drop are the ones paying money to those betting on it to rise.
In this situation, if the price is still going up, it means the shorts (those betting on a drop) are in a very passive position.
If the price keeps rising, those who are short will be forced to cut losses and close their positions, which in turn can further push the price higher.
From the candlestick structure, in the past few hours there have been consecutive bullish closes (closing within the upward momentum). And the most recent candle’s trading volume has also expanded noticeably,
indicating that incoming capital is increasing—not just small-scale activity.
Daily trading volume of $240 million (USD) isn’t small for a coin at this kind of scale—the market is taking this opportunity seriously.
Of course, after a 45% rise, risk is also increasing. What I’ll be watching for is:
Whether it can hold the 0.24 level next—if it stays above it, resistance is around 0.25;
If the funding rate continues to remain negative, be careful of pullbacks caused by a short-term overheated rebound.
$0G #资金费率异常 #45%暴涨
Click the small card below to quickly check the market👇
In the past 24 hours, it’s up nearly 45%, jumping from a low of 0.1677 straight to 0.249. That’s already a pretty aggressive move.
But what interests me more isn’t the size of the move itself, but the funding rate: -0.163%, which is quite notably negative.
What does the funding rate mean? In simple terms—right now, people betting on it to drop are the ones paying money to those betting on it to rise.
In this situation, if the price is still going up, it means the shorts (those betting on a drop) are in a very passive position.
If the price keeps rising, those who are short will be forced to cut losses and close their positions, which in turn can further push the price higher.
From the candlestick structure, in the past few hours there have been consecutive bullish closes (closing within the upward momentum). And the most recent candle’s trading volume has also expanded noticeably,
indicating that incoming capital is increasing—not just small-scale activity.
Daily trading volume of $240 million (USD) isn’t small for a coin at this kind of scale—the market is taking this opportunity seriously.
Of course, after a 45% rise, risk is also increasing. What I’ll be watching for is:
Whether it can hold the 0.24 level next—if it stays above it, resistance is around 0.25;
If the funding rate continues to remain negative, be careful of pullbacks caused by a short-term overheated rebound.
$0G #资金费率异常 #45%暴涨
Click the small card below to quickly check the market👇
186

See translation
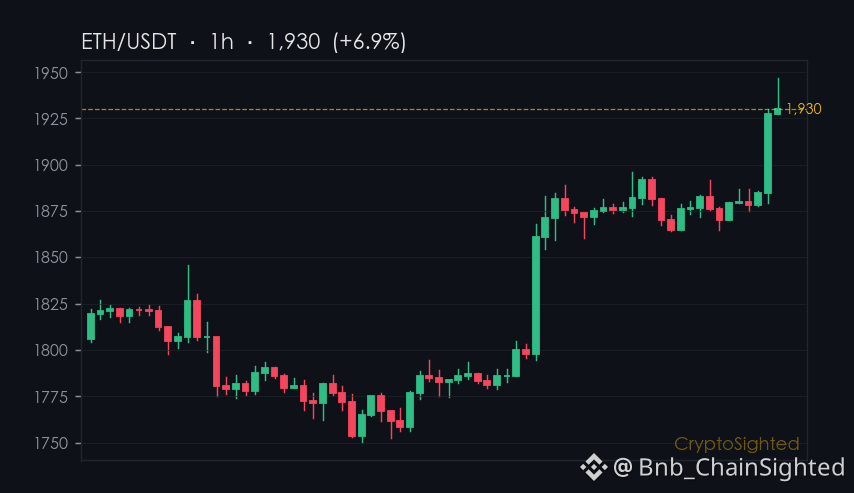
$ETH’s institutional privacy push is now a standalone entity - and it’s happening as the broader crypto landscape tightens.
The Ethereum Foundation’s ongoing shakeup has led to the spinout of EthSystems, a for-profit firm focused on institutional privacy tools.
This move comes as regulators in Japan, South Korea, and the EU are reclassifying crypto as a financial asset, imposing stricter AML rules, and overhauling how digital assets are managed.
On-chain, ETH’s 30-day price trajectory shows a steady upward trend, but the 7-day performance has softened - a sign of potential momentum fatigue.
Funding rates remain neutral, suggesting no immediate shift in leverage or sentiment.
The divergence between long-term gains and short-term flattening could signal a market waiting for a catalyst to break through.
—
Not financial advice. DYOR.
📌 News Take · #45 · #CryptoNews #CryptoSighted $ETH
$ETH ’s institutional privacy push is now a standalone entity - and it’s happening as the broader crypto landscape tightens.
The Ethereum Foundation’s ongoing shakeup has led to the spinout of EthSystems, a for-profit firm focused on institutional privacy tools.
This move comes as regulators in Japan, South Korea, and the EU are reclassifying crypto as a financial asset, imposing stricter AML rules, and overhauling how digital assets are managed.
On-chain, ETH’s 30-day price trajectory shows a steady upward trend, but the 7-day performance has softened - a sign of potential momentum fatigue.
Funding rates remain neutral, suggesting no immediate shift in leverage or sentiment.
The divergence between long-term gains and short-term flattening could signal a market waiting for a catalyst to break through.
—
Not financial advice. DYOR.
📌 News Take · #45 · #CryptoNews #CryptoSighted $ETH
The Ethereum Foundation’s ongoing shakeup has led to the spinout of EthSystems, a for-profit firm focused on institutional privacy tools.
This move comes as regulators in Japan, South Korea, and the EU are reclassifying crypto as a financial asset, imposing stricter AML rules, and overhauling how digital assets are managed.
On-chain, ETH’s 30-day price trajectory shows a steady upward trend, but the 7-day performance has softened - a sign of potential momentum fatigue.
Funding rates remain neutral, suggesting no immediate shift in leverage or sentiment.
The divergence between long-term gains and short-term flattening could signal a market waiting for a catalyst to break through.
—
Not financial advice. DYOR.
📌 News Take · #45 · #CryptoNews #CryptoSighted $ETH
65
Log in to explore more content
Join global crypto users on Binance Square
⚡️ Get latest and useful information about crypto.
💬 Trusted by the world’s largest crypto exchange.
👍 Discover real insights from verified creators.
Email / Phone number
Trending Topics
1
#BinanceReopensWithdrawalsForMoreAssets
686,753 views
3,442 Discussing
2
#BTCRebounds80K
183,543 views
1,681 Discussing
3
#Binance98PercentReplenished
96,135 views
1,132 Discussing
4
#KazakhstanReportedlyInvests$100MInCryptoFunds
0 views
0 Discussing
5
#StrategySTRCResumesIssuanceAfterOver170Days
951 views
53 Discussing
6
#ADPUSPrivateEmployersAdd86000JobsInOctober
14,096 views
257 Discussing
7
#SouthKoreaSeeksCryptoTaxDelayUntil2029
4,809 views
63 Discussing
8
#USMidterms-WhatAreMarketsExpecting?
500,754 views
2,554 Discussing
9
#US10YearTreasuryYieldFallsTo4.845%
4,655 views
70 Discussing
10
#ZcashExpectsNU7ToMake$16MSproutZECInaccessible
619 views
14 Discussing