
Ulfat-58
103 Posts

Ulfat-58
Report
Block User
Am professional Trader. crypto trading is my career
Open Trade
High-Frequency Trader
3.8 Years
78 Following
52 Followers
103 Liked
Posts
Portfolio
All
Quotes
·
--
#Idol
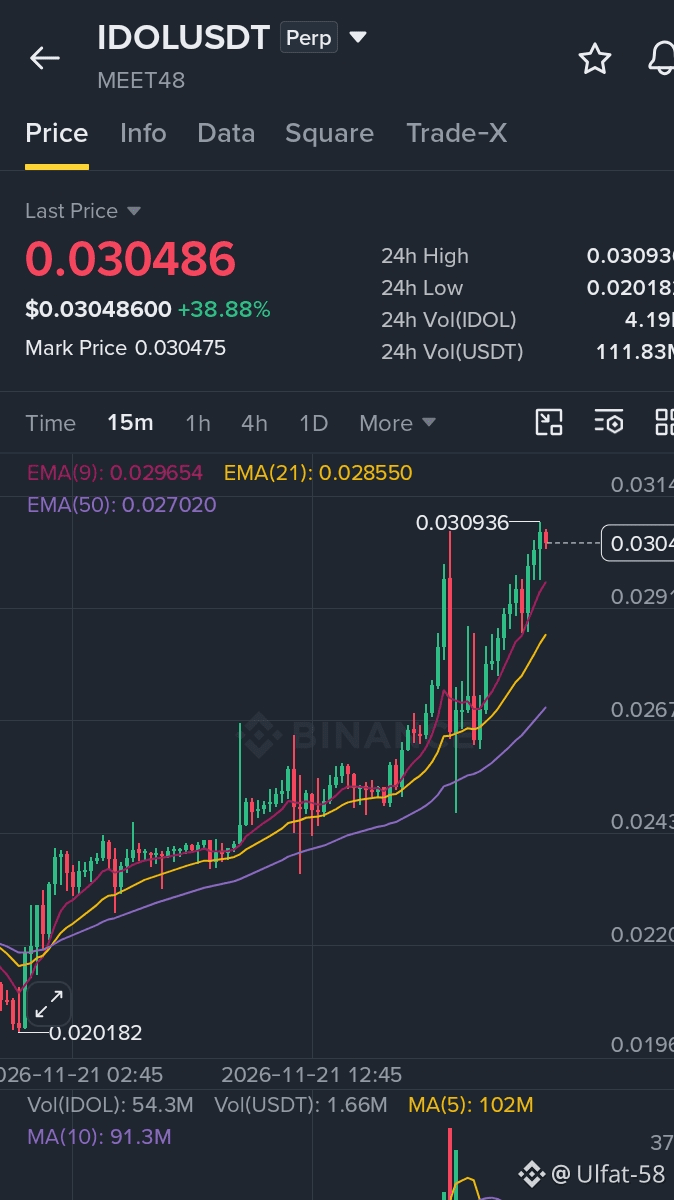
🔥 IDOL ON FIRE: Up +38.88%! Are We Witnessing the Next Big Move? 🚀
Take a look at this chart, Fam! $IDOL (MEET48) is puting on an absolute masterclass on the perpetual marke$IDOL today, skyrocketing +38.88% to trade at $0.030486! 📈
🔍 What the Chart is telling us:
Continuous Uptrend: Look at those beautiful, climbing green candles since the $0.020182 bottom. Buyers are fully in control!
Support Confirmation: Idol is comfortably riding well above the major EMAs (9, 21, and 50), showing strong, sustained bullish momentum.
Volume Surge: We are seeing heavy 24h trading volume at 4.19B IDOL (~$111.83M USDT )! People are FOMOing in! 💥
Breakout Attempt: It recently tested a 24h high of $0.030936 and is consolidating right below it.
🤔 The Big Question:
With this kind of volume and momentum, is Idol going to smash through the $0.031 resistance and keep flying, or is it time for a quick cooldown/retest of the EMA support?
👇 Are you riding this pump, shorting the top, or waiting on the sidelines? Share your play below! 💬
IDOL #IDOLUSDT #CryptoMarket #Trading #Bullish #BinanceSquare @Binance_Square_Official
#Idol
🔥 IDOL ON FIRE: Up +38.88%! Are We Witnessing the Next Big Move? 🚀
Take a look at this chart, Fam! $IDOL (MEET48) is puting on an absolute masterclass on the perpetual marke$IDOL today, skyrocketing +38.88% to trade at $0.030486! 📈
🔍 What the Chart is telling us:
Continuous Uptrend: Look at those beautiful, climbing green candles since the $0.020182 bottom. Buyers are fully in control!
Support Confirmation: Idol is comfortably riding well above the major EMAs (9, 21, and 50), showing strong, sustained bullish momentum.
Volume Surge: We are seeing heavy 24h trading volume at 4.19B IDOL (~$111.83M USDT )! People are FOMOing in! 💥
Breakout Attempt: It recently tested a 24h high of $0.030936 and is consolidating right below it.
🤔 The Big Question:
With this kind of volume and momentum, is Idol going to smash through the $0.031 resistance and keep flying, or is it time for a quick cooldown/retest of the EMA support?
👇 Are you riding this pump, shorting the top, or waiting on the sidelines? Share your play below! 💬
IDOL #IDOLUSDT #CryptoMarket #Trading #Bullish #BinanceSquare @Binance_Square_Official
🔥 IDOL ON FIRE: Up +38.88%! Are We Witnessing the Next Big Move? 🚀
Take a look at this chart, Fam! $IDOL (MEET48) is puting on an absolute masterclass on the perpetual marke$IDOL today, skyrocketing +38.88% to trade at $0.030486! 📈
🔍 What the Chart is telling us:
Continuous Uptrend: Look at those beautiful, climbing green candles since the $0.020182 bottom. Buyers are fully in control!
Support Confirmation: Idol is comfortably riding well above the major EMAs (9, 21, and 50), showing strong, sustained bullish momentum.
Volume Surge: We are seeing heavy 24h trading volume at 4.19B IDOL (~$111.83M USDT )! People are FOMOing in! 💥
Breakout Attempt: It recently tested a 24h high of $0.030936 and is consolidating right below it.
🤔 The Big Question:
With this kind of volume and momentum, is Idol going to smash through the $0.031 resistance and keep flying, or is it time for a quick cooldown/retest of the EMA support?
👇 Are you riding this pump, shorting the top, or waiting on the sidelines? Share your play below! 💬
IDOL #IDOLUSDT #CryptoMarket #Trading #Bullish #BinanceSquare @Binance_Square_Official
277
·
--
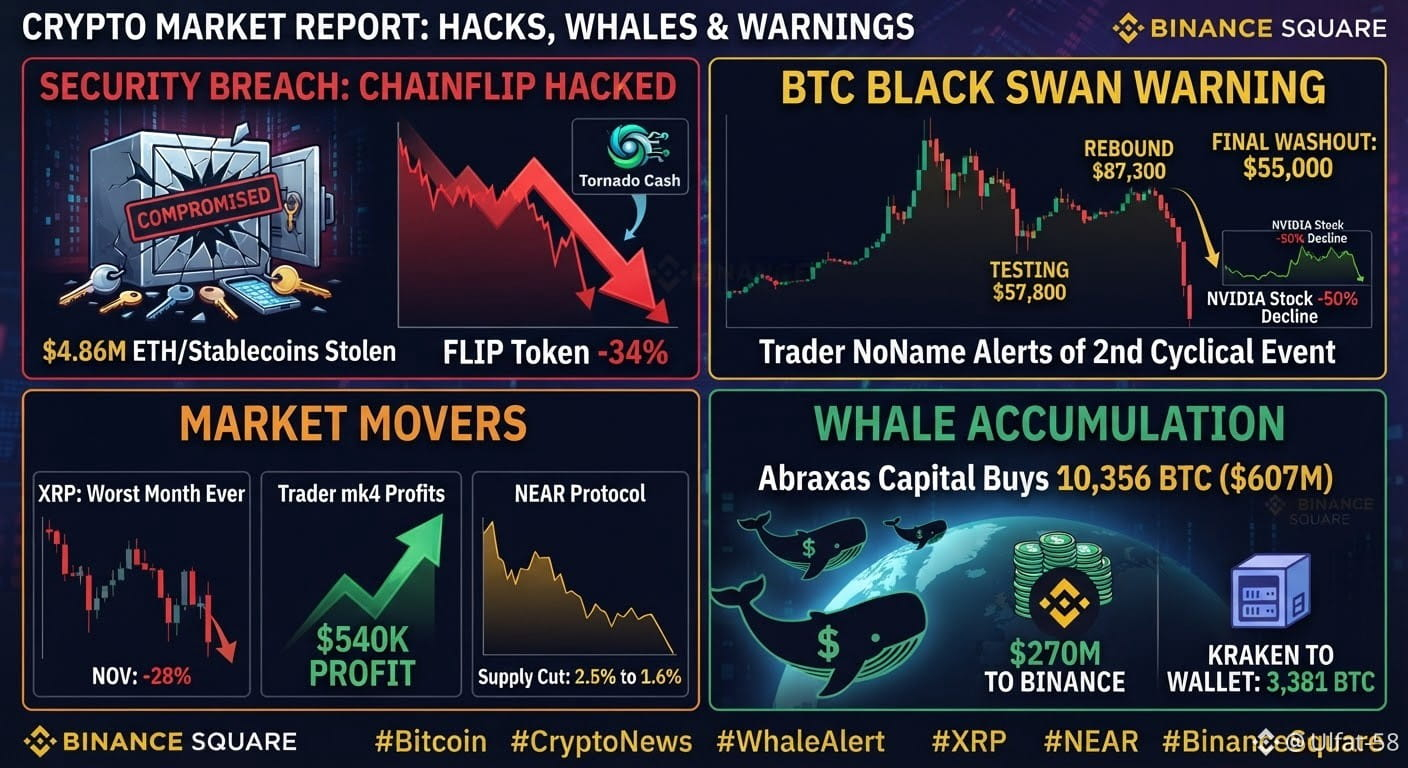
🚨 CRYPTO MARKET SHAKEUP: Hacks, Whale Moves & Black Swan Warnings! 📉🐋
The market is moving fast today. Here is everything you need to know in 60 seconds 👇
⚠️ Security & Macro Alerts:
Chainflip Hacked ($4.86M): Ethereum vault keys compromised; funds washed via Tornado Cash. Protocol paused & $FLIP dumped 34%.
BTC "Black Swan" Warning: Top trader warns a dip to $57.8K → bounce to $87.3K could precede a final washout to $55K as tech stocks (like NVDA) cool off.
Capital Rotation: With crypto cap halved to ~$2T, Bloomberg notes some BTC investors are rotating into AI stocks & prediction markets.
📊 Key Market Shifts:
XRP Historic Drop: Down 28% this month (breaking below $0.90), marking its worst monthly performance ever amid ETF outflows.
Smart Shorting: Trader mk4 banked $540K shorting BTC from $64.9K to $57.9K—and is still sitting on $1.4M+ in unrealized short profits on $XMR, $ZEC & $AAVE.
NEAR Goes Leaner: Emissions officially cut from 2.5% to 1.6% over 2 years, pushing $NEAR closer to deflationary territory.
Stablecoin AI Boom: China-linked stablecoin payments jumped 55% to access new US AI models.
🐋 Massive Whale Activity (Buying the Dip?):
Abraxas Capital scooped up 10,356 BTC ($607M) at ~$58,651!
$270M in stablecoins just hit Binance (rumored to be the "1011 insider whale" loading up for a dip buy).
3,381 BTC ($202.6M) moved off Kraken to cold storage.
165.9M USDT freshly minted by Tether & sent to Binance for liquidity.
💡 The Takeaway: Retail is panicking and shorting, while institutions and mega-whales are quietly loading up hundreds of millions on the dip.
👇 Are you buying this dip with the whales or waiting for $55K? Drop your move below! 💬
#Bitcoin #CryptoNews #WhaleAlert #XRP #NEAR #BinanceSquare
🚨 CRYPTO MARKET SHAKEUP: Hacks, Whale Moves & Black Swan Warnings! 📉🐋
The market is moving fast today. Here is everything you need to know in 60 seconds 👇
⚠️ Security & Macro Alerts:
Chainflip Hacked ($4.86M): Ethereum vault keys compromised; funds washed via Tornado Cash. Protocol paused & $FLIP dumped 34%.
BTC "Black Swan" Warning: Top trader warns a dip to $57.8K → bounce to $87.3K could precede a final washout to $55K as tech stocks (like NVDA) cool off.
Capital Rotation: With crypto cap halved to ~$2T, Bloomberg notes some BTC investors are rotating into AI stocks & prediction markets.
📊 Key Market Shifts:
XRP Historic Drop: Down 28% this month (breaking below $0.90), marking its worst monthly performance ever amid ETF outflows.
Smart Shorting: Trader mk4 banked $540K shorting BTC from $64.9K to $57.9K—and is still sitting on $1.4M+ in unrealized short profits on $XMR, $ZEC & $AAVE.
NEAR Goes Leaner: Emissions officially cut from 2.5% to 1.6% over 2 years, pushing $NEAR closer to deflationary territory.
Stablecoin AI Boom: China-linked stablecoin payments jumped 55% to access new US AI models.
🐋 Massive Whale Activity (Buying the Dip?):
Abraxas Capital scooped up 10,356 BTC ($607M) at ~$58,651!
$270M in stablecoins just hit Binance (rumored to be the "1011 insider whale" loading up for a dip buy).
3,381 BTC ($202.6M) moved off Kraken to cold storage.
165.9M USDT freshly minted by Tether & sent to Binance for liquidity.
💡 The Takeaway: Retail is panicking and shorting, while institutions and mega-whales are quietly loading up hundreds of millions on the dip.
👇 Are you buying this dip with the whales or waiting for $55K? Drop your move below! 💬
#Bitcoin #CryptoNews #WhaleAlert #XRP #NEAR #BinanceSquare
The market is moving fast today. Here is everything you need to know in 60 seconds 👇
⚠️ Security & Macro Alerts:
Chainflip Hacked ($4.86M): Ethereum vault keys compromised; funds washed via Tornado Cash. Protocol paused & $FLIP dumped 34%.
BTC "Black Swan" Warning: Top trader warns a dip to $57.8K → bounce to $87.3K could precede a final washout to $55K as tech stocks (like NVDA) cool off.
Capital Rotation: With crypto cap halved to ~$2T, Bloomberg notes some BTC investors are rotating into AI stocks & prediction markets.
📊 Key Market Shifts:
XRP Historic Drop: Down 28% this month (breaking below $0.90), marking its worst monthly performance ever amid ETF outflows.
Smart Shorting: Trader mk4 banked $540K shorting BTC from $64.9K to $57.9K—and is still sitting on $1.4M+ in unrealized short profits on $XMR, $ZEC & $AAVE.
NEAR Goes Leaner: Emissions officially cut from 2.5% to 1.6% over 2 years, pushing $NEAR closer to deflationary territory.
Stablecoin AI Boom: China-linked stablecoin payments jumped 55% to access new US AI models.
🐋 Massive Whale Activity (Buying the Dip?):
Abraxas Capital scooped up 10,356 BTC ($607M) at ~$58,651!
$270M in stablecoins just hit Binance (rumored to be the "1011 insider whale" loading up for a dip buy).
3,381 BTC ($202.6M) moved off Kraken to cold storage.
165.9M USDT freshly minted by Tether & sent to Binance for liquidity.
💡 The Takeaway: Retail is panicking and shorting, while institutions and mega-whales are quietly loading up hundreds of millions on the dip.
👇 Are you buying this dip with the whales or waiting for $55K? Drop your move below! 💬
#Bitcoin #CryptoNews #WhaleAlert #XRP #NEAR #BinanceSquare
1
293
·
--
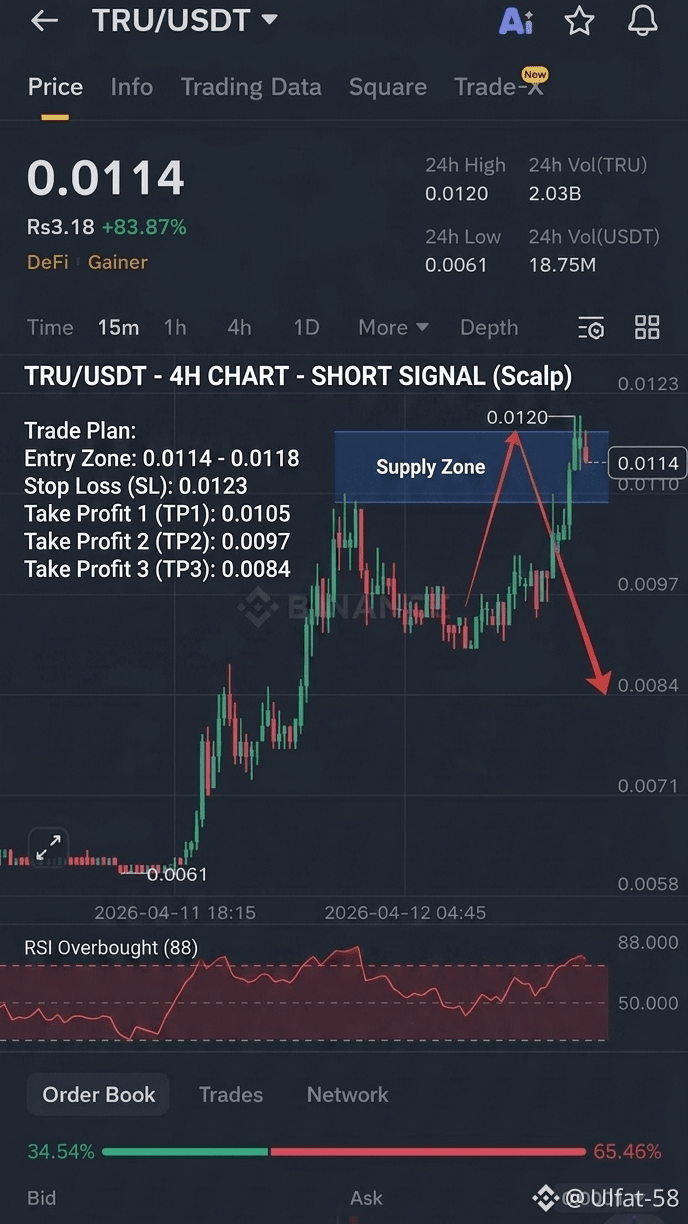
TRU/USDT - SHORT (Scalp/Swing)
Trade Plan:
Entry: 0.0114 – 0.0118
Stop Loss (SL): 0.0123 (Above the recent wick high)
Take Profit 1 (TP1): 0.0105
Take Profit 2 (TP2): 0.0097
Take Profit 3 (TP3): 0.0084
Why this setup?
The price is extended far beyond its moving averages after an aggressive vertical climb. We are seeing a "Long Upper Wick" at 0.0120, suggesting that sellers are stepping in to take profits. While the trend is currently bullish, the risk of a sharp "mean reversion" back to the 0.0097 support level is high. If it fails to break 0.0120 again, a deeper correction is likely.
$TRU
{future}(TRUUSDT)
#TRU #US-IranTalksFailToReachAgreement #BTC #ETH
TRU/USDT - SHORT (Scalp/Swing)
Trade Plan:
Entry: 0.0114 – 0.0118
Stop Loss (SL): 0.0123 (Above the recent wick high)
Take Profit 1 (TP1): 0.0105
Take Profit 2 (TP2): 0.0097
Take Profit 3 (TP3): 0.0084
Why this setup?
The price is extended far beyond its moving averages after an aggressive vertical climb. We are seeing a "Long Upper Wick" at 0.0120, suggesting that sellers are stepping in to take profits. While the trend is currently bullish, the risk of a sharp "mean reversion" back to the 0.0097 support level is high. If it fails to break 0.0120 again, a deeper correction is likely.
$TRU
#TRU #US-IranTalksFailToReachAgreement #BTC #ETH
Trade Plan:
Entry: 0.0114 – 0.0118
Stop Loss (SL): 0.0123 (Above the recent wick high)
Take Profit 1 (TP1): 0.0105
Take Profit 2 (TP2): 0.0097
Take Profit 3 (TP3): 0.0084
Why this setup?
The price is extended far beyond its moving averages after an aggressive vertical climb. We are seeing a "Long Upper Wick" at 0.0120, suggesting that sellers are stepping in to take profits. While the trend is currently bullish, the risk of a sharp "mean reversion" back to the 0.0097 support level is high. If it fails to break 0.0120 again, a deeper correction is likely.
$TRU
#TRU #US-IranTalksFailToReachAgreement #BTC #ETH
1
63
·
--
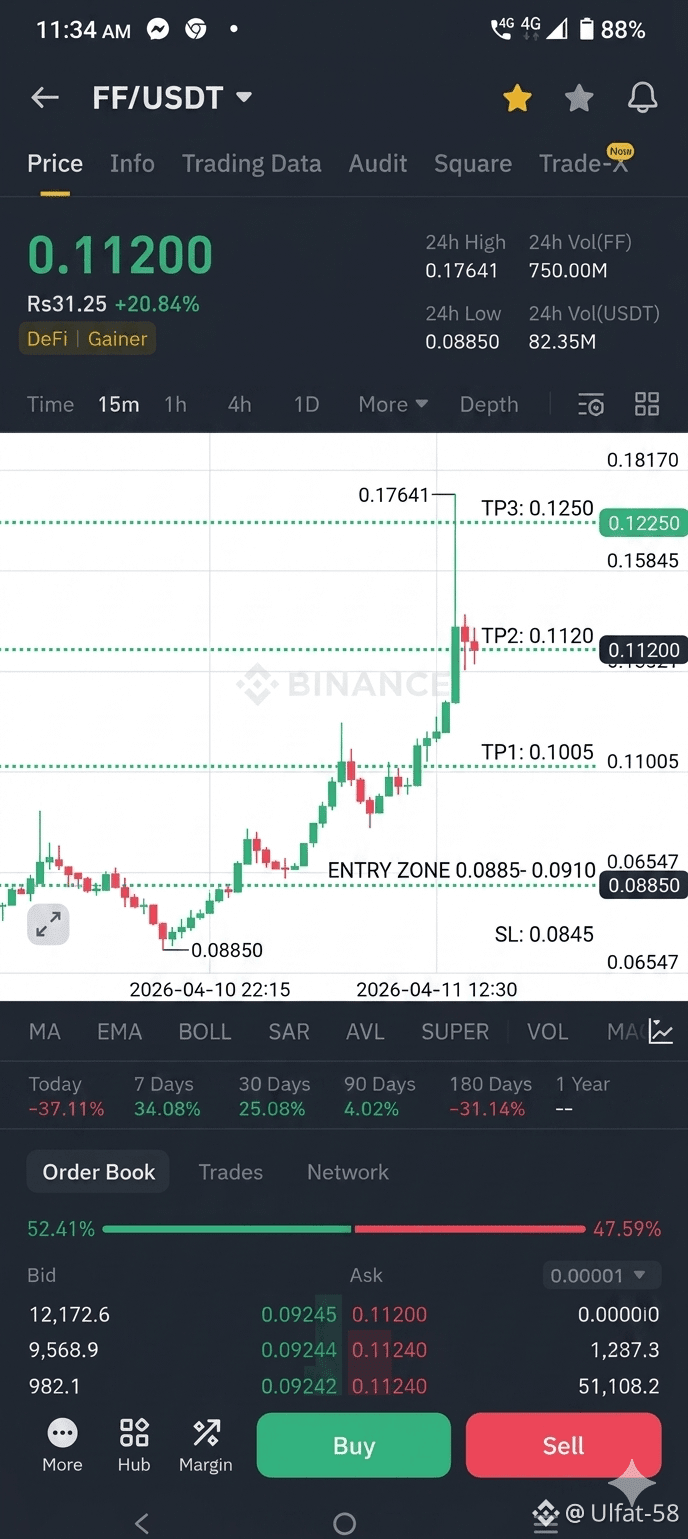
$FF /USDT – LONG (Scalp)
Trade Plan:
Entry: $0.0885 – 0.0910
Stop Loss (SL): 0.0845 (Below the recent local consolidation)
Take Profit 1 (TP1): 0.1005
Take Profit 2 (TP2): 0.1120
Take Profit 3 (TP3): 0.1250
Why this setup?
Market Structure: After the parabolic move to $0.17641, the price has retraced over 50%. It is currently attempting to stabilize near the $0.092 mark.
Volume Profile: Selling pressure is exhausting. The order book shows a significant "Ask" wall (61.01%), which often acts as a magnet for a quick "liquidity grab" pump before further downside.
Indicator Check: On the 15m timeframe, the price is hugging the lower support levels. A bounce toward the $0.10 psychological resistance is likely as late shorts get squeezed.
$FF
{future}(FFUSDT)
#fft/usdt #btc $XRP #HighestCPISince2022
$FF /USDT – LONG (Scalp)
Trade Plan:
Entry: $0.0885 – 0.0910
Stop Loss (SL): 0.0845 (Below the recent local consolidation)
Take Profit 1 (TP1): 0.1005
Take Profit 2 (TP2): 0.1120
Take Profit 3 (TP3): 0.1250
Why this setup?
Market Structure: After the parabolic move to $0.17641, the price has retraced over 50%. It is currently attempting to stabilize near the $0.092 mark.
Volume Profile: Selling pressure is exhausting. The order book shows a significant "Ask" wall (61.01%), which often acts as a magnet for a quick "liquidity grab" pump before further downside.
Indicator Check: On the 15m timeframe, the price is hugging the lower support levels. A bounce toward the $0.10 psychological resistance is likely as late shorts get squeezed.
$FF
#fft/usdt #btc $XRP #HighestCPISince2022
Trade Plan:
Entry: $0.0885 – 0.0910
Stop Loss (SL): 0.0845 (Below the recent local consolidation)
Take Profit 1 (TP1): 0.1005
Take Profit 2 (TP2): 0.1120
Take Profit 3 (TP3): 0.1250
Why this setup?
Market Structure: After the parabolic move to $0.17641, the price has retraced over 50%. It is currently attempting to stabilize near the $0.092 mark.
Volume Profile: Selling pressure is exhausting. The order book shows a significant "Ask" wall (61.01%), which often acts as a magnet for a quick "liquidity grab" pump before further downside.
Indicator Check: On the 15m timeframe, the price is hugging the lower support levels. A bounce toward the $0.10 psychological resistance is likely as late shorts get squeezed.
$FF
#fft/usdt #btc $XRP #HighestCPISince2022
1
71
·
--
$BNB_LIFE / USDT - SHORT (Scalp)
Trade Plan:
Entry: 0.1253 – 0.1280
Stop Loss (SL): 0.1435 (Just above the recent wick high)
Take Profit 1 (TP1): 0.1105
Take Profit 2 (TP2): 0.0980
Take Profit 3 (TP3): 0.0850 (Major support level)
Why this setup?
Overextended Price: The price has surged over 34% in a very short window. This "parabolic" move is rarely sustainable without a healthy pullback to retest previous support levels.
Resistance Rejection: The price hit a high of 0.1425 and was immediately pushed back down. This indicates a high concentration of sell orders (profit-taking) at that level.
Volume Climax: The 24h volume is exceptionally high (422M units). Often, such high volume at the top of a vertical move signals a "blow-off top," where the last buyers are trapped before a drop.
$币安人生
{future}(币安人生USDT)
#btc #币安人生日记 #BNB走势 #BinanceSquareFamily
$BNB_LIFE / USDT - SHORT (Scalp)
Trade Plan:
Entry: 0.1253 – 0.1280
Stop Loss (SL): 0.1435 (Just above the recent wick high)
Take Profit 1 (TP1): 0.1105
Take Profit 2 (TP2): 0.0980
Take Profit 3 (TP3): 0.0850 (Major support level)
Why this setup?
Overextended Price: The price has surged over 34% in a very short window. This "parabolic" move is rarely sustainable without a healthy pullback to retest previous support levels.
Resistance Rejection: The price hit a high of 0.1425 and was immediately pushed back down. This indicates a high concentration of sell orders (profit-taking) at that level.
Volume Climax: The 24h volume is exceptionally high (422M units). Often, such high volume at the top of a vertical move signals a "blow-off top," where the last buyers are trapped before a drop.
$币安人生
#btc #币安人生日记 #BNB走势 #BinanceSquareFamily
Trade Plan:
Entry: 0.1253 – 0.1280
Stop Loss (SL): 0.1435 (Just above the recent wick high)
Take Profit 1 (TP1): 0.1105
Take Profit 2 (TP2): 0.0980
Take Profit 3 (TP3): 0.0850 (Major support level)
Why this setup?
Overextended Price: The price has surged over 34% in a very short window. This "parabolic" move is rarely sustainable without a healthy pullback to retest previous support levels.
Resistance Rejection: The price hit a high of 0.1425 and was immediately pushed back down. This indicates a high concentration of sell orders (profit-taking) at that level.
Volume Climax: The 24h volume is exceptionally high (422M units). Often, such high volume at the top of a vertical move signals a "blow-off top," where the last buyers are trapped before a drop.
$币安人生
#btc #币安人生日记 #BNB走势 #BinanceSquareFamily
1
246
·
--
$DASH
{future}(DASHUSDT)
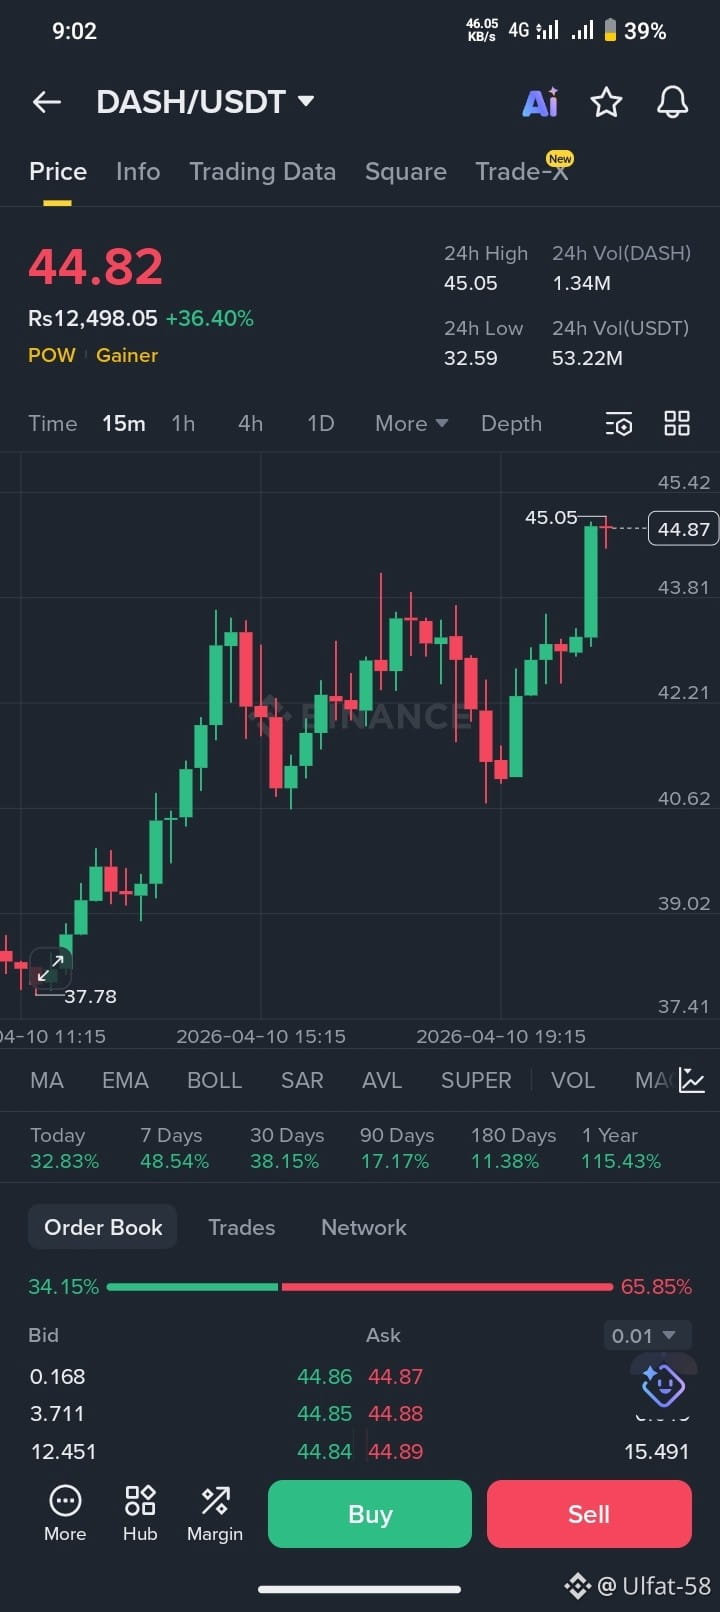
$DASH/USDT - LONG (Momentum Play)
Trade Plan:
Entry: 44.20 – 44.82
SL (Stop Loss): 42.10
TP1 (Take Profit): 46.50
TP2: 48.80
TP3: 51.20
Why this setup?
Parabolic Momentum: Dash is showing extreme strength, up +36.40% in the last 24 hours. It has officially entered "Discovery Mode" on shorter timeframes after breaking the $42.00 resistance.
Strong Volume Support: The 24h volume of 53.22M USDT confirms that this isn't a fake-out; buyers are aggressively absorbing the sell-side order book.
Technical Breakout: The chart shows a series of higher lows leading into this vertical spike. While the RSI is likely screaming overbought, in high-momentum runs, price often hugs the upper Bollinger Bands before any significant cooling.
$DASH
$DASH /USDT - LONG (Momentum Play)
Trade Plan:
Entry: 44.20 – 44.82
SL (Stop Loss): 42.10
TP1 (Take Profit): 46.50
TP2: 48.80
TP3: 51.20
Why this setup?
Parabolic Momentum: Dash is showing extreme strength, up +36.40% in the last 24 hours. It has officially entered "Discovery Mode" on shorter timeframes after breaking the $42.00 resistance.
Strong Volume Support: The 24h volume of 53.22M USDT confirms that this isn't a fake-out; buyers are aggressively absorbing the sell-side order book.
Technical Breakout: The chart shows a series of higher lows leading into this vertical spike. While the RSI is likely screaming overbought, in high-momentum runs, price often hugs the upper Bollinger Bands before any significant cooling.
$DASH /USDT - LONG (Momentum Play)
Trade Plan:
Entry: 44.20 – 44.82
SL (Stop Loss): 42.10
TP1 (Take Profit): 46.50
TP2: 48.80
TP3: 51.20
Why this setup?
Parabolic Momentum: Dash is showing extreme strength, up +36.40% in the last 24 hours. It has officially entered "Discovery Mode" on shorter timeframes after breaking the $42.00 resistance.
Strong Volume Support: The 24h volume of 53.22M USDT confirms that this isn't a fake-out; buyers are aggressively absorbing the sell-side order book.
Technical Breakout: The chart shows a series of higher lows leading into this vertical spike. While the RSI is likely screaming overbought, in high-momentum runs, price often hugs the upper Bollinger Bands before any significant cooling.
114
·
--
$TNSR
{future}(TNSRUSDT)
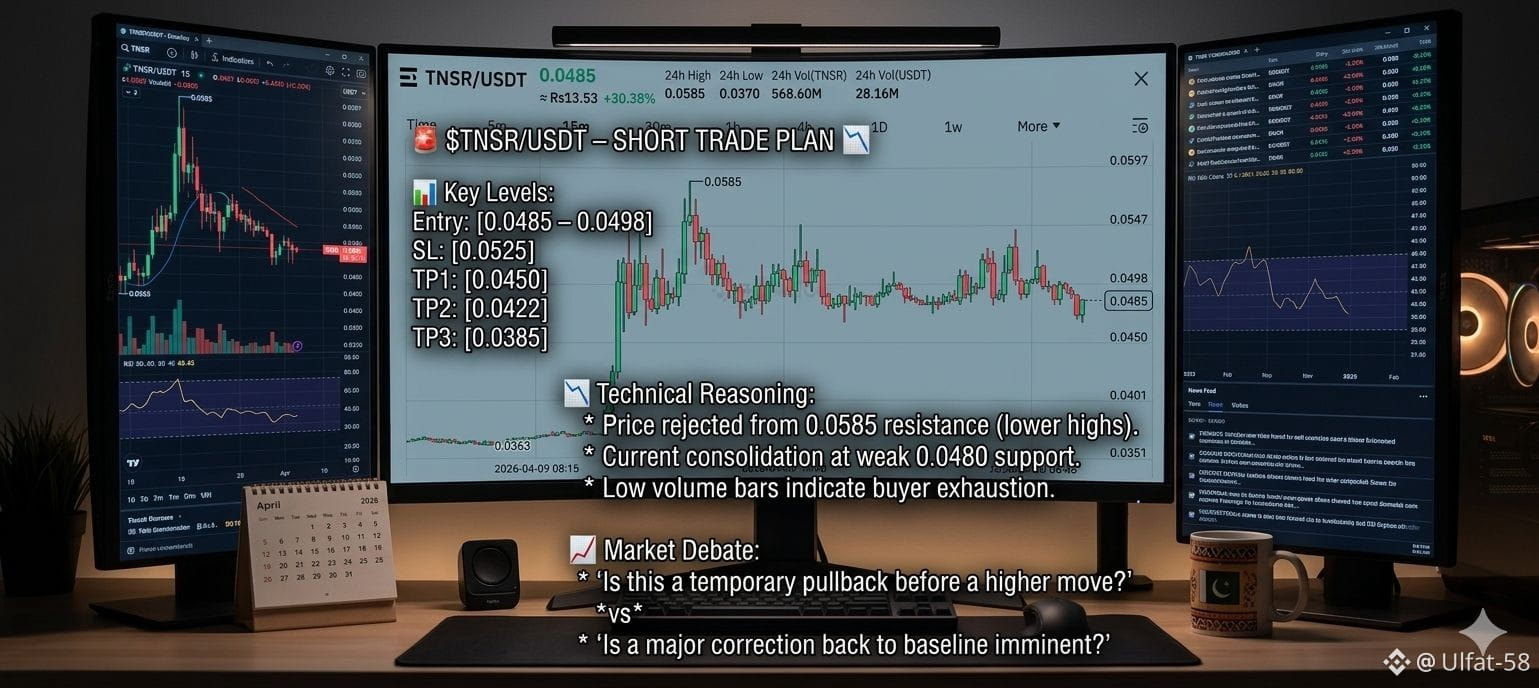
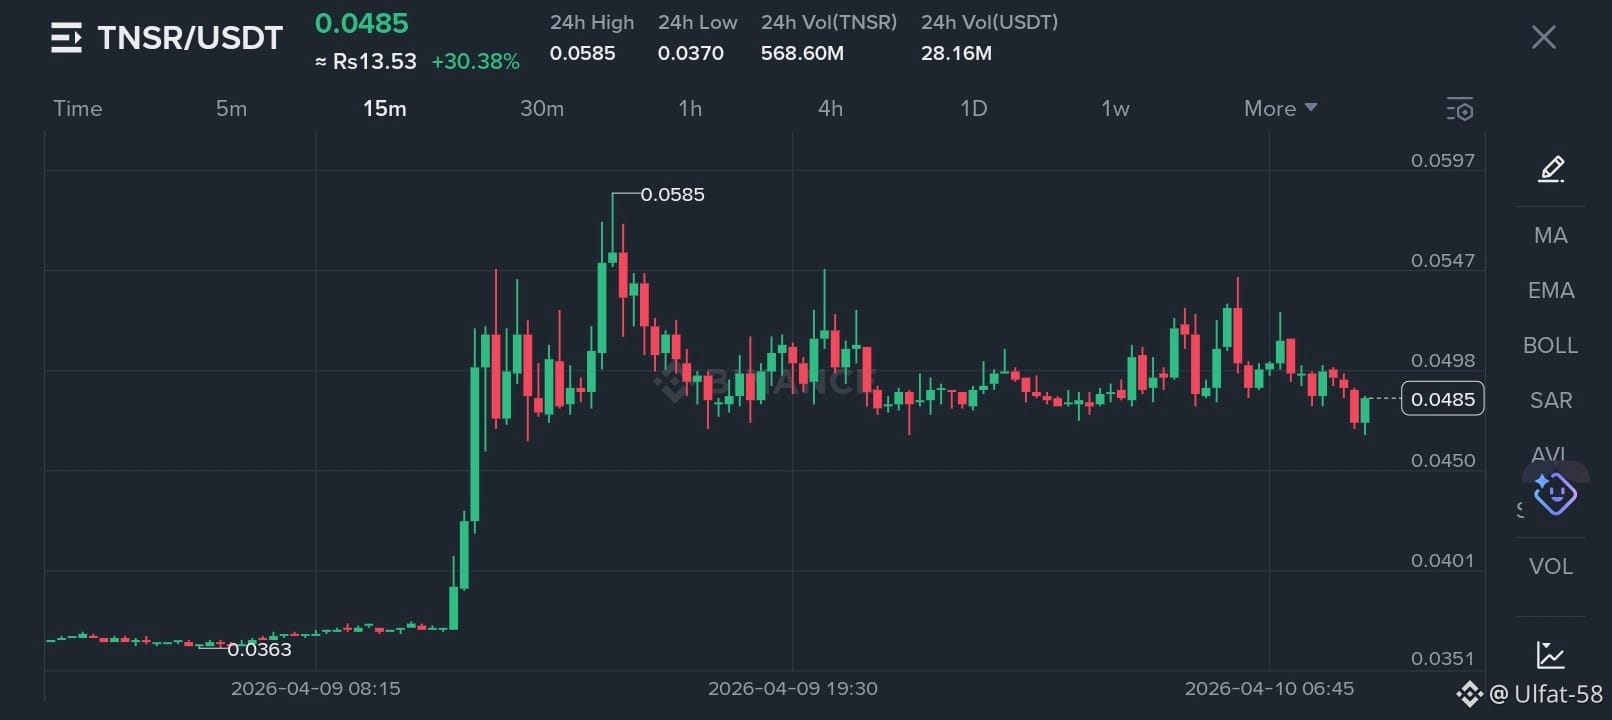
$TNSR/USDT - SHORT 📉
Trade Plan:
Entry: 0.0485 – 0.0498 (Current price se resistance zone tak)
Stop Loss (SL): 0.0525 (Previous local high ke upar)
Take Profit 1 (TP1): 0.0450 (Immediate support)
Take Profit 2 (TP2): 0.0422 (Stronger consolidation zone)
Take Profit 3 (TP3): 0.0385 (Major liquidity sweep)
Why this setup?
Price Action: Ek bari rally ke baad price 0.0585 se reject hui hai aur ab lower highs bana rahi hai. 15m chart par momentum weak hota nazar aa raha hai.
Support/Resistance: Price filhal local support (0.0480 zone) par hold kar rahi hai. Agar ye break hota hai, toh liquidity seedha 0.0450 ki taraf move karegi.
Indicator Hint: Volume bars thoday chotay ho rahay hain jo buyers ki thakawat (exhaustion) show kar rahay hain.
#tnsr #BTC #ETH #bnb
$TNSR
$TNSR /USDT - SHORT 📉
Trade Plan:
Entry: 0.0485 – 0.0498 (Current price se resistance zone tak)
Stop Loss (SL): 0.0525 (Previous local high ke upar)
Take Profit 1 (TP1): 0.0450 (Immediate support)
Take Profit 2 (TP2): 0.0422 (Stronger consolidation zone)
Take Profit 3 (TP3): 0.0385 (Major liquidity sweep)
Why this setup?
Price Action: Ek bari rally ke baad price 0.0585 se reject hui hai aur ab lower highs bana rahi hai. 15m chart par momentum weak hota nazar aa raha hai.
Support/Resistance: Price filhal local support (0.0480 zone) par hold kar rahi hai. Agar ye break hota hai, toh liquidity seedha 0.0450 ki taraf move karegi.
Indicator Hint: Volume bars thoday chotay ho rahay hain jo buyers ki thakawat (exhaustion) show kar rahay hain.
#tnsr #BTC #ETH #bnb
$TNSR /USDT - SHORT 📉
Trade Plan:
Entry: 0.0485 – 0.0498 (Current price se resistance zone tak)
Stop Loss (SL): 0.0525 (Previous local high ke upar)
Take Profit 1 (TP1): 0.0450 (Immediate support)
Take Profit 2 (TP2): 0.0422 (Stronger consolidation zone)
Take Profit 3 (TP3): 0.0385 (Major liquidity sweep)
Why this setup?
Price Action: Ek bari rally ke baad price 0.0585 se reject hui hai aur ab lower highs bana rahi hai. 15m chart par momentum weak hota nazar aa raha hai.
Support/Resistance: Price filhal local support (0.0480 zone) par hold kar rahi hai. Agar ye break hota hai, toh liquidity seedha 0.0450 ki taraf move karegi.
Indicator Hint: Volume bars thoday chotay ho rahay hain jo buyers ki thakawat (exhaustion) show kar rahay hain.
#tnsr #BTC #ETH #bnb
1
3
·
--
$SUI
{future}(SUIUSDT)
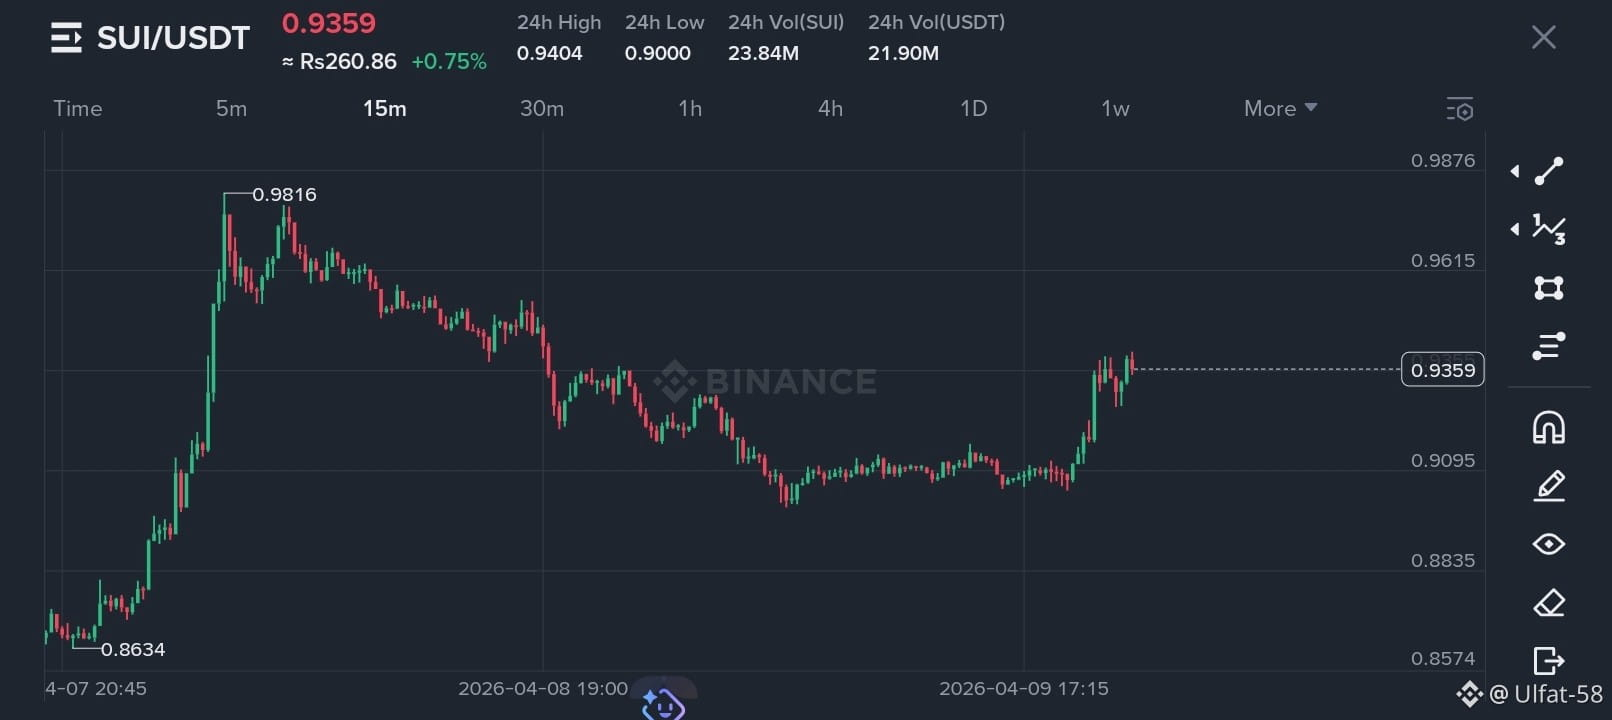
$SUI/USDT - SHORT
Trade Plan:
Entry: 0.9359 – 0.9410
SL: 0.9580
TP1: 0.9095
TP2: 0.8835
TP3: 0.8634
Why this setup?
Chart par price ne recently 0.9816 se reject hokar niche ki taraf breakdown diya hai. Abhi jo halia bounce nazar aa raha hai, wo ek "Lower High" banane ki koshish lag rahi hai jo bearish structure ko confirm karta hai. Volume mein bhi wo purana dam-kham nahi dikh raha, aur $0.9400 ka area ek strong immediate resistance ban chuka hai. Agar ye zone par rejection milti hai, to price dobara apne purane lows (0.8634) ko touch karne ja sakti hai.
#sui #BTC #PolygonFunding
$SUI
$SUI /USDT - SHORT
Trade Plan:
Entry: 0.9359 – 0.9410
SL: 0.9580
TP1: 0.9095
TP2: 0.8835
TP3: 0.8634
Why this setup?
Chart par price ne recently 0.9816 se reject hokar niche ki taraf breakdown diya hai. Abhi jo halia bounce nazar aa raha hai, wo ek "Lower High" banane ki koshish lag rahi hai jo bearish structure ko confirm karta hai. Volume mein bhi wo purana dam-kham nahi dikh raha, aur $0.9400 ka area ek strong immediate resistance ban chuka hai. Agar ye zone par rejection milti hai, to price dobara apne purane lows (0.8634) ko touch karne ja sakti hai.
#sui #BTC #PolygonFunding
$SUI /USDT - SHORT
Trade Plan:
Entry: 0.9359 – 0.9410
SL: 0.9580
TP1: 0.9095
TP2: 0.8835
TP3: 0.8634
Why this setup?
Chart par price ne recently 0.9816 se reject hokar niche ki taraf breakdown diya hai. Abhi jo halia bounce nazar aa raha hai, wo ek "Lower High" banane ki koshish lag rahi hai jo bearish structure ko confirm karta hai. Volume mein bhi wo purana dam-kham nahi dikh raha, aur $0.9400 ka area ek strong immediate resistance ban chuka hai. Agar ye zone par rejection milti hai, to price dobara apne purane lows (0.8634) ko touch karne ja sakti hai.
#sui #BTC #PolygonFunding
8
·
--
$JST
{future}(JSTUSDT)
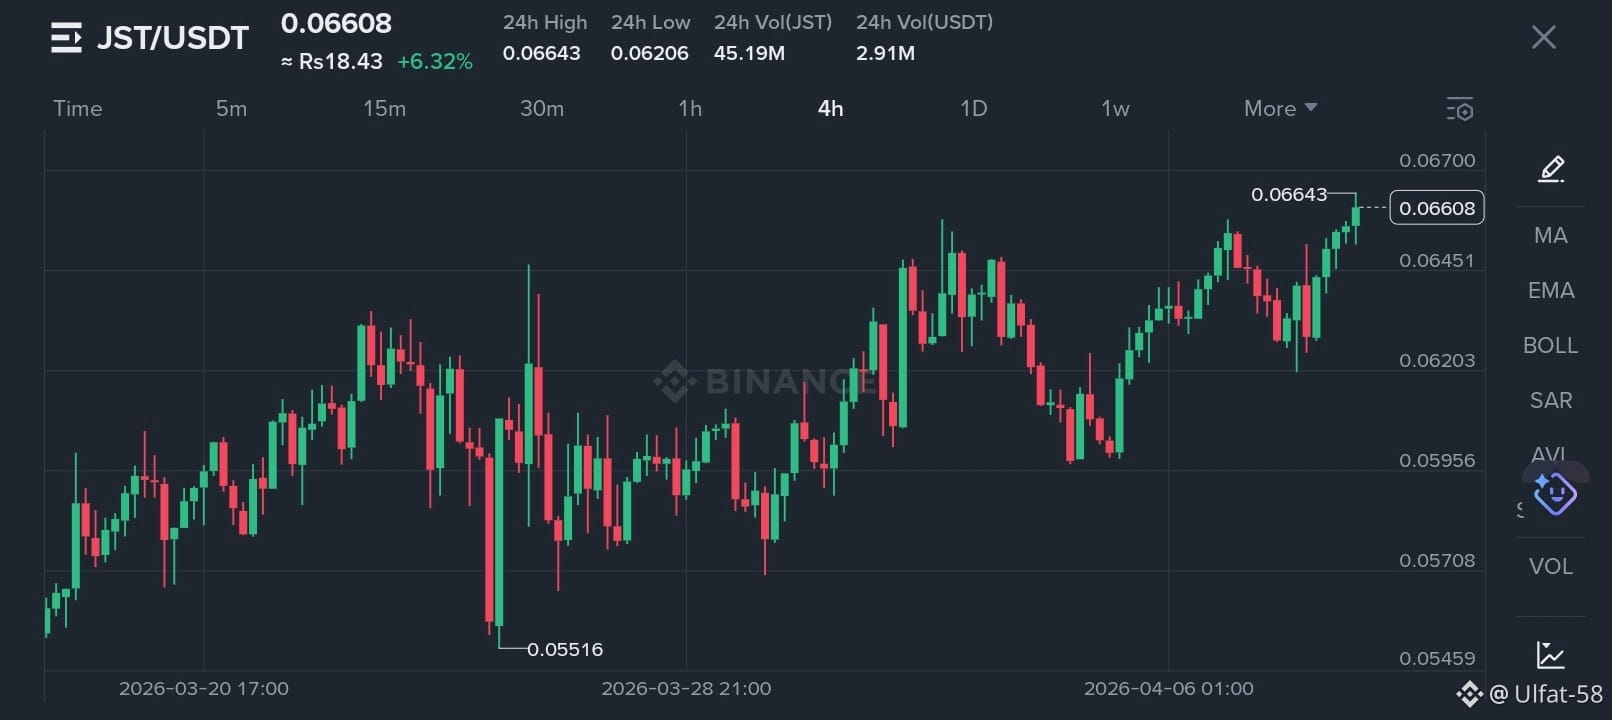
$JST/USDT – LONG (Trend Continuation)
Trade Plan:
Entry: 0.06580 – 0.06643 (Breakout or slight pullback)
SL: 0.06200 (Below the recent higher low)
TP1: 0.06850
TP2: 0.07120
TP3: 0.07500
Why this setup?
The 4H chart shows a clear ascending structure with consistent higher highs and higher lows. Price is currently testing the recent peak at 0.06643. The series of green candles suggests buyers are in control, and we are seeing a "staircase" recovery from the 0.05516 bottom. If it breaks and holds above the current resistance, the next leg up is highly likely.
#JSTPump #MorganStanley'sBTCETFSetToLaunch #BTC #ETH
$JST
$JST /USDT – LONG (Trend Continuation)
Trade Plan:
Entry: 0.06580 – 0.06643 (Breakout or slight pullback)
SL: 0.06200 (Below the recent higher low)
TP1: 0.06850
TP2: 0.07120
TP3: 0.07500
Why this setup?
The 4H chart shows a clear ascending structure with consistent higher highs and higher lows. Price is currently testing the recent peak at 0.06643. The series of green candles suggests buyers are in control, and we are seeing a "staircase" recovery from the 0.05516 bottom. If it breaks and holds above the current resistance, the next leg up is highly likely.
#JSTPump #MorganStanley'sBTCETFSetToLaunch #BTC #ETH
$JST /USDT – LONG (Trend Continuation)
Trade Plan:
Entry: 0.06580 – 0.06643 (Breakout or slight pullback)
SL: 0.06200 (Below the recent higher low)
TP1: 0.06850
TP2: 0.07120
TP3: 0.07500
Why this setup?
The 4H chart shows a clear ascending structure with consistent higher highs and higher lows. Price is currently testing the recent peak at 0.06643. The series of green candles suggests buyers are in control, and we are seeing a "staircase" recovery from the 0.05516 bottom. If it breaks and holds above the current resistance, the next leg up is highly likely.
#JSTPump #MorganStanley'sBTCETFSetToLaunch #BTC #ETH
1
50
·
--
$SOLV
{future}(SOLVUSDT)
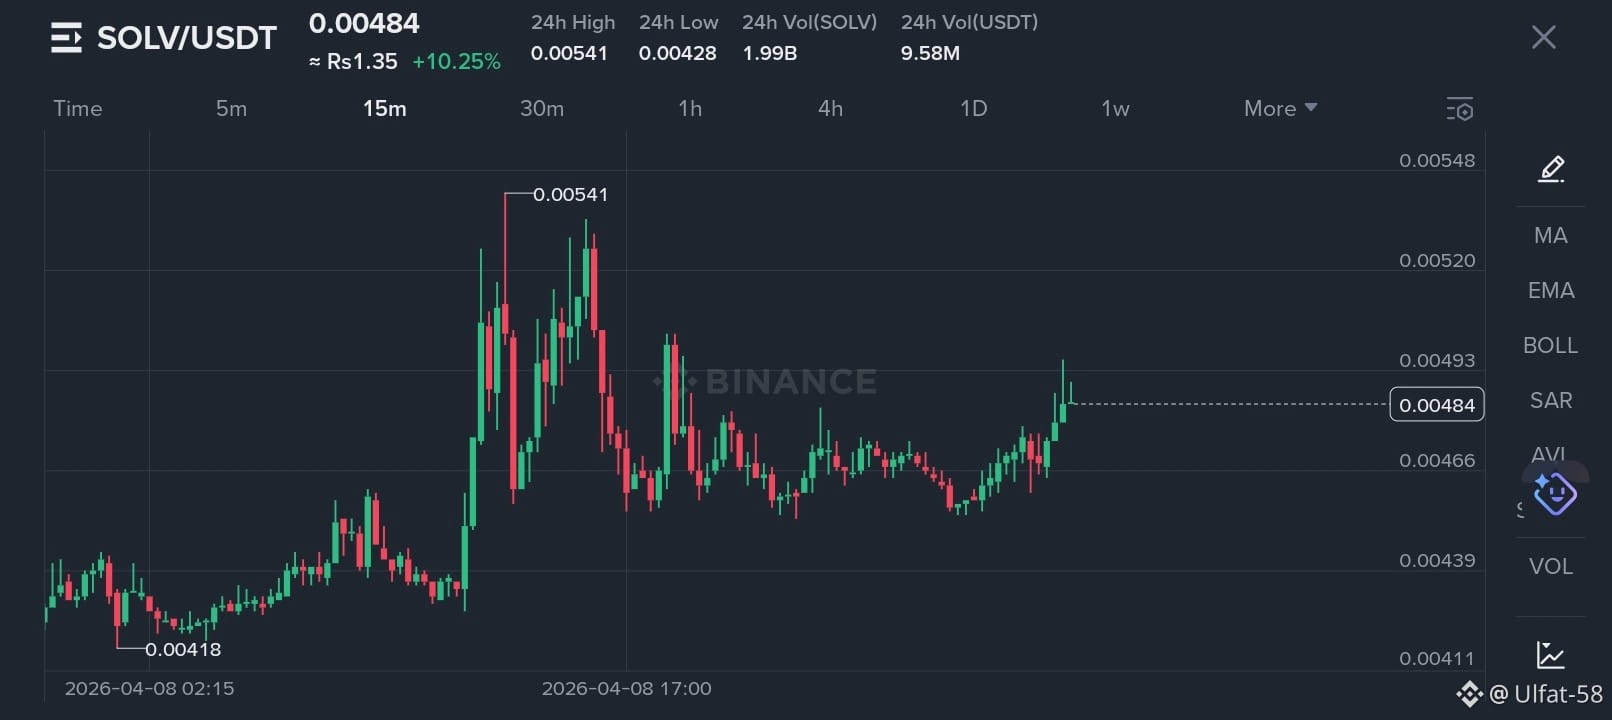
$SOLV /USDT - LONG (Aggressive Rebound)
Trade Plan:
Entry: 0.00465 – 0.00484
SL (Stop Loss): 0.00435
TP1: 0.00525
TP2: 0.00541 (Previous High)
TP3: 0.00580 (Major Resistance)
Why this setup?
Chart par ek V-shape recovery ke baad consolidation nazar aa rahi hai. Price ne 0.00418 par strong support banayi hai aur ab higher lows create kar rahi hai. 15m chart par price higher resistance levels (0.00541) ki taraf move karne ki koshish kar rahi hai. Volume expansion bullish side par zyada active hai, jo indicates karta hai ke buyers control le rahe hain.
#solvsusdt #btc70k #ETH #US&IranAgreedToATwo-weekCeasefire
$SOLV
$SOLV /USDT - LONG (Aggressive Rebound)
Trade Plan:
Entry: 0.00465 – 0.00484
SL (Stop Loss): 0.00435
TP1: 0.00525
TP2: 0.00541 (Previous High)
TP3: 0.00580 (Major Resistance)
Why this setup?
Chart par ek V-shape recovery ke baad consolidation nazar aa rahi hai. Price ne 0.00418 par strong support banayi hai aur ab higher lows create kar rahi hai. 15m chart par price higher resistance levels (0.00541) ki taraf move karne ki koshish kar rahi hai. Volume expansion bullish side par zyada active hai, jo indicates karta hai ke buyers control le rahe hain.
#solvsusdt #btc70k #ETH #US&IranAgreedToATwo-weekCeasefire
$SOLV /USDT - LONG (Aggressive Rebound)
Trade Plan:
Entry: 0.00465 – 0.00484
SL (Stop Loss): 0.00435
TP1: 0.00525
TP2: 0.00541 (Previous High)
TP3: 0.00580 (Major Resistance)
Why this setup?
Chart par ek V-shape recovery ke baad consolidation nazar aa rahi hai. Price ne 0.00418 par strong support banayi hai aur ab higher lows create kar rahi hai. 15m chart par price higher resistance levels (0.00541) ki taraf move karne ki koshish kar rahi hai. Volume expansion bullish side par zyada active hai, jo indicates karta hai ke buyers control le rahe hain.
#solvsusdt #btc70k #ETH #US&IranAgreedToATwo-weekCeasefire
1
16
·
--
$ENJ
{future}(ENJUSDT)
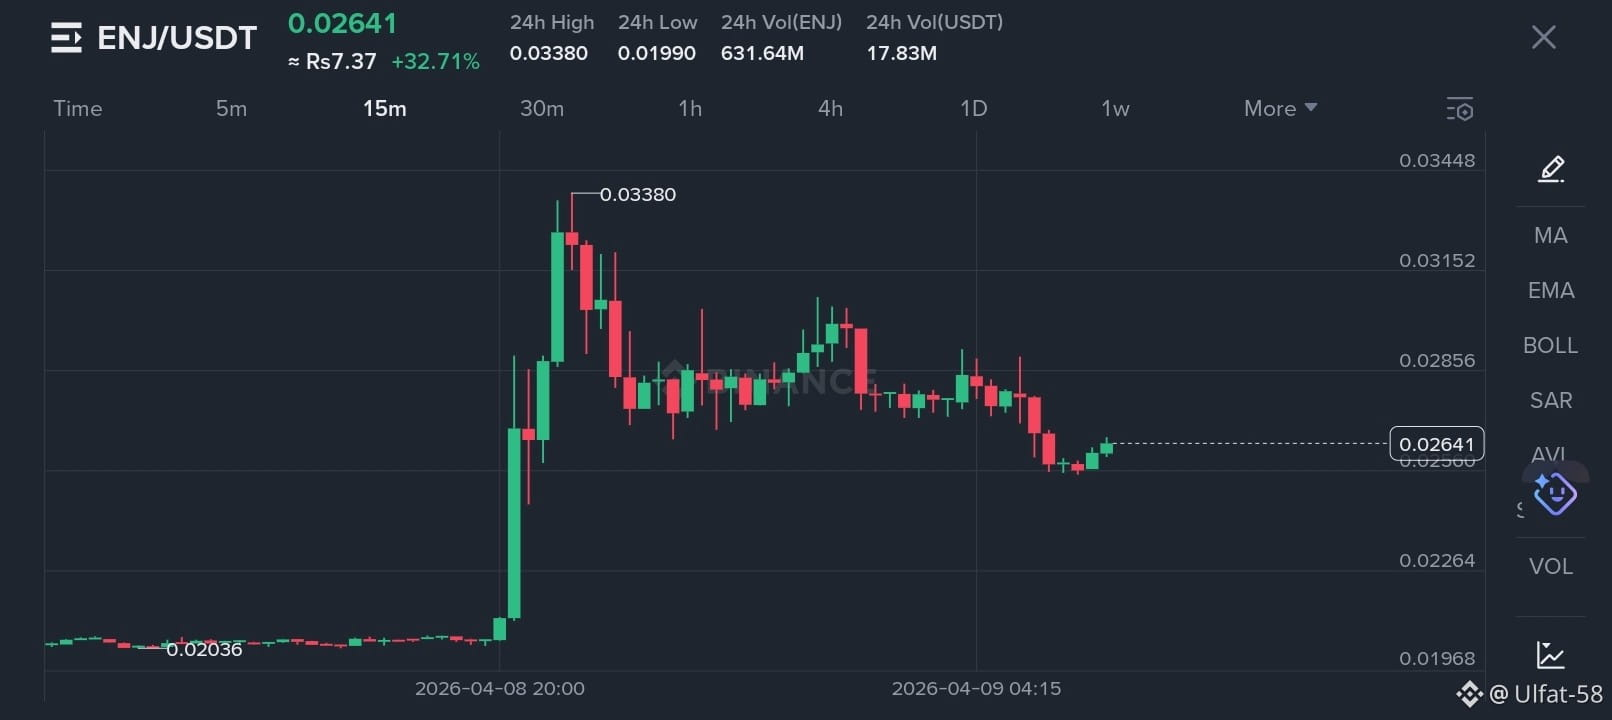
$ENJ /USDT – LONG (Scalp Opportunity)
Trade Plan:
Entry: 0.02641 – 0.02580
SL: 0.02490
TP1: 0.02850
TP2: 0.03150
TP3: 0.03380
Why this setup?
15m chart par price ne aik sharp vertical rally ke baad 0.03380 par top banaya aur ab wapis 0.026 ke support area par stabilize hone ki koshish kar rahi hai. Halankay thori correction ayi hai, lekin overall trend abhi bhi bullish bias rakhta hai jab tak price 0.025 se upar hold karti hai. RSI neutral zone mein hai, jo hint de raha hai ke agla move volume ane par dobara upside ho sakta hai.
#ENJ #btc #Xrp🔥🔥 #Ethereum
$ENJ
$ENJ /USDT – LONG (Scalp Opportunity)
Trade Plan:
Entry: 0.02641 – 0.02580
SL: 0.02490
TP1: 0.02850
TP2: 0.03150
TP3: 0.03380
Why this setup?
15m chart par price ne aik sharp vertical rally ke baad 0.03380 par top banaya aur ab wapis 0.026 ke support area par stabilize hone ki koshish kar rahi hai. Halankay thori correction ayi hai, lekin overall trend abhi bhi bullish bias rakhta hai jab tak price 0.025 se upar hold karti hai. RSI neutral zone mein hai, jo hint de raha hai ke agla move volume ane par dobara upside ho sakta hai.
#ENJ #btc #Xrp🔥🔥 #Ethereum
$ENJ /USDT – LONG (Scalp Opportunity)
Trade Plan:
Entry: 0.02641 – 0.02580
SL: 0.02490
TP1: 0.02850
TP2: 0.03150
TP3: 0.03380
Why this setup?
15m chart par price ne aik sharp vertical rally ke baad 0.03380 par top banaya aur ab wapis 0.026 ke support area par stabilize hone ki koshish kar rahi hai. Halankay thori correction ayi hai, lekin overall trend abhi bhi bullish bias rakhta hai jab tak price 0.025 se upar hold karti hai. RSI neutral zone mein hai, jo hint de raha hai ke agla move volume ane par dobara upside ho sakta hai.
#ENJ #btc #Xrp🔥🔥 #Ethereum
1
12
·
--
🚨🚨Breaking News 🇬🇧🇱🇾🇵🇰🚨🚨
🚨 BIG BREAKING: Global Relief! 🚨
Aik barri diplomatic kamyabi! US aur Iran 2-week ceasefire par razi ho gaye hain. 🕊️
✅ Strait of Hormuz mukammal tor par khul chuka hai.
✅ Israel ne bhi es ceasefire ki himayat kar di hai.
Option 2: Market & Crypto Focus (For Traders/Investors)
📈 Market Alert: Ceasefire Announced! 📉
Global tension mein kami! US, Iran, aur Israel ke darmiyan 2 hafte ki ceasefire ne markets mein nayi umeed paida kar di hai.
🚢 Impact: Strait of Hormuz ke khulne se oil prices aur global supply chain par bara asar paray ga.
💰 Crypto/Stocks: Market mein "Relief Rally" ke liye tayyar rahein!
Aap ke khayal mein es news ka Bitcoin aur Oil prices par kya asar hoga? Comment karein! 🚀
#CryptoTrading #MarketUpdate #OilPrices #EconomicNews #GlobalTrade
Option 3: Short & Engaging (For Instagram Reels/Threads)
Peace over Conflict? 🕊️
US & Iran: 2-Week Ceasefire ✅
Strait of Hormuz: Reopened 🚢
Israel: Agreed to terms 🤝
Dunya ke liye aik sakoon ka saans! Kya yeh 2 hafte agay barh kar mustaqil aman mein badal saktay hain? ✨
#BreakingNews #WorldPeace #Geopolitics #StraitOfHormuz #InternationalNews
🚨🚨Breaking News 🇬🇧🇱🇾🇵🇰🚨🚨
🚨 BIG BREAKING: Global Relief! 🚨
Aik barri diplomatic kamyabi! US aur Iran 2-week ceasefire par razi ho gaye hain. 🕊️
✅ Strait of Hormuz mukammal tor par khul chuka hai.
✅ Israel ne bhi es ceasefire ki himayat kar di hai.
Option 2: Market & Crypto Focus (For Traders/Investors)
📈 Market Alert: Ceasefire Announced! 📉
Global tension mein kami! US, Iran, aur Israel ke darmiyan 2 hafte ki ceasefire ne markets mein nayi umeed paida kar di hai.
🚢 Impact: Strait of Hormuz ke khulne se oil prices aur global supply chain par bara asar paray ga.
💰 Crypto/Stocks: Market mein "Relief Rally" ke liye tayyar rahein!
Aap ke khayal mein es news ka Bitcoin aur Oil prices par kya asar hoga? Comment karein! 🚀
#CryptoTrading #MarketUpdate #OilPrices #EconomicNews #GlobalTrade
Option 3: Short & Engaging (For Instagram Reels/Threads)
Peace over Conflict? 🕊️
US & Iran: 2-Week Ceasefire ✅
Strait of Hormuz: Reopened 🚢
Israel: Agreed to terms 🤝
Dunya ke liye aik sakoon ka saans! Kya yeh 2 hafte agay barh kar mustaqil aman mein badal saktay hain? ✨
#BreakingNews #WorldPeace #Geopolitics #StraitOfHormuz #InternationalNews
🚨 BIG BREAKING: Global Relief! 🚨
Aik barri diplomatic kamyabi! US aur Iran 2-week ceasefire par razi ho gaye hain. 🕊️
✅ Strait of Hormuz mukammal tor par khul chuka hai.
✅ Israel ne bhi es ceasefire ki himayat kar di hai.
Option 2: Market & Crypto Focus (For Traders/Investors)
📈 Market Alert: Ceasefire Announced! 📉
Global tension mein kami! US, Iran, aur Israel ke darmiyan 2 hafte ki ceasefire ne markets mein nayi umeed paida kar di hai.
🚢 Impact: Strait of Hormuz ke khulne se oil prices aur global supply chain par bara asar paray ga.
💰 Crypto/Stocks: Market mein "Relief Rally" ke liye tayyar rahein!
Aap ke khayal mein es news ka Bitcoin aur Oil prices par kya asar hoga? Comment karein! 🚀
#CryptoTrading #MarketUpdate #OilPrices #EconomicNews #GlobalTrade
Option 3: Short & Engaging (For Instagram Reels/Threads)
Peace over Conflict? 🕊️
US & Iran: 2-Week Ceasefire ✅
Strait of Hormuz: Reopened 🚢
Israel: Agreed to terms 🤝
Dunya ke liye aik sakoon ka saans! Kya yeh 2 hafte agay barh kar mustaqil aman mein badal saktay hain? ✨
#BreakingNews #WorldPeace #Geopolitics #StraitOfHormuz #InternationalNews

1
101
·
--
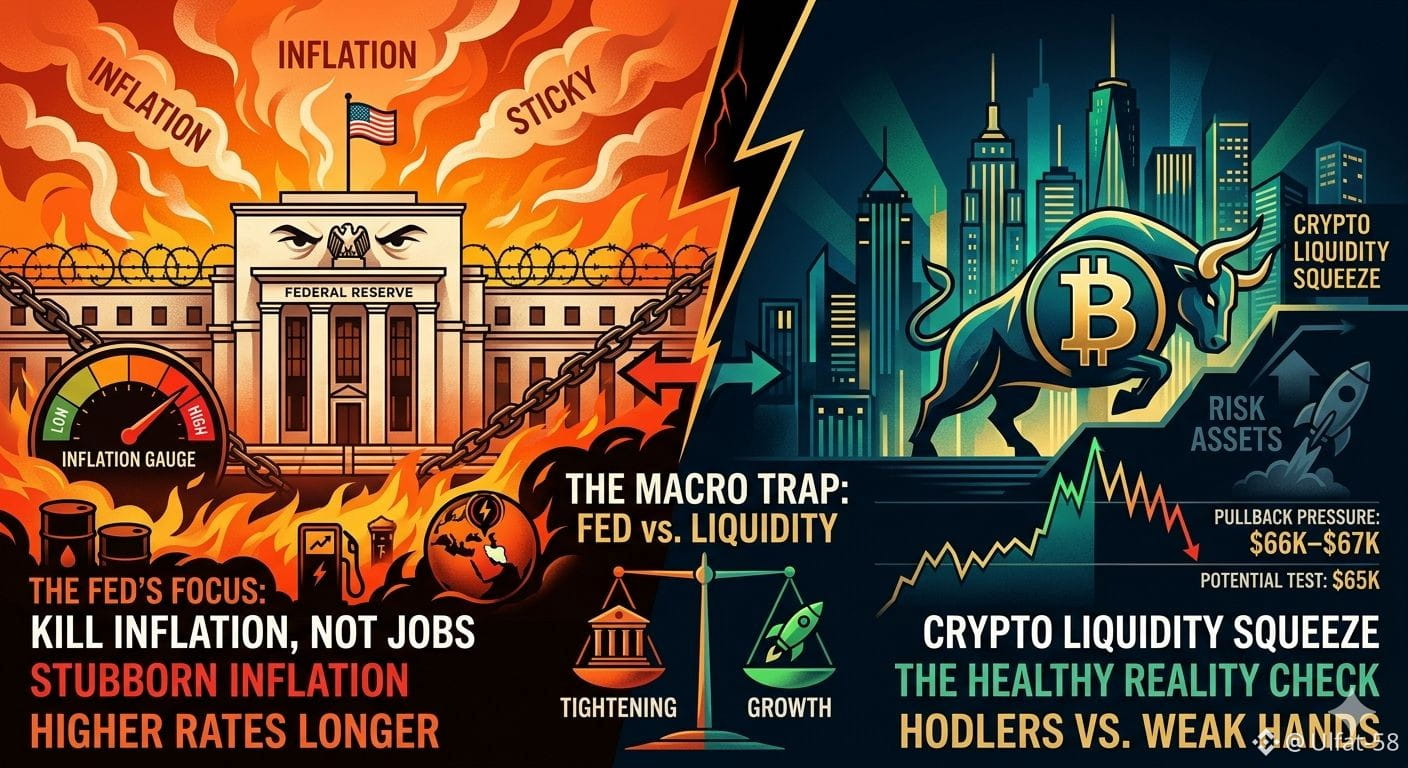
THE MACRO TRAP: FED vs. LIQUIDITY 📉🔥
Abhi market me euphoria tha, magar Reality Check ka waqt agaya hai. Fed officials (Hamack aur Goolsbee) ne saaf kar diya hai ke unka dushman Number 1 Employment nahi, balke Inflation hai.
Ho kya raha hai? Iran ki situation ki wajah se energy prices barh rahi hain, aur Fed ko lag raha hai ke inflation "sticky" ho chuki hai. Jab Fed "Tightening" ki baat karta hai, to iska seedha matlab hai: Risk assets (Crypto/Stocks) ke liye red flag.
My Analysis: The "Higher for Longer" Nightmare
Market umeed laga rahi thi ke rates jald kam honge, magar Fed ne thora thanda paani daal diya hai.
Narrative Shift: Growth se zyada focus ab inflation ko marne par hai.
Impact: Jab tak liquidity system me wapis nahi aati, BTC ko $70K+ sustain karne me mushkil hogi.
BTC Road Map (What to expect next):
The Correction Zone: Agar hawkish tone barkarar raha, to hum $65,500 – $66,800 ki range me aik "Healthy Pullback" dekh sakte hain. Yeh weak hands ko shake-out karne ka tarika hai.
The Bounce: Jab tak hum $64K ke upar hold kar rahe hain, structure bullish hai, magar abhi "Wait and Watch" ki game hai.
$BTC
{future}(BTCUSDT)
$XRP
{future}(XRPUSDT)
$ETH
{future}(ETHUSDT)
THE MACRO TRAP: FED vs. LIQUIDITY 📉🔥
Abhi market me euphoria tha, magar Reality Check ka waqt agaya hai. Fed officials (Hamack aur Goolsbee) ne saaf kar diya hai ke unka dushman Number 1 Employment nahi, balke Inflation hai.
Ho kya raha hai? Iran ki situation ki wajah se energy prices barh rahi hain, aur Fed ko lag raha hai ke inflation "sticky" ho chuki hai. Jab Fed "Tightening" ki baat karta hai, to iska seedha matlab hai: Risk assets (Crypto/Stocks) ke liye red flag.
My Analysis: The "Higher for Longer" Nightmare
Market umeed laga rahi thi ke rates jald kam honge, magar Fed ne thora thanda paani daal diya hai.
Narrative Shift: Growth se zyada focus ab inflation ko marne par hai.
Impact: Jab tak liquidity system me wapis nahi aati, BTC ko $70K+ sustain karne me mushkil hogi.
BTC Road Map (What to expect next):
The Correction Zone: Agar hawkish tone barkarar raha, to hum $65,500 – $66,800 ki range me aik "Healthy Pullback" dekh sakte hain. Yeh weak hands ko shake-out karne ka tarika hai.
The Bounce: Jab tak hum $64K ke upar hold kar rahe hain, structure bullish hai, magar abhi "Wait and Watch" ki game hai.
$BTC
$XRP
$ETH
Abhi market me euphoria tha, magar Reality Check ka waqt agaya hai. Fed officials (Hamack aur Goolsbee) ne saaf kar diya hai ke unka dushman Number 1 Employment nahi, balke Inflation hai.
Ho kya raha hai? Iran ki situation ki wajah se energy prices barh rahi hain, aur Fed ko lag raha hai ke inflation "sticky" ho chuki hai. Jab Fed "Tightening" ki baat karta hai, to iska seedha matlab hai: Risk assets (Crypto/Stocks) ke liye red flag.
My Analysis: The "Higher for Longer" Nightmare
Market umeed laga rahi thi ke rates jald kam honge, magar Fed ne thora thanda paani daal diya hai.
Narrative Shift: Growth se zyada focus ab inflation ko marne par hai.
Impact: Jab tak liquidity system me wapis nahi aati, BTC ko $70K+ sustain karne me mushkil hogi.
BTC Road Map (What to expect next):
The Correction Zone: Agar hawkish tone barkarar raha, to hum $65,500 – $66,800 ki range me aik "Healthy Pullback" dekh sakte hain. Yeh weak hands ko shake-out karne ka tarika hai.
The Bounce: Jab tak hum $64K ke upar hold kar rahe hain, structure bullish hai, magar abhi "Wait and Watch" ki game hai.
$BTC
$XRP
$ETH
1
79
·
--
$NOM
{future}(NOMUSDT)
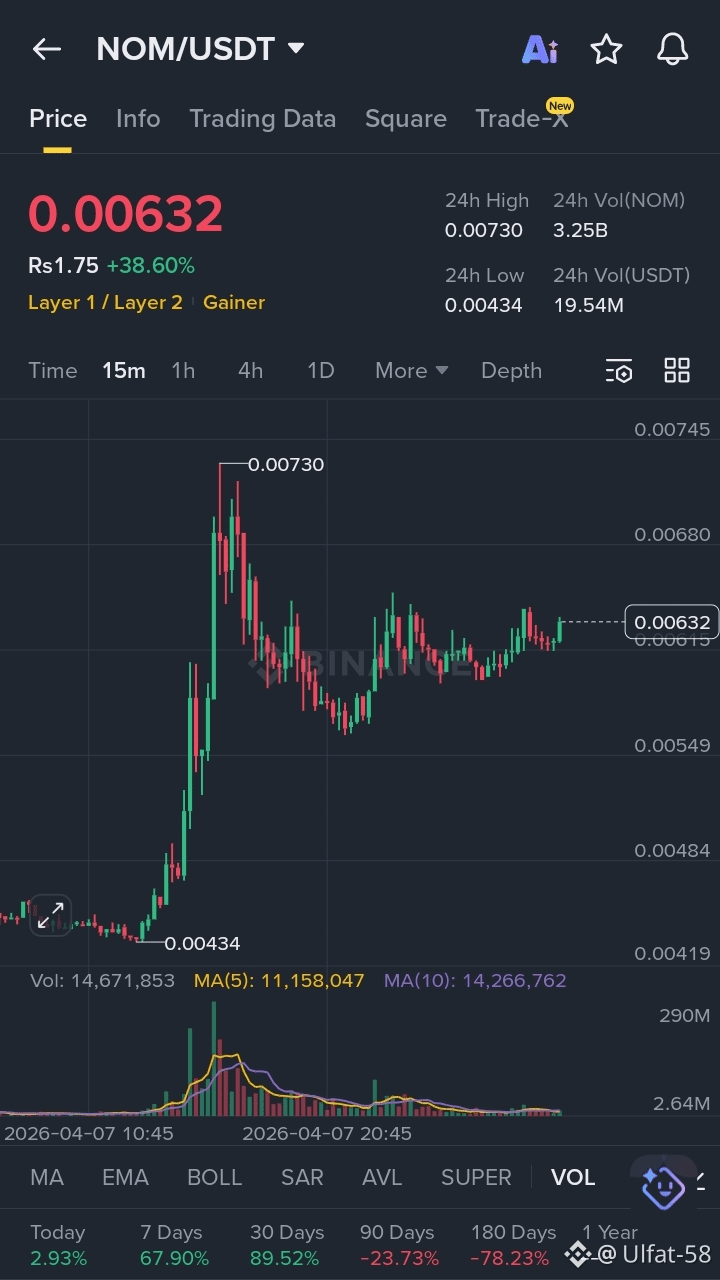
$NOM /USDT - LONG (Scalp)
Trade Plan:
Entry: $0.00615 – $0.00635
Stop Loss (SL): $0.00585 (Previous local support ke niche)
Target 1 (TP 1): $0.00680
Target 2 (TP 2): $0.00725
Target 3 (TP 3): $0.00780+ (Price discovery mode)
Why this setup?
Trend:
Chart par clear bullish momentum hai. Price ne $0.00730 ka high lagane ke baad "Higher Low" banaya hai ($0.00570 ke qareeb), jo upward trend ki nishani hai.
Volume Confirmation:
Breakout ke waqt volume bars kafi high thi, jo institutional interest show karti hain. Halanki ab volume thora kam hua hai, lekin price stability bullish consolidation ki taraf ishara kar rahi hai.
Moving Averages:
MA(5) aur MA(10) ke uper price ka trade karna short-term strength ko zahir karta hai.
Psychological Level: $0.00600 ka level ab ek mazboot support ke tor par kaam kar raha hai.
#Nomos #NOMUSDT #BTC☀ #Ethereum
$NOM
$NOM /USDT - LONG (Scalp)
Trade Plan:
Entry: $0.00615 – $0.00635
Stop Loss (SL): $0.00585 (Previous local support ke niche)
Target 1 (TP 1): $0.00680
Target 2 (TP 2): $0.00725
Target 3 (TP 3): $0.00780+ (Price discovery mode)
Why this setup?
Trend:
Chart par clear bullish momentum hai. Price ne $0.00730 ka high lagane ke baad "Higher Low" banaya hai ($0.00570 ke qareeb), jo upward trend ki nishani hai.
Volume Confirmation:
Breakout ke waqt volume bars kafi high thi, jo institutional interest show karti hain. Halanki ab volume thora kam hua hai, lekin price stability bullish consolidation ki taraf ishara kar rahi hai.
Moving Averages:
MA(5) aur MA(10) ke uper price ka trade karna short-term strength ko zahir karta hai.
Psychological Level: $0.00600 ka level ab ek mazboot support ke tor par kaam kar raha hai.
#Nomos #NOMUSDT #BTC☀ #Ethereum
$NOM /USDT - LONG (Scalp)
Trade Plan:
Entry: $0.00615 – $0.00635
Stop Loss (SL): $0.00585 (Previous local support ke niche)
Target 1 (TP 1): $0.00680
Target 2 (TP 2): $0.00725
Target 3 (TP 3): $0.00780+ (Price discovery mode)
Why this setup?
Trend:
Chart par clear bullish momentum hai. Price ne $0.00730 ka high lagane ke baad "Higher Low" banaya hai ($0.00570 ke qareeb), jo upward trend ki nishani hai.
Volume Confirmation:
Breakout ke waqt volume bars kafi high thi, jo institutional interest show karti hain. Halanki ab volume thora kam hua hai, lekin price stability bullish consolidation ki taraf ishara kar rahi hai.
Moving Averages:
MA(5) aur MA(10) ke uper price ka trade karna short-term strength ko zahir karta hai.
Psychological Level: $0.00600 ka level ab ek mazboot support ke tor par kaam kar raha hai.
#Nomos #NOMUSDT #BTC☀ #Ethereum
1
13
·
--
$JOE
{future}(JOEUSDT)
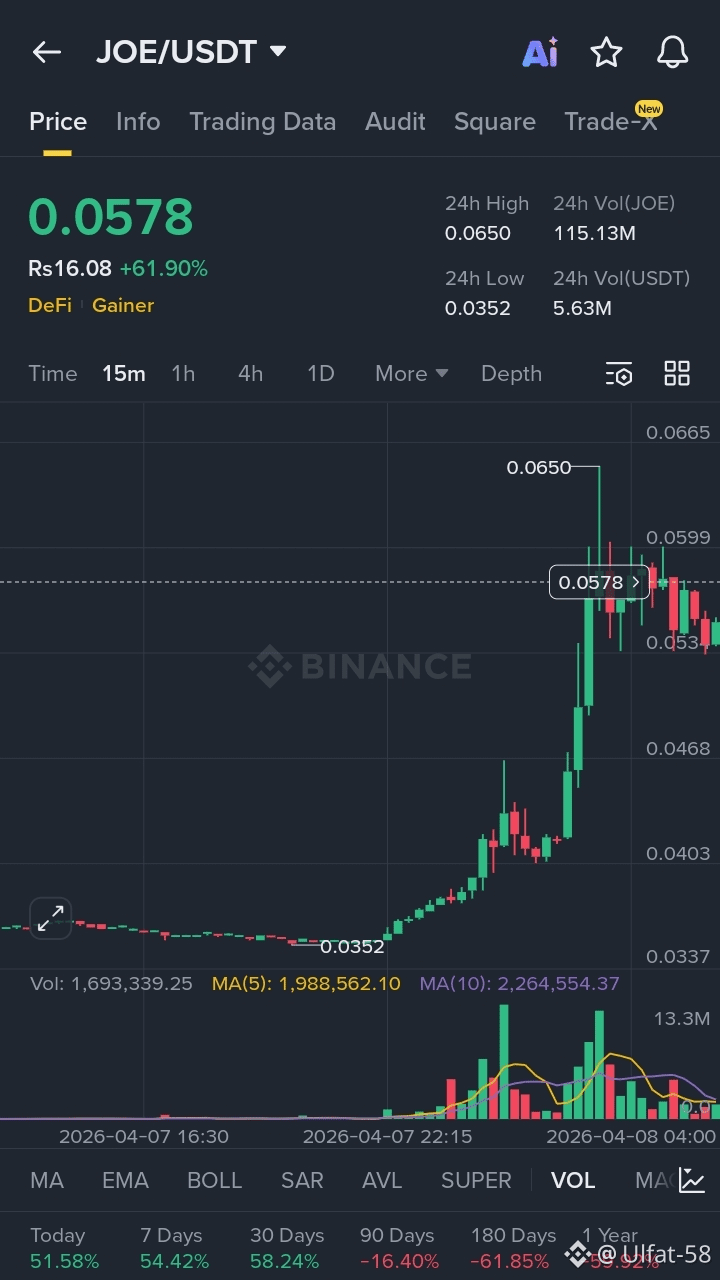
JOE /USDT - LONG (Trend Following)
Trade Plan:
Entry: 0.0545 – 0.0565 (Buy the dip near support)
Alternative Entry: 0.0605 (On a candle close above current consolidation)
Stop Loss (SL): 0.0515
Take Profit 1 (TP 1): 0.0645
Take Profit 2 (TP 2): 0.0690
Take Profit 3 (TP 3): 0.0750
Why this setup?
Momentum:
The 62% pump indicates massive buying pressure and high volume (114M JOE). Usually, such moves don't die instantly but provide a second leg up after a brief rest.
Support Level:
The 0.0520 – 0.0540 zone was a previous resistance-turned-support during the climb.
Consolidation:
The price is holding steady above 0.0550 despite the huge vertical move, showing that sellers aren't in control yet.
#JOE/USDT #BTC #xrp #bnb
$JOE
JOE /USDT - LONG (Trend Following)
Trade Plan:
Entry: 0.0545 – 0.0565 (Buy the dip near support)
Alternative Entry: 0.0605 (On a candle close above current consolidation)
Stop Loss (SL): 0.0515
Take Profit 1 (TP 1): 0.0645
Take Profit 2 (TP 2): 0.0690
Take Profit 3 (TP 3): 0.0750
Why this setup?
Momentum:
The 62% pump indicates massive buying pressure and high volume (114M JOE). Usually, such moves don't die instantly but provide a second leg up after a brief rest.
Support Level:
The 0.0520 – 0.0540 zone was a previous resistance-turned-support during the climb.
Consolidation:
The price is holding steady above 0.0550 despite the huge vertical move, showing that sellers aren't in control yet.
#JOE/USDT #BTC #xrp #bnb
JOE /USDT - LONG (Trend Following)
Trade Plan:
Entry: 0.0545 – 0.0565 (Buy the dip near support)
Alternative Entry: 0.0605 (On a candle close above current consolidation)
Stop Loss (SL): 0.0515
Take Profit 1 (TP 1): 0.0645
Take Profit 2 (TP 2): 0.0690
Take Profit 3 (TP 3): 0.0750
Why this setup?
Momentum:
The 62% pump indicates massive buying pressure and high volume (114M JOE). Usually, such moves don't die instantly but provide a second leg up after a brief rest.
Support Level:
The 0.0520 – 0.0540 zone was a previous resistance-turned-support during the climb.
Consolidation:
The price is holding steady above 0.0550 despite the huge vertical move, showing that sellers aren't in control yet.
#JOE/USDT #BTC #xrp #bnb
1
122
·
--
$KNC
{future}(KNCUSDT)
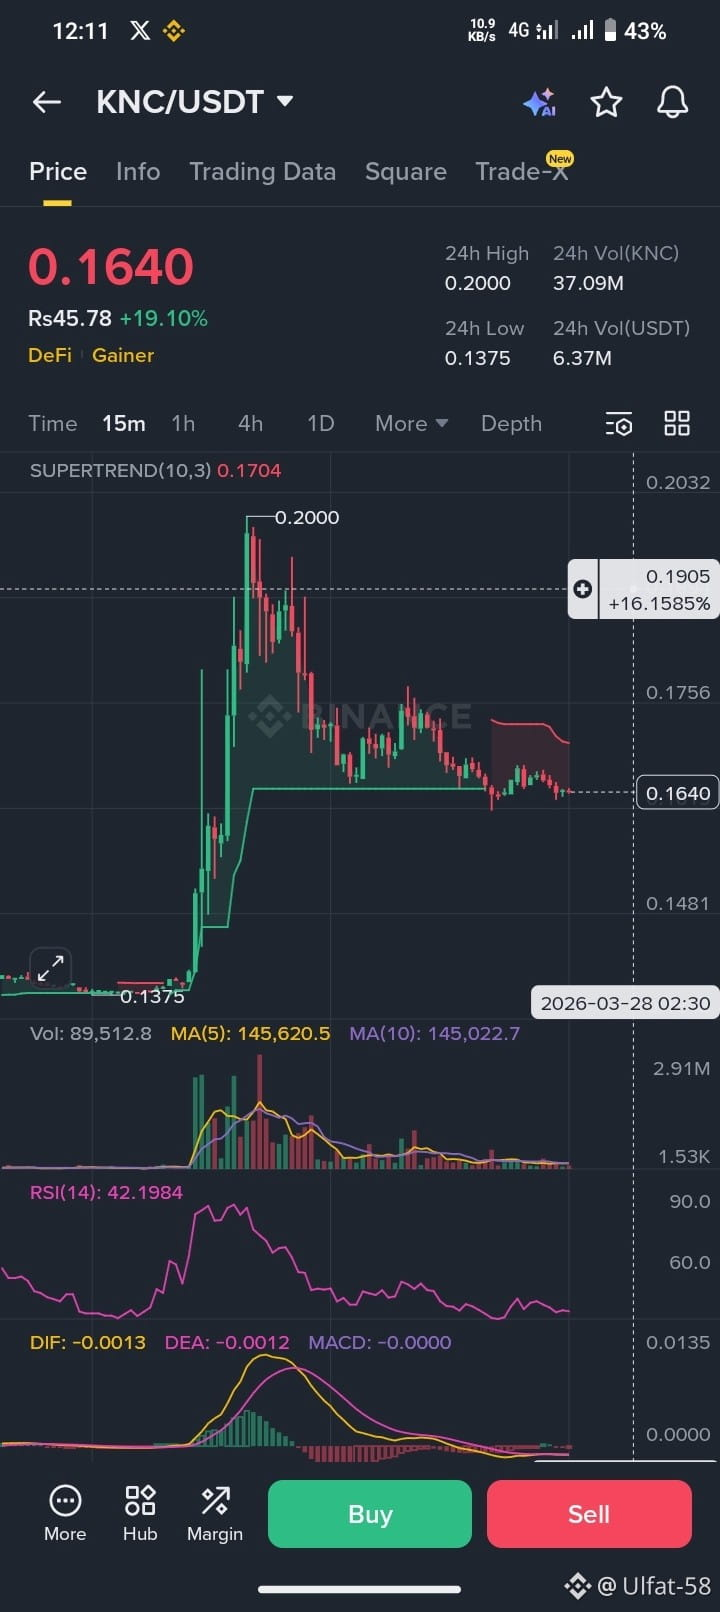
$KNC/USDT – SHORT
Trade Plan:
Entry: 0.1640 – 0.1685
SL (Stop Loss): 0.1756 (Previous resistance zone ke upar)
TP1: 0.1540
TP2: 0.1480
TP3: 0.1375 (Major support level)
Why this setup?
Momentum Loss: Price ne $0.2000 ka high hit karne ke baad sharp rejection li hai. Current price Supertrend ($0.1704) ke niche trade kar rahi hai, jo bearish trend ki nishani hai.
RSI Alert: RSI current 42 level par hai aur niche ki taraf move kar raha hai, jo ye dikhata hai ke buying pressure khatam ho chuka hai aur sellers control le rahe hain.
MACD Signal:
MACD lines niche cross kar chuki hain aur histogram red bar bana raha hai, jo price mazeed niche jane ka ishara hai.
Volume: Rejection ke waqt volume spike hua tha, jo ke bearish confirmation hai.
#BTC #knc #US5DayHalt #CLARITYActHitAnotherRoadblock #OilPricesDrop
$KNC
$KNC /USDT – SHORT
Trade Plan:
Entry: 0.1640 – 0.1685
SL (Stop Loss): 0.1756 (Previous resistance zone ke upar)
TP1: 0.1540
TP2: 0.1480
TP3: 0.1375 (Major support level)
Why this setup?
Momentum Loss: Price ne $0.2000 ka high hit karne ke baad sharp rejection li hai. Current price Supertrend ($0.1704) ke niche trade kar rahi hai, jo bearish trend ki nishani hai.
RSI Alert: RSI current 42 level par hai aur niche ki taraf move kar raha hai, jo ye dikhata hai ke buying pressure khatam ho chuka hai aur sellers control le rahe hain.
MACD Signal:
MACD lines niche cross kar chuki hain aur histogram red bar bana raha hai, jo price mazeed niche jane ka ishara hai.
Volume: Rejection ke waqt volume spike hua tha, jo ke bearish confirmation hai.
#BTC #knc #US5DayHalt #CLARITYActHitAnotherRoadblock #OilPricesDrop
$KNC /USDT – SHORT
Trade Plan:
Entry: 0.1640 – 0.1685
SL (Stop Loss): 0.1756 (Previous resistance zone ke upar)
TP1: 0.1540
TP2: 0.1480
TP3: 0.1375 (Major support level)
Why this setup?
Momentum Loss: Price ne $0.2000 ka high hit karne ke baad sharp rejection li hai. Current price Supertrend ($0.1704) ke niche trade kar rahi hai, jo bearish trend ki nishani hai.
RSI Alert: RSI current 42 level par hai aur niche ki taraf move kar raha hai, jo ye dikhata hai ke buying pressure khatam ho chuka hai aur sellers control le rahe hain.
MACD Signal:
MACD lines niche cross kar chuki hain aur histogram red bar bana raha hai, jo price mazeed niche jane ka ishara hai.
Volume: Rejection ke waqt volume spike hua tha, jo ke bearish confirmation hai.
#BTC #knc #US5DayHalt #CLARITYActHitAnotherRoadblock #OilPricesDrop
1
4
·
--
$USDC
{future}(USDCUSDT)
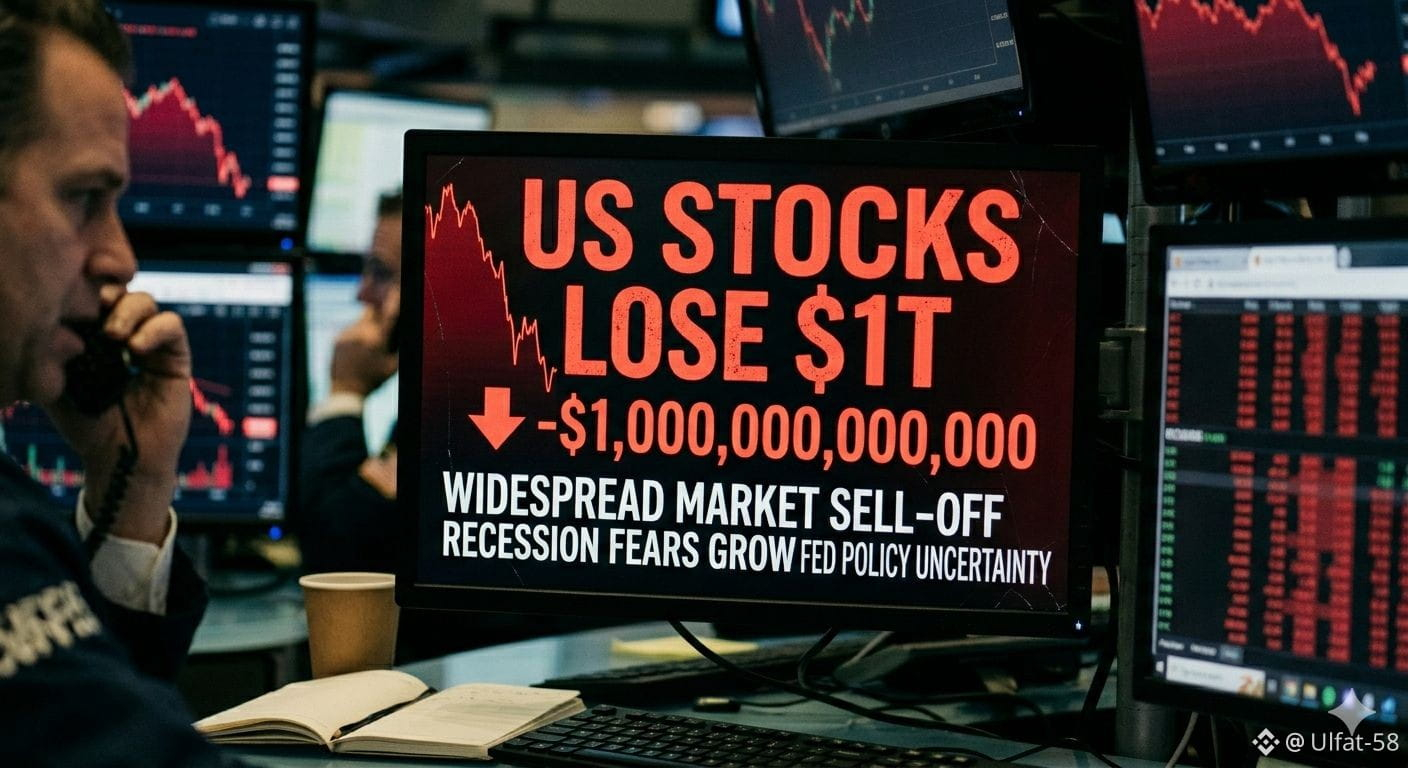
Wall Street Wipes Out $1 Trillion in Market Value in a Single Day as Economic Fears Grip Investors
Global financial markets were in disarray yesterday as US stocks suffered one of their worst single-day routs in recent history. A perfect storm of rising inflation data, central bank hawkishness, and growing concerns of an impending recession led to a dramatic sell-off, wiping an estimated $1 trillion off the value of the broader market indices.
The carnage was widespread and indiscriminate. The benchmark S&P 500 plummeted, recording its largest percentage drop since the darkest days of the 2020 pandemic crash. The blue-chip Dow Jones Industrial Average similarly collapsed, and the tech-heavy Nasdaq Composite bore the brunt of the technological sector’s correction, diving deep into negative territory.
The Catalyst: Inflation and the Fed
The primary catalyst for the market's sudden downturn appeared to be a hotter-than-expected Consumer Price Index (CPI) report. The latest figures showed inflation remaining stubbornly high, far exceeding consensus estimates and shattering hopes that inflationary pressures were peaking.
This data fueled aggressive speculation that the Federal Reserve will be forced to raise interest rates more aggressively and keep them higher for longer to cool down the overheated economy. For months, the market had held onto a tenuous hope of a "soft landing," where the Fed could tame inflation without tipping the economy into recession. Yesterday's wipeout suggests that this narrative has been significantly eroded. Rising rates increase borrowing costs for businesses and consumers, typically slowing economic activity and depressing corporate earnings.
#USstock #TrumpSaysIranWarHasBeenWon #BTC #US-IranTalks
$USDC
Wall Street Wipes Out $1 Trillion in Market Value in a Single Day as Economic Fears Grip Investors
Global financial markets were in disarray yesterday as US stocks suffered one of their worst single-day routs in recent history. A perfect storm of rising inflation data, central bank hawkishness, and growing concerns of an impending recession led to a dramatic sell-off, wiping an estimated $1 trillion off the value of the broader market indices.
The carnage was widespread and indiscriminate. The benchmark S&P 500 plummeted, recording its largest percentage drop since the darkest days of the 2020 pandemic crash. The blue-chip Dow Jones Industrial Average similarly collapsed, and the tech-heavy Nasdaq Composite bore the brunt of the technological sector’s correction, diving deep into negative territory.
The Catalyst: Inflation and the Fed
The primary catalyst for the market's sudden downturn appeared to be a hotter-than-expected Consumer Price Index (CPI) report. The latest figures showed inflation remaining stubbornly high, far exceeding consensus estimates and shattering hopes that inflationary pressures were peaking.
This data fueled aggressive speculation that the Federal Reserve will be forced to raise interest rates more aggressively and keep them higher for longer to cool down the overheated economy. For months, the market had held onto a tenuous hope of a "soft landing," where the Fed could tame inflation without tipping the economy into recession. Yesterday's wipeout suggests that this narrative has been significantly eroded. Rising rates increase borrowing costs for businesses and consumers, typically slowing economic activity and depressing corporate earnings.
#USstock #TrumpSaysIranWarHasBeenWon #BTC #US-IranTalks
Wall Street Wipes Out $1 Trillion in Market Value in a Single Day as Economic Fears Grip Investors
Global financial markets were in disarray yesterday as US stocks suffered one of their worst single-day routs in recent history. A perfect storm of rising inflation data, central bank hawkishness, and growing concerns of an impending recession led to a dramatic sell-off, wiping an estimated $1 trillion off the value of the broader market indices.
The carnage was widespread and indiscriminate. The benchmark S&P 500 plummeted, recording its largest percentage drop since the darkest days of the 2020 pandemic crash. The blue-chip Dow Jones Industrial Average similarly collapsed, and the tech-heavy Nasdaq Composite bore the brunt of the technological sector’s correction, diving deep into negative territory.
The Catalyst: Inflation and the Fed
The primary catalyst for the market's sudden downturn appeared to be a hotter-than-expected Consumer Price Index (CPI) report. The latest figures showed inflation remaining stubbornly high, far exceeding consensus estimates and shattering hopes that inflationary pressures were peaking.
This data fueled aggressive speculation that the Federal Reserve will be forced to raise interest rates more aggressively and keep them higher for longer to cool down the overheated economy. For months, the market had held onto a tenuous hope of a "soft landing," where the Fed could tame inflation without tipping the economy into recession. Yesterday's wipeout suggests that this narrative has been significantly eroded. Rising rates increase borrowing costs for businesses and consumers, typically slowing economic activity and depressing corporate earnings.
#USstock #TrumpSaysIranWarHasBeenWon #BTC #US-IranTalks
3
259
Log in to explore more content
Join global crypto users on Binance Square
⚡️ Get latest and useful information about crypto.
💬 Trusted by the world’s largest crypto exchange.
👍 Discover real insights from verified creators.
Email / Phone number
Trending Topics
NvidiaLoses$2.7TrillionInMonthAndAHalf
20,678 views
132 Discussing
Nvidia’s $2.7 Trillion Wipeout: When Narrative Overrides Numbers 📉
Crypto With Faisal
·7 Likes
·5.5k views
CanBTCReboundAfterFallingBelow60K?
775,094 views
3,003 Discussing
GlobalStocksFaceLongestLosingStreakSince2023
284,337 views
2,005 Discussing