

Crypto Insights 360
4.4k Posts

Crypto Insights 360
Report
Block User
Breaking Crypto News & Daily Market Analysis. Providing real-time updates and hidden gems you don't want to miss. Follow for daily Alpha! 💎
Frequent Trader
3.8 Years
4 Following
87 Followers
157 Liked
Posts
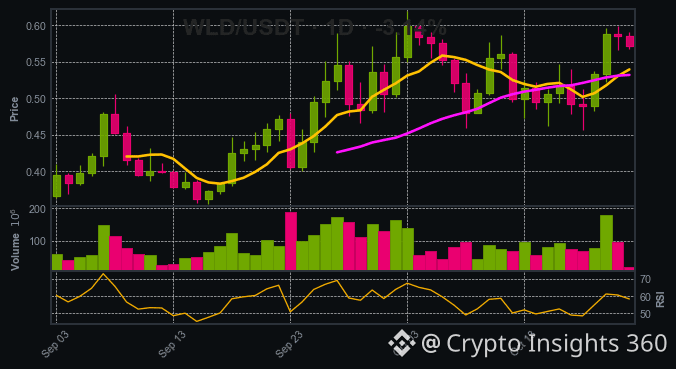
$WLD: Bull trap or accumulation zone? The price at 0.5707 sits comfortably above the 7‑ and 25‑day moving averages, signaling that the long bias still holds.
- 24h volume $53.8M shows healthy liquidity.
- Major market moves on BTC and ETH are still flowing into altcoins.
- Resistance at 0.6192, support near 0.4000.
- 10‑bar trend remains bullish; the last candle is a warning sign, not a reversal.
Entry target: 0.5750. Stop‑loss: 0.5400. Take‑profit: 0.6500.
Do you think the market will push past 0.6200 or pull back to the 0.570s? Share your thoughts.
$WLD : Bull trap or accumulation zone? The price at 0.5707 sits comfortably above the 7‑ and 25‑day moving averages, signaling that the long bias still holds.
- 24h volume $53.8M shows healthy liquidity.
- Major market moves on BTC and ETH are still flowing into altcoins.
- Resistance at 0.6192, support near 0.4000.
- 10‑bar trend remains bullish; the last candle is a warning sign, not a reversal.
Entry target: 0.5750. Stop‑loss: 0.5400. Take‑profit: 0.6500.
Do you think the market will push past 0.6200 or pull back to the 0.570s? Share your thoughts.
538
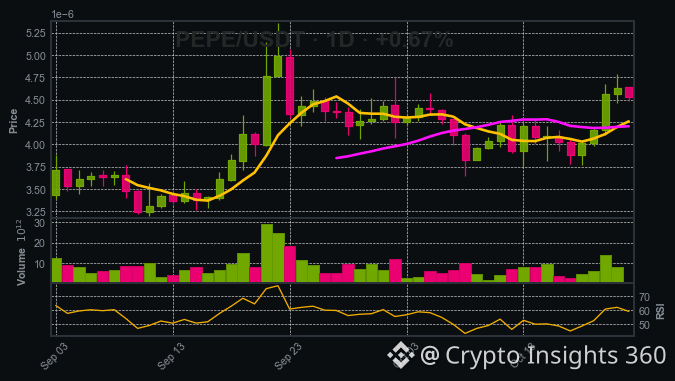
$PEPE: Bull trap or accumulation zone? Current price 4.53e-06, close to support 0.00000364 but far from resistance 0.00000507.
- 39M 24h volume and 1.87B market cap give the coin deep liquidity and room for a 5–6% move.
- Price is above SMA7 (4.26e-06) and SMA25 (4.20e-06) with SMA7 > SMA25, and the 10‑bar trend is bullish (bias LONG=4).
- Trade setup: entry 5.00e-06, SL 4.70e-06, TP 6.00e-06; swing high 12 signals next support near 4.70e-06.
Will you seize the next wave or let it slip?
$PEPE : Bull trap or accumulation zone? Current price 4.53e-06, close to support 0.00000364 but far from resistance 0.00000507.
- 39M 24h volume and 1.87B market cap give the coin deep liquidity and room for a 5–6% move.
- Price is above SMA7 (4.26e-06) and SMA25 (4.20e-06) with SMA7 > SMA25, and the 10‑bar trend is bullish (bias LONG=4).
- Trade setup: entry 5.00e-06, SL 4.70e-06, TP 6.00e-06; swing high 12 signals next support near 4.70e-06.
Will you seize the next wave or let it slip?
177
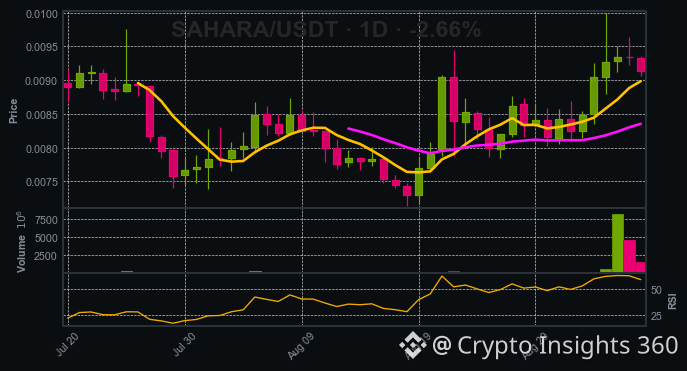
Just watched $SAHARA break its recent 10‑bar rally and pull back to 0.00914. The price is still 9.4% above SMA25, so the trend is still bullish. I’m buying at 0.00914 with a stop just below 0.0071 and aiming for 0.0100. If the upside continues, we could see a quick 10‑20% jump before the next swing. Don't miss the chance to catch the next wave.
Just watched $SAHARA break its recent 10‑bar rally and pull back to 0.00914. The price is still 9.4% above SMA25, so the trend is still bullish. I’m buying at 0.00914 with a stop just below 0.0071 and aiming for 0.0100. If the upside continues, we could see a quick 10‑20% jump before the next swing. Don't miss the chance to catch the next wave.
69
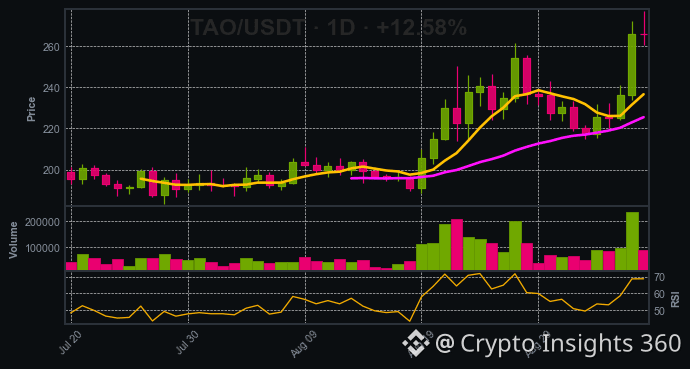
I’ve been watching $TAO for a while and the numbers are looking pretty sweet. At 265.8 the price is still 17.9% above its 25‑period SMA, and the 10‑bar trend is 100% bullish. Even though the last candle turned red, the overall bias is still LONG. So I’m buying around 265.8, putting my stop just below the support at 188.5, and I’m eyeing a take‑profit around 277.0—roughly a 4‑5% upside if it keeps the up‑trend. If you’re hungry for a high‑cap play with a healthy 12% move in the last 24h, this might be the moment. Let’s see if $TAO keeps rallying!
I’ve been watching $TAO for a while and the numbers are looking pretty sweet. At 265.8 the price is still 17.9% above its 25‑period SMA, and the 10‑bar trend is 100% bullish. Even though the last candle turned red, the overall bias is still LONG. So I’m buying around 265.8, putting my stop just below the support at 188.5, and I’m eyeing a take‑profit around 277.0—roughly a 4‑5% upside if it keeps the up‑trend. If you’re hungry for a high‑cap play with a healthy 12% move in the last 24h, this might be the moment. Let’s see if $TAO keeps rallying!
54
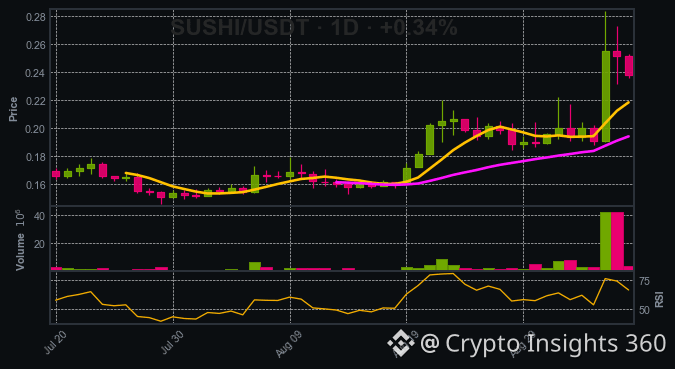
Hey fam, just spotted $SUSHI in a sweet uptrend. The price is sitting at 0.2379, already 22.7% above its 25‑period SMA, and the 7‑period SMA is higher than the 25‑period, so the trend looks solid. I’m planning to buy near 0.2379, set a stop‑loss below the key support at 0.1528, and aim for the resistance at 0.2838. It’s a classic pullback into a rally – time to ride the wave!
Hey fam, just spotted $SUSHI in a sweet uptrend. The price is sitting at 0.2379, already 22.7% above its 25‑period SMA, and the 7‑period SMA is higher than the 25‑period, so the trend looks solid. I’m planning to buy near 0.2379, set a stop‑loss below the key support at 0.1528, and aim for the resistance at 0.2838. It’s a classic pullback into a rally – time to ride the wave!
116
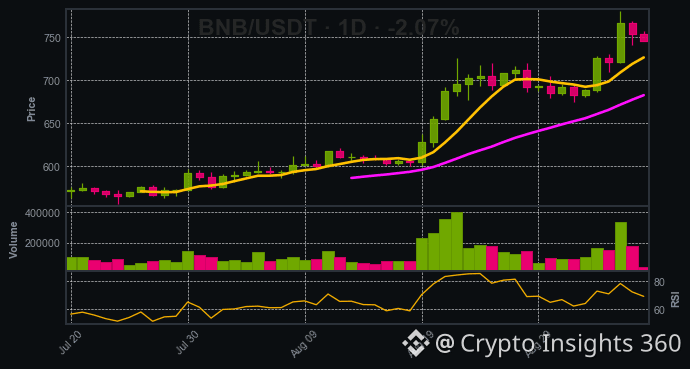
Alright, team, I’ve been staring at $BNB for a while now. The price is sitting at $745.25, just 9.2% above the SMA25 and even higher than the SMA7. The 10‑bar trend is still bullish and the chart bias score leans long—so I’m feeling confident. I’m buying around $745.25 with a stop set just below the support level of $597.32 and aiming for the resistance at $780.64. If the price pulls back, it will still be well above the SMA25 and I’ll still be in the green. Let’s see where this ride takes us!
Alright, team, I’ve been staring at $BNB for a while now. The price is sitting at $745.25, just 9.2% above the SMA25 and even higher than the SMA7. The 10‑bar trend is still bullish and the chart bias score leans long—so I’m feeling confident. I’m buying around $745.25 with a stop set just below the support level of $597.32 and aiming for the resistance at $780.64. If the price pulls back, it will still be well above the SMA25 and I’ll still be in the green. Let’s see where this ride takes us!
20
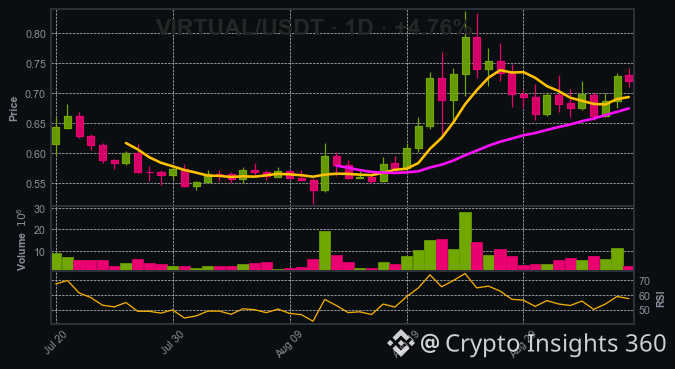
I’m watching $VIRTUAL and the chart is screaming bullish. The close sits comfortably above the 7‑day and 25‑day moving averages – 0.7199 vs 0.6929 and 0.6739 respectively – and those averages themselves are stacked with SMA7 above SMA25, confirming the trend. The 10‑bar trend is still bullish and the swing highs/lows show higher highs (14) and higher lows (11). Even though the last candle is bearish, the resistance at 0.8372 is still far ahead and the support remains solid at 0.5150…
I’m watching $VIRTUAL and the chart is screaming bullish. The close sits comfortably above the 7‑day and 25‑day moving averages – 0.7199 vs 0.6929 and 0.6739 respectively – and those averages themselves are stacked with SMA7 above SMA25, confirming the trend. The 10‑bar trend is still bullish and the swing highs/lows show higher highs (14) and higher lows (11). Even though the last candle is bearish, the resistance at 0.8372 is still far ahead and the support remains solid at 0.5150…
49
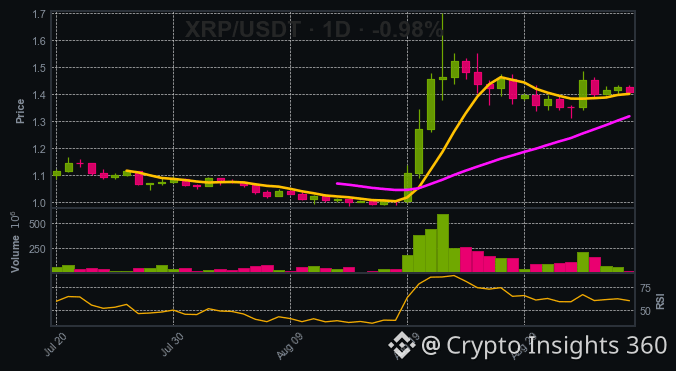
Right now $XRP is sitting nicely above both its 7‑day and 25‑day moving averages, which is a classic bullish signal. The 10‑bar trend is flat, but volume is rising, suggesting a potential breakout. With the price trading between a solid support at 0.9862 and a resistance at 1.6999, I’m looking to go long at the current 1.4075 price, set a stop just below the key support around 0.95, and aim for the 1.70 resistance as a first target. If the price keeps pushing up, I’ll consider a partial profit at 1.60 and let the rest run. This setup gives a solid risk‑to‑reward ratio and…
Right now $XRP is sitting nicely above both its 7‑day and 25‑day moving averages, which is a classic bullish signal. The 10‑bar trend is flat, but volume is rising, suggesting a potential breakout. With the price trading between a solid support at 0.9862 and a resistance at 1.6999, I’m looking to go long at the current 1.4075 price, set a stop just below the key support around 0.95, and aim for the 1.70 resistance as a first target. If the price keeps pushing up, I’ll consider a partial profit at 1.60 and let the rest run. This setup gives a solid risk‑to‑reward ratio and…
39
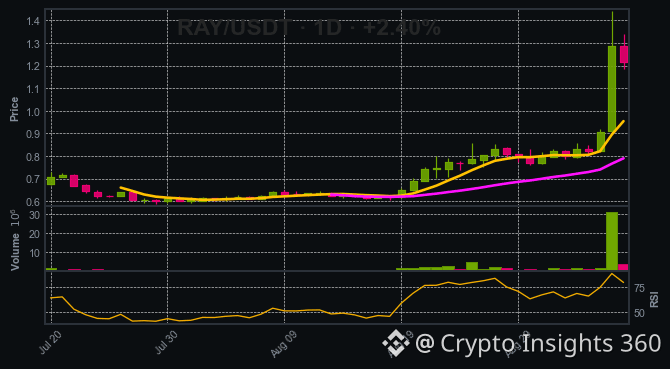
Hey fam, let’s dive into $RAY. The price is hovering at 1.2133, which is a good entry point right now. We’re looking at a classic setup: the 7‑period SMA sits at 0.9541, the 25‑period at 0.7896, and the current close is comfortably above both, signaling that the bulls are still in control. The 10‑bar trend is bullish, and the recent swing highs and lows show a higher‑higher pattern, so the overall bias leans LONG.
…
Hey fam, let’s dive into $RAY . The price is hovering at 1.2133, which is a good entry point right now. We’re looking at a classic setup: the 7‑period SMA sits at 0.9541, the 25‑period at 0.7896, and the current close is comfortably above both, signaling that the bulls are still in control. The 10‑bar trend is bullish, and the recent swing highs and lows show a higher‑higher pattern, so the overall bias leans LONG.
…
…
36
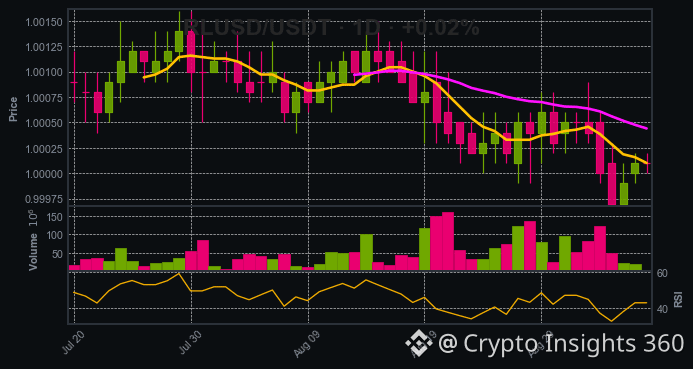
We’re at $1.0001 on $RLUSD and the chart is telling us a story of stalled upside. The 7‑day SMA sits just below the price while the 25‑day SMA is higher—classic confirmation of a short bias. The last candle closed bearish and the price is right on the 1.00 resistance that it just rejected. Support is sitting at 0.9997, so a drop past that level would confirm a downtrend. That’s why I’m looking to sell around 1.0001, set a stop just below 0.9997 to protect the trade, and aim for a target near 1.0015. With the volume flat or falling, the move should stay tight until the pric…
We’re at $1.0001 on $RLUSD and the chart is telling us a story of stalled upside. The 7‑day SMA sits just below the price while the 25‑day SMA is higher—classic confirmation of a short bias. The last candle closed bearish and the price is right on the 1.00 resistance that it just rejected. Support is sitting at 0.9997, so a drop past that level would confirm a downtrend. That’s why I’m looking to sell around 1.0001, set a stop just below 0.9997 to protect the trade, and aim for a target near 1.0015. With the volume flat or falling, the move should stay tight until the pric…
49
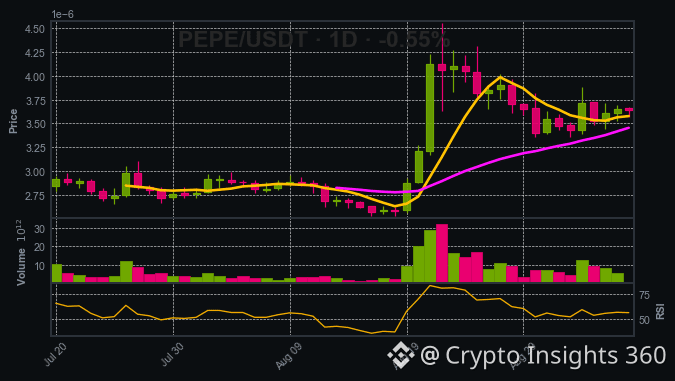
Everyone’s calling $PEPE a bubble that’s about to pop, but the chart is telling a different story. The price sits just above the 7‑day SMA and the 10‑bar trend is flat, a classic setup for a breakout. I’m buying at 3.64e‑06, setting my stop just below the 2.53e‑06 support, and aiming for the 4.56e‑06 resistance. If the trend holds, we could see a swift move up – let’s see if the market finally follows the data.
Everyone’s calling $PEPE a bubble that’s about to pop, but the chart is telling a different story. The price sits just above the 7‑day SMA and the 10‑bar trend is flat, a classic setup for a breakout. I’m buying at 3.64e‑06, setting my stop just below the 2.53e‑06 support, and aiming for the 4.56e‑06 resistance. If the trend holds, we could see a swift move up – let’s see if the market finally follows the data.
94
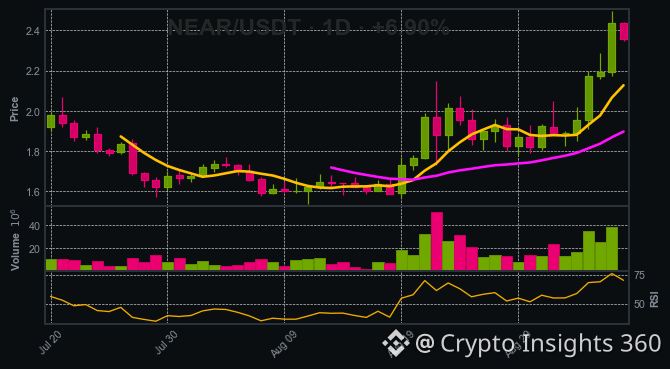
Watching $NEAR at $2.355, the price is already 24.2% above its 25‑day SMA—an overextended rally but still firmly in an uptrend. With a bullish 10‑bar pattern and high swing highs, I’m targeting a quick move to the 2.498 resistance level. I’ll enter around $2.355, set my stop just below the 1.538 support, and aim for a 2.498 take‑profit. Will this rally keep climbing or will it hit that ceiling?
Watching $NEAR at $2.355, the price is already 24.2% above its 25‑day SMA—an overextended rally but still firmly in an uptrend. With a bullish 10‑bar pattern and high swing highs, I’m targeting a quick move to the 2.498 resistance level. I’ll enter around $2.355, set my stop just below the 1.538 support, and aim for a 2.498 take‑profit. Will this rally keep climbing or will it hit that ceiling?
144
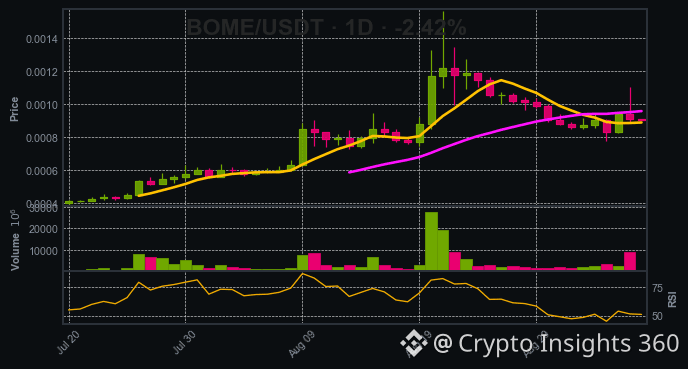
- The price is already below the 25‑period SMA and the 7‑period SMA is under the 25‑period SMA, a classic sign of a bearish momentum.
- The 10‑bar trend is bearish, swing highs are falling (HH=10) while swing lows are rising (LL=14), and the latest candle confirms the downtrend.
- Volume has been on the rise for the last 5 bars, meaning the sell pressure is increasing, and the price is far from the support at 0.00062230.
…
- The 10‑bar trend is bearish, swing highs are falling (HH=10) while swing lows are rising (LL=14), and the latest candle confirms the downtrend.
- Volume has been on the rise for the last 5 bars, meaning the sell pressure is increasing, and the price is far from the support at 0.00062230.
…
219
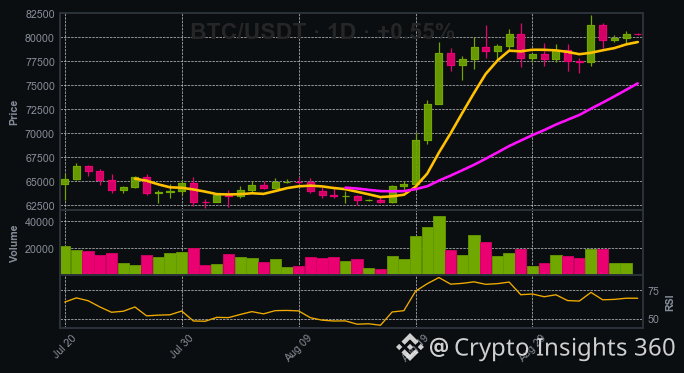
BTC’s chart is a textbook uptrend: closing above the 7‑day and 25‑day SMAs, 10‑bar bullish streak, higher highs, yet the last candle was bearish. Buying around 80340.01 with a stop below 62535.2400 and targeting 82300.0000 feels solid—can you spot any hidden traps that might push it back?
BTC’s chart is a textbook uptrend: closing above the 7‑day and 25‑day SMAs, 10‑bar bullish streak, higher highs, yet the last candle was bearish. Buying around 80340.01 with a stop below 62535.2400 and targeting 82300.0000 feels solid—can you spot any hidden traps that might push it back?
119
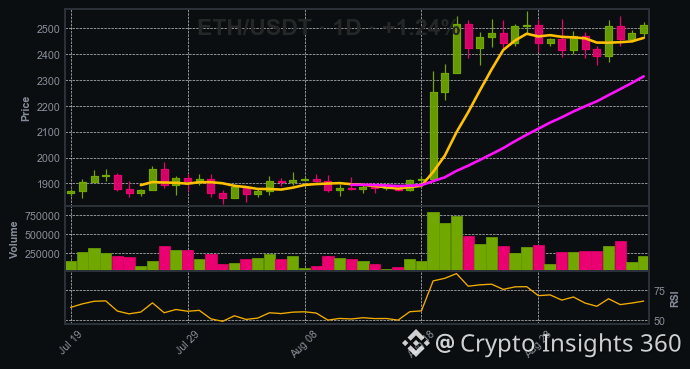
Alright, folks, I'm pulling a $ETH trade today. The chart is screaming up: price is 2510.1, sitting 8.5% above the SMA25, and the SMA7 is above SMA25, confirming a 10‑bar bullish streak. Volume's flat, but the bias score still leans strongly LONG. I’m entering around 2510.1, placing a stop just below the 1853.6200 support, and setting a take‑profit at 2566.5300. If the rally keeps going, we could hit that resistance before the next correction. Keep an eye on those swing highs—this could be the start of a fresh move. Stay sharp and happy trading!
Alright, folks, I'm pulling a $ETH trade today. The chart is screaming up: price is 2510.1, sitting 8.5% above the SMA25, and the SMA7 is above SMA25, confirming a 10‑bar bullish streak. Volume's flat, but the bias score still leans strongly LONG. I’m entering around 2510.1, placing a stop just below the 1853.6200 support, and setting a take‑profit at 2566.5300. If the rally keeps going, we could hit that resistance before the next correction. Keep an eye on those swing highs—this could be the start of a fresh move. Stay sharp and happy trading!
24
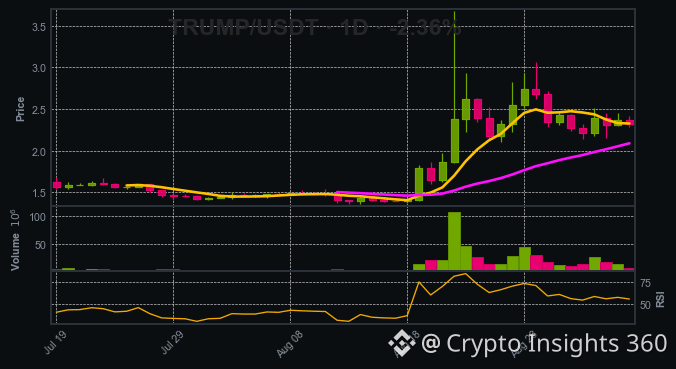
Price is stuck in a bearish zone – 2.316 sits just below SMA7 while still over SMA25, and the 10‑bar trend remains negative. With flat volume and no support near 1.3650, a short looks clean. I’d sell around 2.316, place a stop just above 2.40, and target 1.3650. Will this bearish streak continue?
Price is stuck in a bearish zone – 2.316 sits just below SMA7 while still over SMA25, and the 10‑bar trend remains negative. With flat volume and no support near 1.3650, a short looks clean. I’d sell around 2.316, place a stop just above 2.40, and target 1.3650. Will this bearish streak continue?
95
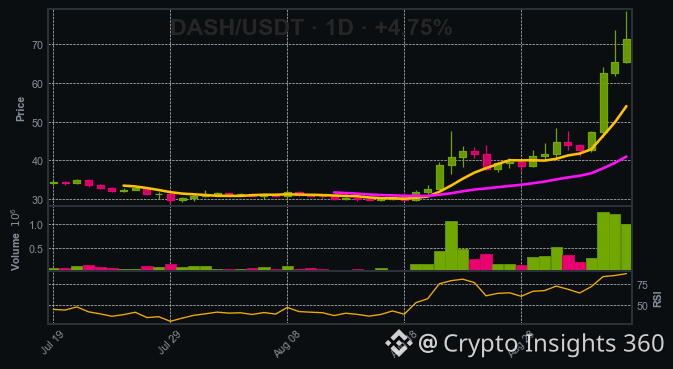
DASH is smashing through its 25‑period SMA, trading at $71.44 and backed by a 10‑bar bullish streak and higher 5‑bar volume—momentum is looking solid. Buying at 71.44, set a stop below the support at $29.50, and aim for the next resistance at $78.68. With a 4.75% 24‑hour gain, this could be a sweet ride. Are you ready to jump in?
DASH is smashing through its 25‑period SMA, trading at $71.44 and backed by a 10‑bar bullish streak and higher 5‑bar volume—momentum is looking solid. Buying at 71.44, set a stop below the support at $29.50, and aim for the next resistance at $78.68. With a 4.75% 24‑hour gain, this could be a sweet ride. Are you ready to jump in?
107
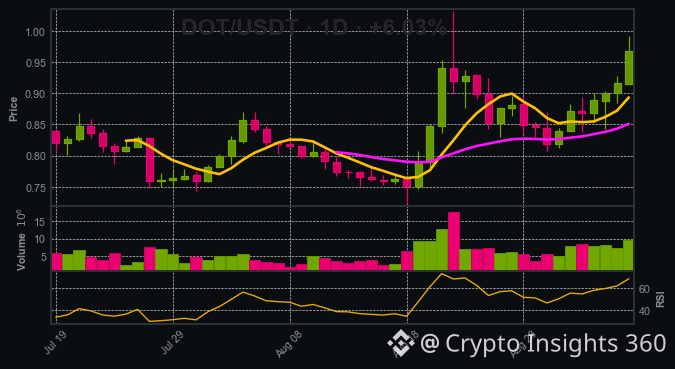
Hey crew, just spotted a solid setup on $DOT. The chart’s telling me we’re in a clear uptrend – price is 13.6% above the 25‑day SMA, and volume’s on the rise. I’m putting a buy around 0.967, stop‑loss just below the 0.723 support, and aiming for 1.032. If we hit that, it’s a 6‑to‑1 risk‑reward. Keep an eye on the 1.03 resistance; if it holds, we could be looking at another rally. Stay sharp!
Hey crew, just spotted a solid setup on $DOT . The chart’s telling me we’re in a clear uptrend – price is 13.6% above the 25‑day SMA, and volume’s on the rise. I’m putting a buy around 0.967, stop‑loss just below the 0.723 support, and aiming for 1.032. If we hit that, it’s a 6‑to‑1 risk‑reward. Keep an eye on the 1.03 resistance; if it holds, we could be looking at another rally. Stay sharp!
48
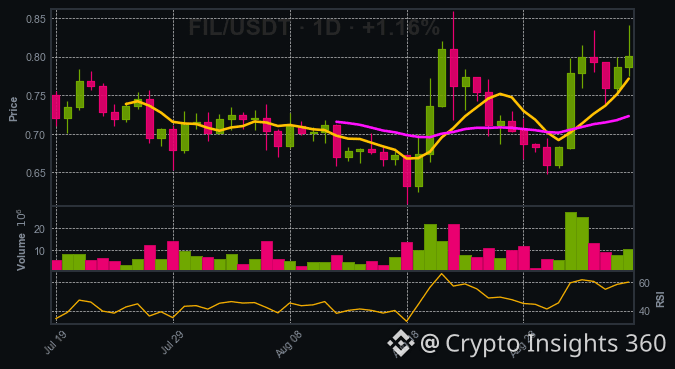
Most people are saying $FIL is overextended and will drop. I disagree. The price is 0.8006, solidly above both the 7‑ and 25‑period SMAs, and volume is rising. I'm buying around 0.8006 with a stop just below 0.6095 and aiming for 0.8595. If the trend keeps going, this could be a clean move. Watch for the next swing high; if it holds, the rally could be far from finished.
Most people are saying $FIL is overextended and will drop. I disagree. The price is 0.8006, solidly above both the 7‑ and 25‑period SMAs, and volume is rising. I'm buying around 0.8006 with a stop just below 0.6095 and aiming for 0.8595. If the trend keeps going, this could be a clean move. Watch for the next swing high; if it holds, the rally could be far from finished.
200
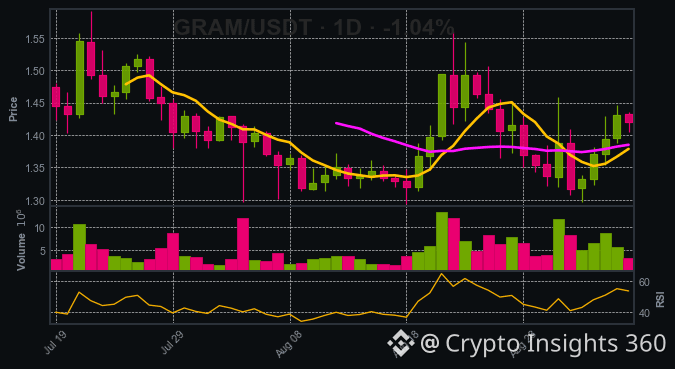
- The 10‑bar trend is bullish and the price is above both SMA7 and SMA25 – a classic sign that $GRAM is ready to move higher.
- A bearish candle just pulled back to 1.42; the support at 1.2940 holds firm, making 1.42 a sweet entry point.
- Resistance sits at 1.5600, giving us a clear target – buying at 1.42 with a stop below 1.2940 and aiming for 1.5600 is a tight, high-probability play.
- A bearish candle just pulled back to 1.42; the support at 1.2940 holds firm, making 1.42 a sweet entry point.
- Resistance sits at 1.5600, giving us a clear target – buying at 1.42 with a stop below 1.2940 and aiming for 1.5600 is a tight, high-probability play.
206
Log in to explore more content
Join global crypto users on Binance Square
⚡️ Get latest and useful information about crypto.
💬 Trusted by the world’s largest crypto exchange.
👍 Discover real insights from verified creators.
Email / Phone number
Trending Topics
BinanceSAFUFundTransferCompleted7499BTC
19,043 views
532 Discussing
Binance Says SAFU Fund Transfer Completed, Covering 7,499 BTC
Binance News
·21 Likes
·8k views
BinanceRecovery90% of stolen assets
79,652 views
140 Discussing
YiHe:ProofOfReserves:10TokensAt100%Backing
99,617 views
603 Discussing