

ApexDesk
338 Posts

ApexDesk
Report
Block User
📊 ApexDesk: Crypto market structure & disciplined execution 🎯 Actionable setups, multi-timeframe TA & liquidity tracking 📈 Capital defense first
Frequent Trader
1.5 Years
109 Following
129 Followers
305 Liked
Posts
All
Quotes
Videos
·
--
Bearish
Congratulations to everyone who took our $Q short call—massive profits booked as price dumped straight from $0.21 down to $0.14! 📉🎯💰🔥
#TradingCommunity
{future}(QUSDT)
$Q #q
Congratulations to everyone who took our $Q short call—massive profits booked as price dumped straight from $0.21 down to $0.14! 📉🎯💰🔥
#TradingCommunity
$Q #q
#TradingCommunity
$Q #q
1
2
1.4k
·
--
Bearish
$Q what about this, short or long? 🤔💭
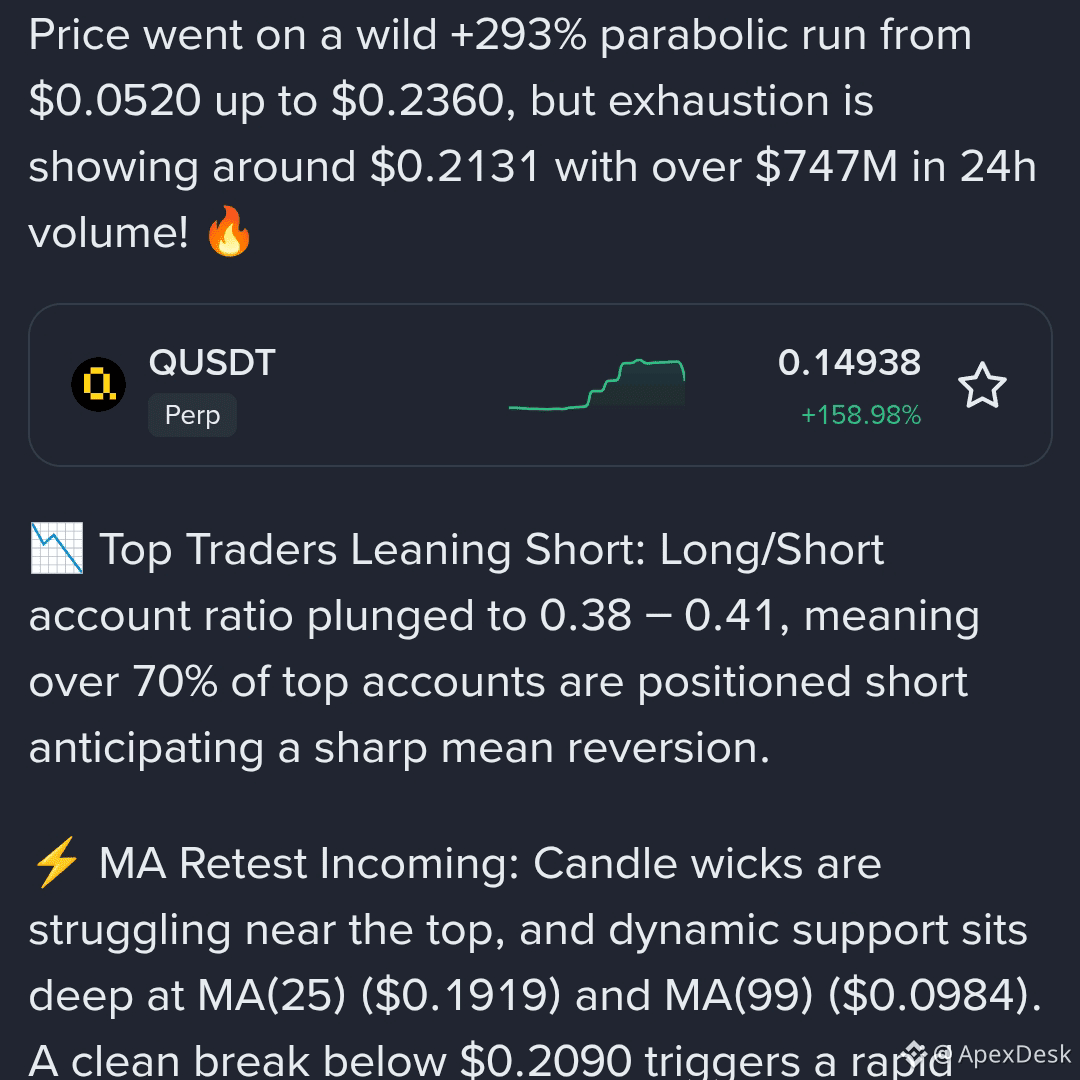
Price went on a wild +293% parabolic run from $0.0520 up to $0.2360, but exhaustion is showing around $0.2131 with over $747M in 24h volume! 🔥
{future}(QUSDT)
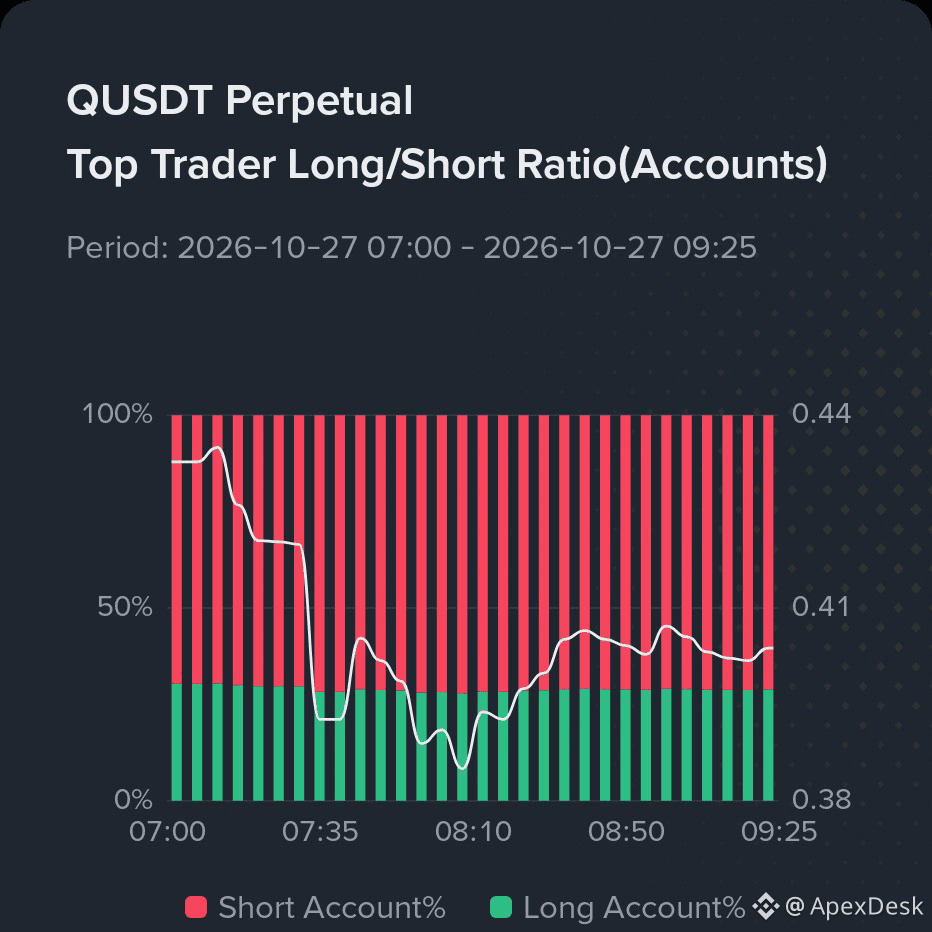
📉 Top Traders Leaning Short: Long/Short account ratio plunged to 0.38 – 0.41, meaning over 70% of top accounts are positioned short anticipating a sharp mean reversion.
⚡ MA Retest Incoming: Candle wicks are struggling near the top, and dynamic support sits deep at MA(25) ($0.1919) and MA(99) ($0.0984). A clean break below $0.2090 triggers a rapid cool-off.
Meanwhile, keep a close eye on $BTW as it attempts to carve out a recovery floor after that heavy dip from $1.68 👀📈.
Are you opening a short on $Q here, or betting on another pump past $0.24? Drop your call below! 👇🔥
{future}(BTWUSDT)
#QUSDT
#BTW
#BİNANCEFUTURES
#CryptoTrading.
$Q what about this, short or long? 🤔💭
Price went on a wild +293% parabolic run from $0.0520 up to $0.2360, but exhaustion is showing around $0.2131 with over $747M in 24h volume! 🔥
📉 Top Traders Leaning Short: Long/Short account ratio plunged to 0.38 – 0.41, meaning over 70% of top accounts are positioned short anticipating a sharp mean reversion.
⚡ MA Retest Incoming: Candle wicks are struggling near the top, and dynamic support sits deep at MA(25) ($0.1919) and MA(99) ($0.0984). A clean break below $0.2090 triggers a rapid cool-off.
Meanwhile, keep a close eye on $BTW as it attempts to carve out a recovery floor after that heavy dip from $1.68 👀📈.
Are you opening a short on $Q here, or betting on another pump past $0.24? Drop your call below! 👇🔥
#QUSDT
#BTW
#BİNANCEFUTURES
#CryptoTrading.
533
·
--
Bullish
$TSLA what about this, short or long? 🤔💭
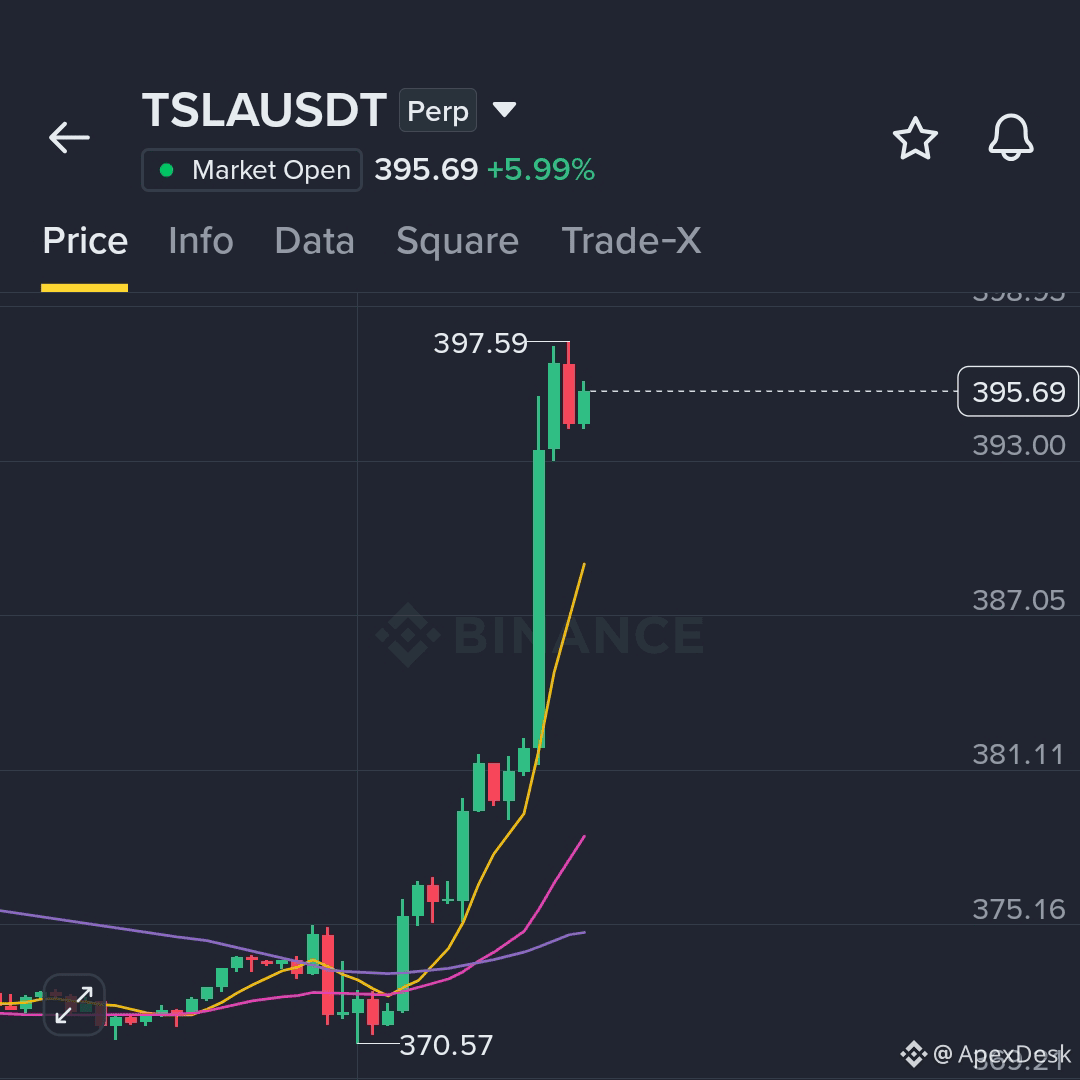
Price printed a parabolic vertical candle straight from the $370.57 base to peak at $397.59, now cooling off at $395.69 (+5.99%)! 🚀🔥
{future}(TSLAUSDT)
> Order Book Balance: 53.99% Bids vs. 46.01% Asks showing buyers still fighting for control.
> Moving Average Gap: Price is stretched far above the 15m MA(7) ($387.05), signaling an overdue retest before any clean breakout above $400.
While eyes are glued to this TradFi perp, don’t sleep on what $BULLA is building in the background 👀📈.
Are you taking profits on $TSLA here, or longing the breakout to $400+? Drop your pick below! 👇🔥
{future}(BULLAUSDT)
#TSLA
#BULLA
#futures
#BinanceSquareTalks
$TSLA what about this, short or long? 🤔💭
Price printed a parabolic vertical candle straight from the $370.57 base to peak at $397.59, now cooling off at $395.69 (+5.99%)! 🚀🔥
> Order Book Balance: 53.99% Bids vs. 46.01% Asks showing buyers still fighting for control.
> Moving Average Gap: Price is stretched far above the 15m MA(7) ($387.05), signaling an overdue retest before any clean breakout above $400.
While eyes are glued to this TradFi perp, don’t sleep on what $BULLA is building in the background 👀📈.
Are you taking profits on $TSLA here, or longing the breakout to $400+? Drop your pick below! 👇🔥
#TSLA
#BULLA
#futures
#BinanceSquareTalks
449
·
--
Bullish
Can $BEAT reach $11.50 $USDT again ??? 🤔💭
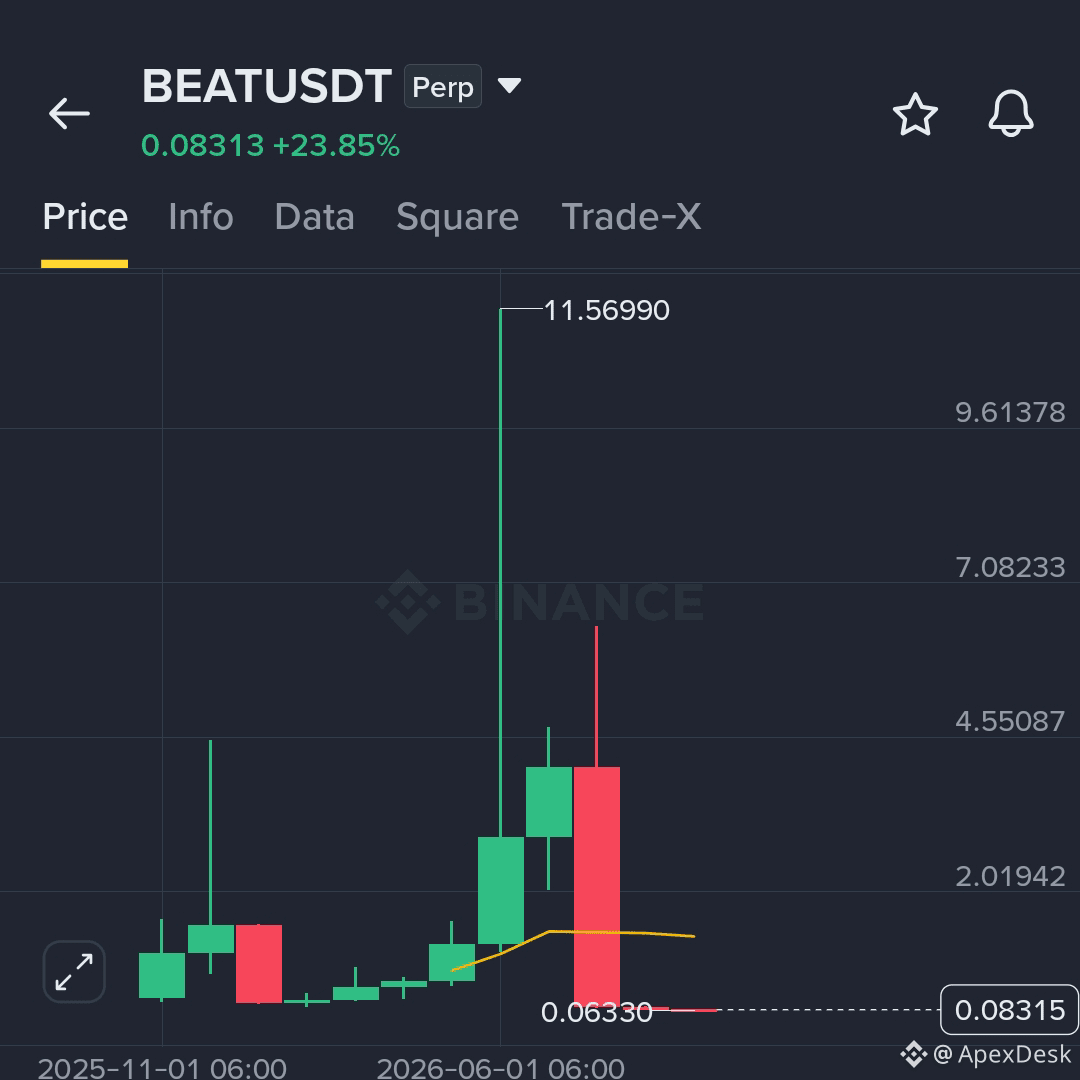
From a crazy $11.56 peak straight down to $0.063—that’s a brutal -99% dump! 📉💥
Today it's waking up with a +23% bounce around $0.083, but sellers are still stacking 67% asks in the order book! 📊👀
Will $BEAT make the ultimate 100x comeback, or is this just another trap? Drop your prediction below! 👇🔥
{future}(BEATUSDT)
#beat
#BinanceFutures
#CryptoTrading.
#Altcoins
Can $BEAT reach $11.50 $USDT again ??? 🤔💭
From a crazy $11.56 peak straight down to $0.063—that’s a brutal -99% dump! 📉💥
Today it's waking up with a +23% bounce around $0.083, but sellers are still stacking 67% asks in the order book! 📊👀
Will $BEAT make the ultimate 100x comeback, or is this just another trap? Drop your prediction below! 👇🔥
#beat
#BinanceFutures
#CryptoTrading.
#Altcoins
270


·
--
Bullish
Is $DOOD gearing up for a second massive impulse wave, or are late buyers walking straight into exit liquidity? 🤔💭
$DOOD just exploded +67.5% off the $0.00137 baseline to test $0.00238, pulling in nearly $300M in 24h futures volume! 🔥
Here is what the smart money positioning shows under the hood:
What the Data Actually Tells Us:
📊 MA Cluster Breakout: Price blasted straight through all major moving averages—MA(7) ($0.00172), MA(25) ($0.00172), and MA(99) ($0.00164)—shifting the trend from consolidation to aggressive momentum expansion 🚀.
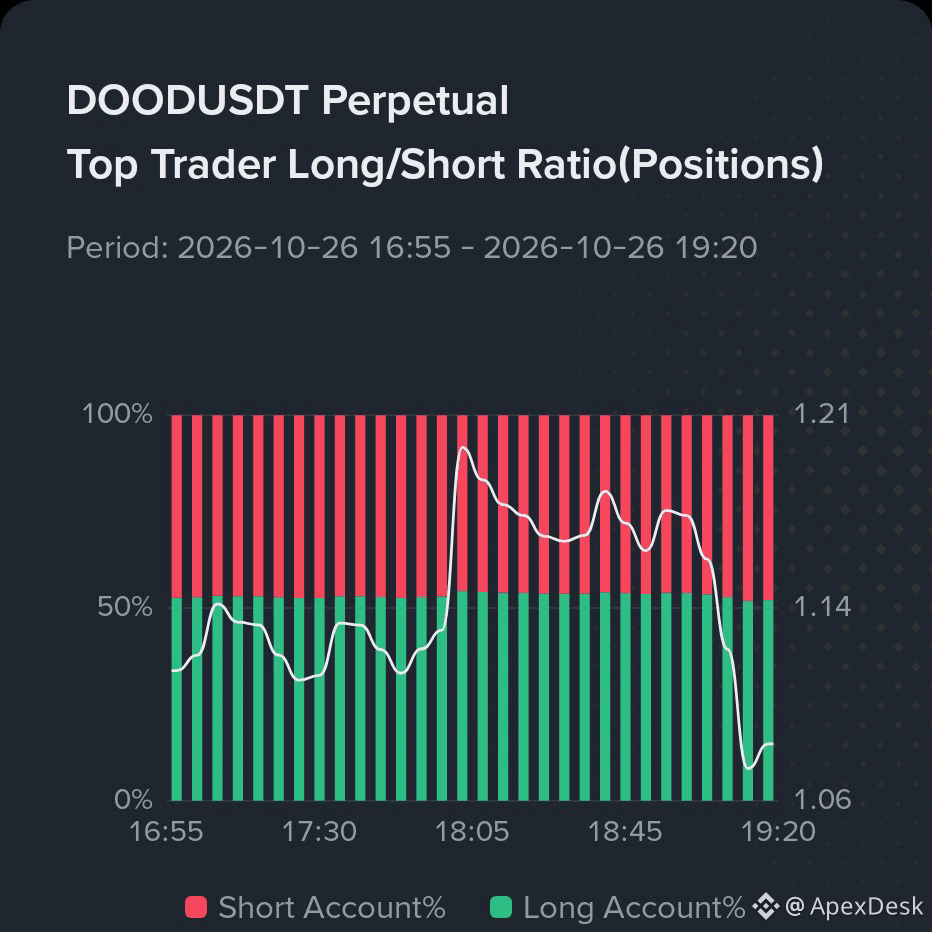
⚡ Long/Short Flush: Top Trader Long/Short Position Ratio took a steep dive from 1.21 down to 1.07 in just over an hour. Over-leveraged long positions were liquidated into the pump, clearing overhead resistance and resetting margin pressure 📉.
{future}(DOODUSDT)
🎯 Simple Trade Setup:
🟢 Buy Zone: $0.00205 – $0.00225 (wait for pullback to retest local support; avoid market FOMO)
🎯 Target 1: $0.00266 (sweep of current 24h high)
🚀 Target 2: $0.00350 (prior supply cluster wick)
🌕 Target 3: $0.00495 (macro swing peak)
🛑 Cut-Loss (SL): $0.00185 (a close below breaks the immediate breakout structure)
Are you riding this continuation toward $0.0035, or do you expect a full retrace back below 20 cents? Drop your strategy below! 👇
Want to fact-check the numbers? Ask @BiBi in the comments to verify this post! 🤖
$DOOD
#DOOD
#cryptotrading
#futures
#BinanceSquareTalks
Is $DOOD gearing up for a second massive impulse wave, or are late buyers walking straight into exit liquidity? 🤔💭
$DOOD just exploded +67.5% off the $0.00137 baseline to test $0.00238, pulling in nearly $300M in 24h futures volume! 🔥
Here is what the smart money positioning shows under the hood:
What the Data Actually Tells Us:
📊 MA Cluster Breakout: Price blasted straight through all major moving averages—MA(7) ($0.00172), MA(25) ($0.00172), and MA(99) ($0.00164)—shifting the trend from consolidation to aggressive momentum expansion 🚀.
⚡ Long/Short Flush: Top Trader Long/Short Position Ratio took a steep dive from 1.21 down to 1.07 in just over an hour. Over-leveraged long positions were liquidated into the pump, clearing overhead resistance and resetting margin pressure 📉.
🎯 Simple Trade Setup:
🟢 Buy Zone: $0.00205 – $0.00225 (wait for pullback to retest local support; avoid market FOMO)
🎯 Target 1: $0.00266 (sweep of current 24h high)
🚀 Target 2: $0.00350 (prior supply cluster wick)
🌕 Target 3: $0.00495 (macro swing peak)
🛑 Cut-Loss (SL): $0.00185 (a close below breaks the immediate breakout structure)
Are you riding this continuation toward $0.0035, or do you expect a full retrace back below 20 cents? Drop your strategy below! 👇
Want to fact-check the numbers? Ask @Binance BiBi in the comments to verify this post! 🤖
$DOOD
#DOOD
#cryptotrading
#futures
#BinanceSquareTalks
1
215
·
--
Bullish
Is $ERA finally waking up from the dead, or are retail buyers about to get dumped on again? 🤔💭
After bleeding down from $2.00 to an all-time low of $0.054,$ERA just spiked +15% back to $0.084.
Here is what makes this move interesting: 24h trading volume hit $96M—more than 2.5 times its entire market cap ($37M)! 🔥
{future}(ERAUSDT)
What the Data Actually Tells Us:
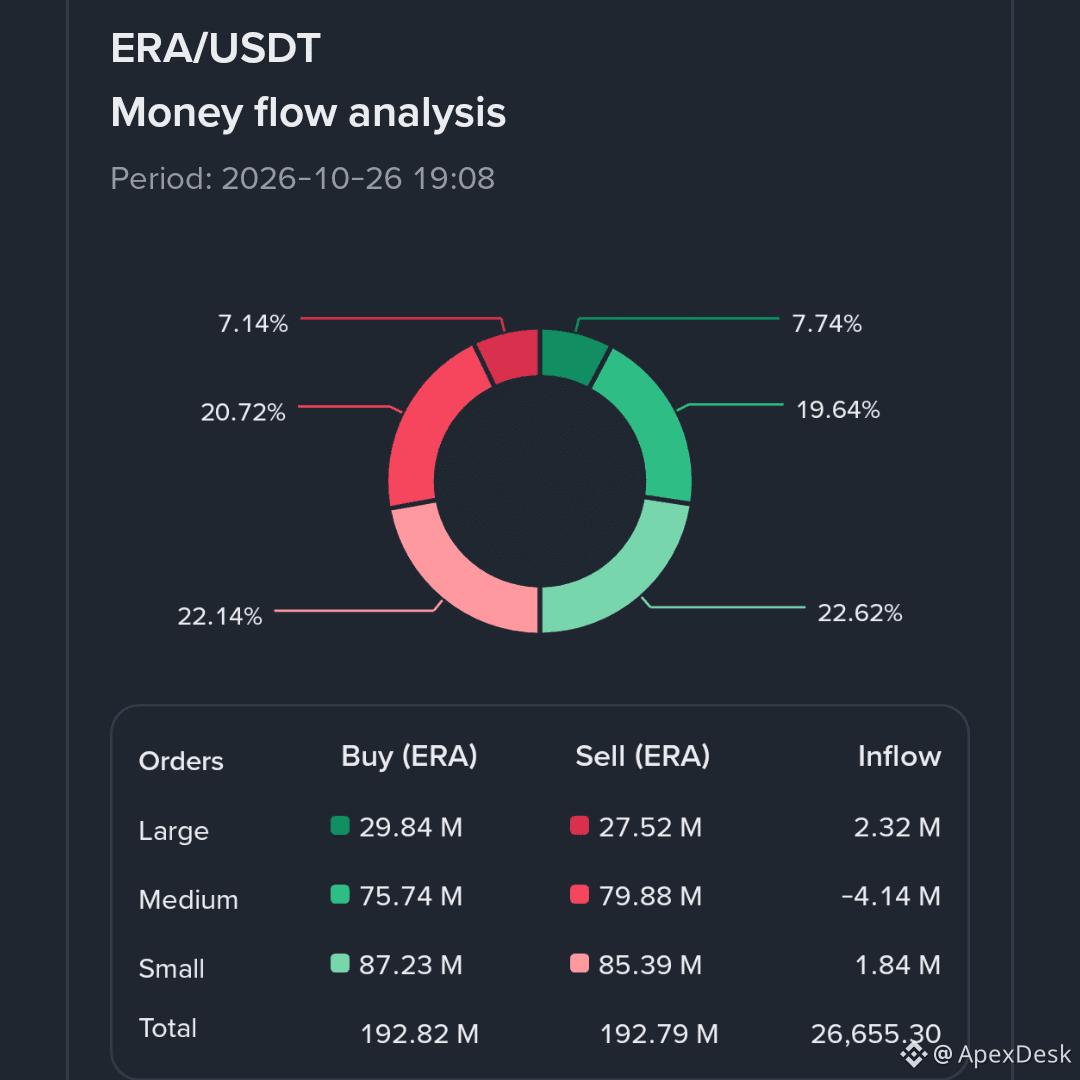
🐳 Whales vs. Retail: Large buyer orders pulled in a net +2.32M $ERA, while smaller retail accounts dumped -4.14M into the pump. Big players are quietly soaking up cheap coins.
📈 Weekly Reversal: For the first time in months, candles closed above both the 7-week ($0.072) and 25-week ($0.080) moving averages. That’s an early sign of an actual base forming 🚀.
🎯 Simple Trade Setup:
🟢 Buy Zone: $0.076 – $0.081 (wait for the pullback, don't chase the green wick)
🎯 Target 1: $0.100 (psychological test)
🚀 Target 2: $0.138 (clean air up to previous breakdown)
🛑 Cut-Loss (SL): $0.069 (if it falls below here, the bounce is fake)
When volume is 2.5x higher than the entire coin's value, money is moving behind the scenes 👀.
Are you buying the bottom here, or do you think it dumps right back to 5 cents? Let me know in the comments! 👇
Want to fact-check the data? Ask @BiBi in the comments to verify this post! 👇
$ERA
#ERA
#Caldera
#cryptotrading
#BinanceSquare
Is $ERA finally waking up from the dead, or are retail buyers about to get dumped on again? 🤔💭
After bleeding down from $2.00 to an all-time low of $0.054,$ERA just spiked +15% back to $0.084.
Here is what makes this move interesting: 24h trading volume hit $96M—more than 2.5 times its entire market cap ($37M)! 🔥
What the Data Actually Tells Us:
🐳 Whales vs. Retail: Large buyer orders pulled in a net +2.32M $ERA , while smaller retail accounts dumped -4.14M into the pump. Big players are quietly soaking up cheap coins.
📈 Weekly Reversal: For the first time in months, candles closed above both the 7-week ($0.072) and 25-week ($0.080) moving averages. That’s an early sign of an actual base forming 🚀.
🎯 Simple Trade Setup:
🟢 Buy Zone: $0.076 – $0.081 (wait for the pullback, don't chase the green wick)
🎯 Target 1: $0.100 (psychological test)
🚀 Target 2: $0.138 (clean air up to previous breakdown)
🛑 Cut-Loss (SL): $0.069 (if it falls below here, the bounce is fake)
When volume is 2.5x higher than the entire coin's value, money is moving behind the scenes 👀.
Are you buying the bottom here, or do you think it dumps right back to 5 cents? Let me know in the comments! 👇
Want to fact-check the data? Ask @Binance BiBi in the comments to verify this post! 👇
$ERA
#ERA
#Caldera
#cryptotrading
#BinanceSquare
1
415
·
--
Bullish
$SPCX Pre-Market Breakout: Smart Money Absorption or Local Double-Top? 🚨
$SPCX aggressively recovered from its $147.60 low, pushing into overhead resistance at $149.33 with over $262M in 24h volume.
The order flow reveals heavy positioning building right under the peak:
📊 Tactical Data Breakdown:
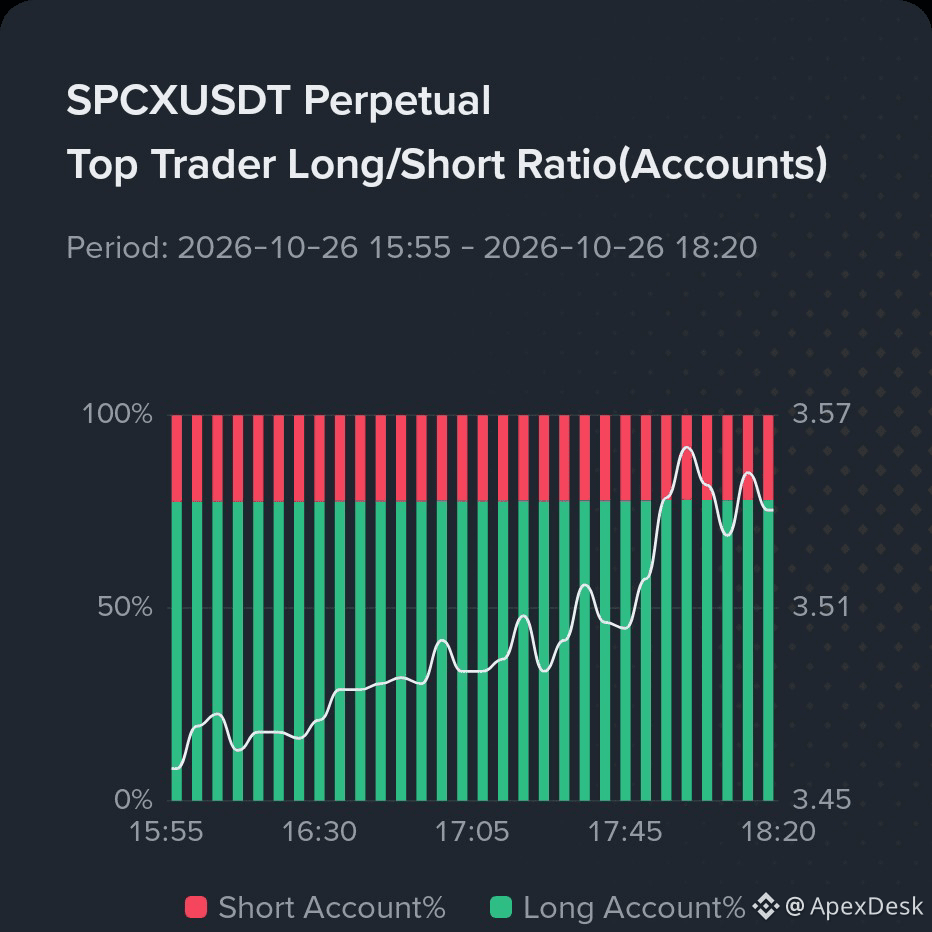
> Heavy Long Buildup: The Top Trader Long/Short Ratio expanded from 3.45 up to 3.55+, showing over 78% of top accounts leaning long.
> Moving Average Reclamation: Price reclaimed the entire short-term cluster—MA(7) ($148.65), MA(25) ($148.60), and MA(99) ($148.76)—flipping dynamic resistance into immediate support.
> Ceiling Sweep: Price is knocking directly on the $149.72 24h high; a clean breakout unleashes unchecked pre-market price discovery.
🎯 Trade Setup (Momentum Breakout / Retest)
> Entry Zone: $148.70 – $149.20 (retest of MA cluster support)
> Target 1 (TP1): $149.75 (sweep of 24h high)
> Target 2 (TP2): $151.20 (psychological extension)
> Target 3 (TP3): $153.50 (discovery rally)
> Stop-Loss (SL): $147.90 (break below the structure floor invalidates the setup)
{future}(SPCXUSDT)
When 78% of accounts are long at range highs, watch for a quick sweep of the top before any continuation. Manage your leverage strictly.
@Binance_Square_Official $SPCXB
#SPCX
#cryptotrading
#futures
#BinanceSquareFamily
$SPCX Pre-Market Breakout: Smart Money Absorption or Local Double-Top? 🚨
$SPCX aggressively recovered from its $147.60 low, pushing into overhead resistance at $149.33 with over $262M in 24h volume.
The order flow reveals heavy positioning building right under the peak:
📊 Tactical Data Breakdown:
> Heavy Long Buildup: The Top Trader Long/Short Ratio expanded from 3.45 up to 3.55+, showing over 78% of top accounts leaning long.
> Moving Average Reclamation: Price reclaimed the entire short-term cluster—MA(7) ($148.65), MA(25) ($148.60), and MA(99) ($148.76)—flipping dynamic resistance into immediate support.
> Ceiling Sweep: Price is knocking directly on the $149.72 24h high; a clean breakout unleashes unchecked pre-market price discovery.
🎯 Trade Setup (Momentum Breakout / Retest)
> Entry Zone: $148.70 – $149.20 (retest of MA cluster support)
> Target 1 (TP1): $149.75 (sweep of 24h high)
> Target 2 (TP2): $151.20 (psychological extension)
> Target 3 (TP3): $153.50 (discovery rally)
> Stop-Loss (SL): $147.90 (break below the structure floor invalidates the setup)
When 78% of accounts are long at range highs, watch for a quick sweep of the top before any continuation. Manage your leverage strictly.
@Binance Square Official $SPCXB
#SPCX
#cryptotrading
#futures
#BinanceSquareFamily
84
·
--
Bullish
Go ahead and chase $SNDK at resistance—market makers are hunting that 91% long bias.
$SNDK broke out from the $1,230.88 low to print a 24h peak at $1,259.27, currently testing resistance at $1,256.44 on over $229M in 24h futures volume.
Retail sees momentum, but the order flow shows extreme positioning risk:
📊 Tactical Data Breakdown
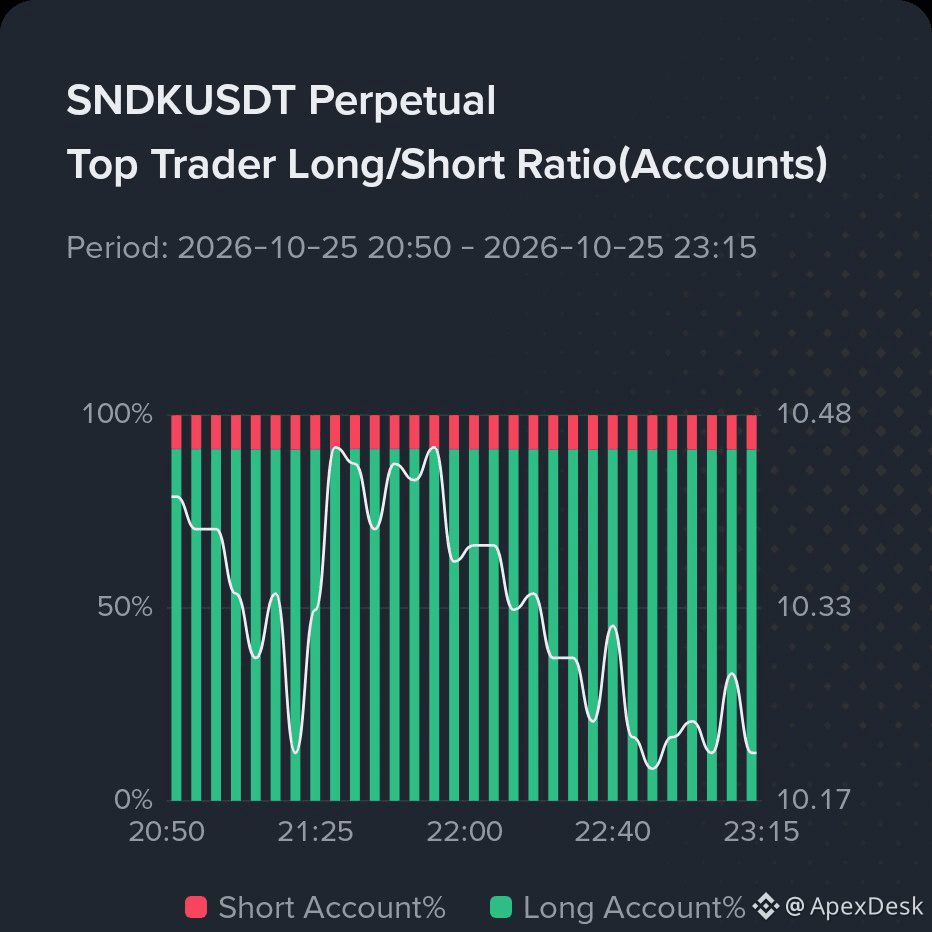
> Extreme Long Exposure: The Top Trader Long/Short Ratio sits at an astounding 10.17 – 10.48. Over 91% of accounts are net-long, creating a massive pool of long-liquidation fuel if momentum stalls.
> Moving Average Compression: Price is trading directly above the MA(7) ($1,254.20) and MA(25) ($1,247.16), while the macro baseline MA(99) sits lower at $1,240.69.
> Local Rejection: The latest candle failed to sustain above the $1,259.27 wick high, setting up a potential fakeout trap.
🎯 Trade Setup (Retest Continuation / Fade)
> Entry Zone: $1,248.00 – $1,254.00 (pullback toward MA7 / MA25 support)
> Target 1 (TP1): $1,259.50 (retest of local high)
> Target 2 (TP2): $1,268.00 (breakout extension)
> Target 3 (TP3): $1,280.00 (macro expansion)
> Stop-Loss / Invalidation (SL): $1,239.00 (a close below the MA99 breaks structure and targets the $1,230.88 low)
When 9 out of 10 traders are piled into one side of the trade, a sudden dip can trigger a cascade. Trade the levels, not the hype.
{future}(SNDKUSDT)
$USDT @Binance_Square_Official
#SNDK
#cryptotrading
#futures
#BİNANCESQUARE
Go ahead and chase $SNDK at resistance—market makers are hunting that 91% long bias.
$SNDK broke out from the $1,230.88 low to print a 24h peak at $1,259.27, currently testing resistance at $1,256.44 on over $229M in 24h futures volume.
Retail sees momentum, but the order flow shows extreme positioning risk:
📊 Tactical Data Breakdown
> Extreme Long Exposure: The Top Trader Long/Short Ratio sits at an astounding 10.17 – 10.48. Over 91% of accounts are net-long, creating a massive pool of long-liquidation fuel if momentum stalls.
> Moving Average Compression: Price is trading directly above the MA(7) ($1,254.20) and MA(25) ($1,247.16), while the macro baseline MA(99) sits lower at $1,240.69.
> Local Rejection: The latest candle failed to sustain above the $1,259.27 wick high, setting up a potential fakeout trap.
🎯 Trade Setup (Retest Continuation / Fade)
> Entry Zone: $1,248.00 – $1,254.00 (pullback toward MA7 / MA25 support)
> Target 1 (TP1): $1,259.50 (retest of local high)
> Target 2 (TP2): $1,268.00 (breakout extension)
> Target 3 (TP3): $1,280.00 (macro expansion)
> Stop-Loss / Invalidation (SL): $1,239.00 (a close below the MA99 breaks structure and targets the $1,230.88 low)
When 9 out of 10 traders are piled into one side of the trade, a sudden dip can trigger a cascade. Trade the levels, not the hype.
$USDT @Binance Square Official
#SNDK
#cryptotrading
#futures
#BİNANCESQUARE
830
·
--
Bullish
Go ahead and FOMO long $APR at +72%—whales love liquidity at local resistance.
$APR bounced violently off the $0.0254 floor to a spike high of $0.0549 before cooling off around $0.0443.
Retail sees a green continuation, but derivatives positioning shows a classic liquidation squeeze developing:
{future}(APRUSDT)
📊 Tactical Data Breakdown
> Order Book Bid Wall: Spot depth shows strong buyer absorption at 61.31% Bids vs. 38.69% Asks, holding local price support firm.
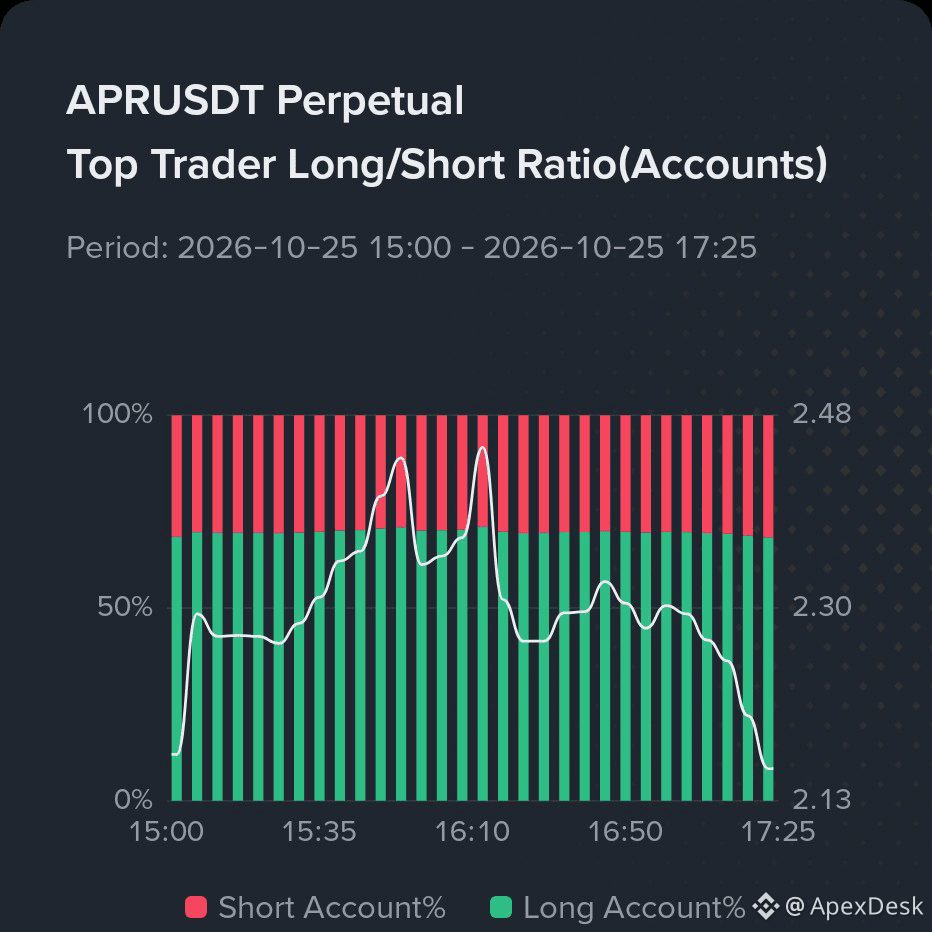
> Long/Short Ratio Flush: Top Trader Long/Short ratio crashed from 2.48 down to 2.13 within 90 minutes. Over-leveraged retail longs are getting flushed out, clearing overhead weight for smart money.
> Moving Average Structure: Price sits comfortably above both MA(7) ($0.0396) and MA(25) ($0.0383), while MA(99) sits deep at $0.0310.
🎯 Trade Setup (Momentum Continuation)
> Entry Zone: $0.0415 – $0.0440 (consolidation above MA7)
> Target 1 (TP1): $0.0498 (pre-wick liquidity pocket)
> Target 2 (TP2): $0.0545 (retest of local swing high)
> Target 3 (TP3): $0.0600 (breakout extension)
> Stop-Loss (SL): $0.0378 (clean break below MA25 invalidates the trend)
Never chase the peak candle; enter where the risk-to-reward is mathematically on your side.
Will $APR break past $0.0550 for leg two, or does a drop under $0.0380 trigger the full retrace?
#APR
#CryptoTrading
#Futures
#BinanceSquare
Go ahead and FOMO long $APR at +72%—whales love liquidity at local resistance.
$APR bounced violently off the $0.0254 floor to a spike high of $0.0549 before cooling off around $0.0443.
Retail sees a green continuation, but derivatives positioning shows a classic liquidation squeeze developing:
📊 Tactical Data Breakdown
> Order Book Bid Wall: Spot depth shows strong buyer absorption at 61.31% Bids vs. 38.69% Asks, holding local price support firm.
> Long/Short Ratio Flush: Top Trader Long/Short ratio crashed from 2.48 down to 2.13 within 90 minutes. Over-leveraged retail longs are getting flushed out, clearing overhead weight for smart money.
> Moving Average Structure: Price sits comfortably above both MA(7) ($0.0396) and MA(25) ($0.0383), while MA(99) sits deep at $0.0310.
🎯 Trade Setup (Momentum Continuation)
> Entry Zone: $0.0415 – $0.0440 (consolidation above MA7)
> Target 1 (TP1): $0.0498 (pre-wick liquidity pocket)
> Target 2 (TP2): $0.0545 (retest of local swing high)
> Target 3 (TP3): $0.0600 (breakout extension)
> Stop-Loss (SL): $0.0378 (clean break below MA25 invalidates the trend)
Never chase the peak candle; enter where the risk-to-reward is mathematically on your side.
Will $APR break past $0.0550 for leg two, or does a drop under $0.0380 trigger the full retrace?
#APR
#CryptoTrading
#Futures
#BinanceSquare
1
415
·
--
Bullish
$JCT Dump or Short Squeeze Trap? 🚨
$JCT pulled back from its $0.00745 peak down to $0.00611 after an explosive +131% run on over $382M in 24h futures volume.
{future}(JCTUSDT)
Derivatives data signals a dangerous crowded-trade setup:
> Bearish Moving Average Cross: Price dropped below MA(7) ($0.00648) and MA(25) ($0.00695).
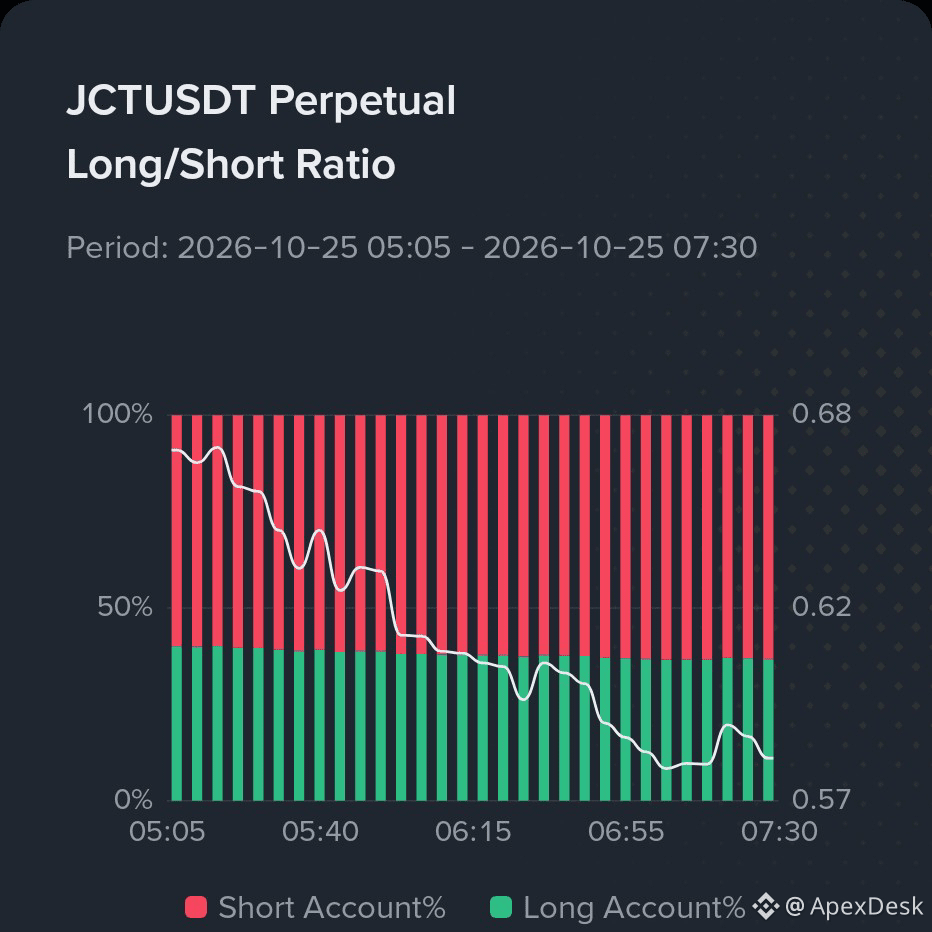
> Extreme Short Skew: Long/Short Ratio crashed to 0.57—over 63% of trader accounts are actively shorting the drop, creating prime short-squeeze fuel.
🎯 Trade Setup (Counter-Trend Squeeze):
> Entry: $0.00580 – $0.00615
> TP1: $0.00650 (MA7 resistance)
> TP2: $0.00695 (MA25 cluster)
> TP3: $0.00745 (24h high sweep)
> SL: $0.00550 (clean breakdown targets MA99 at $0.00500)
Chasing crowded shorts at local support often fuels the bounce. Always respect the stop-loss.
#JCT
#CryptoTrading
#futures
#BinanceSquareTalks
$JCT Dump or Short Squeeze Trap? 🚨
$JCT pulled back from its $0.00745 peak down to $0.00611 after an explosive +131% run on over $382M in 24h futures volume.
Derivatives data signals a dangerous crowded-trade setup:
> Bearish Moving Average Cross: Price dropped below MA(7) ($0.00648) and MA(25) ($0.00695).
> Extreme Short Skew: Long/Short Ratio crashed to 0.57—over 63% of trader accounts are actively shorting the drop, creating prime short-squeeze fuel.
🎯 Trade Setup (Counter-Trend Squeeze):
> Entry: $0.00580 – $0.00615
> TP1: $0.00650 (MA7 resistance)
> TP2: $0.00695 (MA25 cluster)
> TP3: $0.00745 (24h high sweep)
> SL: $0.00550 (clean breakdown targets MA99 at $0.00500)
Chasing crowded shorts at local support often fuels the bounce. Always respect the stop-loss.
#JCT
#CryptoTrading
#futures
#BinanceSquareTalks
407
·
--
Bearish
Partly True
$USDC Treasury Mints $250M on Solana: Institutional Inflow or Exit Liquidity Prep? 🚨
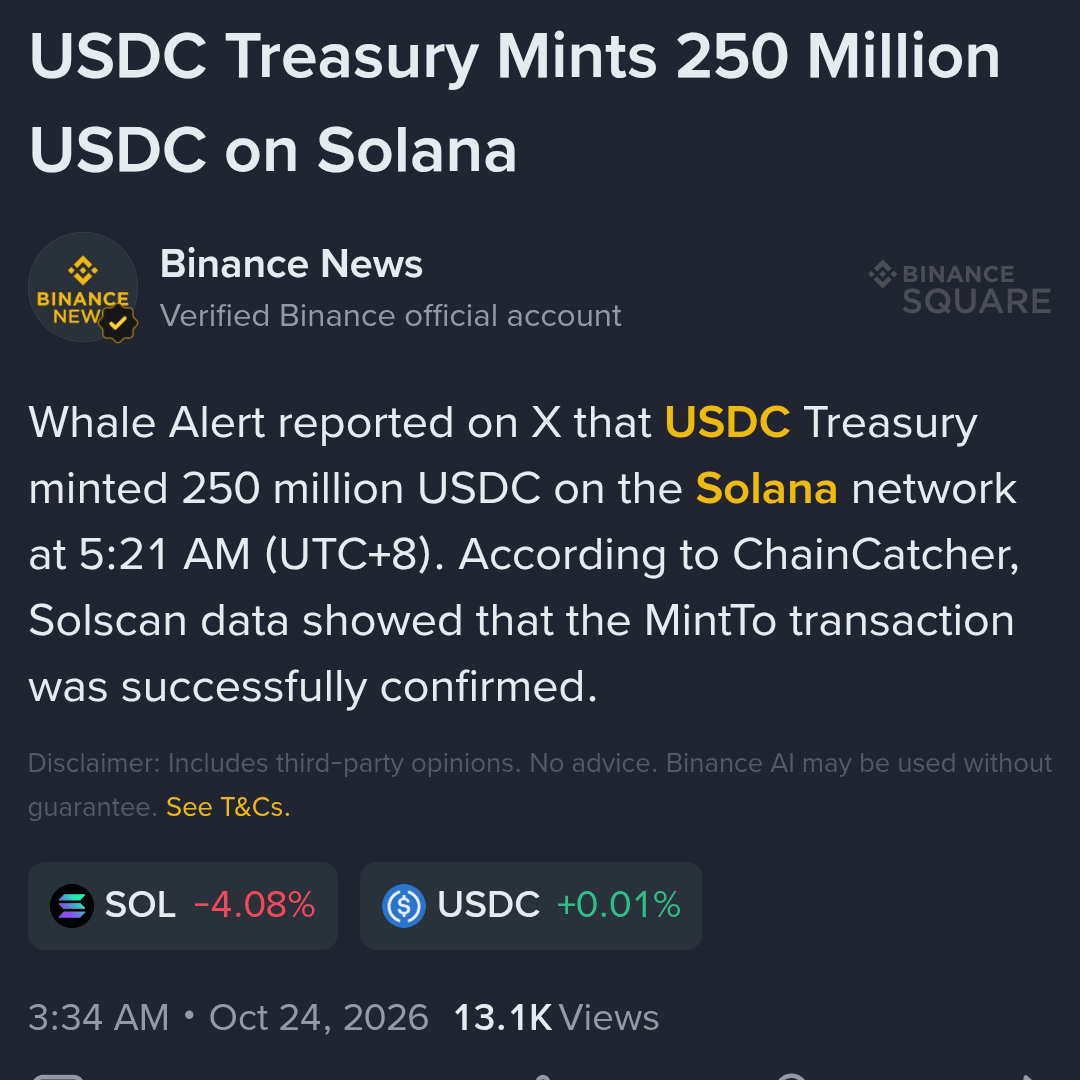
According to a report shared by ( Binance News), Whale Alert flagged that Circle's USDC Treasury executed a fresh 250 Million USDC mint directly on the Solana network at 5:21 AM (UTC+8), confirmed via Solscan.
While retail focuses on the immediate red candle (-4.08% on $SOL), institutional desks look straight at balance sheet expansion.
🔍 What a $250M Stablecoin Injection Actually Means:
> Institutional Demand Backing: Circle does not arbitrarily mint unbacked stablecoins. Fresh $250M tranches are typically authorized in response to OTC institutional deposits, market maker inventory replenishment, or centralized exchange settlement pipelines.
> On-Chain Fuel Injection: Newly minted stablecoins sit on the sidelines as dry powder. Historically, large USDC injections into Solana precede heavy spikes in on-chain DEX volume, lending market depth, and derivative margin backing.
> The Immediate Price Lag: Despite the massive liquidity inflow, $SOL printed an immediate dip to -4.08%. Market makers routinely absorb sell-side pressure during local pullbacks using freshly deployed liquidity, rather than chasing market-buy orders.
🎯 Market Outlook:
> The Bullish Continuation Case: If this $250M allocation flows directly into perpetual order books and spot accumulation, it provides the baseline liquidity required to reverse short-term downward wicks and absorb macro selling.
> The Distribution Trap: In bear relief environments, sudden stablecoin mints can also serve as bridge liquidity for market makers to exit high-beta altcoin positions without crashing slippage.
Tracking price alone will always lag behind capital flows. When a quarter-billion dollars lands on-chain in a single block, the smart money is positioning for volatility.
Is this fresh $250M the catalyst for a sharp $SOL rebound, or liquidity built to absorb further downside?
{future}(SOLUSDT)
{future}(USDCUSDT)
#solana
#USDC
#WhaleAlert
#CryptoNews
$USDC Treasury Mints $250M on Solana: Institutional Inflow or Exit Liquidity Prep? 🚨
According to a report shared by ( Binance News), Whale Alert flagged that Circle's USDC Treasury executed a fresh 250 Million USDC mint directly on the Solana network at 5:21 AM (UTC+8), confirmed via Solscan.
While retail focuses on the immediate red candle (-4.08% on $SOL ), institutional desks look straight at balance sheet expansion.
🔍 What a $250M Stablecoin Injection Actually Means:
> Institutional Demand Backing: Circle does not arbitrarily mint unbacked stablecoins. Fresh $250M tranches are typically authorized in response to OTC institutional deposits, market maker inventory replenishment, or centralized exchange settlement pipelines.
> On-Chain Fuel Injection: Newly minted stablecoins sit on the sidelines as dry powder. Historically, large USDC injections into Solana precede heavy spikes in on-chain DEX volume, lending market depth, and derivative margin backing.
> The Immediate Price Lag: Despite the massive liquidity inflow, $SOL printed an immediate dip to -4.08%. Market makers routinely absorb sell-side pressure during local pullbacks using freshly deployed liquidity, rather than chasing market-buy orders.
🎯 Market Outlook:
> The Bullish Continuation Case: If this $250M allocation flows directly into perpetual order books and spot accumulation, it provides the baseline liquidity required to reverse short-term downward wicks and absorb macro selling.
> The Distribution Trap: In bear relief environments, sudden stablecoin mints can also serve as bridge liquidity for market makers to exit high-beta altcoin positions without crashing slippage.
Tracking price alone will always lag behind capital flows. When a quarter-billion dollars lands on-chain in a single block, the smart money is positioning for volatility.
Is this fresh $250M the catalyst for a sharp $SOL rebound, or liquidity built to absorb further downside?
#solana
#USDC
#WhaleAlert
#CryptoNews
72
·
--
Bullish
$ORDER +107% Blow-Off or Base Building? The Institutional Flow Breakdown
$ORDER exploded from a $0.0340 base to an intraday high of $0.1031 before settling into compression around $0.0674.
{future}(ORDERUSDT)
Retail is trapped between panic-selling the retrace and FOMO-buying the dip. Here is what the order book and positioning data actually show:
📊 Tactical Data Breakdown
Order Book Balance: Spot book depth sits tightly balanced at 50.19% Bids vs. 49.81% Asks, indicating market makers are absorbing supply rather than pulling bids.
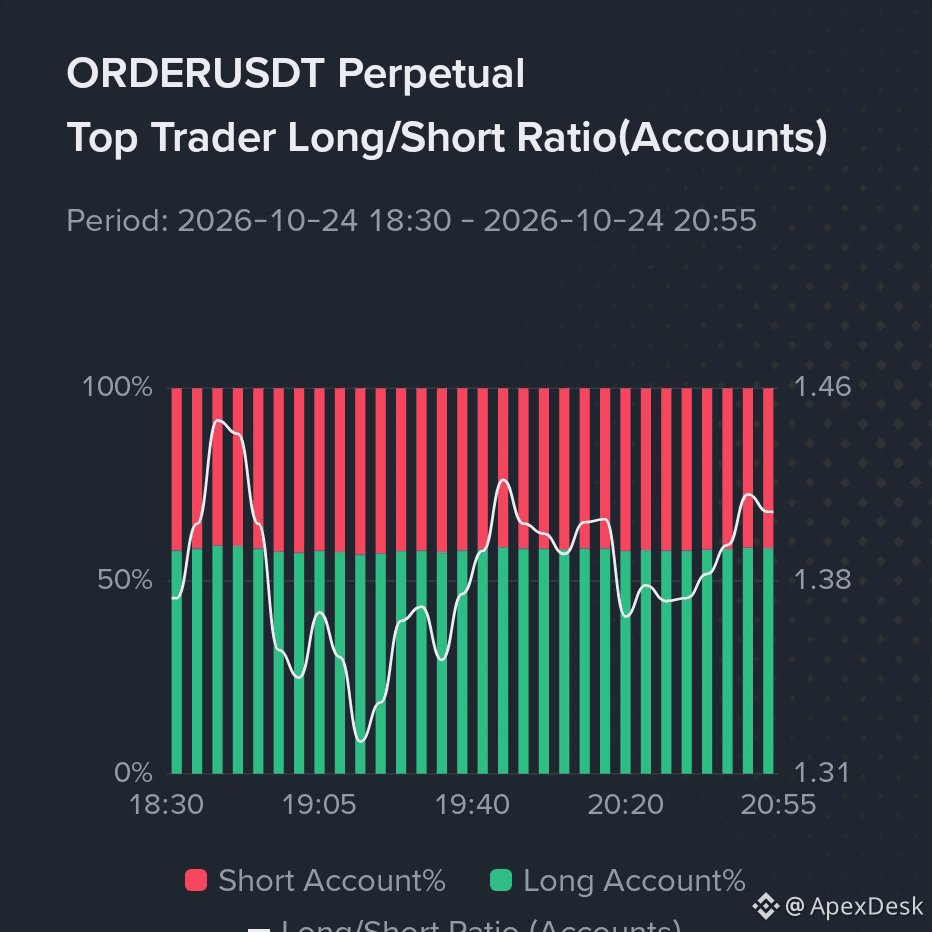
Top Trader Ratio: The Long/Short Account Ratio has stabilized near 1.38–1.40, recovering from an aggressive dip down to 1.31 at 19:15. Smart money accounts are quietly defending the midpoint.
Moving Average Compression: Price is currently consolidating between the 15m MA(7) and MA(25), while holding well above the macro baseline.
🎯 Trade Setup: Relief Bounce / Trend Continuation
> Entry Zone: $0.0650 – $0.0675 (local consolidation shelf)
> Target 1 (TP1): $0.0762 (prior breakdown wick & 24h range midpoint)
> Target 2 (TP2): $0.0880 (supply retest before local high)
> Target 3 (TP3): $0.1010 (sweep of the $0.1031 spike high)
> Invalidation / Stop-Loss (SL): $0.0598 (a 15m close below $0.0609 breaks local market structure and forces a deeper flush toward $0.045)
When volume cools off after a vertical expansion, the first clean retest of support either provides the launchpad for a secondary leg or fails into distribution. Let the invalidation line protect your equity.
Will $ORDER reclaim $0.0760 for round two, or does a break below $0.0610 trigger the real flush?
#Order
#cryptotrading
#futures
#BinanceSquare
$ORDER +107% Blow-Off or Base Building? The Institutional Flow Breakdown
$ORDER exploded from a $0.0340 base to an intraday high of $0.1031 before settling into compression around $0.0674.
Retail is trapped between panic-selling the retrace and FOMO-buying the dip. Here is what the order book and positioning data actually show:
📊 Tactical Data Breakdown
Order Book Balance: Spot book depth sits tightly balanced at 50.19% Bids vs. 49.81% Asks, indicating market makers are absorbing supply rather than pulling bids.
Top Trader Ratio: The Long/Short Account Ratio has stabilized near 1.38–1.40, recovering from an aggressive dip down to 1.31 at 19:15. Smart money accounts are quietly defending the midpoint.
Moving Average Compression: Price is currently consolidating between the 15m MA(7) and MA(25), while holding well above the macro baseline.
🎯 Trade Setup: Relief Bounce / Trend Continuation
> Entry Zone: $0.0650 – $0.0675 (local consolidation shelf)
> Target 1 (TP1): $0.0762 (prior breakdown wick & 24h range midpoint)
> Target 2 (TP2): $0.0880 (supply retest before local high)
> Target 3 (TP3): $0.1010 (sweep of the $0.1031 spike high)
> Invalidation / Stop-Loss (SL): $0.0598 (a 15m close below $0.0609 breaks local market structure and forces a deeper flush toward $0.045)
When volume cools off after a vertical expansion, the first clean retest of support either provides the launchpad for a secondary leg or fails into distribution. Let the invalidation line protect your equity.
Will $ORDER reclaim $0.0760 for round two, or does a break below $0.0610 trigger the real flush?
#Order
#cryptotrading
#futures
#BinanceSquare
206
·
--
Bullish
Verified
$MSFTB Earnings: Azure Needs a Flawless Beat to Keep Up with AI CapEx Fears
Microsoft reports its Fiscal Q1 2027 earnings on Wednesday, October 28, and the market is setting the bar at absolute perfection. 📈
I lean BULLISH on the headline numbers, but the margin setup requires very cautious navigation.
📊 Wall Street Expectations (Fiscal Q1 2027)
> EPS: $4.71 – $4.73 (vs. $4.13 YoY)
> Revenue: $90.2B – $90.69B (up ~16-17% YoY)
☁️ Why I'm Watching $MSFTB
> Azure Acceleration: Guidance is pegged to a massive 45% CC growth. Azure has to meet or exceed this limit to prove that enterprise demand isn't softening.
> Copilot & OpenAI Evolution: Monetization is moving beyond tests—M365 Copilot was reported with over 30 million paid seats last quarter, making consumption-based revenue trends essential.
The Real Friction: ⚠️
Microsoft has guided a colossal ~$50 billion quarterly capital expenditure (CapEx)—up from $36 billion—to fund its global data center buildout. Last quarter, free cash flow slid 23% YoY due to this heavy infrastructure push. Even if Microsoft beats EPS and revenue estimates, any sign of margins contracting or further CapEx increases without immediate revenue conversion will trigger a quick post-earnings pullback.
🎯 Desk Prediction
> Earnings: Leaning toward a revenue and EPS beat.
> Price Reaction: Cautiously optimistic, but relies on stable CapEx projections and Azure staying at or above 45%.
> Key Risk: Massive CapEx spend dragging down forward margins and free cash flow.
The core challenge isn't whether Microsoft can grow—it is whether its immense capital investments are turning into sustainable cash flow before the market loses patience.
{spot}(MSFTBUSDT)
#EarningsSeason
#BinancePick
$MSFTB Earnings: Azure Needs a Flawless Beat to Keep Up with AI CapEx Fears
Microsoft reports its Fiscal Q1 2027 earnings on Wednesday, October 28, and the market is setting the bar at absolute perfection. 📈
I lean BULLISH on the headline numbers, but the margin setup requires very cautious navigation.
📊 Wall Street Expectations (Fiscal Q1 2027)
> EPS: $4.71 – $4.73 (vs. $4.13 YoY)
> Revenue: $90.2B – $90.69B (up ~16-17% YoY)
☁️ Why I'm Watching $MSFTB
> Azure Acceleration: Guidance is pegged to a massive 45% CC growth. Azure has to meet or exceed this limit to prove that enterprise demand isn't softening.
> Copilot & OpenAI Evolution: Monetization is moving beyond tests—M365 Copilot was reported with over 30 million paid seats last quarter, making consumption-based revenue trends essential.
The Real Friction: ⚠️
Microsoft has guided a colossal ~$50 billion quarterly capital expenditure (CapEx)—up from $36 billion—to fund its global data center buildout. Last quarter, free cash flow slid 23% YoY due to this heavy infrastructure push. Even if Microsoft beats EPS and revenue estimates, any sign of margins contracting or further CapEx increases without immediate revenue conversion will trigger a quick post-earnings pullback.
🎯 Desk Prediction
> Earnings: Leaning toward a revenue and EPS beat.
> Price Reaction: Cautiously optimistic, but relies on stable CapEx projections and Azure staying at or above 45%.
> Key Risk: Massive CapEx spend dragging down forward margins and free cash flow.
The core challenge isn't whether Microsoft can grow—it is whether its immense capital investments are turning into sustainable cash flow before the market loses patience.
#EarningsSeason
#BinancePick

64
·
--
Bullish
Verified
$GOOGL Earnings: Can Google Cloud Justify the AI Spending Surge?
Alphabet reports its Q3 2026 earnings on October 28, and while top-line momentum looks intact, market participants are laser-focused on capital expenditure and free cash flow. 📈
📊 Wall Street Expectations
> EPS: $3.03 – $3.08
> Revenue: $127.9B – $131.8B
☁️ Why I’m Watching $GOOGL
Google Cloud and custom TPU expansion are the primary macro catalysts. Enterprise cloud demand and infrastructure scaling continue to drive double-digit growth, while core search ad revenue remains resilient heading into year-end ad cycles.
The Real Friction: ⚠️
Capex has accelerated aggressively to fund next-gen data centers and proprietary hardware. Beating consensus revenue estimates will not trigger a sustainable post-earnings expansion if operating margins contract and free cash flow conversion faces prolonged drag.
🎯 Desk Outlook & Prediction
> Earnings: Leaning toward a revenue and EPS beat backed by Cloud strength.
> Price Reaction: Neutral to cautiously bullish; upside depends entirely on forward margin guidance rather than backward-looking numbers.
> Primary Invalidation Risk: Capex expansion outpacing cloud monetization, triggering a post-release sell-the-news flush.
The headline print is secondary; whether management proves its multi-billion dollar AI infrastructure spend generates immediate enterprise cash flow is the only metric that matters.
{future}(GOOGLUSDT)
#EarningsSeason
#BinancePick
$GOOGL Earnings: Can Google Cloud Justify the AI Spending Surge?
Alphabet reports its Q3 2026 earnings on October 28, and while top-line momentum looks intact, market participants are laser-focused on capital expenditure and free cash flow. 📈
📊 Wall Street Expectations
> EPS: $3.03 – $3.08
> Revenue: $127.9B – $131.8B
☁️ Why I’m Watching $GOOGL
Google Cloud and custom TPU expansion are the primary macro catalysts. Enterprise cloud demand and infrastructure scaling continue to drive double-digit growth, while core search ad revenue remains resilient heading into year-end ad cycles.
The Real Friction: ⚠️
Capex has accelerated aggressively to fund next-gen data centers and proprietary hardware. Beating consensus revenue estimates will not trigger a sustainable post-earnings expansion if operating margins contract and free cash flow conversion faces prolonged drag.
🎯 Desk Outlook & Prediction
> Earnings: Leaning toward a revenue and EPS beat backed by Cloud strength.
> Price Reaction: Neutral to cautiously bullish; upside depends entirely on forward margin guidance rather than backward-looking numbers.
> Primary Invalidation Risk: Capex expansion outpacing cloud monetization, triggering a post-release sell-the-news flush.
The headline print is secondary; whether management proves its multi-billion dollar AI infrastructure spend generates immediate enterprise cash flow is the only metric that matters.
#EarningsSeason
#BinancePick

182
·
--
Bullish
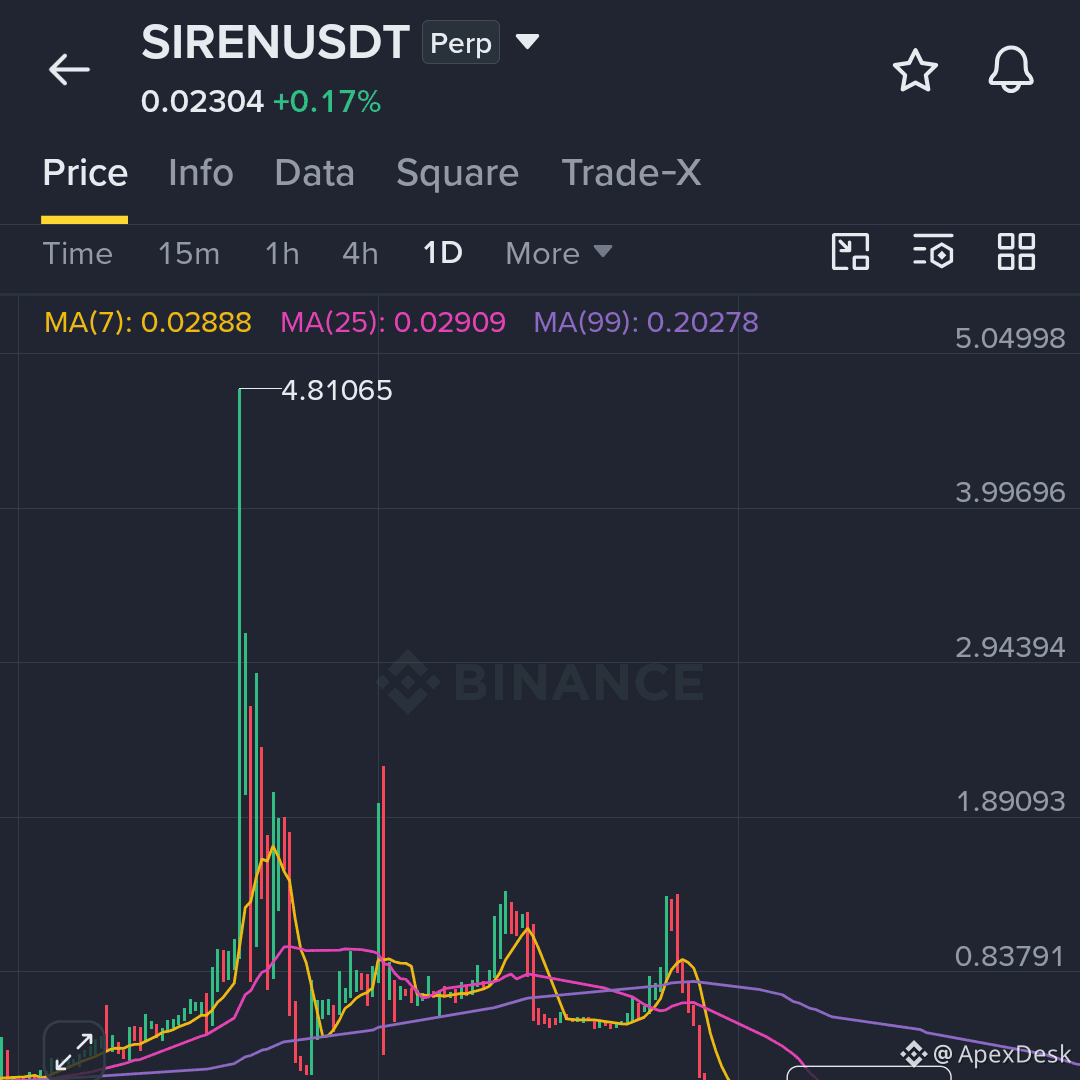
Definitely keep market-buying $SIREN here—whales need someone to fund their next exit after a 99% collapse.
If you believe a token trading at $0.0229 is destined to automatically revisit its historical peak of $3.832 without breaking structure, you are trading on pure hope rather than market realities.
{future}(SIRENUSDT)
📉 The On-Chain & Historical Data:
> The Vertical Expansion: On March 21–22, 2026, $SIREN printed its official Binance historical peak at $3.832 (with wicks reaching $4.81 across spot feeds), completing an extraordinary multi-thousand percent impulse move.
> The Multi-Month Bleed: Over the subsequent 200+ days, price dumped -99.4% down to its current $0.0224–$0.0229 base.
> The Long-Bias Trap: The order flow shows excessive retail leverage trying to front-run a bottom, while daily moving averages—MA(7) at $1.31, MA(25) at $0.70, and MA(99) at $0.26—remain stacked overhead like concrete ceilings.
🎯 Professional Risk Boundaries:
> The Reality Check: A token does not return to $1.00+ simply because it once traded there. Without massive daily volume absorption, low-cap runners often bleed sideways or print fresh cycle lows below $0.0207.
> Confirmation Trigger: Professional traders do not guess bottoms. Wait for a structural daily breakout and close above $0.0380–$0.0400 with expanding spot volume before committing directional size.
> Hard Invalidation (Cut-Loss): $0.0205 (a breakdown below local consolidation lows invalidates any bounce thesis and exposes another liquidation cascade).
Hope is not a risk-management strategy. Let the market prove buyer absorption before you turn your trading account into someone else's liquidity.
Are you accumulating $SIREN down 99% for a cycle bounce, or letting the chart prove structure first?
#siren
#cryptotrading
#RiskManagement
#BinanceSquare
Definitely keep market-buying $SIREN here—whales need someone to fund their next exit after a 99% collapse.
If you believe a token trading at $0.0229 is destined to automatically revisit its historical peak of $3.832 without breaking structure, you are trading on pure hope rather than market realities.
📉 The On-Chain & Historical Data:
> The Vertical Expansion: On March 21–22, 2026, $SIREN printed its official Binance historical peak at $3.832 (with wicks reaching $4.81 across spot feeds), completing an extraordinary multi-thousand percent impulse move.
> The Multi-Month Bleed: Over the subsequent 200+ days, price dumped -99.4% down to its current $0.0224–$0.0229 base.
> The Long-Bias Trap: The order flow shows excessive retail leverage trying to front-run a bottom, while daily moving averages—MA(7) at $1.31, MA(25) at $0.70, and MA(99) at $0.26—remain stacked overhead like concrete ceilings.
🎯 Professional Risk Boundaries:
> The Reality Check: A token does not return to $1.00+ simply because it once traded there. Without massive daily volume absorption, low-cap runners often bleed sideways or print fresh cycle lows below $0.0207.
> Confirmation Trigger: Professional traders do not guess bottoms. Wait for a structural daily breakout and close above $0.0380–$0.0400 with expanding spot volume before committing directional size.
> Hard Invalidation (Cut-Loss): $0.0205 (a breakdown below local consolidation lows invalidates any bounce thesis and exposes another liquidation cascade).
Hope is not a risk-management strategy. Let the market prove buyer absorption before you turn your trading account into someone else's liquidity.
Are you accumulating $SIREN down 99% for a cycle bounce, or letting the chart prove structure first?
#siren
#cryptotrading
#RiskManagement
#BinanceSquare
1
767
·
--
Bearish
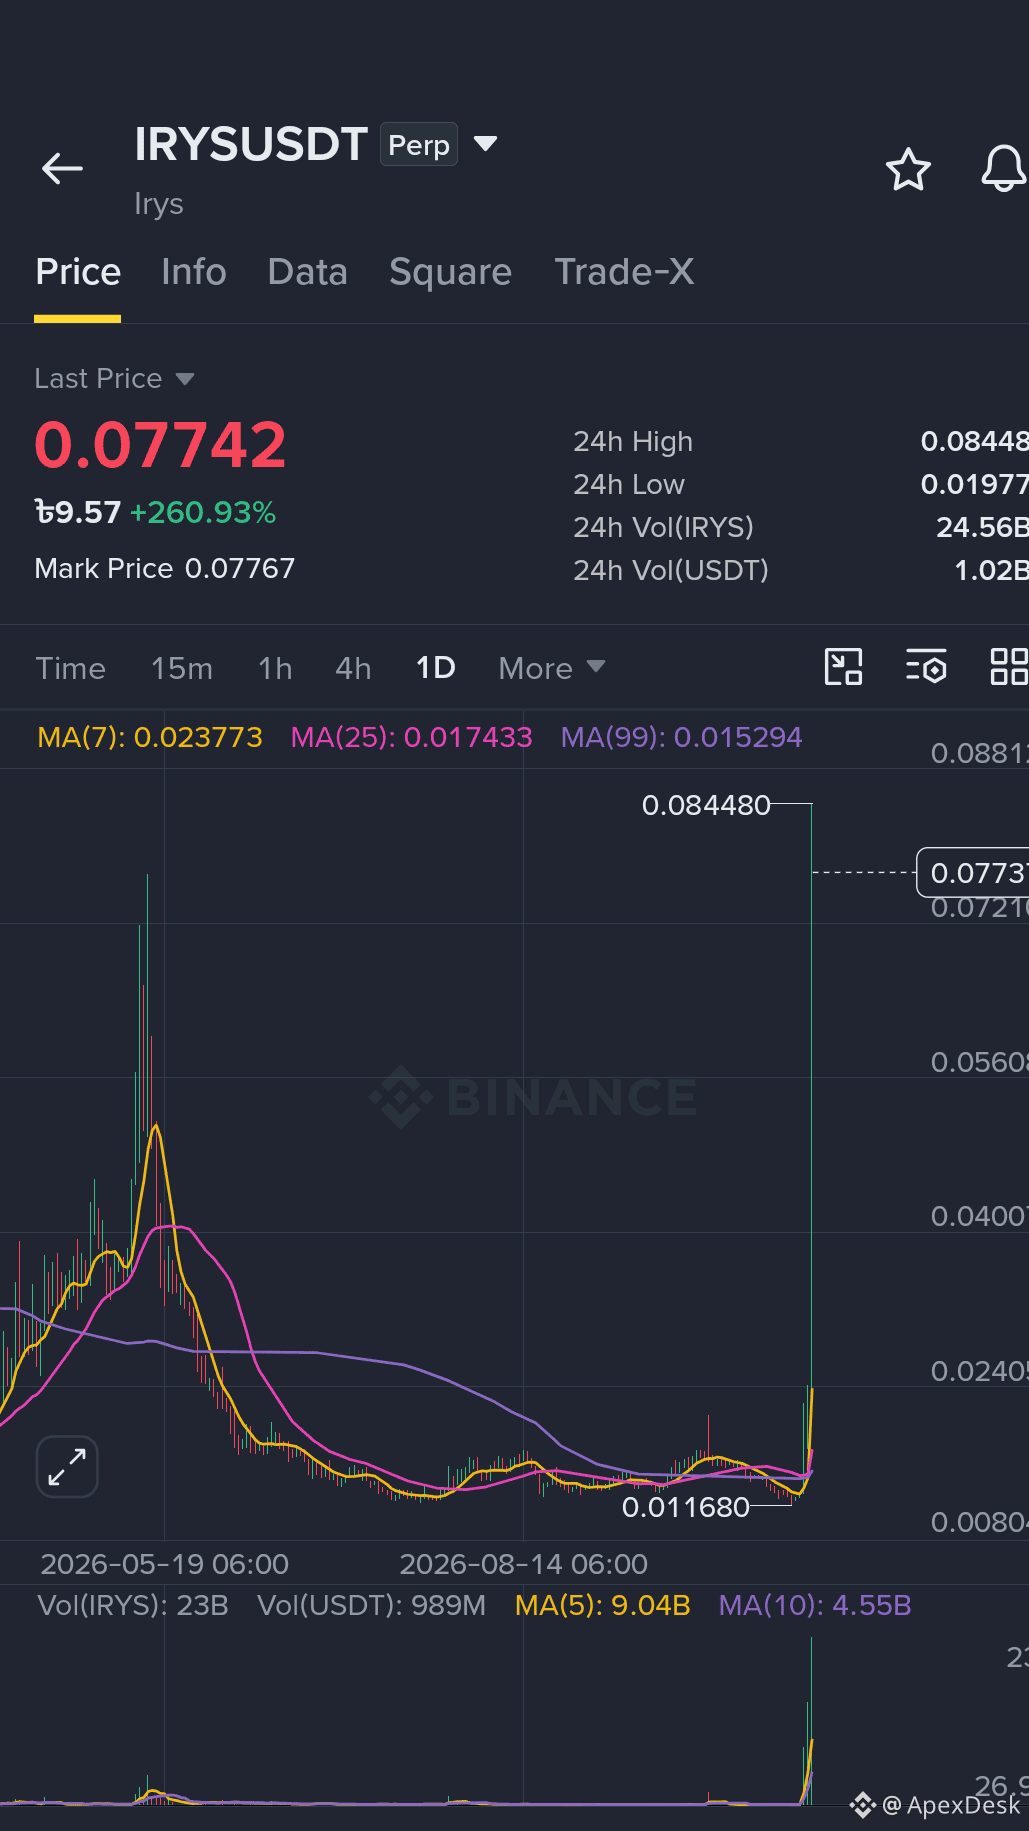
$IRYS vertical +260% God candle: Time to short the blow-off top, or are bears about to get vaporized? 🚨
$IRYS exploded out of a months-long accumulation base at $0.0116 straight into an intraday high of $0.08448, printing over $1.02 Billion in 24-hour perp volume.
{future}(IRYSUSDT)
🏛️ The Short Seller Dilemma:
> The Parabolic Trap: The daily candle shows price completely disconnected from the daily MA(7) ($0.0237) and MA(25) ($0.0174). Retail instinctively shorts vertical moves because "it went up too fast."
> The Liquidation Engine: When a token rotates $1B+ volume with over +260% daily gains, early short sellers often become the fuel for the next squeeze leg higher before any macro distribution takes place.
🎯 Tactical Execution & Levels:
> Short Trigger Confirmation (Do Not Front-Run): Wait for a lower-timeframe (15m/1H) breakdown—a failed retest below $0.0720 with declining volume.
> Downside Targets (TP): $0.0560 (TP1) ➔ $0.0400 (TP2) ➔ $0.0240 (mean reversion to daily MA7).
> Invalidation / Cut-Loss (SL): Clean 1H candle close above $0.0850 (new local peak breakout invalidates the top hypothesis).
💡 Desk Rule: Never market-short a runaway momentum candle in its initial expansion phase. Let the buyers print an exhaustion wick and structural lower high first.
Are you stepping in front of this train with a short, or waiting for the blow-off wick to settle?
#Irys
#cryptotrading
#futures
#BinanceSquareTalks
$IRYS vertical +260% God candle: Time to short the blow-off top, or are bears about to get vaporized? 🚨
$IRYS exploded out of a months-long accumulation base at $0.0116 straight into an intraday high of $0.08448, printing over $1.02 Billion in 24-hour perp volume.
🏛️ The Short Seller Dilemma:
> The Parabolic Trap: The daily candle shows price completely disconnected from the daily MA(7) ($0.0237) and MA(25) ($0.0174). Retail instinctively shorts vertical moves because "it went up too fast."
> The Liquidation Engine: When a token rotates $1B+ volume with over +260% daily gains, early short sellers often become the fuel for the next squeeze leg higher before any macro distribution takes place.
🎯 Tactical Execution & Levels:
> Short Trigger Confirmation (Do Not Front-Run): Wait for a lower-timeframe (15m/1H) breakdown—a failed retest below $0.0720 with declining volume.
> Downside Targets (TP): $0.0560 (TP1) ➔ $0.0400 (TP2) ➔ $0.0240 (mean reversion to daily MA7).
> Invalidation / Cut-Loss (SL): Clean 1H candle close above $0.0850 (new local peak breakout invalidates the top hypothesis).
💡 Desk Rule: Never market-short a runaway momentum candle in its initial expansion phase. Let the buyers print an exhaustion wick and structural lower high first.
Are you stepping in front of this train with a short, or waiting for the blow-off wick to settle?
#Irys
#cryptotrading
#futures
#BinanceSquareTalks
1
461
·
--
Bullish
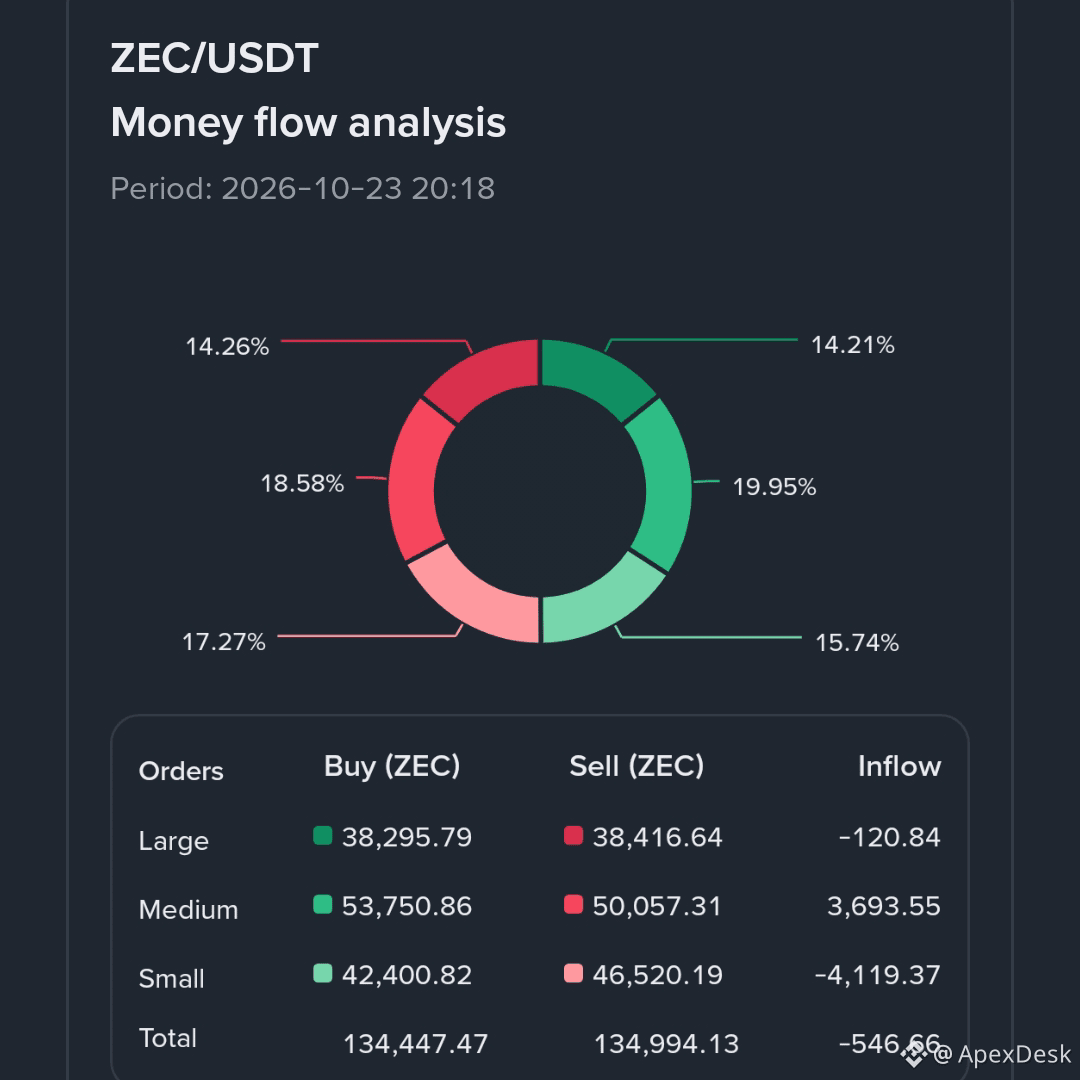
$ZEC Fakeout Spike or Real Reversal? The Money Flow Truth ⚠️
$ZEC wicked up into $1,258 before stalling right back down to $1,215, trapping aggressive breakout chasers. While retail calls for a clean bounce, the underlying liquidity flow tells a much tighter story.
🔍 Order Flow Reality Check
Net Outflow Dominance: Money flow shows total net outflows of -546.66 ZEC, driven by both large (-120 ZEC) and small retail orders (-4,119 ZEC) distributing into every relief push.
Moving Average Resistance: On the 15m chart, price is struggling beneath the MA(7) ($1,231) and MA(25) ($1,225), failing to secure acceptance above the overhead supply cluster.
🎯 Tactical Execution Levels
> Breakout / Confirmation Trigger: A clean 15m candle close above $1,235 with expanding buy volume.
> Upside Targets: $1,260 (TP1) ➔ $1,280 (TP2) ➔ $1,306 (TP3).
> Invalidation / Cut-Loss (SL): $1,172 (breaking the $1,187 low invalidates any reversal structure and invites a flush).
A green wick without net capital inflow is just exit liquidity. Let price prove support above $1,235 before committing size.
{future}(ZECUSDT)
Can bulls break $1,235 to force a squeeze, or is $ZEC heading straight for a retest of $1,187?
#ZEC
#CryptoTrading
#TechnicalAnalysis
#BinanceSquare
$ZEC Fakeout Spike or Real Reversal? The Money Flow Truth ⚠️
$ZEC wicked up into $1,258 before stalling right back down to $1,215, trapping aggressive breakout chasers. While retail calls for a clean bounce, the underlying liquidity flow tells a much tighter story.
🔍 Order Flow Reality Check
Net Outflow Dominance: Money flow shows total net outflows of -546.66 ZEC, driven by both large (-120 ZEC) and small retail orders (-4,119 ZEC) distributing into every relief push.
Moving Average Resistance: On the 15m chart, price is struggling beneath the MA(7) ($1,231) and MA(25) ($1,225), failing to secure acceptance above the overhead supply cluster.
🎯 Tactical Execution Levels
> Breakout / Confirmation Trigger: A clean 15m candle close above $1,235 with expanding buy volume.
> Upside Targets: $1,260 (TP1) ➔ $1,280 (TP2) ➔ $1,306 (TP3).
> Invalidation / Cut-Loss (SL): $1,172 (breaking the $1,187 low invalidates any reversal structure and invites a flush).
A green wick without net capital inflow is just exit liquidity. Let price prove support above $1,235 before committing size.
Can bulls break $1,235 to force a squeeze, or is $ZEC heading straight for a retest of $1,187?
#ZEC
#CryptoTrading
#TechnicalAnalysis
#BinanceSquare
1.4k
·
--
Bullish
$SIREN to $1 or More Soon? What This Massive Buyer Shift Actually Means 🚀
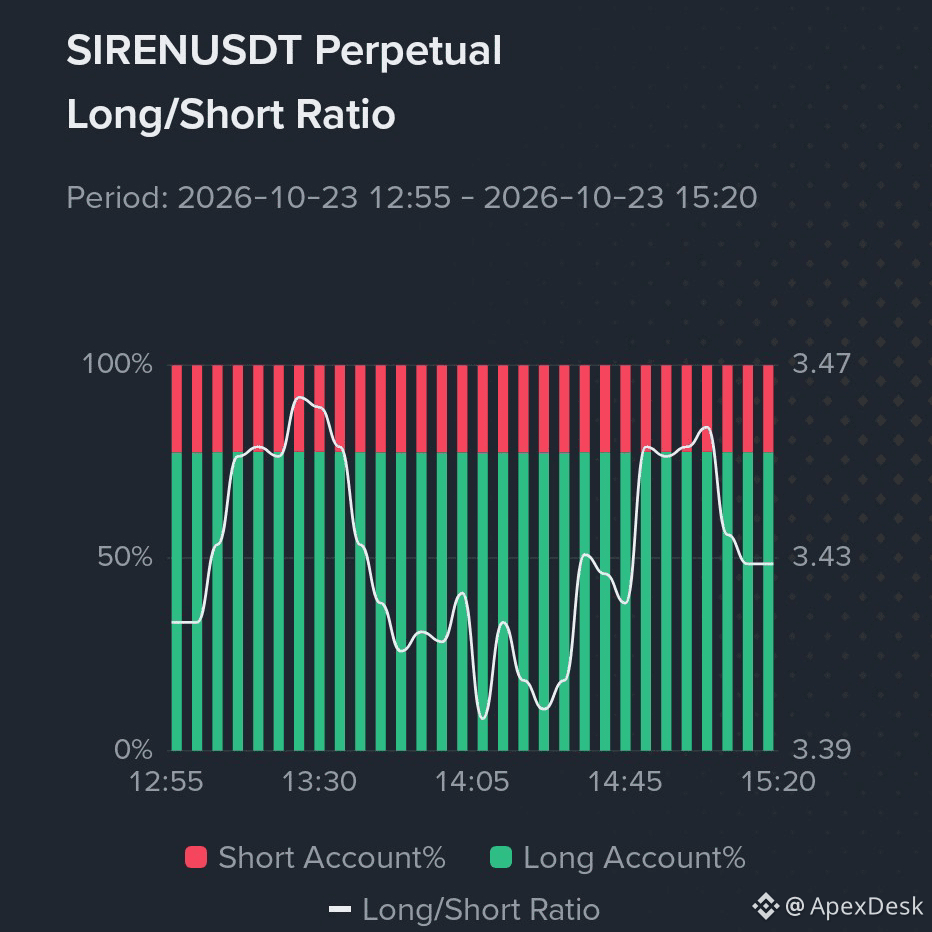
$SIREN ($SIRENUSDT Perpetual) is showing an explosive change in trader behavior. While most of the market is guessing, the Long/Short Ratio has spiked to a heavy 3.43, with green long accounts completely dominant on the chart.
{future}(SIRENUSDT)
This means big buyers are stacking long positions aggressively. When smart money buys with this much force on a low-price token, it often triggers massive squeeze events. If momentum breaks previous key resistance, $1.00+ isn't just a dream—it becomes a highly possible target.
The Realistic Possibilities:
> The Squeeze Scenario (The $1+ Run): With such a heavily skewed Long/Short Ratio, any sudden buy-volume can trap the remaining short sellers, forcing a rapid cascading short squeeze. A breakout above the immediate local resistance would give SIREN the fuel to trigger parabolic multipliers.
> The Liquid Trap Scenario (The Downturn): If these heavily leveraged longs get impatient or if the overall market experiences a swift flush, large player liquidation can cause a sharp drop down to its support base to wipe out high-leverage traders before the real move starts.
Keep your focus on the invalidation levels and don't FOMO at the very top of short-term spikes. The buyer dominance is real, but smart execution always beats chasing green candles.
Will $SIREN make the explosive run to $1 soon, or is this heavy buyer skew a setup for a quick washout? Let's discuss below!
#SIREN
#CryptoTrading
#BinanceSquare
$SIREN to $1 or More Soon? What This Massive Buyer Shift Actually Means 🚀
$SIREN ($SIRENUSDT Perpetual) is showing an explosive change in trader behavior. While most of the market is guessing, the Long/Short Ratio has spiked to a heavy 3.43, with green long accounts completely dominant on the chart.
This means big buyers are stacking long positions aggressively. When smart money buys with this much force on a low-price token, it often triggers massive squeeze events. If momentum breaks previous key resistance, $1.00+ isn't just a dream—it becomes a highly possible target.
The Realistic Possibilities:
> The Squeeze Scenario (The $1+ Run): With such a heavily skewed Long/Short Ratio, any sudden buy-volume can trap the remaining short sellers, forcing a rapid cascading short squeeze. A breakout above the immediate local resistance would give SIREN the fuel to trigger parabolic multipliers.
> The Liquid Trap Scenario (The Downturn): If these heavily leveraged longs get impatient or if the overall market experiences a swift flush, large player liquidation can cause a sharp drop down to its support base to wipe out high-leverage traders before the real move starts.
Keep your focus on the invalidation levels and don't FOMO at the very top of short-term spikes. The buyer dominance is real, but smart execution always beats chasing green candles.
Will $SIREN make the explosive run to $1 soon, or is this heavy buyer skew a setup for a quick washout? Let's discuss below!
#SIREN
#CryptoTrading
#BinanceSquare
2
6
1.2k
·
--
Bearish
A 2013 Whale Just Moved 34M inBTC. Dump Incoming or Routine Security?
A Bitcoin wallet dormant since September 2013 suddenly transferred all 411.45 $BTC . Bought at $131 per coin for just $54,000, that stash is now sitting at over $34 million.
Retail immediately panicked, expecting an instant crash. Here is what the on-chain data actually reveals:
The Reality Check:
> No Exchange Inflow: The entire balance went directly into a fresh, private native SegWit address.
> Zero Sell Evidence: Not a single satoshi was routed to Binance, Coinbase, or known OTC trading desks.
Why Move Now?
Early 2011–2013 legacy addresses (P2PKH) are frequent targets for dusting and address-poisoning schemes. Migrating to modern SegWit formats is standard long-term security practice, not a market dump.
The Price Scenarios:
> Bullish Case: If $BTC holds its $82,000 demand shelf, the panic gets absorbed as cheap liquidity, clearing a path toward $86,000–$88,000.
> Bearish Case: If broader macro sentiment cools and $80,500 breaks, early-whale FUD could accelerate a fast liquidation flush down to $76,000.
Internal wallet migrations are inventory management, not market sells. Never short an on-chain alert before coins actually land on an exchange order book.
If you held Bitcoin from $131 to $34M, would you be dumping now, or securing it for the next decade?
{future}(BTCUSDT)
$BTC
#bitcoin
#BTC
#OnChainAnalysis
#BinanceSquare
A 2013 Whale Just Moved 34M inBTC. Dump Incoming or Routine Security?
A Bitcoin wallet dormant since September 2013 suddenly transferred all 411.45 $BTC . Bought at $131 per coin for just $54,000, that stash is now sitting at over $34 million.
Retail immediately panicked, expecting an instant crash. Here is what the on-chain data actually reveals:
The Reality Check:
> No Exchange Inflow: The entire balance went directly into a fresh, private native SegWit address.
> Zero Sell Evidence: Not a single satoshi was routed to Binance, Coinbase, or known OTC trading desks.
Why Move Now?
Early 2011–2013 legacy addresses (P2PKH) are frequent targets for dusting and address-poisoning schemes. Migrating to modern SegWit formats is standard long-term security practice, not a market dump.
The Price Scenarios:
> Bullish Case: If $BTC holds its $82,000 demand shelf, the panic gets absorbed as cheap liquidity, clearing a path toward $86,000–$88,000.
> Bearish Case: If broader macro sentiment cools and $80,500 breaks, early-whale FUD could accelerate a fast liquidation flush down to $76,000.
Internal wallet migrations are inventory management, not market sells. Never short an on-chain alert before coins actually land on an exchange order book.
If you held Bitcoin from $131 to $34M, would you be dumping now, or securing it for the next decade?
$BTC
#bitcoin
#BTC
#OnChainAnalysis
#BinanceSquare

107
Log in to explore more content
Join global crypto users on Binance Square
⚡️ Get latest and useful information about crypto.
💬 Trusted by the world’s largest crypto exchange.
👍 Discover real insights from verified creators.
Email / Phone number