

ZeroBlock
4.9k Posts

ZeroBlock
Report
Block User
BTC LOVER GOLD TRADER , SQUARE CRATOR
Open Trade
Frequent Trader
1.3 Years
239 Following
25.2K+ Followers
13.1K+ Liked
Posts
Portfolio
All
Videos
Live
·
--
Article
Bitcoin clears $85K, but is ‘Uptober’ setting up a bull trap?Bitcoin Has An $85K Confirmation Test
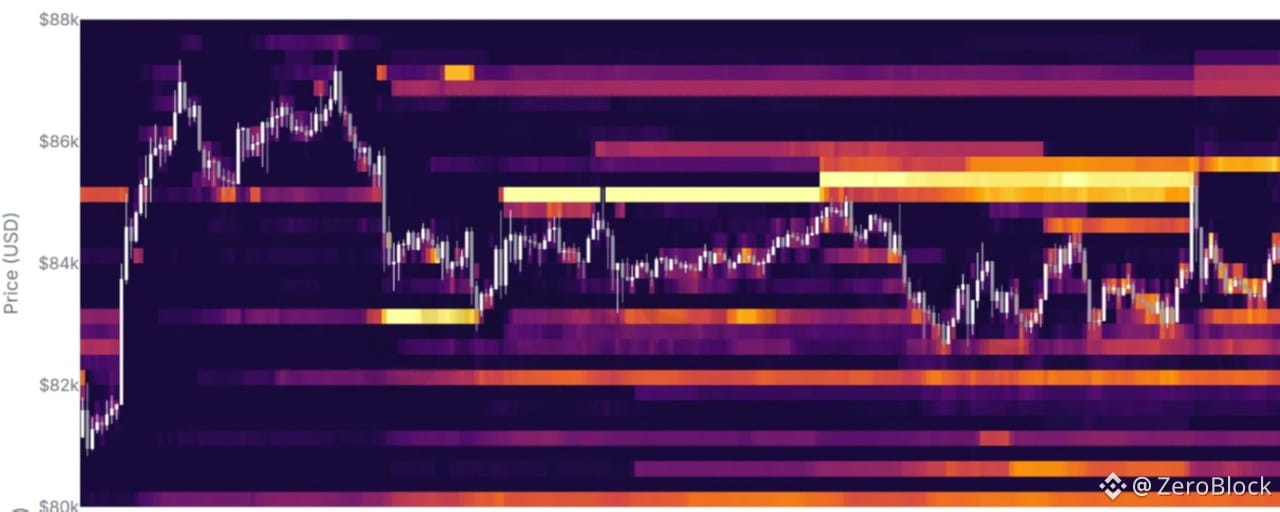
What caught my attention with Bitcoin is not the move above $85K.
It is the difference between what the derivatives market is expecting and what spot buyers are actually doing.
BTC has already delivered a strong Q3 with a 42% gain. Now October is starting with price above a level that buyers struggled to reclaim for several days.
The $85K breakout matters.
Glassnode data suggests much of the sell wall around that area has already been absorbed. If liquidity above price remains thin then Bitcoin could move faster if fresh buyers enter.
The macro picture has also become less restrictive.
Rate hike expectations reportedly dropped from around 70% to 26% as markets started pricing a greater chance of a pause.
That can reduce some pressure on risk assets.
But this is where I would be careful with the word breakout.
Spot demand has not fully confirmed the move yet.
US spot Bitcoin ETFs ended September with around $3.1B in net outflows after a nine day inflow streak. Wednesday alone saw around $148.7M in net outflows.
At the same time futures positioning has started leaning more toward longs.
That creates a divergence.
Traders are becoming more comfortable positioning for higher prices while spot flows are not showing the same strength.
There is also another supply zone above.
Around $136.72M in BTC sell orders are reportedly stacked between $89K and $109K on Coinbase.
So even if $85K is cleared the market still has meaningful overhead liquidity to deal with.
For me the most important question is simple.
Can Bitcoin hold $85K when the short term excitement fades?
If BTC stays above $85K while ETF flows recover then the breakout has stronger confirmation behind it.
If ETF outflows continue while futures longs increase then the setup becomes more fragile.
That does not automatically mean a crash.
It simply means leveraged traders could be getting ahead of actual spot demand.
I would watch $85K as the first line.
A successful retest would tell me the old resistance is becoming support.
A move back below it would make the recent breakout much less convincing.
October has started with a strong move.
Now Bitcoin needs to prove that $85K is not just another level that traders briefly pushed through.
Bitcoin clears $85K, but is ‘Uptober’ setting up a bull trap?
Bitcoin Has An $85K Confirmation Test
What caught my attention with Bitcoin is not the move above $85K.
It is the difference between what the derivatives market is expecting and what spot buyers are actually doing.
BTC has already delivered a strong Q3 with a 42% gain. Now October is starting with price above a level that buyers struggled to reclaim for several days.
The $85K breakout matters.
Glassnode data suggests much of the sell wall around that area has already been absorbed. If liquidity above price remains thin then Bitcoin could move faster if fresh buyers enter.
The macro picture has also become less restrictive.
Rate hike expectations reportedly dropped from around 70% to 26% as markets started pricing a greater chance of a pause.
That can reduce some pressure on risk assets.
But this is where I would be careful with the word breakout.
Spot demand has not fully confirmed the move yet.
US spot Bitcoin ETFs ended September with around $3.1B in net outflows after a nine day inflow streak. Wednesday alone saw around $148.7M in net outflows.
At the same time futures positioning has started leaning more toward longs.
That creates a divergence.
Traders are becoming more comfortable positioning for higher prices while spot flows are not showing the same strength.
There is also another supply zone above.
Around $136.72M in BTC sell orders are reportedly stacked between $89K and $109K on Coinbase.
So even if $85K is cleared the market still has meaningful overhead liquidity to deal with.
For me the most important question is simple.
Can Bitcoin hold $85K when the short term excitement fades?
If BTC stays above $85K while ETF flows recover then the breakout has stronger confirmation behind it.
If ETF outflows continue while futures longs increase then the setup becomes more fragile.
That does not automatically mean a crash.
It simply means leveraged traders could be getting ahead of actual spot demand.
I would watch $85K as the first line.
A successful retest would tell me the old resistance is becoming support.
A move back below it would make the recent breakout much less convincing.
October has started with a strong move.
Now Bitcoin needs to prove that $85K is not just another level that traders briefly pushed through.
What caught my attention with Bitcoin is not the move above $85K.
It is the difference between what the derivatives market is expecting and what spot buyers are actually doing.
BTC has already delivered a strong Q3 with a 42% gain. Now October is starting with price above a level that buyers struggled to reclaim for several days.
The $85K breakout matters.
Glassnode data suggests much of the sell wall around that area has already been absorbed. If liquidity above price remains thin then Bitcoin could move faster if fresh buyers enter.
The macro picture has also become less restrictive.
Rate hike expectations reportedly dropped from around 70% to 26% as markets started pricing a greater chance of a pause.
That can reduce some pressure on risk assets.
But this is where I would be careful with the word breakout.
Spot demand has not fully confirmed the move yet.
US spot Bitcoin ETFs ended September with around $3.1B in net outflows after a nine day inflow streak. Wednesday alone saw around $148.7M in net outflows.
At the same time futures positioning has started leaning more toward longs.
That creates a divergence.
Traders are becoming more comfortable positioning for higher prices while spot flows are not showing the same strength.
There is also another supply zone above.
Around $136.72M in BTC sell orders are reportedly stacked between $89K and $109K on Coinbase.
So even if $85K is cleared the market still has meaningful overhead liquidity to deal with.
For me the most important question is simple.
Can Bitcoin hold $85K when the short term excitement fades?
If BTC stays above $85K while ETF flows recover then the breakout has stronger confirmation behind it.
If ETF outflows continue while futures longs increase then the setup becomes more fragile.
That does not automatically mean a crash.
It simply means leveraged traders could be getting ahead of actual spot demand.
I would watch $85K as the first line.
A successful retest would tell me the old resistance is becoming support.
A move back below it would make the recent breakout much less convincing.
October has started with a strong move.
Now Bitcoin needs to prove that $85K is not just another level that traders briefly pushed through.
83
·
--

Article
Can AAVE crypto reach $200? THIS overbought signal raises concernsAAVE Has A $200 Test
What caught my attention with AAVE is not the 20% weekly rally.
It is the difference between what the chart is showing and what the protocol is doing underneath it.
AAVE has pushed above $180 and recovered toward levels last seen around the beginning of the year. The token is also up more than 60% recently while AAVE/BTC has gained for four straight weeks.
That tells me this is not simply AAVE moving because Bitcoin moved higher.
But there is a problem.
The technical setup is getting stretched.
AAVE/BTC is already up more than 10% this month and the token is approaching the $200 area. After a move this fast some holders sitting near breakeven may start taking profits if momentum slows.
There is also a rotation risk.
Part of AAVE's recent strength appears to be coming from capital moving away from Bitcoin and toward altcoins. If Bitcoin dominance starts rising again then some of that capital could rotate back.
That would make the path toward $200 harder.
But the onchain data gives AAVE another layer.
Aave has reportedly processed more than $1.1 trillion in cumulative borrow volume.
DeFi activity is also improving. TVL reportedly reached almost $20B after rising around 18% from the previous month while fees crossed $37M.
That matters because it gives the rally something beyond chart momentum.
Price is rising while the underlying lending activity is also expanding.
Still I would not treat stronger fundamentals as protection against a correction.
AAVE can have growing TVL and fees while traders take profits at the same time.
For me the $200 area is therefore less about predicting whether AAVE reaches it and more about watching how price behaves if it gets there.
If buyers push through $200 with strong spot demand then the rally has another confirmation point.
If AAVE stalls below $200 while AAVE/BTC starts weakening then the recent rotation could be losing momentum.
The key support from here is around $180.
Holding that area would keep the current structure intact.
Losing it would make me more cautious about the strength of the breakout.
AAVE has real usage behind the move.
Now the question is whether demand can keep absorbing profit taking as price approaches $200.
Can AAVE crypto reach $200? THIS overbought signal raises concerns
AAVE Has A $200 Test
What caught my attention with AAVE is not the 20% weekly rally.
It is the difference between what the chart is showing and what the protocol is doing underneath it.
AAVE has pushed above $180 and recovered toward levels last seen around the beginning of the year. The token is also up more than 60% recently while AAVE/BTC has gained for four straight weeks.
That tells me this is not simply AAVE moving because Bitcoin moved higher.
But there is a problem.
The technical setup is getting stretched.
AAVE/BTC is already up more than 10% this month and the token is approaching the $200 area. After a move this fast some holders sitting near breakeven may start taking profits if momentum slows.
There is also a rotation risk.
Part of AAVE's recent strength appears to be coming from capital moving away from Bitcoin and toward altcoins. If Bitcoin dominance starts rising again then some of that capital could rotate back.
That would make the path toward $200 harder.
But the onchain data gives AAVE another layer.
Aave has reportedly processed more than $1.1 trillion in cumulative borrow volume.
DeFi activity is also improving. TVL reportedly reached almost $20B after rising around 18% from the previous month while fees crossed $37M.
That matters because it gives the rally something beyond chart momentum.
Price is rising while the underlying lending activity is also expanding.
Still I would not treat stronger fundamentals as protection against a correction.
AAVE can have growing TVL and fees while traders take profits at the same time.
For me the $200 area is therefore less about predicting whether AAVE reaches it and more about watching how price behaves if it gets there.
If buyers push through $200 with strong spot demand then the rally has another confirmation point.
If AAVE stalls below $200 while AAVE/BTC starts weakening then the recent rotation could be losing momentum.
The key support from here is around $180.
Holding that area would keep the current structure intact.
Losing it would make me more cautious about the strength of the breakout.
AAVE has real usage behind the move.
Now the question is whether demand can keep absorbing profit taking as price approaches $200.
What caught my attention with AAVE is not the 20% weekly rally.
It is the difference between what the chart is showing and what the protocol is doing underneath it.
AAVE has pushed above $180 and recovered toward levels last seen around the beginning of the year. The token is also up more than 60% recently while AAVE/BTC has gained for four straight weeks.
That tells me this is not simply AAVE moving because Bitcoin moved higher.
But there is a problem.
The technical setup is getting stretched.
AAVE/BTC is already up more than 10% this month and the token is approaching the $200 area. After a move this fast some holders sitting near breakeven may start taking profits if momentum slows.
There is also a rotation risk.
Part of AAVE's recent strength appears to be coming from capital moving away from Bitcoin and toward altcoins. If Bitcoin dominance starts rising again then some of that capital could rotate back.
That would make the path toward $200 harder.
But the onchain data gives AAVE another layer.
Aave has reportedly processed more than $1.1 trillion in cumulative borrow volume.
DeFi activity is also improving. TVL reportedly reached almost $20B after rising around 18% from the previous month while fees crossed $37M.
That matters because it gives the rally something beyond chart momentum.
Price is rising while the underlying lending activity is also expanding.
Still I would not treat stronger fundamentals as protection against a correction.
AAVE can have growing TVL and fees while traders take profits at the same time.
For me the $200 area is therefore less about predicting whether AAVE reaches it and more about watching how price behaves if it gets there.
If buyers push through $200 with strong spot demand then the rally has another confirmation point.
If AAVE stalls below $200 while AAVE/BTC starts weakening then the recent rotation could be losing momentum.
The key support from here is around $180.
Holding that area would keep the current structure intact.
Losing it would make me more cautious about the strength of the breakout.
AAVE has real usage behind the move.
Now the question is whether demand can keep absorbing profit taking as price approaches $200.
104
·
--

Article
TRUMP Has A $2.20 TestWhat caught my attention with TRUMP is not the new dinner announcement.
It is the fact that the token is still sitting inside a very tight price structure while a new incentive is being introduced for holders.
The organizers have announced a November 22 gala for the top 185 $TRUMP holders. Eligibility is based on time weighted holdings during the measurement period rather than simply holding the largest amount on one day. The top 29 also qualify for a VIP reception.
That structure itself could create some short term demand because holders have an incentive to maintain their positions.
But holding more tokens to qualify for an event is not the same thing as organic market demand.
That distinction matters for the chart.
TRUMP recently moved around the $2 area and the article data shows a broader range around $1.80 to $2.20.
For me $2.20 is the first real test.
If buyers can reclaim that level and hold it then the market could start testing higher resistance.
If TRUMP keeps getting rejected around $2.20 then the dinner narrative may simply create temporary volatility without changing the underlying structure.
There is another detail worth watching.
The event rules use a November 12 snapshot. That means the incentive is tied to sustained holdings rather than a single purchase immediately before the dinner.
This can affect how holders position themselves during the coming weeks.
But it also creates a possible risk.
If some traders accumulate tokens mainly to qualify and later reduce their positions after the snapshot then the demand created by the event could prove temporary.
Previous TRUMP holder events also attracted political and regulatory scrutiny. In April 2026 Senators Elizabeth Warren Adam Schiff and Richard Blumenthal requested documents related to an earlier event and asked about the president's role and potential financial interests. Those were requests for investigation rather than findings of wrongdoing.
So I would separate the political debate from the chart.
The market only needs to answer one immediate question.
Can TRUMP turn $2.20 into support?
If yes then the November event gives traders another catalyst to watch.
If no then the dinner headline may remain just that.
For me the event creates a potential demand incentive.
The chart still has to prove whether that incentive is strong enough to change the trend.
TRUMP Has A $2.20 Test
What caught my attention with TRUMP is not the new dinner announcement.
It is the fact that the token is still sitting inside a very tight price structure while a new incentive is being introduced for holders.
The organizers have announced a November 22 gala for the top 185 $TRUMP holders. Eligibility is based on time weighted holdings during the measurement period rather than simply holding the largest amount on one day. The top 29 also qualify for a VIP reception.
That structure itself could create some short term demand because holders have an incentive to maintain their positions.
But holding more tokens to qualify for an event is not the same thing as organic market demand.
That distinction matters for the chart.
TRUMP recently moved around the $2 area and the article data shows a broader range around $1.80 to $2.20.
For me $2.20 is the first real test.
If buyers can reclaim that level and hold it then the market could start testing higher resistance.
If TRUMP keeps getting rejected around $2.20 then the dinner narrative may simply create temporary volatility without changing the underlying structure.
There is another detail worth watching.
The event rules use a November 12 snapshot. That means the incentive is tied to sustained holdings rather than a single purchase immediately before the dinner.
This can affect how holders position themselves during the coming weeks.
But it also creates a possible risk.
If some traders accumulate tokens mainly to qualify and later reduce their positions after the snapshot then the demand created by the event could prove temporary.
Previous TRUMP holder events also attracted political and regulatory scrutiny. In April 2026 Senators Elizabeth Warren Adam Schiff and Richard Blumenthal requested documents related to an earlier event and asked about the president's role and potential financial interests. Those were requests for investigation rather than findings of wrongdoing.
So I would separate the political debate from the chart.
The market only needs to answer one immediate question.
Can TRUMP turn $2.20 into support?
If yes then the November event gives traders another catalyst to watch.
If no then the dinner headline may remain just that.
For me the event creates a potential demand incentive.
The chart still has to prove whether that incentive is strong enough to change the trend.
It is the fact that the token is still sitting inside a very tight price structure while a new incentive is being introduced for holders.
The organizers have announced a November 22 gala for the top 185 $TRUMP holders. Eligibility is based on time weighted holdings during the measurement period rather than simply holding the largest amount on one day. The top 29 also qualify for a VIP reception.
That structure itself could create some short term demand because holders have an incentive to maintain their positions.
But holding more tokens to qualify for an event is not the same thing as organic market demand.
That distinction matters for the chart.
TRUMP recently moved around the $2 area and the article data shows a broader range around $1.80 to $2.20.
For me $2.20 is the first real test.
If buyers can reclaim that level and hold it then the market could start testing higher resistance.
If TRUMP keeps getting rejected around $2.20 then the dinner narrative may simply create temporary volatility without changing the underlying structure.
There is another detail worth watching.
The event rules use a November 12 snapshot. That means the incentive is tied to sustained holdings rather than a single purchase immediately before the dinner.
This can affect how holders position themselves during the coming weeks.
But it also creates a possible risk.
If some traders accumulate tokens mainly to qualify and later reduce their positions after the snapshot then the demand created by the event could prove temporary.
Previous TRUMP holder events also attracted political and regulatory scrutiny. In April 2026 Senators Elizabeth Warren Adam Schiff and Richard Blumenthal requested documents related to an earlier event and asked about the president's role and potential financial interests. Those were requests for investigation rather than findings of wrongdoing.
So I would separate the political debate from the chart.
The market only needs to answer one immediate question.
Can TRUMP turn $2.20 into support?
If yes then the November event gives traders another catalyst to watch.
If no then the dinner headline may remain just that.
For me the event creates a potential demand incentive.
The chart still has to prove whether that incentive is strong enough to change the trend.
419
·
--
Article
XRP Has A $1.54 Supply TestWhat caught my attention with XRP is not the move toward $1.55.
It is the supply and demand meeting at the same time.
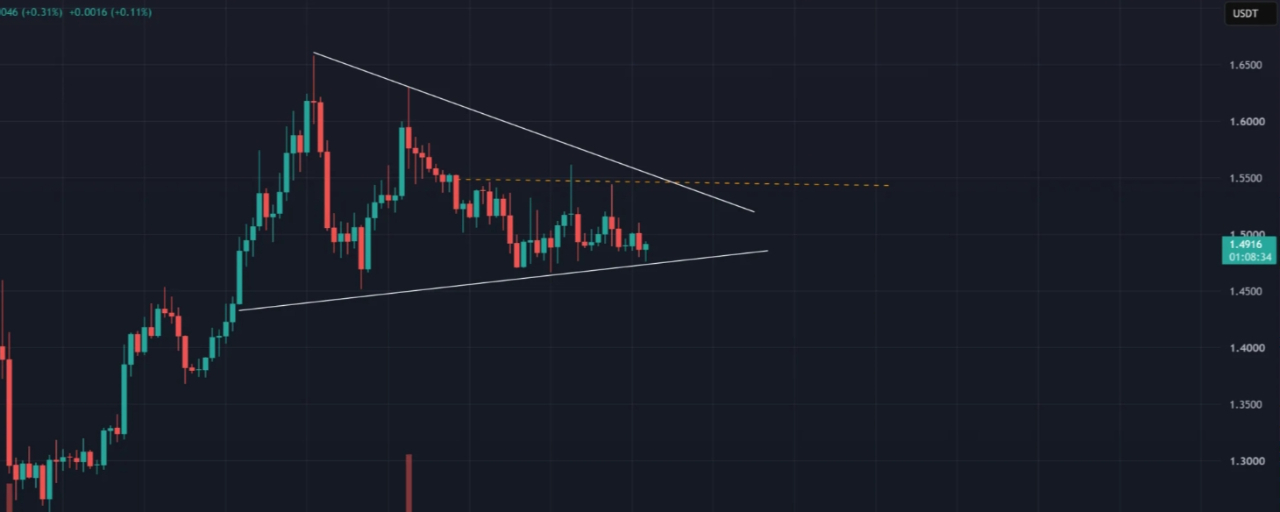
XRP has been forming a tightening structure after reaching around $1.665. Each recovery has created a lower high while buyers have continued defending the rising support around $1.45 to $1.47.
That puts $1.54 in the middle of the current battle.
XRP is trading around $1.49 with RSI near 46.02. Momentum is not strong enough to call this a confirmed breakout setup but buyers have also not completely lost control.
Then the supply side gets interesting.
Ripple released another 1 billion XRP through four scheduled unlocks of 400M 300M 300M and 100M tokens.
The headline number sounds large.
But the more useful data is what happens after the unlock.
A token release does not automatically mean 1 billion XRP will suddenly enter the market for sale. Some of the released supply can return to escrow.
That means exchange balances and actual wallet flows matter more than the unlock headline itself.
At the same time Evernorth plans to build an XRP treasury backed by more than $1.1B in committed capital and reportedly intends to place around 566M XRP into the treasury.
If that capital is actually deployed then it creates another potential source of demand.
But I would separate committed capital from executed buying.
The market still needs to see the XRP move happen.
That creates an interesting supply test.
If newly released XRP remains away from exchanges while institutional demand starts absorbing available supply then the additional tokens may have limited short term impact.
If exchange balances rise sharply after the unlock then the situation changes.
Now back to the chart.
For me $1.54 is the level that matters.
A clean breakout and hold above $1.54 would put $1.70 back into focus.
But repeated rejection around $1.54 would tell me that sellers are still controlling the upper part of the range.
The real signal is therefore not the 1 billion XRP unlock by itself.
It is where those tokens go after the unlock.
XRP has potential demand coming in.
It also has new supply being released.
The next move will show which side is actually stronger.
XRP Has A $1.54 Supply Test
What caught my attention with XRP is not the move toward $1.55.
It is the supply and demand meeting at the same time.
XRP has been forming a tightening structure after reaching around $1.665. Each recovery has created a lower high while buyers have continued defending the rising support around $1.45 to $1.47.
That puts $1.54 in the middle of the current battle.
XRP is trading around $1.49 with RSI near 46.02. Momentum is not strong enough to call this a confirmed breakout setup but buyers have also not completely lost control.
Then the supply side gets interesting.
Ripple released another 1 billion XRP through four scheduled unlocks of 400M 300M 300M and 100M tokens.
The headline number sounds large.
But the more useful data is what happens after the unlock.
A token release does not automatically mean 1 billion XRP will suddenly enter the market for sale. Some of the released supply can return to escrow.
That means exchange balances and actual wallet flows matter more than the unlock headline itself.
At the same time Evernorth plans to build an XRP treasury backed by more than $1.1B in committed capital and reportedly intends to place around 566M XRP into the treasury.
If that capital is actually deployed then it creates another potential source of demand.
But I would separate committed capital from executed buying.
The market still needs to see the XRP move happen.
That creates an interesting supply test.
If newly released XRP remains away from exchanges while institutional demand starts absorbing available supply then the additional tokens may have limited short term impact.
If exchange balances rise sharply after the unlock then the situation changes.
Now back to the chart.
For me $1.54 is the level that matters.
A clean breakout and hold above $1.54 would put $1.70 back into focus.
But repeated rejection around $1.54 would tell me that sellers are still controlling the upper part of the range.
The real signal is therefore not the 1 billion XRP unlock by itself.
It is where those tokens go after the unlock.
XRP has potential demand coming in.
It also has new supply being released.
The next move will show which side is actually stronger.
It is the supply and demand meeting at the same time.
XRP has been forming a tightening structure after reaching around $1.665. Each recovery has created a lower high while buyers have continued defending the rising support around $1.45 to $1.47.
That puts $1.54 in the middle of the current battle.
XRP is trading around $1.49 with RSI near 46.02. Momentum is not strong enough to call this a confirmed breakout setup but buyers have also not completely lost control.
Then the supply side gets interesting.
Ripple released another 1 billion XRP through four scheduled unlocks of 400M 300M 300M and 100M tokens.
The headline number sounds large.
But the more useful data is what happens after the unlock.
A token release does not automatically mean 1 billion XRP will suddenly enter the market for sale. Some of the released supply can return to escrow.
That means exchange balances and actual wallet flows matter more than the unlock headline itself.
At the same time Evernorth plans to build an XRP treasury backed by more than $1.1B in committed capital and reportedly intends to place around 566M XRP into the treasury.
If that capital is actually deployed then it creates another potential source of demand.
But I would separate committed capital from executed buying.
The market still needs to see the XRP move happen.
That creates an interesting supply test.
If newly released XRP remains away from exchanges while institutional demand starts absorbing available supply then the additional tokens may have limited short term impact.
If exchange balances rise sharply after the unlock then the situation changes.
Now back to the chart.
For me $1.54 is the level that matters.
A clean breakout and hold above $1.54 would put $1.70 back into focus.
But repeated rejection around $1.54 would tell me that sellers are still controlling the upper part of the range.
The real signal is therefore not the 1 billion XRP unlock by itself.
It is where those tokens go after the unlock.
XRP has potential demand coming in.
It also has new supply being released.
The next move will show which side is actually stronger.
152
·
--

Article
QNT Has A $300 Supply TestWhat caught my attention with QNT is not the 250% weekly rally.
It is how quickly the market moved from $232 back toward $280 after touching around $330.
That kind of move creates a very different problem for the chart.
Early buyers are sitting on large unrealized gains. That means the same buyers who helped push QNT higher can also become potential sellers if momentum starts fading.
The $300 area now looks important.
QNT already reached above it before pulling back. So another move toward $300 will tell us more about the strength of the current recovery.
The RSI was around 68.04 after previously moving above 80.
That tells me momentum has cooled from extreme levels but remains elevated.
Then there is the wallet activity.
A dormant wallet that had reportedly been inactive for around seven years moved 25,776 QNT worth roughly $6.97M into new wallets.
This is the part I would watch closely.
The tokens did not move directly to a centralized exchange. So there is no confirmed evidence that the holder is preparing to sell.
But the wallet reportedly still holds around 600,000 QNT worth roughly $160M.
That changes the supply discussion.
If more of those tokens start moving toward exchanges then the market could begin pricing in additional potential supply.
For now it is only a warning signal.
The recent rally has already created enough profit for early holders to consider taking some money off the table. The dormant wallet movement adds another layer of uncertainty without proving that selling has started.
For me $300 is the cleanest level to watch.
If QNT reclaims $300 and holds it then the market could start testing the previous $330 high again.
If price gets rejected around $300 then a deeper pullback would not be surprising after such an extreme weekly move.
The bigger warning would be a combination of falling price and increasing exchange deposits from large dormant holders.
That would turn wallet activity from an interesting signal into actual supply pressure.
QNT has already shown that buyers can move the price quickly.
Now the question is whether those buyers can absorb the profits waiting above them.
QNT Has A $300 Supply Test
What caught my attention with QNT is not the 250% weekly rally.
It is how quickly the market moved from $232 back toward $280 after touching around $330.
That kind of move creates a very different problem for the chart.
Early buyers are sitting on large unrealized gains. That means the same buyers who helped push QNT higher can also become potential sellers if momentum starts fading.
The $300 area now looks important.
QNT already reached above it before pulling back. So another move toward $300 will tell us more about the strength of the current recovery.
The RSI was around 68.04 after previously moving above 80.
That tells me momentum has cooled from extreme levels but remains elevated.
Then there is the wallet activity.
A dormant wallet that had reportedly been inactive for around seven years moved 25,776 QNT worth roughly $6.97M into new wallets.
This is the part I would watch closely.
The tokens did not move directly to a centralized exchange. So there is no confirmed evidence that the holder is preparing to sell.
But the wallet reportedly still holds around 600,000 QNT worth roughly $160M.
That changes the supply discussion.
If more of those tokens start moving toward exchanges then the market could begin pricing in additional potential supply.
For now it is only a warning signal.
The recent rally has already created enough profit for early holders to consider taking some money off the table. The dormant wallet movement adds another layer of uncertainty without proving that selling has started.
For me $300 is the cleanest level to watch.
If QNT reclaims $300 and holds it then the market could start testing the previous $330 high again.
If price gets rejected around $300 then a deeper pullback would not be surprising after such an extreme weekly move.
The bigger warning would be a combination of falling price and increasing exchange deposits from large dormant holders.
That would turn wallet activity from an interesting signal into actual supply pressure.
QNT has already shown that buyers can move the price quickly.
Now the question is whether those buyers can absorb the profits waiting above them.
It is how quickly the market moved from $232 back toward $280 after touching around $330.
That kind of move creates a very different problem for the chart.
Early buyers are sitting on large unrealized gains. That means the same buyers who helped push QNT higher can also become potential sellers if momentum starts fading.
The $300 area now looks important.
QNT already reached above it before pulling back. So another move toward $300 will tell us more about the strength of the current recovery.
The RSI was around 68.04 after previously moving above 80.
That tells me momentum has cooled from extreme levels but remains elevated.
Then there is the wallet activity.
A dormant wallet that had reportedly been inactive for around seven years moved 25,776 QNT worth roughly $6.97M into new wallets.
This is the part I would watch closely.
The tokens did not move directly to a centralized exchange. So there is no confirmed evidence that the holder is preparing to sell.
But the wallet reportedly still holds around 600,000 QNT worth roughly $160M.
That changes the supply discussion.
If more of those tokens start moving toward exchanges then the market could begin pricing in additional potential supply.
For now it is only a warning signal.
The recent rally has already created enough profit for early holders to consider taking some money off the table. The dormant wallet movement adds another layer of uncertainty without proving that selling has started.
For me $300 is the cleanest level to watch.
If QNT reclaims $300 and holds it then the market could start testing the previous $330 high again.
If price gets rejected around $300 then a deeper pullback would not be surprising after such an extreme weekly move.
The bigger warning would be a combination of falling price and increasing exchange deposits from large dormant holders.
That would turn wallet activity from an interesting signal into actual supply pressure.
QNT has already shown that buyers can move the price quickly.
Now the question is whether those buyers can absorb the profits waiting above them.
504
·
--

Article
Europe Has A DeFi Definition ProblemWhat caught my attention with the latest ESMA proposal is not simply that Europe wants more DeFi regulation.
It is the question of what actually counts as decentralized.
ESMA is proposing clearer criteria for deciding which activities can be considered genuinely decentralized. It also wants a new regulated crypto asset service for firms that provide users with access to DeFi protocols.
That creates an interesting problem.
A protocol can run through smart contracts on a public blockchain while the interface users depend on is still operated by a company.
So where does decentralization actually end?
If the protocol is decentralized but the main access point is centralized then regulators may have a much easier target.
This matters because MiCA currently excludes crypto asset services provided in a fully decentralized way without an intermediary. ESMA is now looking at how that boundary should work as DeFi develops.
The second part of the proposal is tokenized securities.
ESMA says Europe needs a framework for tokenized securities and on chain settlement that can support an integrated European tokenized capital market and cross border activity.
That could become more important than the DeFi headline itself.
Tokenization is still relatively small today but regulators are clearly treating it as something that could become part of traditional financial infrastructure. ESMA has already identified tokenization as an area where adoption is building while also pointing to problems around interoperability and on chain cash settlement.
There is also a clear compliance direction.
ESMA wants stronger supervisory powers around areas such as fraud investor protection and AML enforcement. The proposal also includes new rules around crypto asset classification.
For me the interesting part is not whether Europe regulates DeFi.
It is how the final rules define responsibility.
If an interface provides access to a decentralized protocol then the interface could become the regulated layer even when the underlying smart contracts remain decentralized.
That could reshape how DeFi products are built and distributed across Europe.
The technology may remain permissionless.
But the front door could become regulated.
Europe Has A DeFi Definition Problem
What caught my attention with the latest ESMA proposal is not simply that Europe wants more DeFi regulation.
It is the question of what actually counts as decentralized.
ESMA is proposing clearer criteria for deciding which activities can be considered genuinely decentralized. It also wants a new regulated crypto asset service for firms that provide users with access to DeFi protocols.
That creates an interesting problem.
A protocol can run through smart contracts on a public blockchain while the interface users depend on is still operated by a company.
So where does decentralization actually end?
If the protocol is decentralized but the main access point is centralized then regulators may have a much easier target.
This matters because MiCA currently excludes crypto asset services provided in a fully decentralized way without an intermediary. ESMA is now looking at how that boundary should work as DeFi develops.
The second part of the proposal is tokenized securities.
ESMA says Europe needs a framework for tokenized securities and on chain settlement that can support an integrated European tokenized capital market and cross border activity.
That could become more important than the DeFi headline itself.
Tokenization is still relatively small today but regulators are clearly treating it as something that could become part of traditional financial infrastructure. ESMA has already identified tokenization as an area where adoption is building while also pointing to problems around interoperability and on chain cash settlement.
There is also a clear compliance direction.
ESMA wants stronger supervisory powers around areas such as fraud investor protection and AML enforcement. The proposal also includes new rules around crypto asset classification.
For me the interesting part is not whether Europe regulates DeFi.
It is how the final rules define responsibility.
If an interface provides access to a decentralized protocol then the interface could become the regulated layer even when the underlying smart contracts remain decentralized.
That could reshape how DeFi products are built and distributed across Europe.
The technology may remain permissionless.
But the front door could become regulated.
It is the question of what actually counts as decentralized.
ESMA is proposing clearer criteria for deciding which activities can be considered genuinely decentralized. It also wants a new regulated crypto asset service for firms that provide users with access to DeFi protocols.
That creates an interesting problem.
A protocol can run through smart contracts on a public blockchain while the interface users depend on is still operated by a company.
So where does decentralization actually end?
If the protocol is decentralized but the main access point is centralized then regulators may have a much easier target.
This matters because MiCA currently excludes crypto asset services provided in a fully decentralized way without an intermediary. ESMA is now looking at how that boundary should work as DeFi develops.
The second part of the proposal is tokenized securities.
ESMA says Europe needs a framework for tokenized securities and on chain settlement that can support an integrated European tokenized capital market and cross border activity.
That could become more important than the DeFi headline itself.
Tokenization is still relatively small today but regulators are clearly treating it as something that could become part of traditional financial infrastructure. ESMA has already identified tokenization as an area where adoption is building while also pointing to problems around interoperability and on chain cash settlement.
There is also a clear compliance direction.
ESMA wants stronger supervisory powers around areas such as fraud investor protection and AML enforcement. The proposal also includes new rules around crypto asset classification.
For me the interesting part is not whether Europe regulates DeFi.
It is how the final rules define responsibility.
If an interface provides access to a decentralized protocol then the interface could become the regulated layer even when the underlying smart contracts remain decentralized.
That could reshape how DeFi products are built and distributed across Europe.
The technology may remain permissionless.
But the front door could become regulated.
149
·
--
Partly True
Article
HYPE Has A $89.6 TestWhat caught my attention with HYPE is not the 3.48% move.
It is what happened before the move.
Hyperliquid reportedly completed a $329M OTC sale involving 3.75M HYPE tokens to one institutional buyer. That matters because a large token sale can create short term supply pressure. With the transaction handled OTC the market avoided seeing all of that supply hit the open market at once.
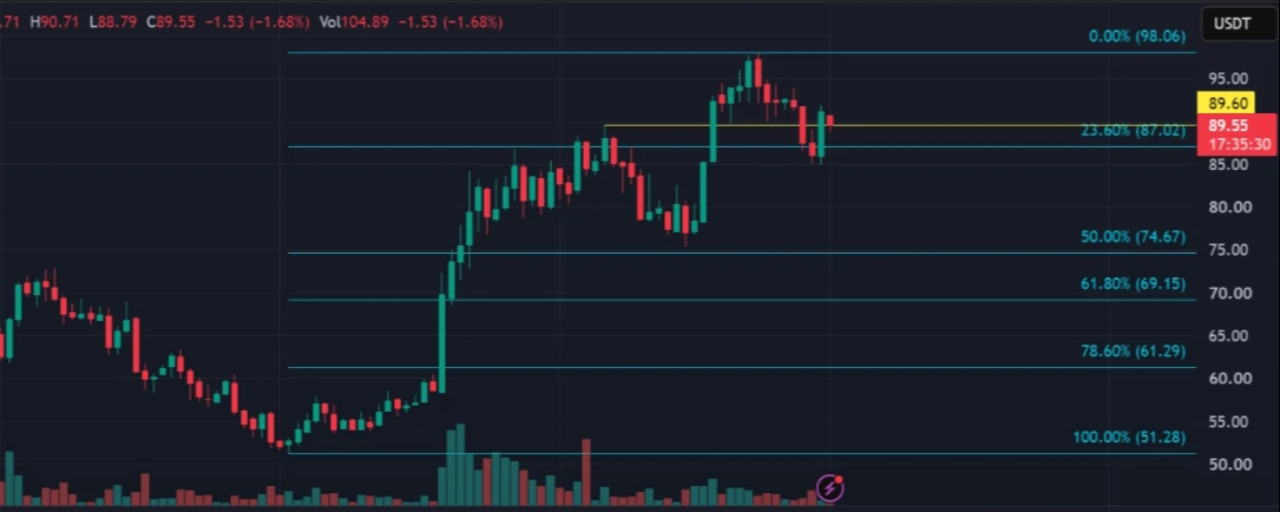
HYPE then recovered toward $89.55.
But this is where I would slow down.
The price is now sitting around a level that has already acted as support before. On the 4 hour chart $89.6 is the important area because HYPE broke below it near the end of September and is now trying to reclaim it.
The daily chart also shows a similar situation.
HYPE has been trading around the 23.6% Fibonacci level since mid September. Buyers managed to defend that area and push price back toward $90.
That is a positive change.
But the momentum is still not strong.
Daily RSI is around 54.28 which gives buyers a small advantage without showing aggressive momentum. The 4 hour RSI is even closer to neutral at around 52.09.
OBV is another detail I would watch.
It had been trending higher but recently flattened. On the 4 hour chart OBV also stabilized after a sharp decline.
For me this suggests selling pressure may have cooled but fresh demand has not clearly taken control yet.
That makes $89.6 the level I care about most.
If HYPE reclaims $89.6 and holds it as support then the next area I would watch is $92 to $94.
If price fails to hold $89.6 then the recent recovery becomes less convincing and HYPE could remain stuck in consolidation or move lower again.
The OTC sale reduced one obvious short term supply concern.
But removing selling pressure is not the same as creating new demand.
Now the chart needs to show whether buyers can actually turn $89.6 back into support.
That reaction matters more to me than the 3.5% daily gain.
HYPE Has A $89.6 Test
What caught my attention with HYPE is not the 3.48% move.
It is what happened before the move.
Hyperliquid reportedly completed a $329M OTC sale involving 3.75M HYPE tokens to one institutional buyer. That matters because a large token sale can create short term supply pressure. With the transaction handled OTC the market avoided seeing all of that supply hit the open market at once.
HYPE then recovered toward $89.55.
But this is where I would slow down.
The price is now sitting around a level that has already acted as support before. On the 4 hour chart $89.6 is the important area because HYPE broke below it near the end of September and is now trying to reclaim it.
The daily chart also shows a similar situation.
HYPE has been trading around the 23.6% Fibonacci level since mid September. Buyers managed to defend that area and push price back toward $90.
That is a positive change.
But the momentum is still not strong.
Daily RSI is around 54.28 which gives buyers a small advantage without showing aggressive momentum. The 4 hour RSI is even closer to neutral at around 52.09.
OBV is another detail I would watch.
It had been trending higher but recently flattened. On the 4 hour chart OBV also stabilized after a sharp decline.
For me this suggests selling pressure may have cooled but fresh demand has not clearly taken control yet.
That makes $89.6 the level I care about most.
If HYPE reclaims $89.6 and holds it as support then the next area I would watch is $92 to $94.
If price fails to hold $89.6 then the recent recovery becomes less convincing and HYPE could remain stuck in consolidation or move lower again.
The OTC sale reduced one obvious short term supply concern.
But removing selling pressure is not the same as creating new demand.
Now the chart needs to show whether buyers can actually turn $89.6 back into support.
That reaction matters more to me than the 3.5% daily gain.
It is what happened before the move.
Hyperliquid reportedly completed a $329M OTC sale involving 3.75M HYPE tokens to one institutional buyer. That matters because a large token sale can create short term supply pressure. With the transaction handled OTC the market avoided seeing all of that supply hit the open market at once.
HYPE then recovered toward $89.55.
But this is where I would slow down.
The price is now sitting around a level that has already acted as support before. On the 4 hour chart $89.6 is the important area because HYPE broke below it near the end of September and is now trying to reclaim it.
The daily chart also shows a similar situation.
HYPE has been trading around the 23.6% Fibonacci level since mid September. Buyers managed to defend that area and push price back toward $90.
That is a positive change.
But the momentum is still not strong.
Daily RSI is around 54.28 which gives buyers a small advantage without showing aggressive momentum. The 4 hour RSI is even closer to neutral at around 52.09.
OBV is another detail I would watch.
It had been trending higher but recently flattened. On the 4 hour chart OBV also stabilized after a sharp decline.
For me this suggests selling pressure may have cooled but fresh demand has not clearly taken control yet.
That makes $89.6 the level I care about most.
If HYPE reclaims $89.6 and holds it as support then the next area I would watch is $92 to $94.
If price fails to hold $89.6 then the recent recovery becomes less convincing and HYPE could remain stuck in consolidation or move lower again.
The OTC sale reduced one obvious short term supply concern.
But removing selling pressure is not the same as creating new demand.
Now the chart needs to show whether buyers can actually turn $89.6 back into support.
That reaction matters more to me than the 3.5% daily gain.
3
753
·
--
Article
Ethereum Has A Q4 Outperformance TestWhat caught my attention with Ethereum is not just the 70.8% gain in Q3.
It is how quickly ETH changed its position after two difficult quarters.
Ethereum lost around 29.26% in Q1 and another 25.28% in Q2. Then Q3 delivered a 70.8% recovery. That was stronger than its previous quarterly high of 66.55% in Q3 2025.
ETH also outperformed Bitcoin by 42.71% during the quarter.
But I would not assume that one strong quarter guarantees another.
Historical data gives a reason to stay cautious. Ethereum's median Q4 return is reportedly around 0.36% compared with a historical average of 16.97%. Past returns do not predict the next quarter but they show why momentum alone is not enough.
The whale activity is also interesting.
A wallet associated with Ethereum co-founder Joseph Lubin transferred 133,298 ETH worth around $356.2M into a new wallet. This is a significant movement but it was not a direct exchange deposit. I would not treat it as confirmed selling or buying.
Another whale opened a $40.6M ETH long alongside a $33.62M Bitcoin short. That position is more interesting because it is designed to benefit from ETH outperforming BTC rather than simply betting on the entire market rising.
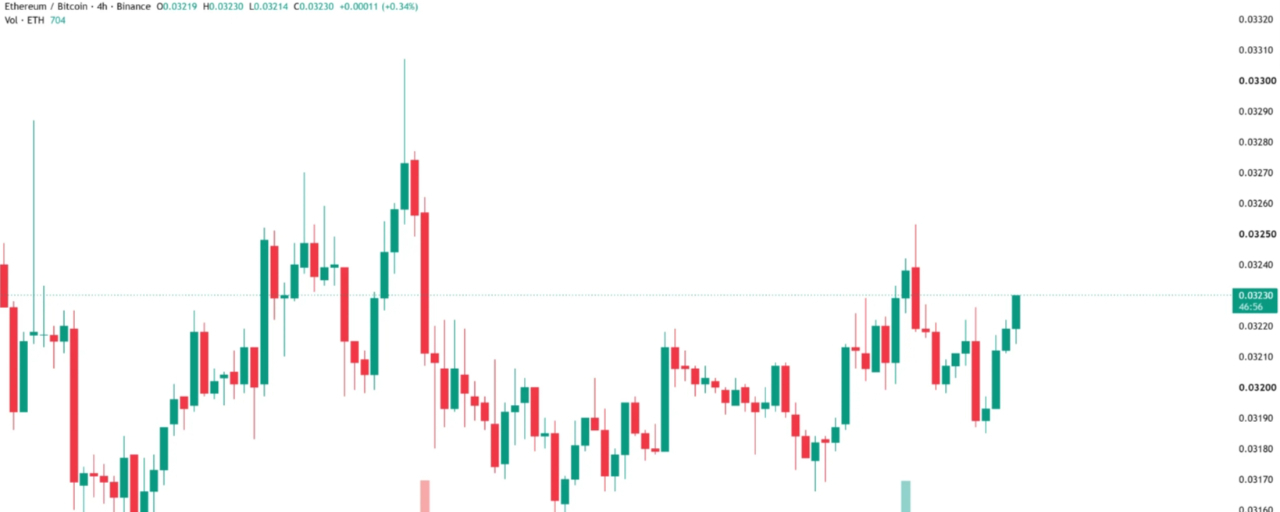
Now I am watching the ETH/BTC ratio.
It moved from around 0.0316 to 0.0325 before pulling back. Buyers defended the 0.0319 area and pushed it back toward 0.0323.
That level matters because ETH needs to maintain relative strength if the Q3 trend is going to continue.
Derivatives positioning is active too. Hyperliquid ETH open interest reportedly exceeds $3.1B while funding remains mildly positive around 0.00125% hourly.
That suggests long positioning is present but it also means leverage deserves attention.
For me the important question in Q4 is whether spot demand can support ETH while the ETH/BTC ratio continues holding higher levels.
If spot activity weakens then crowded expectations could unwind quickly.
ETH has already proved it can outperform Bitcoin for one quarter.
Now it needs to prove that the move has enough demand behind it to continue.
Ethereum Has A Q4 Outperformance Test
What caught my attention with Ethereum is not just the 70.8% gain in Q3.
It is how quickly ETH changed its position after two difficult quarters.
Ethereum lost around 29.26% in Q1 and another 25.28% in Q2. Then Q3 delivered a 70.8% recovery. That was stronger than its previous quarterly high of 66.55% in Q3 2025.
ETH also outperformed Bitcoin by 42.71% during the quarter.
But I would not assume that one strong quarter guarantees another.
Historical data gives a reason to stay cautious. Ethereum's median Q4 return is reportedly around 0.36% compared with a historical average of 16.97%. Past returns do not predict the next quarter but they show why momentum alone is not enough.
The whale activity is also interesting.
A wallet associated with Ethereum co-founder Joseph Lubin transferred 133,298 ETH worth around $356.2M into a new wallet. This is a significant movement but it was not a direct exchange deposit. I would not treat it as confirmed selling or buying.
Another whale opened a $40.6M ETH long alongside a $33.62M Bitcoin short. That position is more interesting because it is designed to benefit from ETH outperforming BTC rather than simply betting on the entire market rising.
Now I am watching the ETH/BTC ratio.
It moved from around 0.0316 to 0.0325 before pulling back. Buyers defended the 0.0319 area and pushed it back toward 0.0323.
That level matters because ETH needs to maintain relative strength if the Q3 trend is going to continue.
Derivatives positioning is active too. Hyperliquid ETH open interest reportedly exceeds $3.1B while funding remains mildly positive around 0.00125% hourly.
That suggests long positioning is present but it also means leverage deserves attention.
For me the important question in Q4 is whether spot demand can support ETH while the ETH/BTC ratio continues holding higher levels.
If spot activity weakens then crowded expectations could unwind quickly.
ETH has already proved it can outperform Bitcoin for one quarter.
Now it needs to prove that the move has enough demand behind it to continue.
It is how quickly ETH changed its position after two difficult quarters.
Ethereum lost around 29.26% in Q1 and another 25.28% in Q2. Then Q3 delivered a 70.8% recovery. That was stronger than its previous quarterly high of 66.55% in Q3 2025.
ETH also outperformed Bitcoin by 42.71% during the quarter.
But I would not assume that one strong quarter guarantees another.
Historical data gives a reason to stay cautious. Ethereum's median Q4 return is reportedly around 0.36% compared with a historical average of 16.97%. Past returns do not predict the next quarter but they show why momentum alone is not enough.
The whale activity is also interesting.
A wallet associated with Ethereum co-founder Joseph Lubin transferred 133,298 ETH worth around $356.2M into a new wallet. This is a significant movement but it was not a direct exchange deposit. I would not treat it as confirmed selling or buying.
Another whale opened a $40.6M ETH long alongside a $33.62M Bitcoin short. That position is more interesting because it is designed to benefit from ETH outperforming BTC rather than simply betting on the entire market rising.
Now I am watching the ETH/BTC ratio.
It moved from around 0.0316 to 0.0325 before pulling back. Buyers defended the 0.0319 area and pushed it back toward 0.0323.
That level matters because ETH needs to maintain relative strength if the Q3 trend is going to continue.
Derivatives positioning is active too. Hyperliquid ETH open interest reportedly exceeds $3.1B while funding remains mildly positive around 0.00125% hourly.
That suggests long positioning is present but it also means leverage deserves attention.
For me the important question in Q4 is whether spot demand can support ETH while the ETH/BTC ratio continues holding higher levels.
If spot activity weakens then crowded expectations could unwind quickly.
ETH has already proved it can outperform Bitcoin for one quarter.
Now it needs to prove that the move has enough demand behind it to continue.
1
199
·
--

Article
PERPTools Has A Different Perp Trading TestWhat caught my attention with PERPTools is not the $8M it just raised.
It is what the team is trying to connect together.
PERPTools has raised $3M in pre seed funding at a $30M FDV and another $5M seed round at an $80M FDV. But the more interesting part is that the project is being built by the team behind DEXTools and is using Orderly Network for its trading infrastructure.
That changes the usual problem for a new perp platform.
Most new trading venues have to find traders first and then find enough liquidity to make those traders stay.
PERPTools already has access to the DEXTools user base which reportedly includes around 30M traders.
The beta numbers are also worth watching.
The platform says it has already processed around $240M in beta volume before its token even exists.
But volume alone does not prove that the model works.
The real question is whether traders actually stay after the initial launch activity fades.
PERPTools already has three products live.
There is the Perp DEX for leveraged trading.
There is AI Arena where users can create autonomous trading agents with defined risk parameters and track their verified onchain PnL.
Then there is Tap Prediction which uses live perpetual price feeds for prediction markets.
This is where I think the infrastructure story gets more interesting.
Instead of treating AI trading as another separate product the platform is putting autonomous agents directly into the same liquidity environment used by regular traders.
That creates a different question for the future.
If AI agents become active market participants then liquidity is no longer only about attracting human traders. It also becomes about how these agents behave under leverage and changing market conditions.
PERPTools is targeting a Q4 2026 TGE.
So for me the funding headline is only the starting point.
The real test will be whether $240M of beta volume turns into sustainable activity after the token launch and whether the AI trading layer creates genuine demand rather than just another narrative around perpetuals.
The infrastructure is already being built.
Now the market has to prove there is a reason to keep using it.
PERPTools Has A Different Perp Trading Test
What caught my attention with PERPTools is not the $8M it just raised.
It is what the team is trying to connect together.
PERPTools has raised $3M in pre seed funding at a $30M FDV and another $5M seed round at an $80M FDV. But the more interesting part is that the project is being built by the team behind DEXTools and is using Orderly Network for its trading infrastructure.
That changes the usual problem for a new perp platform.
Most new trading venues have to find traders first and then find enough liquidity to make those traders stay.
PERPTools already has access to the DEXTools user base which reportedly includes around 30M traders.
The beta numbers are also worth watching.
The platform says it has already processed around $240M in beta volume before its token even exists.
But volume alone does not prove that the model works.
The real question is whether traders actually stay after the initial launch activity fades.
PERPTools already has three products live.
There is the Perp DEX for leveraged trading.
There is AI Arena where users can create autonomous trading agents with defined risk parameters and track their verified onchain PnL.
Then there is Tap Prediction which uses live perpetual price feeds for prediction markets.
This is where I think the infrastructure story gets more interesting.
Instead of treating AI trading as another separate product the platform is putting autonomous agents directly into the same liquidity environment used by regular traders.
That creates a different question for the future.
If AI agents become active market participants then liquidity is no longer only about attracting human traders. It also becomes about how these agents behave under leverage and changing market conditions.
PERPTools is targeting a Q4 2026 TGE.
So for me the funding headline is only the starting point.
The real test will be whether $240M of beta volume turns into sustainable activity after the token launch and whether the AI trading layer creates genuine demand rather than just another narrative around perpetuals.
The infrastructure is already being built.
Now the market has to prove there is a reason to keep using it.
It is what the team is trying to connect together.
PERPTools has raised $3M in pre seed funding at a $30M FDV and another $5M seed round at an $80M FDV. But the more interesting part is that the project is being built by the team behind DEXTools and is using Orderly Network for its trading infrastructure.
That changes the usual problem for a new perp platform.
Most new trading venues have to find traders first and then find enough liquidity to make those traders stay.
PERPTools already has access to the DEXTools user base which reportedly includes around 30M traders.
The beta numbers are also worth watching.
The platform says it has already processed around $240M in beta volume before its token even exists.
But volume alone does not prove that the model works.
The real question is whether traders actually stay after the initial launch activity fades.
PERPTools already has three products live.
There is the Perp DEX for leveraged trading.
There is AI Arena where users can create autonomous trading agents with defined risk parameters and track their verified onchain PnL.
Then there is Tap Prediction which uses live perpetual price feeds for prediction markets.
This is where I think the infrastructure story gets more interesting.
Instead of treating AI trading as another separate product the platform is putting autonomous agents directly into the same liquidity environment used by regular traders.
That creates a different question for the future.
If AI agents become active market participants then liquidity is no longer only about attracting human traders. It also becomes about how these agents behave under leverage and changing market conditions.
PERPTools is targeting a Q4 2026 TGE.
So for me the funding headline is only the starting point.
The real test will be whether $240M of beta volume turns into sustainable activity after the token launch and whether the AI trading layer creates genuine demand rather than just another narrative around perpetuals.
The infrastructure is already being built.
Now the market has to prove there is a reason to keep using it.
1
200
·
--
Article
Aave’s RWA footprint expands as commodity deposits hit $133MAAVE Has A $160 Supply Test
What caught my attention with AAVE is not the move from the June low.
It is the conflict between stronger ecosystem activity and rising exchange supply.
AAVE has recovered roughly 2.7 times from the June demand zone around $58.
Now the tokenized commodity market is adding another interesting layer.
Reported tokenized commodity deposits across DeFi reached around $133.3 million.
Aave accounted for roughly $51.3 million across V2 V3 and V4.
That means Aave is holding a meaningful share of the tokenized commodity liquidity currently sitting across these DeFi platforms.
Uniswap and Aave together represented around 86% of the reported deposits.
There is also another liquidity development.
Aave founder Stani Kulechov reportedly supplied around $4.77 million worth of AAVE liquidity to Uniswap.
That adds depth to the market but it does not automatically mean fresh demand for the token.
This is where the supply data becomes important.
AAVE exchange reserves increased around 7.59% with roughly $415.2 million worth of AAVE held across exchange wallets according to the reported data.
Higher exchange reserves do not mean those tokens will definitely be sold.
But they create more potential supply if holders decide to take profits after such a large recovery.
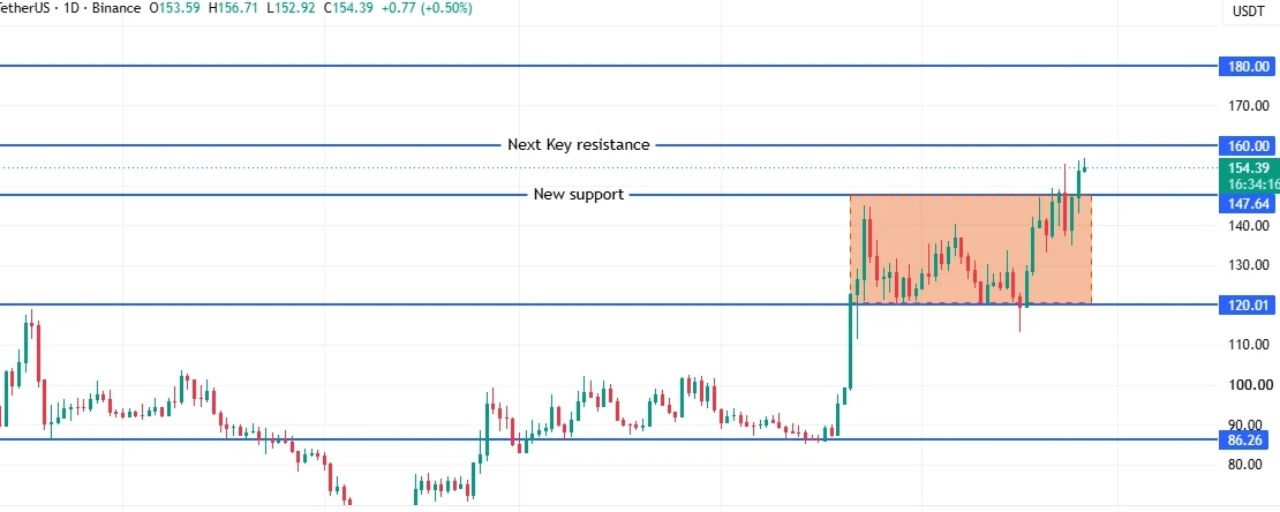
The chart is now sitting directly against that question.
AAVE broke above $147.64 and moved toward $154.39.
That $147.64 level is important because it was previously resistance and is now being tested as potential support.
The next major resistance is around $160.
RSI was around 66.61 while its signal average remained near 59.95.
That means momentum is strong but the indicator has not yet reached the 70 overbought zone.
There is also notable liquidation liquidity around $157 to $162.
If price moves through that area then short liquidations could add temporary momentum toward $160.
But there is liquidity below price as well.
Clusters around $151 and $148 could become relevant if buyers fail to defend the breakout.
For me the clean setup is not simply AAVE reaching $160.
It is whether the token can hold $147.64 while exchange reserves remain elevated.
If buyers defend that level and price breaks through $160 then the next area I would watch is around $180.
If $147.64 fails then the breakout becomes much less convincing and AAVE could return toward the previous consolidation range.
The fundamentals are improving.
The RWA footprint is expanding.
But price still needs to absorb available supply.
That is why I am watching $147.64 more closely than the next green candle.
AAVE has already broken resistance.
Now it needs to prove that the market can turn that resistance into durable support.
Aave’s RWA footprint expands as commodity deposits hit $133M
AAVE Has A $160 Supply Test
What caught my attention with AAVE is not the move from the June low.
It is the conflict between stronger ecosystem activity and rising exchange supply.
AAVE has recovered roughly 2.7 times from the June demand zone around $58.
Now the tokenized commodity market is adding another interesting layer.
Reported tokenized commodity deposits across DeFi reached around $133.3 million.
Aave accounted for roughly $51.3 million across V2 V3 and V4.
That means Aave is holding a meaningful share of the tokenized commodity liquidity currently sitting across these DeFi platforms.
Uniswap and Aave together represented around 86% of the reported deposits.
There is also another liquidity development.
Aave founder Stani Kulechov reportedly supplied around $4.77 million worth of AAVE liquidity to Uniswap.
That adds depth to the market but it does not automatically mean fresh demand for the token.
This is where the supply data becomes important.
AAVE exchange reserves increased around 7.59% with roughly $415.2 million worth of AAVE held across exchange wallets according to the reported data.
Higher exchange reserves do not mean those tokens will definitely be sold.
But they create more potential supply if holders decide to take profits after such a large recovery.
The chart is now sitting directly against that question.
AAVE broke above $147.64 and moved toward $154.39.
That $147.64 level is important because it was previously resistance and is now being tested as potential support.
The next major resistance is around $160.
RSI was around 66.61 while its signal average remained near 59.95.
That means momentum is strong but the indicator has not yet reached the 70 overbought zone.
There is also notable liquidation liquidity around $157 to $162.
If price moves through that area then short liquidations could add temporary momentum toward $160.
But there is liquidity below price as well.
Clusters around $151 and $148 could become relevant if buyers fail to defend the breakout.
For me the clean setup is not simply AAVE reaching $160.
It is whether the token can hold $147.64 while exchange reserves remain elevated.
If buyers defend that level and price breaks through $160 then the next area I would watch is around $180.
If $147.64 fails then the breakout becomes much less convincing and AAVE could return toward the previous consolidation range.
The fundamentals are improving.
The RWA footprint is expanding.
But price still needs to absorb available supply.
That is why I am watching $147.64 more closely than the next green candle.
AAVE has already broken resistance.
Now it needs to prove that the market can turn that resistance into durable support.
What caught my attention with AAVE is not the move from the June low.
It is the conflict between stronger ecosystem activity and rising exchange supply.
AAVE has recovered roughly 2.7 times from the June demand zone around $58.
Now the tokenized commodity market is adding another interesting layer.
Reported tokenized commodity deposits across DeFi reached around $133.3 million.
Aave accounted for roughly $51.3 million across V2 V3 and V4.
That means Aave is holding a meaningful share of the tokenized commodity liquidity currently sitting across these DeFi platforms.
Uniswap and Aave together represented around 86% of the reported deposits.
There is also another liquidity development.
Aave founder Stani Kulechov reportedly supplied around $4.77 million worth of AAVE liquidity to Uniswap.
That adds depth to the market but it does not automatically mean fresh demand for the token.
This is where the supply data becomes important.
AAVE exchange reserves increased around 7.59% with roughly $415.2 million worth of AAVE held across exchange wallets according to the reported data.
Higher exchange reserves do not mean those tokens will definitely be sold.
But they create more potential supply if holders decide to take profits after such a large recovery.
The chart is now sitting directly against that question.
AAVE broke above $147.64 and moved toward $154.39.
That $147.64 level is important because it was previously resistance and is now being tested as potential support.
The next major resistance is around $160.
RSI was around 66.61 while its signal average remained near 59.95.
That means momentum is strong but the indicator has not yet reached the 70 overbought zone.
There is also notable liquidation liquidity around $157 to $162.
If price moves through that area then short liquidations could add temporary momentum toward $160.
But there is liquidity below price as well.
Clusters around $151 and $148 could become relevant if buyers fail to defend the breakout.
For me the clean setup is not simply AAVE reaching $160.
It is whether the token can hold $147.64 while exchange reserves remain elevated.
If buyers defend that level and price breaks through $160 then the next area I would watch is around $180.
If $147.64 fails then the breakout becomes much less convincing and AAVE could return toward the previous consolidation range.
The fundamentals are improving.
The RWA footprint is expanding.
But price still needs to absorb available supply.
That is why I am watching $147.64 more closely than the next green candle.
AAVE has already broken resistance.
Now it needs to prove that the market can turn that resistance into durable support.
2
358
·
--

Article
Bitcoin Treasuries Have An MSCI Classification TestWhat caught my attention with the MSCI debate is that the real argument is not simply about Bitcoin.
It is about what makes a company an operating business.
MSCI is reviewing whether companies with large non-operating assets should remain eligible for its indexes. The current consultation is broader than the earlier Bitcoin specific proposal that MSCI decided not to implement in January 2026.
That distinction matters.
Strive is now challenging how MSCI would define an operating asset.
The argument is basically that Bitcoin does not have to sit passively on a balance sheet.
A company can use financial assets as part of a structured finance business and create products around them.
Strive points to activities such as lending structured finance and asset management as examples where the underlying Bitcoin can become an input into an operating business.
That creates a difficult classification problem.
If a company simply buys Bitcoin and holds it then it can look very different from a company that uses Bitcoin as collateral to create financial products.
But where exactly should MSCI draw that line?
That is the question the index provider now has to answer.
The timing is important too.
MSCI is currently collecting feedback until September 30 and expects to announce the results on October 16. Any adopted changes would then move into the relevant index review process.
For Bitcoin treasury companies this is not just a technical index issue.
Index classification can affect which companies remain eligible for benchmark inclusion and how institutional portfolios interact with them.
At the same time I would not assume that a proposal means immediate deletion.
MSCI's current consultation is still a methodology discussion.
There is also evidence that the framework is not designed only around Bitcoin. MSCI's broader approach is focused on distinguishing operating companies from entities whose activities are predominantly investment oriented.
That makes the definition of an operating asset more important than the headline about Bitcoin.
Strive itself describes its business as a structured finance company and Bitcoin treasury corporation.
So the debate comes down to a fairly simple question.
When Bitcoin sits on a corporate balance sheet is it an investment asset or can it become part of the machinery that produces the company's financial products?
There is no automatic answer.
And that is why I think the next MSCI decision is worth watching closely.
Not because it decides whether Bitcoin has value.
But because it could help define how traditional index providers classify companies whose balance sheets are increasingly built around digital assets.
The most important thing to watch now is the methodology.
The label matters less than the rules behind it.
Bitcoin Treasuries Have An MSCI Classification Test
What caught my attention with the MSCI debate is that the real argument is not simply about Bitcoin.
It is about what makes a company an operating business.
MSCI is reviewing whether companies with large non-operating assets should remain eligible for its indexes. The current consultation is broader than the earlier Bitcoin specific proposal that MSCI decided not to implement in January 2026.
That distinction matters.
Strive is now challenging how MSCI would define an operating asset.
The argument is basically that Bitcoin does not have to sit passively on a balance sheet.
A company can use financial assets as part of a structured finance business and create products around them.
Strive points to activities such as lending structured finance and asset management as examples where the underlying Bitcoin can become an input into an operating business.
That creates a difficult classification problem.
If a company simply buys Bitcoin and holds it then it can look very different from a company that uses Bitcoin as collateral to create financial products.
But where exactly should MSCI draw that line?
That is the question the index provider now has to answer.
The timing is important too.
MSCI is currently collecting feedback until September 30 and expects to announce the results on October 16. Any adopted changes would then move into the relevant index review process.
For Bitcoin treasury companies this is not just a technical index issue.
Index classification can affect which companies remain eligible for benchmark inclusion and how institutional portfolios interact with them.
At the same time I would not assume that a proposal means immediate deletion.
MSCI's current consultation is still a methodology discussion.
There is also evidence that the framework is not designed only around Bitcoin. MSCI's broader approach is focused on distinguishing operating companies from entities whose activities are predominantly investment oriented.
That makes the definition of an operating asset more important than the headline about Bitcoin.
Strive itself describes its business as a structured finance company and Bitcoin treasury corporation.
So the debate comes down to a fairly simple question.
When Bitcoin sits on a corporate balance sheet is it an investment asset or can it become part of the machinery that produces the company's financial products?
There is no automatic answer.
And that is why I think the next MSCI decision is worth watching closely.
Not because it decides whether Bitcoin has value.
But because it could help define how traditional index providers classify companies whose balance sheets are increasingly built around digital assets.
The most important thing to watch now is the methodology.
The label matters less than the rules behind it.
It is about what makes a company an operating business.
MSCI is reviewing whether companies with large non-operating assets should remain eligible for its indexes. The current consultation is broader than the earlier Bitcoin specific proposal that MSCI decided not to implement in January 2026.
That distinction matters.
Strive is now challenging how MSCI would define an operating asset.
The argument is basically that Bitcoin does not have to sit passively on a balance sheet.
A company can use financial assets as part of a structured finance business and create products around them.
Strive points to activities such as lending structured finance and asset management as examples where the underlying Bitcoin can become an input into an operating business.
That creates a difficult classification problem.
If a company simply buys Bitcoin and holds it then it can look very different from a company that uses Bitcoin as collateral to create financial products.
But where exactly should MSCI draw that line?
That is the question the index provider now has to answer.
The timing is important too.
MSCI is currently collecting feedback until September 30 and expects to announce the results on October 16. Any adopted changes would then move into the relevant index review process.
For Bitcoin treasury companies this is not just a technical index issue.
Index classification can affect which companies remain eligible for benchmark inclusion and how institutional portfolios interact with them.
At the same time I would not assume that a proposal means immediate deletion.
MSCI's current consultation is still a methodology discussion.
There is also evidence that the framework is not designed only around Bitcoin. MSCI's broader approach is focused on distinguishing operating companies from entities whose activities are predominantly investment oriented.
That makes the definition of an operating asset more important than the headline about Bitcoin.
Strive itself describes its business as a structured finance company and Bitcoin treasury corporation.
So the debate comes down to a fairly simple question.
When Bitcoin sits on a corporate balance sheet is it an investment asset or can it become part of the machinery that produces the company's financial products?
There is no automatic answer.
And that is why I think the next MSCI decision is worth watching closely.
Not because it decides whether Bitcoin has value.
But because it could help define how traditional index providers classify companies whose balance sheets are increasingly built around digital assets.
The most important thing to watch now is the methodology.
The label matters less than the rules behind it.
138
·
--
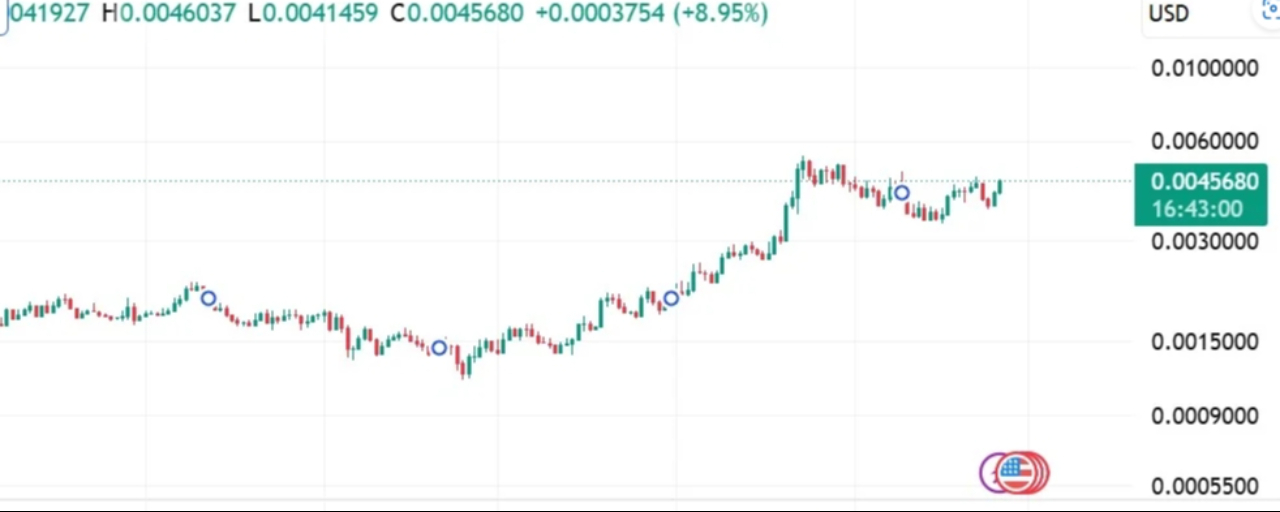
Article
All about PUMP’s 18% surge after SEC’s clarification, 398M token buybacksPUMP Has A $0.0048 Test
What caught my attention with PUMP is not just the 18% move.
It is the combination of regulatory clarification and what is happening with the token underneath the rally.
On September 25 SEC staff published new crypto asset FAQs covering areas including token classification and buyback programs.
One important point is that for a functional crypto system an issuer announcing a buyback does not by itself represent a promise to perform essential managerial efforts. The SEC also made clear that these FAQs are staff views and do not have the force of a rule or regulation.
The market reacted quickly.
PUMP recovered from around $0.0038 and reclaimed $0.004 before pushing toward $0.0046.
At the time of the report it was around $0.0045 with daily gains near 18%.
Spot volume also increased around 57%.
But this is where I would slow down.
The price is improving while the spot flow data is still showing sellers.
Spot sell volume reached around $2.68 billion while buy volume was around $2.54 billion.
That created a negative buy sell delta of roughly $144.5 million.
So even with the strong green candle there was still aggressive selling happening underneath it.
Exchange netflow also remained positive for three consecutive days and reached around $1.49 million.
That does not automatically mean a reversal is coming.
It simply tells me that more PUMP was moving toward exchanges during the rebound.
The buyback side is more interesting.
The protocol generated around $3.2 million in revenue and reportedly used $1.6 million to buy around 398 million PUMP.
The broader buyback and burn activity has reportedly removed around $463.79 million worth of PUMP from circulation.
That creates a real supply reduction mechanism.
But supply reduction does not automatically create price appreciation.
Demand still has to absorb the tokens being sold.
Technically the setup is now sitting at an important point.
The Trend Strength Index moved into a bullish crossover and reached around 6.8.
Aroon OSC also remained around 42 which suggests the upside structure is stabilizing.
For me $0.0048 is the next level that matters.
If PUMP reclaims $0.0048 and holds it then $0.005 becomes the next obvious test.
But if buyers fail around that zone while spot selling remains aggressive then the recent rally can quickly lose momentum.
In that case I would watch $0.0038 again.
The interesting part about PUMP right now is that several things are happening at once.
Regulatory clarity improved.
Protocol revenue is funding buybacks.
Supply is being reduced.
But sellers are still active.
That means the next move should tell us whether this is simply a news driven bounce or whether actual demand is strong enough to absorb the selling.
For me the reaction around $0.0048 is more important than the size of the next green candle.
All about PUMP’s 18% surge after SEC’s clarification, 398M token buybacks
PUMP Has A $0.0048 Test
What caught my attention with PUMP is not just the 18% move.
It is the combination of regulatory clarification and what is happening with the token underneath the rally.
On September 25 SEC staff published new crypto asset FAQs covering areas including token classification and buyback programs.
One important point is that for a functional crypto system an issuer announcing a buyback does not by itself represent a promise to perform essential managerial efforts. The SEC also made clear that these FAQs are staff views and do not have the force of a rule or regulation.
The market reacted quickly.
PUMP recovered from around $0.0038 and reclaimed $0.004 before pushing toward $0.0046.
At the time of the report it was around $0.0045 with daily gains near 18%.
Spot volume also increased around 57%.
But this is where I would slow down.
The price is improving while the spot flow data is still showing sellers.
Spot sell volume reached around $2.68 billion while buy volume was around $2.54 billion.
That created a negative buy sell delta of roughly $144.5 million.
So even with the strong green candle there was still aggressive selling happening underneath it.
Exchange netflow also remained positive for three consecutive days and reached around $1.49 million.
That does not automatically mean a reversal is coming.
It simply tells me that more PUMP was moving toward exchanges during the rebound.
The buyback side is more interesting.
The protocol generated around $3.2 million in revenue and reportedly used $1.6 million to buy around 398 million PUMP.
The broader buyback and burn activity has reportedly removed around $463.79 million worth of PUMP from circulation.
That creates a real supply reduction mechanism.
But supply reduction does not automatically create price appreciation.
Demand still has to absorb the tokens being sold.
Technically the setup is now sitting at an important point.
The Trend Strength Index moved into a bullish crossover and reached around 6.8.
Aroon OSC also remained around 42 which suggests the upside structure is stabilizing.
For me $0.0048 is the next level that matters.
If PUMP reclaims $0.0048 and holds it then $0.005 becomes the next obvious test.
But if buyers fail around that zone while spot selling remains aggressive then the recent rally can quickly lose momentum.
In that case I would watch $0.0038 again.
The interesting part about PUMP right now is that several things are happening at once.
Regulatory clarity improved.
Protocol revenue is funding buybacks.
Supply is being reduced.
But sellers are still active.
That means the next move should tell us whether this is simply a news driven bounce or whether actual demand is strong enough to absorb the selling.
For me the reaction around $0.0048 is more important than the size of the next green candle.
What caught my attention with PUMP is not just the 18% move.
It is the combination of regulatory clarification and what is happening with the token underneath the rally.
On September 25 SEC staff published new crypto asset FAQs covering areas including token classification and buyback programs.
One important point is that for a functional crypto system an issuer announcing a buyback does not by itself represent a promise to perform essential managerial efforts. The SEC also made clear that these FAQs are staff views and do not have the force of a rule or regulation.
The market reacted quickly.
PUMP recovered from around $0.0038 and reclaimed $0.004 before pushing toward $0.0046.
At the time of the report it was around $0.0045 with daily gains near 18%.
Spot volume also increased around 57%.
But this is where I would slow down.
The price is improving while the spot flow data is still showing sellers.
Spot sell volume reached around $2.68 billion while buy volume was around $2.54 billion.
That created a negative buy sell delta of roughly $144.5 million.
So even with the strong green candle there was still aggressive selling happening underneath it.
Exchange netflow also remained positive for three consecutive days and reached around $1.49 million.
That does not automatically mean a reversal is coming.
It simply tells me that more PUMP was moving toward exchanges during the rebound.
The buyback side is more interesting.
The protocol generated around $3.2 million in revenue and reportedly used $1.6 million to buy around 398 million PUMP.
The broader buyback and burn activity has reportedly removed around $463.79 million worth of PUMP from circulation.
That creates a real supply reduction mechanism.
But supply reduction does not automatically create price appreciation.
Demand still has to absorb the tokens being sold.
Technically the setup is now sitting at an important point.
The Trend Strength Index moved into a bullish crossover and reached around 6.8.
Aroon OSC also remained around 42 which suggests the upside structure is stabilizing.
For me $0.0048 is the next level that matters.
If PUMP reclaims $0.0048 and holds it then $0.005 becomes the next obvious test.
But if buyers fail around that zone while spot selling remains aggressive then the recent rally can quickly lose momentum.
In that case I would watch $0.0038 again.
The interesting part about PUMP right now is that several things are happening at once.
Regulatory clarity improved.
Protocol revenue is funding buybacks.
Supply is being reduced.
But sellers are still active.
That means the next move should tell us whether this is simply a news driven bounce or whether actual demand is strong enough to absorb the selling.
For me the reaction around $0.0048 is more important than the size of the next green candle.
326
·
--

Article
2Z Has A $124M Supply TesWhat caught my attention with 2Z is not the 29% rally.
It is the timing.
DoubleZero pushed above $0.075 after breaking the recent trendline and clearing liquidity around $0.060.
The move was also supported by real trading activity.
CVD showed around 19.57 million 2Z tokens being bought during the reported hour. Trading volume also jumped 107% to more than $50 million.
But the bigger change happened in derivatives.
Open interest increased by around 113% while the price was moving higher.
That tells me leverage is entering the move at a much faster pace.
This can help a breakout continue.
It can also make the rally more fragile.
The liquidation data already shows some of that pressure. Around $2 million in long positions were liquidated compared with roughly $955K in shorts.
So traders are not simply watching 2Z move higher.
They are actively positioning around it.
The chart now has a few levels that matter.
$0.075 is the first one.
If 2Z can hold above that level then the next areas I would watch are around $0.095 and $0.120.
But losing $0.075 would make the breakout less convincing.
The deeper level for me is around $0.050 where the previous trendline break started.
And then there is the supply problem.
On October 2 around 1.77 billion 2Z tokens are scheduled to unlock.
That is roughly 17.79% of the maximum supply and is valued at more than $124 million based on the current price.
The circulating supply is expected to rise toward 51% while more than 65% of the supply is currently locked.
That is a very different market structure from what the chart is showing today.
Price is moving higher because buyers are active.
But a large amount of previously locked supply is about to become available.
I would also be careful with wallet movements.
Fireblocks moved around 1.45 million 2Z to a BtcTurk cold wallet.
Wintermute moved more than 1.1 million 2Z to a hot wallet.
Upbit moved more than 14 million 2Z between its wallets.
These transfers can reflect custody or liquidity management.
They do not automatically mean selling.
For me the real test is whether 2Z can build enough spot demand before October 2 to absorb the additional supply.
If $0.075 holds and volume remains strong then $0.095 becomes the next level I would watch.
If the price starts losing $0.075 while OI remains elevated then the leverage becomes another risk.
The 29% move has already happened.
Now 2Z has to prove that buyers can handle both leverage and a $124M supply event at the same time.
2Z Has A $124M Supply Tes
What caught my attention with 2Z is not the 29% rally.
It is the timing.
DoubleZero pushed above $0.075 after breaking the recent trendline and clearing liquidity around $0.060.
The move was also supported by real trading activity.
CVD showed around 19.57 million 2Z tokens being bought during the reported hour. Trading volume also jumped 107% to more than $50 million.
But the bigger change happened in derivatives.
Open interest increased by around 113% while the price was moving higher.
That tells me leverage is entering the move at a much faster pace.
This can help a breakout continue.
It can also make the rally more fragile.
The liquidation data already shows some of that pressure. Around $2 million in long positions were liquidated compared with roughly $955K in shorts.
So traders are not simply watching 2Z move higher.
They are actively positioning around it.
The chart now has a few levels that matter.
$0.075 is the first one.
If 2Z can hold above that level then the next areas I would watch are around $0.095 and $0.120.
But losing $0.075 would make the breakout less convincing.
The deeper level for me is around $0.050 where the previous trendline break started.
And then there is the supply problem.
On October 2 around 1.77 billion 2Z tokens are scheduled to unlock.
That is roughly 17.79% of the maximum supply and is valued at more than $124 million based on the current price.
The circulating supply is expected to rise toward 51% while more than 65% of the supply is currently locked.
That is a very different market structure from what the chart is showing today.
Price is moving higher because buyers are active.
But a large amount of previously locked supply is about to become available.
I would also be careful with wallet movements.
Fireblocks moved around 1.45 million 2Z to a BtcTurk cold wallet.
Wintermute moved more than 1.1 million 2Z to a hot wallet.
Upbit moved more than 14 million 2Z between its wallets.
These transfers can reflect custody or liquidity management.
They do not automatically mean selling.
For me the real test is whether 2Z can build enough spot demand before October 2 to absorb the additional supply.
If $0.075 holds and volume remains strong then $0.095 becomes the next level I would watch.
If the price starts losing $0.075 while OI remains elevated then the leverage becomes another risk.
The 29% move has already happened.
Now 2Z has to prove that buyers can handle both leverage and a $124M supply event at the same time.
It is the timing.
DoubleZero pushed above $0.075 after breaking the recent trendline and clearing liquidity around $0.060.
The move was also supported by real trading activity.
CVD showed around 19.57 million 2Z tokens being bought during the reported hour. Trading volume also jumped 107% to more than $50 million.
But the bigger change happened in derivatives.
Open interest increased by around 113% while the price was moving higher.
That tells me leverage is entering the move at a much faster pace.
This can help a breakout continue.
It can also make the rally more fragile.
The liquidation data already shows some of that pressure. Around $2 million in long positions were liquidated compared with roughly $955K in shorts.
So traders are not simply watching 2Z move higher.
They are actively positioning around it.
The chart now has a few levels that matter.
$0.075 is the first one.
If 2Z can hold above that level then the next areas I would watch are around $0.095 and $0.120.
But losing $0.075 would make the breakout less convincing.
The deeper level for me is around $0.050 where the previous trendline break started.
And then there is the supply problem.
On October 2 around 1.77 billion 2Z tokens are scheduled to unlock.
That is roughly 17.79% of the maximum supply and is valued at more than $124 million based on the current price.
The circulating supply is expected to rise toward 51% while more than 65% of the supply is currently locked.
That is a very different market structure from what the chart is showing today.
Price is moving higher because buyers are active.
But a large amount of previously locked supply is about to become available.
I would also be careful with wallet movements.
Fireblocks moved around 1.45 million 2Z to a BtcTurk cold wallet.
Wintermute moved more than 1.1 million 2Z to a hot wallet.
Upbit moved more than 14 million 2Z between its wallets.
These transfers can reflect custody or liquidity management.
They do not automatically mean selling.
For me the real test is whether 2Z can build enough spot demand before October 2 to absorb the additional supply.
If $0.075 holds and volume remains strong then $0.095 becomes the next level I would watch.
If the price starts losing $0.075 while OI remains elevated then the leverage becomes another risk.
The 29% move has already happened.
Now 2Z has to prove that buyers can handle both leverage and a $124M supply event at the same time.
1
1
459
·
--
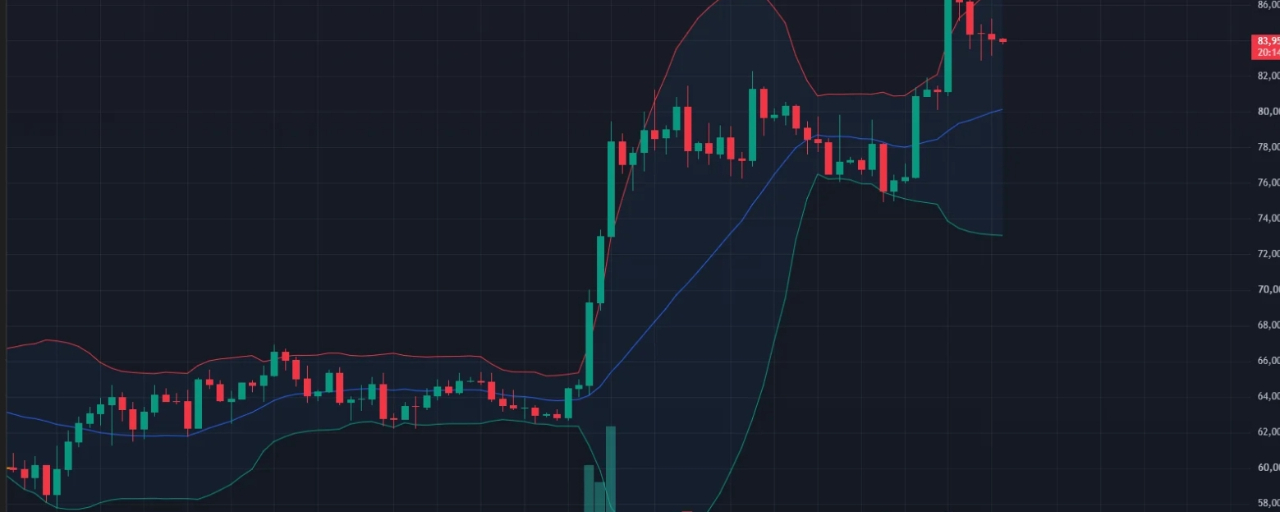
Article
Bitcoin Has An $82.85K Weekly TestWhat caught my attention with Bitcoin is not the 10% recovery since September 17.
It is what happened underneath that move.
From September 17 to September 25 US spot Bitcoin ETFs recorded around $2.88 billion in net inflows.
During the same period BTC gained around 10.26% even after dropping from roughly $87.3K toward $82.9K earlier in the week.
That tells me demand has remained present despite the pullback.
But ETF flows are only one side of the story.
Bitcoin is also leaving exchanges at a very fast pace.
Between September 22 and September 25 cumulative exchange netflow was around negative 31,400 BTC.
That represents roughly $2.6 billion worth of Bitcoin leaving exchanges.
Even more interesting was the movement on September 22 when around 12,500 BTC reportedly left exchanges within a single hour.
I would not automatically treat every exchange outflow as accumulation.
Coins can move between custodians or wallets for many reasons.
But when large outflows happen while price is recovering and ETF demand remains positive the combination is worth watching.
The technical structure now has one level that matters more than the short term candles.
Around $82,850 was the previous May swing high.
A weekly close above that level would provide stronger evidence that the multi month structure has actually shifted.
Bitcoin has already traded above it.
That is not the same thing as closing above it and holding the level.
There is still room for a pullback toward $80K to $82K without necessarily destroying the current structure.
That area becomes important because a successful retest would show whether the old resistance can become support.
Long term holder data also gives some context.
LTH realized profits were around 72%.
That sounds high until you compare it with December 2024 when the metric reached almost 350%.
So current long term holder profitability does not look like the kind of extreme profit taking environment seen near previous major highs.
Still I would avoid turning that into a guaranteed bullish signal.
Bitcoin can have strong ETF inflows and exchange outflows while still experiencing sharp corrections.
For me the cleanest confirmation is simple.
I want to see BTC finish the week above $82,850.
Then I would watch how price reacts if it returns toward $82K.
If buyers defend that zone while ETF demand remains positive then the higher timeframe structure becomes much more convincing.
If BTC loses $80K after failing to hold the breakout then the recent move starts looking more like a recovery inside a larger range.
Right now the price has already made the breakout attempt.
The weekly close is what can tell us whether the market actually accepted it.
Bitcoin Has An $82.85K Weekly Test
What caught my attention with Bitcoin is not the 10% recovery since September 17.
It is what happened underneath that move.
From September 17 to September 25 US spot Bitcoin ETFs recorded around $2.88 billion in net inflows.
During the same period BTC gained around 10.26% even after dropping from roughly $87.3K toward $82.9K earlier in the week.
That tells me demand has remained present despite the pullback.
But ETF flows are only one side of the story.
Bitcoin is also leaving exchanges at a very fast pace.
Between September 22 and September 25 cumulative exchange netflow was around negative 31,400 BTC.
That represents roughly $2.6 billion worth of Bitcoin leaving exchanges.
Even more interesting was the movement on September 22 when around 12,500 BTC reportedly left exchanges within a single hour.
I would not automatically treat every exchange outflow as accumulation.
Coins can move between custodians or wallets for many reasons.
But when large outflows happen while price is recovering and ETF demand remains positive the combination is worth watching.
The technical structure now has one level that matters more than the short term candles.
Around $82,850 was the previous May swing high.
A weekly close above that level would provide stronger evidence that the multi month structure has actually shifted.
Bitcoin has already traded above it.
That is not the same thing as closing above it and holding the level.
There is still room for a pullback toward $80K to $82K without necessarily destroying the current structure.
That area becomes important because a successful retest would show whether the old resistance can become support.
Long term holder data also gives some context.
LTH realized profits were around 72%.
That sounds high until you compare it with December 2024 when the metric reached almost 350%.
So current long term holder profitability does not look like the kind of extreme profit taking environment seen near previous major highs.
Still I would avoid turning that into a guaranteed bullish signal.
Bitcoin can have strong ETF inflows and exchange outflows while still experiencing sharp corrections.
For me the cleanest confirmation is simple.
I want to see BTC finish the week above $82,850.
Then I would watch how price reacts if it returns toward $82K.
If buyers defend that zone while ETF demand remains positive then the higher timeframe structure becomes much more convincing.
If BTC loses $80K after failing to hold the breakout then the recent move starts looking more like a recovery inside a larger range.
Right now the price has already made the breakout attempt.
The weekly close is what can tell us whether the market actually accepted it.
It is what happened underneath that move.
From September 17 to September 25 US spot Bitcoin ETFs recorded around $2.88 billion in net inflows.
During the same period BTC gained around 10.26% even after dropping from roughly $87.3K toward $82.9K earlier in the week.
That tells me demand has remained present despite the pullback.
But ETF flows are only one side of the story.
Bitcoin is also leaving exchanges at a very fast pace.
Between September 22 and September 25 cumulative exchange netflow was around negative 31,400 BTC.
That represents roughly $2.6 billion worth of Bitcoin leaving exchanges.
Even more interesting was the movement on September 22 when around 12,500 BTC reportedly left exchanges within a single hour.
I would not automatically treat every exchange outflow as accumulation.
Coins can move between custodians or wallets for many reasons.
But when large outflows happen while price is recovering and ETF demand remains positive the combination is worth watching.
The technical structure now has one level that matters more than the short term candles.
Around $82,850 was the previous May swing high.
A weekly close above that level would provide stronger evidence that the multi month structure has actually shifted.
Bitcoin has already traded above it.
That is not the same thing as closing above it and holding the level.
There is still room for a pullback toward $80K to $82K without necessarily destroying the current structure.
That area becomes important because a successful retest would show whether the old resistance can become support.
Long term holder data also gives some context.
LTH realized profits were around 72%.
That sounds high until you compare it with December 2024 when the metric reached almost 350%.
So current long term holder profitability does not look like the kind of extreme profit taking environment seen near previous major highs.
Still I would avoid turning that into a guaranteed bullish signal.
Bitcoin can have strong ETF inflows and exchange outflows while still experiencing sharp corrections.
For me the cleanest confirmation is simple.
I want to see BTC finish the week above $82,850.
Then I would watch how price reacts if it returns toward $82K.
If buyers defend that zone while ETF demand remains positive then the higher timeframe structure becomes much more convincing.
If BTC loses $80K after failing to hold the breakout then the recent move starts looking more like a recovery inside a larger range.
Right now the price has already made the breakout attempt.
The weekly close is what can tell us whether the market actually accepted it.
1
367
·
--
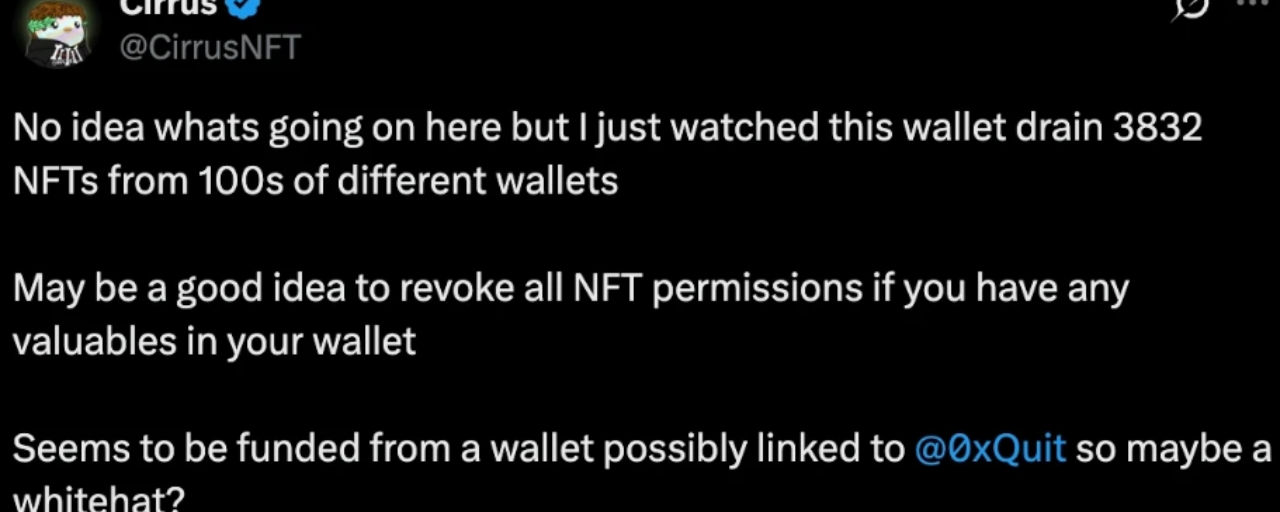
Article
An Old NFT Contract Just Created A New Security ProblemWhat caught my attention here is how old the vulnerable activity was.
Magic Eden stopped using the Limit Break Payment Processor V2 contract in October 2024.
Yet two years later an issue with that old contract was still capable of putting NFTs at risk.
Around 3,832 NFTs were moved by whitehats into a safe wallet after the vulnerability was discovered.
At first those transfers looked like normal NFT sales.
That is what made the situation confusing for holders.
But the transfers were reportedly part of a rescue operation rather than an attack. The NFTs were moved away from the vulnerable setup and are expected to be returned to their owners once the risk is resolved.
The important detail is that the problem was not with current Magic Eden listings.
Magic Eden said the issue was connected to Limit Break Payment Processor V2 which had been used for EVM marketplace trades.
The contract was later abandoned and Magic Eden eventually shut down its EVM marketplace completely in Q1 2026.
But old approvals can survive much longer than the products that created them.
That is the part I think NFT users should pay attention to.
According to Magic Eden the affected window covers NFTs that were listed on its EVM marketplace between February and October 2024.
Listings created after that period are not believed to be affected by this particular issue.
So this is less about an active marketplace exploit and more about the hidden risk sitting inside old wallet permissions.
A user can stop using a marketplace years ago and still have an approval sitting on chain.
If the underlying contract later develops a vulnerability then that old permission can become relevant again.
That is why revoking old approvals is not just something to think about after an exploit.
It is part of basic wallet hygiene.
The whitehat rescue also shows another side of blockchain security.
Once an NFT is exposed to a vulnerable contract there is no central authority that can simply undo the permission.
Someone has to identify the risk and move the assets before an attacker does.
For me the biggest lesson here is simple.
Deleting a marketplace from your bookmarks does not delete the permissions you previously gave it.
Old contracts can disappear from the front end while their approvals remain on chain.
The 3,832 rescued NFTs are now reportedly safe.
But the bigger question is how many wallets still have old approvals that their owners have completely forgotten about.
That is the security problem worth watching beyond this specific incident.
An Old NFT Contract Just Created A New Security Problem
What caught my attention here is how old the vulnerable activity was.
Magic Eden stopped using the Limit Break Payment Processor V2 contract in October 2024.
Yet two years later an issue with that old contract was still capable of putting NFTs at risk.
Around 3,832 NFTs were moved by whitehats into a safe wallet after the vulnerability was discovered.
At first those transfers looked like normal NFT sales.
That is what made the situation confusing for holders.
But the transfers were reportedly part of a rescue operation rather than an attack. The NFTs were moved away from the vulnerable setup and are expected to be returned to their owners once the risk is resolved.
The important detail is that the problem was not with current Magic Eden listings.
Magic Eden said the issue was connected to Limit Break Payment Processor V2 which had been used for EVM marketplace trades.
The contract was later abandoned and Magic Eden eventually shut down its EVM marketplace completely in Q1 2026.
But old approvals can survive much longer than the products that created them.
That is the part I think NFT users should pay attention to.
According to Magic Eden the affected window covers NFTs that were listed on its EVM marketplace between February and October 2024.
Listings created after that period are not believed to be affected by this particular issue.
So this is less about an active marketplace exploit and more about the hidden risk sitting inside old wallet permissions.
A user can stop using a marketplace years ago and still have an approval sitting on chain.
If the underlying contract later develops a vulnerability then that old permission can become relevant again.
That is why revoking old approvals is not just something to think about after an exploit.
It is part of basic wallet hygiene.
The whitehat rescue also shows another side of blockchain security.
Once an NFT is exposed to a vulnerable contract there is no central authority that can simply undo the permission.
Someone has to identify the risk and move the assets before an attacker does.
For me the biggest lesson here is simple.
Deleting a marketplace from your bookmarks does not delete the permissions you previously gave it.
Old contracts can disappear from the front end while their approvals remain on chain.
The 3,832 rescued NFTs are now reportedly safe.
But the bigger question is how many wallets still have old approvals that their owners have completely forgotten about.
That is the security problem worth watching beyond this specific incident.
Magic Eden stopped using the Limit Break Payment Processor V2 contract in October 2024.
Yet two years later an issue with that old contract was still capable of putting NFTs at risk.
Around 3,832 NFTs were moved by whitehats into a safe wallet after the vulnerability was discovered.
At first those transfers looked like normal NFT sales.
That is what made the situation confusing for holders.
But the transfers were reportedly part of a rescue operation rather than an attack. The NFTs were moved away from the vulnerable setup and are expected to be returned to their owners once the risk is resolved.
The important detail is that the problem was not with current Magic Eden listings.
Magic Eden said the issue was connected to Limit Break Payment Processor V2 which had been used for EVM marketplace trades.
The contract was later abandoned and Magic Eden eventually shut down its EVM marketplace completely in Q1 2026.
But old approvals can survive much longer than the products that created them.
That is the part I think NFT users should pay attention to.
According to Magic Eden the affected window covers NFTs that were listed on its EVM marketplace between February and October 2024.
Listings created after that period are not believed to be affected by this particular issue.
So this is less about an active marketplace exploit and more about the hidden risk sitting inside old wallet permissions.
A user can stop using a marketplace years ago and still have an approval sitting on chain.
If the underlying contract later develops a vulnerability then that old permission can become relevant again.
That is why revoking old approvals is not just something to think about after an exploit.
It is part of basic wallet hygiene.
The whitehat rescue also shows another side of blockchain security.
Once an NFT is exposed to a vulnerable contract there is no central authority that can simply undo the permission.
Someone has to identify the risk and move the assets before an attacker does.
For me the biggest lesson here is simple.
Deleting a marketplace from your bookmarks does not delete the permissions you previously gave it.
Old contracts can disappear from the front end while their approvals remain on chain.
The 3,832 rescued NFTs are now reportedly safe.
But the bigger question is how many wallets still have old approvals that their owners have completely forgotten about.
That is the security problem worth watching beyond this specific incident.
2
324
·
--
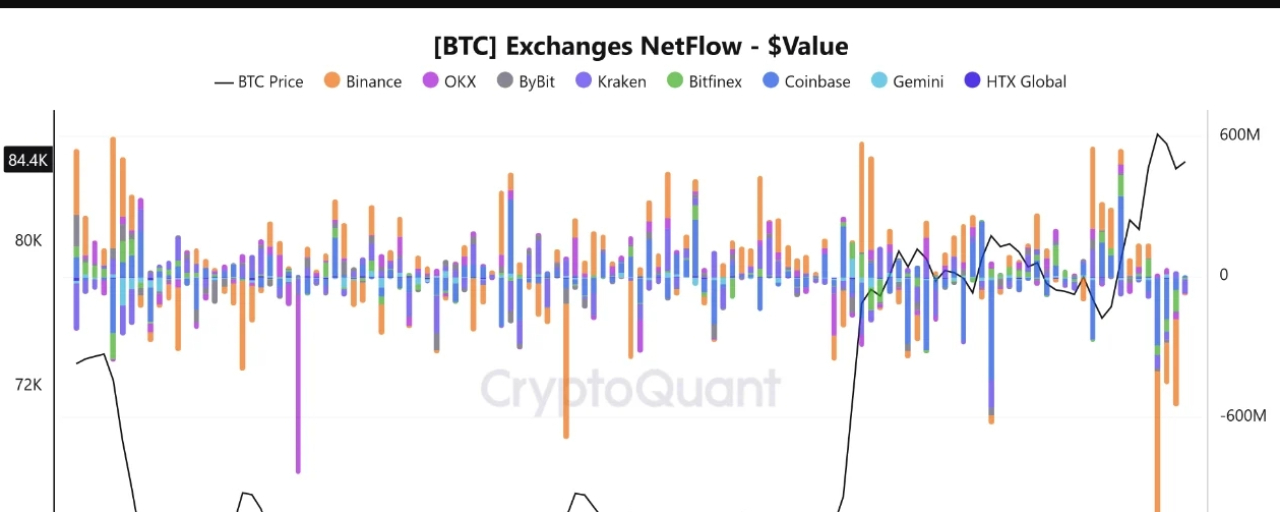
Article
Bitcoin Has A Strange Flow SplitWhat caught my attention with Bitcoin is not the $2.52 billion leaving exchanges.
It is where some of that demand appears to be going.
Between September 22 and September 24 major exchanges recorded around $2.52 billion in net Bitcoin outflows.
Binance alone accounted for roughly $1.19 billion on the first day. Across Binance Coinbase Kraken and Bitfinex the first day reached around $1.57 billion in total outflows.
That is not a small movement.
But at almost the same time Bitcoin ETFs were pulling money in.
On September 22 spot Bitcoin ETFs recorded around $714.7 million in inflows.
September 23 added another $346.9 million.
September 24 added around $190.6 million.
That gives roughly $1.25 billion of ETF inflows across three days.
So we have two very different flows happening together.
Coins are leaving exchanges while capital is entering regulated investment products.
I would not automatically call this accumulation.
Bitcoin leaving an exchange can mean many things. Coins can move into cold storage. Custody wallets can change. Institutions can reorganize holdings. It does not automatically mean those coins are being removed from the market forever.
The ETF inflows are also worth watching because they remained positive while BTC was struggling around the $85K area.
That suggests some investors were still willing to gain exposure even as short term price momentum weakened.
But the derivatives market tells a more cautious story.
Open interest moved above $31 billion on September 22 before falling toward $28.58 billion.
Funding also cooled from above 0.01 to around 0.0031.
For me that is actually useful.
It means leverage is becoming less aggressive after the recent move. That can reduce some immediate liquidation pressure but it also shows that traders are becoming less confident about chasing the move.
The chart is sitting in an important area too.
RSI was around 43.69 which puts momentum below the neutral zone.
MACD remained above its signal line but both were still below zero.
So the momentum picture is not exactly strong yet.
Bitcoin can recover toward $86K.
But I would pay more attention to what happens around $83K.
If BTC holds above that area while ETF inflows remain positive then the exchange outflows become more interesting because demand is still appearing despite the price weakness.
If $83K breaks then the flow data alone will not be enough to protect the structure.
That is the part I am watching.
Bitcoin is showing strong movement of capital right now.
The important question is whether that movement represents long term accumulation or simply a change in where investors keep their BTC.
Bitcoin Has A Strange Flow Split
What caught my attention with Bitcoin is not the $2.52 billion leaving exchanges.
It is where some of that demand appears to be going.
Between September 22 and September 24 major exchanges recorded around $2.52 billion in net Bitcoin outflows.
Binance alone accounted for roughly $1.19 billion on the first day. Across Binance Coinbase Kraken and Bitfinex the first day reached around $1.57 billion in total outflows.
That is not a small movement.
But at almost the same time Bitcoin ETFs were pulling money in.
On September 22 spot Bitcoin ETFs recorded around $714.7 million in inflows.
September 23 added another $346.9 million.
September 24 added around $190.6 million.
That gives roughly $1.25 billion of ETF inflows across three days.
So we have two very different flows happening together.
Coins are leaving exchanges while capital is entering regulated investment products.
I would not automatically call this accumulation.
Bitcoin leaving an exchange can mean many things. Coins can move into cold storage. Custody wallets can change. Institutions can reorganize holdings. It does not automatically mean those coins are being removed from the market forever.
The ETF inflows are also worth watching because they remained positive while BTC was struggling around the $85K area.
That suggests some investors were still willing to gain exposure even as short term price momentum weakened.
But the derivatives market tells a more cautious story.
Open interest moved above $31 billion on September 22 before falling toward $28.58 billion.
Funding also cooled from above 0.01 to around 0.0031.
For me that is actually useful.
It means leverage is becoming less aggressive after the recent move. That can reduce some immediate liquidation pressure but it also shows that traders are becoming less confident about chasing the move.
The chart is sitting in an important area too.
RSI was around 43.69 which puts momentum below the neutral zone.
MACD remained above its signal line but both were still below zero.
So the momentum picture is not exactly strong yet.
Bitcoin can recover toward $86K.
But I would pay more attention to what happens around $83K.
If BTC holds above that area while ETF inflows remain positive then the exchange outflows become more interesting because demand is still appearing despite the price weakness.
If $83K breaks then the flow data alone will not be enough to protect the structure.
That is the part I am watching.
Bitcoin is showing strong movement of capital right now.
The important question is whether that movement represents long term accumulation or simply a change in where investors keep their BTC.
It is where some of that demand appears to be going.
Between September 22 and September 24 major exchanges recorded around $2.52 billion in net Bitcoin outflows.
Binance alone accounted for roughly $1.19 billion on the first day. Across Binance Coinbase Kraken and Bitfinex the first day reached around $1.57 billion in total outflows.
That is not a small movement.
But at almost the same time Bitcoin ETFs were pulling money in.
On September 22 spot Bitcoin ETFs recorded around $714.7 million in inflows.
September 23 added another $346.9 million.
September 24 added around $190.6 million.
That gives roughly $1.25 billion of ETF inflows across three days.
So we have two very different flows happening together.
Coins are leaving exchanges while capital is entering regulated investment products.
I would not automatically call this accumulation.
Bitcoin leaving an exchange can mean many things. Coins can move into cold storage. Custody wallets can change. Institutions can reorganize holdings. It does not automatically mean those coins are being removed from the market forever.
The ETF inflows are also worth watching because they remained positive while BTC was struggling around the $85K area.
That suggests some investors were still willing to gain exposure even as short term price momentum weakened.
But the derivatives market tells a more cautious story.
Open interest moved above $31 billion on September 22 before falling toward $28.58 billion.
Funding also cooled from above 0.01 to around 0.0031.
For me that is actually useful.
It means leverage is becoming less aggressive after the recent move. That can reduce some immediate liquidation pressure but it also shows that traders are becoming less confident about chasing the move.
The chart is sitting in an important area too.
RSI was around 43.69 which puts momentum below the neutral zone.
MACD remained above its signal line but both were still below zero.
So the momentum picture is not exactly strong yet.
Bitcoin can recover toward $86K.
But I would pay more attention to what happens around $83K.
If BTC holds above that area while ETF inflows remain positive then the exchange outflows become more interesting because demand is still appearing despite the price weakness.
If $83K breaks then the flow data alone will not be enough to protect the structure.
That is the part I am watching.
Bitcoin is showing strong movement of capital right now.
The important question is whether that movement represents long term accumulation or simply a change in where investors keep their BTC.
249
·
--
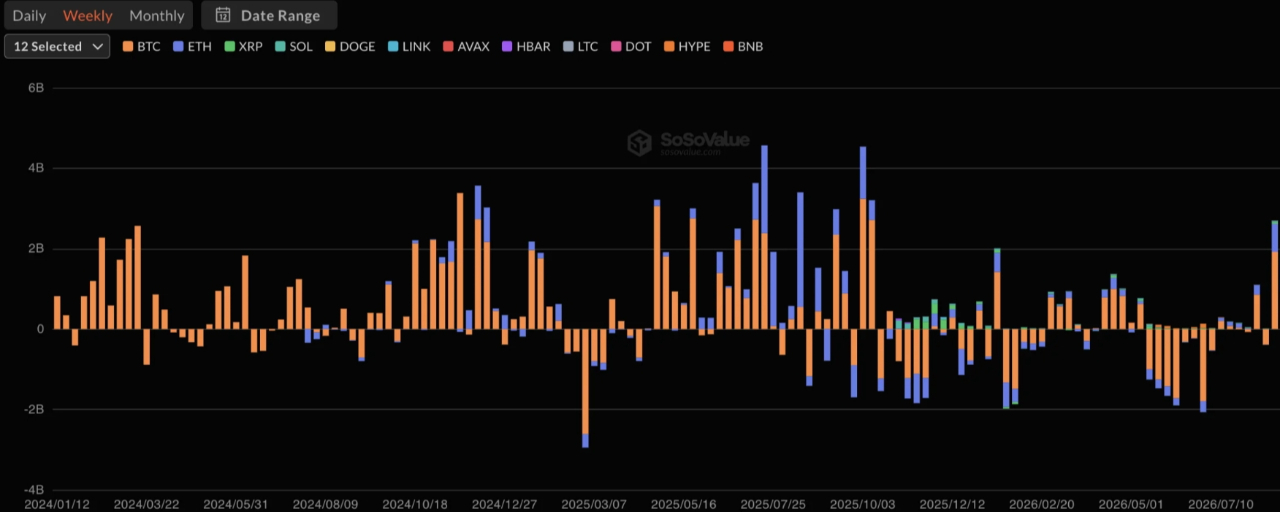
Article
Zcash ETF Hit $1B But The Money Story Is DifferentWhat caught my attention with Zcash is not that Grayscale’s Zcash ETF reached $1 billion in AUM.
It is how little of that number actually came from new investor money.
ZCSH reached $1 billion on September 24 after launching on August 25. That means the fund doubled its reported assets in roughly 16 days.
At first glance that looks like strong demand.
But cumulative net inflows were only around $306.12 million.
So less than one third of the current $1 billion AUM came from fresh capital.
The rest of the story comes from the assets ZCSH already had.
The ETF was converted from Grayscale’s older Zcash Trust which had been holding ZEC since 2017. Those existing holdings were carried into the ETF structure.
Then ZEC itself nearly doubled after the ETF started trading.
ZEC was around $1,533 at the time of the report and had gained roughly 92% over the previous 30 days.
That creates an important difference.
The ETF can show much higher AUM without receiving the same amount of new money because the assets it already owns are becoming more valuable.
For me this makes the $1 billion headline less useful than the $306 million inflow number.
The next question is whether fresh capital keeps entering ZCSH after the initial launch excitement.
That matters because rising AUM from price appreciation is very different from rising AUM because investors keep buying the fund.
The broader ETF market also had a strong week.
Bitcoin ETFs attracted around $2.25 billion.
Ethereum ETFs brought in roughly $602.94 million.
Solana ETFs saw around $101.55 million.
XRP ETFs recorded about $52.95 million.
These numbers show that crypto investment products are still attracting meaningful capital across several assets.
But Zcash has a different setup right now.
Its AUM growth has been helped by both inherited ZEC holdings and a major move in the underlying asset.
So I would not use the $1 billion figure alone as proof that $1 billion of new demand has entered Zcash.
The more important number to watch from here is fresh net inflows.
If those continue growing while ZEC remains strong then the ETF story becomes much more interesting.
If AUM keeps rising mainly because ZEC price rises then the headline can look stronger than the actual new demand underneath it.
That is the distinction I am watching now.
Zcash ETF Hit $1B But The Money Story Is Different
What caught my attention with Zcash is not that Grayscale’s Zcash ETF reached $1 billion in AUM.
It is how little of that number actually came from new investor money.
ZCSH reached $1 billion on September 24 after launching on August 25. That means the fund doubled its reported assets in roughly 16 days.
At first glance that looks like strong demand.
But cumulative net inflows were only around $306.12 million.
So less than one third of the current $1 billion AUM came from fresh capital.
The rest of the story comes from the assets ZCSH already had.
The ETF was converted from Grayscale’s older Zcash Trust which had been holding ZEC since 2017. Those existing holdings were carried into the ETF structure.
Then ZEC itself nearly doubled after the ETF started trading.
ZEC was around $1,533 at the time of the report and had gained roughly 92% over the previous 30 days.
That creates an important difference.
The ETF can show much higher AUM without receiving the same amount of new money because the assets it already owns are becoming more valuable.
For me this makes the $1 billion headline less useful than the $306 million inflow number.
The next question is whether fresh capital keeps entering ZCSH after the initial launch excitement.
That matters because rising AUM from price appreciation is very different from rising AUM because investors keep buying the fund.
The broader ETF market also had a strong week.
Bitcoin ETFs attracted around $2.25 billion.
Ethereum ETFs brought in roughly $602.94 million.
Solana ETFs saw around $101.55 million.
XRP ETFs recorded about $52.95 million.
These numbers show that crypto investment products are still attracting meaningful capital across several assets.
But Zcash has a different setup right now.
Its AUM growth has been helped by both inherited ZEC holdings and a major move in the underlying asset.
So I would not use the $1 billion figure alone as proof that $1 billion of new demand has entered Zcash.
The more important number to watch from here is fresh net inflows.
If those continue growing while ZEC remains strong then the ETF story becomes much more interesting.
If AUM keeps rising mainly because ZEC price rises then the headline can look stronger than the actual new demand underneath it.
That is the distinction I am watching now.
It is how little of that number actually came from new investor money.
ZCSH reached $1 billion on September 24 after launching on August 25. That means the fund doubled its reported assets in roughly 16 days.
At first glance that looks like strong demand.
But cumulative net inflows were only around $306.12 million.
So less than one third of the current $1 billion AUM came from fresh capital.
The rest of the story comes from the assets ZCSH already had.
The ETF was converted from Grayscale’s older Zcash Trust which had been holding ZEC since 2017. Those existing holdings were carried into the ETF structure.
Then ZEC itself nearly doubled after the ETF started trading.
ZEC was around $1,533 at the time of the report and had gained roughly 92% over the previous 30 days.
That creates an important difference.
The ETF can show much higher AUM without receiving the same amount of new money because the assets it already owns are becoming more valuable.
For me this makes the $1 billion headline less useful than the $306 million inflow number.
The next question is whether fresh capital keeps entering ZCSH after the initial launch excitement.
That matters because rising AUM from price appreciation is very different from rising AUM because investors keep buying the fund.
The broader ETF market also had a strong week.
Bitcoin ETFs attracted around $2.25 billion.
Ethereum ETFs brought in roughly $602.94 million.
Solana ETFs saw around $101.55 million.
XRP ETFs recorded about $52.95 million.
These numbers show that crypto investment products are still attracting meaningful capital across several assets.
But Zcash has a different setup right now.
Its AUM growth has been helped by both inherited ZEC holdings and a major move in the underlying asset.
So I would not use the $1 billion figure alone as proof that $1 billion of new demand has entered Zcash.
The more important number to watch from here is fresh net inflows.
If those continue growing while ZEC remains strong then the ETF story becomes much more interesting.
If AUM keeps rising mainly because ZEC price rises then the headline can look stronger than the actual new demand underneath it.
That is the distinction I am watching now.
1
453
·
--

Article
KelpDAO claims April exploit was ‘direct result of LayerZero’s failures’ in new lawsuitWhat caught my attention with the KelpDAO story is not just the $294M exploit.
It is what happened after the funds disappeared.
Evercrest Technologies has now filed a lawsuit against LayerZero over the April exploit. KelpDAO alleges that LayerZero failed to disclose weaknesses and risks in its technology and also claims the infrastructure had already been reviewed before the deployment.
LayerZero co founder Bryan Pellegrino has described the lawsuit as meritless and said he is prepared to defend himself in court.
So the legal claims are still allegations rather than established facts.
But the technical failure itself shows why cross chain infrastructure remains such an important risk point in DeFi.
The attacker managed to exploit the messaging system and caused around 116600 rsETH to be minted. Those tokens were then used as collateral to obtain around 106467 ETH.
That is where the damage becomes much bigger than the original token creation.
The response has also been interesting.
The Arbitrum Security Council froze around 30766 ETH linked to the exploit which helped prevent those assets from moving further.
KelpDAO later replenished its rsETH adapter with around 116000 rsETH and resumed normal operations.
The protocol also moved its cross chain communication layer to Chainlink CCIP.
KelpDAO says its rsETH is now backed 1 to 1 by ETH and reported around 426819 ETH in actual backing.
The recovery is visible in the TVL too.
Kelp added around $266M in TVL from August 19 to reach roughly $1.139B.
But there is still a gap.
That remains below the roughly $1.547B TVL recorded in May.
And earnings have weakened sharply with quarterly earnings around $276K while gross revenue stood near $6.42M.
For me this makes the lawsuit less interesting than the infrastructure lesson behind it.
A DeFi protocol can replenish stolen assets and change its messaging system.
But users still need to trust the new security assumptions.
The real test for KelpDAO is therefore not simply whether TVL comes back.
It is whether the protocol can rebuild capital while proving that the architecture behind that capital has become harder to compromise.
The exploit is over.
The trust question is not.
KelpDAO claims April exploit was ‘direct result of LayerZero’s failures’ in new lawsuit
What caught my attention with the KelpDAO story is not just the $294M exploit.
It is what happened after the funds disappeared.
Evercrest Technologies has now filed a lawsuit against LayerZero over the April exploit. KelpDAO alleges that LayerZero failed to disclose weaknesses and risks in its technology and also claims the infrastructure had already been reviewed before the deployment.
LayerZero co founder Bryan Pellegrino has described the lawsuit as meritless and said he is prepared to defend himself in court.
So the legal claims are still allegations rather than established facts.
But the technical failure itself shows why cross chain infrastructure remains such an important risk point in DeFi.
The attacker managed to exploit the messaging system and caused around 116600 rsETH to be minted. Those tokens were then used as collateral to obtain around 106467 ETH.
That is where the damage becomes much bigger than the original token creation.
The response has also been interesting.
The Arbitrum Security Council froze around 30766 ETH linked to the exploit which helped prevent those assets from moving further.
KelpDAO later replenished its rsETH adapter with around 116000 rsETH and resumed normal operations.
The protocol also moved its cross chain communication layer to Chainlink CCIP.
KelpDAO says its rsETH is now backed 1 to 1 by ETH and reported around 426819 ETH in actual backing.
The recovery is visible in the TVL too.
Kelp added around $266M in TVL from August 19 to reach roughly $1.139B.
But there is still a gap.
That remains below the roughly $1.547B TVL recorded in May.
And earnings have weakened sharply with quarterly earnings around $276K while gross revenue stood near $6.42M.
For me this makes the lawsuit less interesting than the infrastructure lesson behind it.
A DeFi protocol can replenish stolen assets and change its messaging system.
But users still need to trust the new security assumptions.
The real test for KelpDAO is therefore not simply whether TVL comes back.
It is whether the protocol can rebuild capital while proving that the architecture behind that capital has become harder to compromise.
The exploit is over.
The trust question is not.
It is what happened after the funds disappeared.
Evercrest Technologies has now filed a lawsuit against LayerZero over the April exploit. KelpDAO alleges that LayerZero failed to disclose weaknesses and risks in its technology and also claims the infrastructure had already been reviewed before the deployment.
LayerZero co founder Bryan Pellegrino has described the lawsuit as meritless and said he is prepared to defend himself in court.
So the legal claims are still allegations rather than established facts.
But the technical failure itself shows why cross chain infrastructure remains such an important risk point in DeFi.
The attacker managed to exploit the messaging system and caused around 116600 rsETH to be minted. Those tokens were then used as collateral to obtain around 106467 ETH.
That is where the damage becomes much bigger than the original token creation.
The response has also been interesting.
The Arbitrum Security Council froze around 30766 ETH linked to the exploit which helped prevent those assets from moving further.
KelpDAO later replenished its rsETH adapter with around 116000 rsETH and resumed normal operations.
The protocol also moved its cross chain communication layer to Chainlink CCIP.
KelpDAO says its rsETH is now backed 1 to 1 by ETH and reported around 426819 ETH in actual backing.
The recovery is visible in the TVL too.
Kelp added around $266M in TVL from August 19 to reach roughly $1.139B.
But there is still a gap.
That remains below the roughly $1.547B TVL recorded in May.
And earnings have weakened sharply with quarterly earnings around $276K while gross revenue stood near $6.42M.
For me this makes the lawsuit less interesting than the infrastructure lesson behind it.
A DeFi protocol can replenish stolen assets and change its messaging system.
But users still need to trust the new security assumptions.
The real test for KelpDAO is therefore not simply whether TVL comes back.
It is whether the protocol can rebuild capital while proving that the architecture behind that capital has become harder to compromise.
The exploit is over.
The trust question is not.
1
224
Log in to explore more content
Join global crypto users on Binance Square
⚡️ Get latest and useful information about crypto.
💬 Trusted by the world’s largest crypto exchange.
👍 Discover real insights from verified creators.
Email / Phone number