
Posts
All
Quotes

FIBO99
·
--
BullishHeatmap Color #BTC
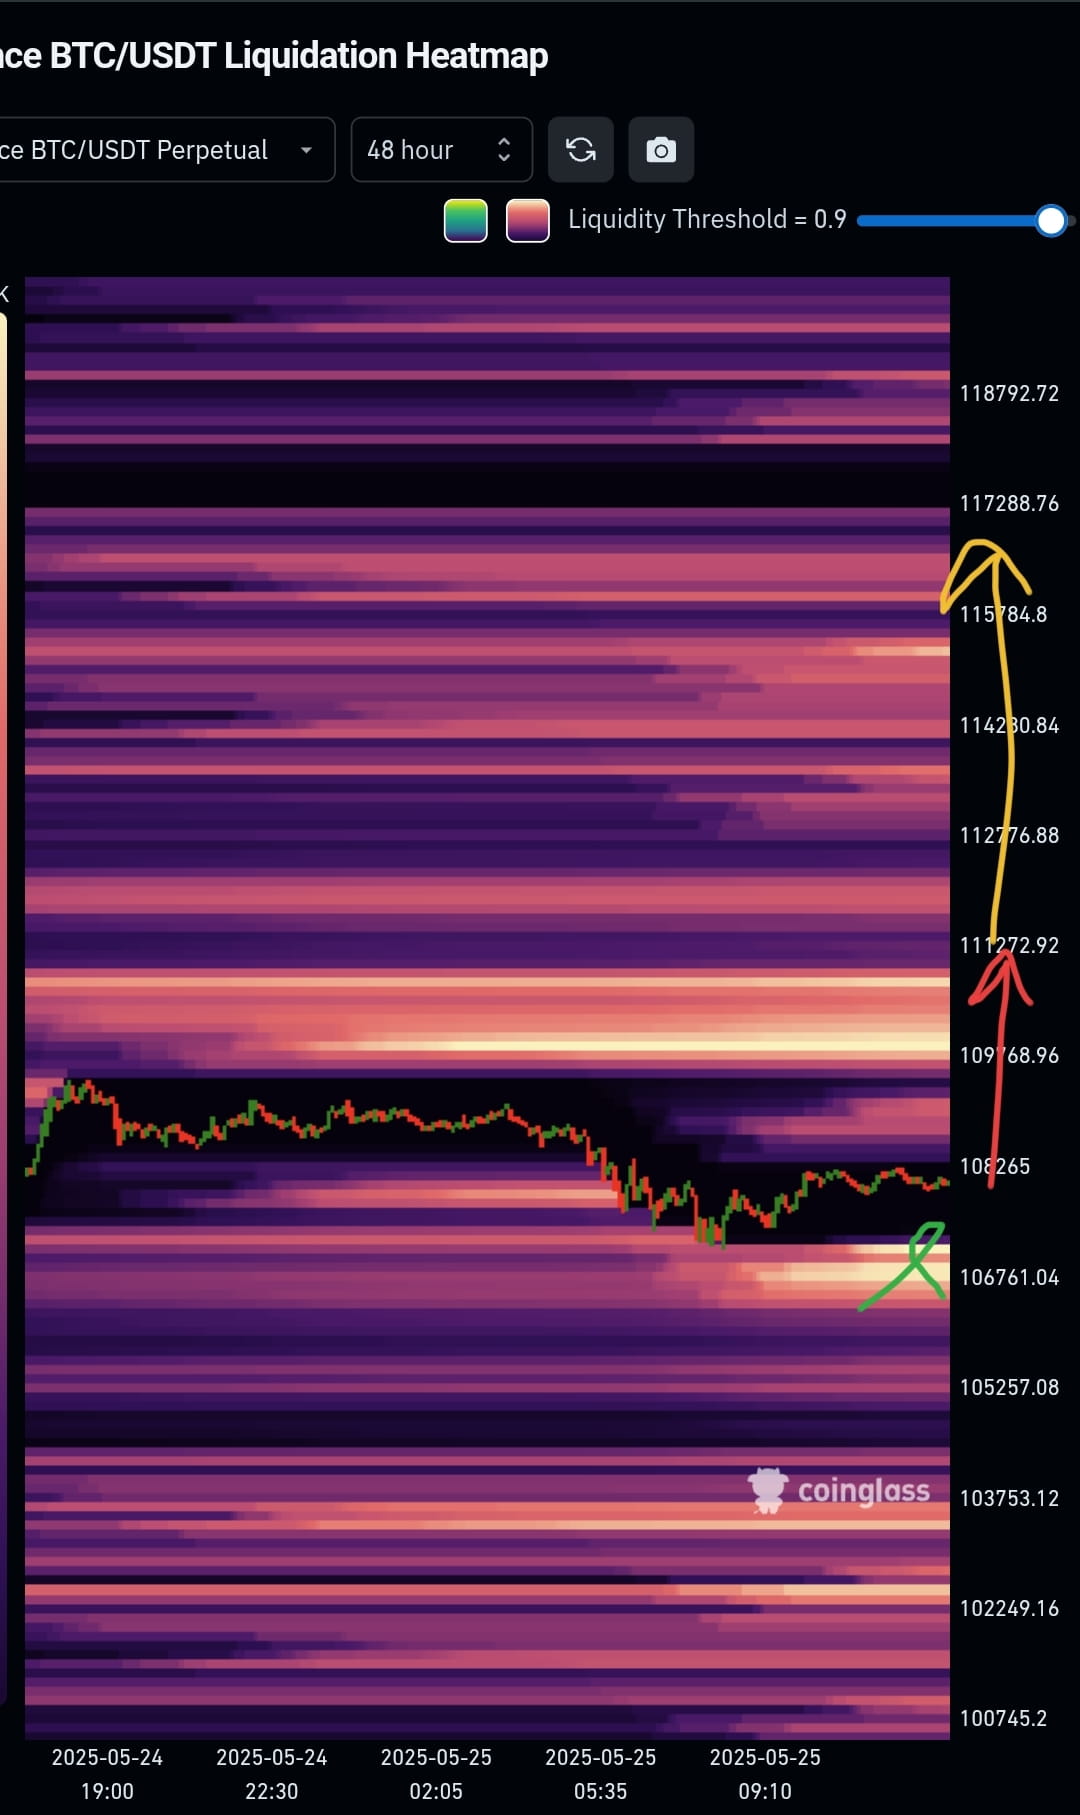
Bright yellow/white areas indicate high liquidity zones — zones where a lot of stop orders/liquidations may be triggered.
Darker areas indicate lower interest or liquidity.
Annotations:
Green Checkmark near $106,761: Likely indicates a strong support or accumulation area, where BTC has reacted or bounced.
Red Arrow at $111,272: Points to a key resistance or liquidation cluster — many short positions may get liquidated here if price moves up.
Yellow Arrow at $117,288: Indicates an even higher liquidity target, possibly another major resistance zone or whale target if momentum continues.
Interpretation:
If BTC continues up, it could:
Hit $111,272 and trigger liquidations, possibly gaining momentum.
Push toward $117,288 if that momentum is strong.
If BTC drops, the $106,761 level might be tested as support.
Bright yellow/white areas indicate high liquidity zones — zones where a lot of stop orders/liquidations may be triggered.
Darker areas indicate lower interest or liquidity.
Annotations:
Green Checkmark near $106,761: Likely indicates a strong support or accumulation area, where BTC has reacted or bounced.
Red Arrow at $111,272: Points to a key resistance or liquidation cluster — many short positions may get liquidated here if price moves up.
Yellow Arrow at $117,288: Indicates an even higher liquidity target, possibly another major resistance zone or whale target if momentum continues.
Interpretation:
If BTC continues up, it could:
Hit $111,272 and trigger liquidations, possibly gaining momentum.
Push toward $117,288 if that momentum is strong.
If BTC drops, the $106,761 level might be tested as support.
Log in to explore more content