
Majid ali 230
2.6k Posts

Majid ali 230
Report
Block User
Open Trade
Frequent Trader
11.3 Months
217 Following
3.9K+ Followers
1.6K+ Liked
Posts
Portfolio
All
Quotes
Live
The first bounce is rarely the part that matters.
What caught my attention on BABYUSDT is what happened after the bounce from 0.01016. On the 15-minute chart, buyers didn't just push price higher—they kept defending higher lows while reclaiming the short-term moving averages. That's usually the first sign that momentum is trying to shift instead of simply reacting.
But the 4-hour chart tells a different story.
Price is still trading beneath the longer-term trend, and this recovery has already reached an area where sellers were active before. That creates an interesting tension: short-term strength is running into higher-timeframe resistance.
This is the part I keep coming back to.
Many traders focus on whether BABY can break 0.01102. I'm more interested in what happens if it pulls back first. A healthy trend isn't defined by how fast it rallies—it's defined by whether buyers are willing to defend the next dip.
If that support holds, today's move becomes more than a relief bounce. It becomes the beginning of a change in market structure.
If it doesn't, then this rally may simply be another lower high within the broader downtrend.
That's why I'm not chasing the green candles. I'm watching the reaction.
Strong trends earn their credibility on the retest, not on the breakout.
So here's the question I'm asking instead of predicting the next move:
Will BABY turn today's resistance into tomorrow's support, or is this just the market giving late buyers one more reason to get trapped?
@babylonlabs_io $BABY #baby
The first bounce is rarely the part that matters.
What caught my attention on BABYUSDT is what happened after the bounce from 0.01016. On the 15-minute chart, buyers didn't just push price higher—they kept defending higher lows while reclaiming the short-term moving averages. That's usually the first sign that momentum is trying to shift instead of simply reacting.
But the 4-hour chart tells a different story.
Price is still trading beneath the longer-term trend, and this recovery has already reached an area where sellers were active before. That creates an interesting tension: short-term strength is running into higher-timeframe resistance.
This is the part I keep coming back to.
Many traders focus on whether BABY can break 0.01102. I'm more interested in what happens if it pulls back first. A healthy trend isn't defined by how fast it rallies—it's defined by whether buyers are willing to defend the next dip.
If that support holds, today's move becomes more than a relief bounce. It becomes the beginning of a change in market structure.
If it doesn't, then this rally may simply be another lower high within the broader downtrend.
That's why I'm not chasing the green candles. I'm watching the reaction.
Strong trends earn their credibility on the retest, not on the breakout.
So here's the question I'm asking instead of predicting the next move:
Will BABY turn today's resistance into tomorrow's support, or is this just the market giving late buyers one more reason to get trapped?
@BabylonLabs_io $BABY #baby
What caught my attention on BABYUSDT is what happened after the bounce from 0.01016. On the 15-minute chart, buyers didn't just push price higher—they kept defending higher lows while reclaiming the short-term moving averages. That's usually the first sign that momentum is trying to shift instead of simply reacting.
But the 4-hour chart tells a different story.
Price is still trading beneath the longer-term trend, and this recovery has already reached an area where sellers were active before. That creates an interesting tension: short-term strength is running into higher-timeframe resistance.
This is the part I keep coming back to.
Many traders focus on whether BABY can break 0.01102. I'm more interested in what happens if it pulls back first. A healthy trend isn't defined by how fast it rallies—it's defined by whether buyers are willing to defend the next dip.
If that support holds, today's move becomes more than a relief bounce. It becomes the beginning of a change in market structure.
If it doesn't, then this rally may simply be another lower high within the broader downtrend.
That's why I'm not chasing the green candles. I'm watching the reaction.
Strong trends earn their credibility on the retest, not on the breakout.
So here's the question I'm asking instead of predicting the next move:
Will BABY turn today's resistance into tomorrow's support, or is this just the market giving late buyers one more reason to get trapped?
@BabylonLabs_io $BABY #baby


1
86
Everyone is watching the price. I'm watching the reaction.
On the 15-minute chart, BABY just revisited the 0.01032 area after another rejection near the longer-term moving average. The bounce has been weak so far, and price is still trading below the 25 MA and 99 MA. On the 1-minute chart, sellers are also fading every small recovery instead of letting momentum build.
This is the part I keep coming back to: for Babylon, the interesting signal isn't whether a candle turns green. It's whether buyers can defend a level long enough to shift market structure. Until that happens, every relief bounce risks becoming another lower high.
That matters because Babylon's long-term narrative—enabling self-custodial BTC staking to help secure PoS networks—is very different from its short-term trading behavior. Strong fundamentals don't automatically create strong price action. The market still has to prove demand.
For now, I'm watching one thing more than any headline: can BABY reclaim and hold above its short-term moving averages with sustained buying volume, or will support at 0.01032 get tested again?
Sometimes the most important move isn't the bounce. It's what happens after it.
@babylonlabs_io $BABY #baby
Everyone is watching the price. I'm watching the reaction.
On the 15-minute chart, BABY just revisited the 0.01032 area after another rejection near the longer-term moving average. The bounce has been weak so far, and price is still trading below the 25 MA and 99 MA. On the 1-minute chart, sellers are also fading every small recovery instead of letting momentum build.
This is the part I keep coming back to: for Babylon, the interesting signal isn't whether a candle turns green. It's whether buyers can defend a level long enough to shift market structure. Until that happens, every relief bounce risks becoming another lower high.
That matters because Babylon's long-term narrative—enabling self-custodial BTC staking to help secure PoS networks—is very different from its short-term trading behavior. Strong fundamentals don't automatically create strong price action. The market still has to prove demand.
For now, I'm watching one thing more than any headline: can BABY reclaim and hold above its short-term moving averages with sustained buying volume, or will support at 0.01032 get tested again?
Sometimes the most important move isn't the bounce. It's what happens after it.
@BabylonLabs_io $BABY #baby
On the 15-minute chart, BABY just revisited the 0.01032 area after another rejection near the longer-term moving average. The bounce has been weak so far, and price is still trading below the 25 MA and 99 MA. On the 1-minute chart, sellers are also fading every small recovery instead of letting momentum build.
This is the part I keep coming back to: for Babylon, the interesting signal isn't whether a candle turns green. It's whether buyers can defend a level long enough to shift market structure. Until that happens, every relief bounce risks becoming another lower high.
That matters because Babylon's long-term narrative—enabling self-custodial BTC staking to help secure PoS networks—is very different from its short-term trading behavior. Strong fundamentals don't automatically create strong price action. The market still has to prove demand.
For now, I'm watching one thing more than any headline: can BABY reclaim and hold above its short-term moving averages with sustained buying volume, or will support at 0.01032 get tested again?
Sometimes the most important move isn't the bounce. It's what happens after it.
@BabylonLabs_io $BABY #baby


2
75
·
--
Bearish
Everyone is watching the price.
I'm watching the reaction.
BABY has spent weeks under pressure, and the daily chart still looks heavy. Most people see that and immediately decide the story is over. But what caught my attention isn't the downtrend—it's how buyers keep stepping in each time price pushes into fresh lows.
On the lower timeframes, today's bounce wasn't a random green candle. It started after another test of the day's low around 0.01061, and buyers managed to reclaim the short-term moving average. That's not enough to call a trend reversal, but it is enough to show that demand hasn't disappeared.
This is the part I keep coming back to.
Babylon's long-term story has always depended on adoption of its Bitcoin staking architecture, not on whether the token has one green day. Markets often price uncertainty long before they price progress. The difficult part is figuring out when the two begin to reconnect.
Right now, price is still trading below the higher-timeframe moving averages. That means the broader trend hasn't changed. Chasing every bounce because "it can't go lower" is just as risky as assuming every rally is only a dead-cat bounce.
For me, the real test isn't whether BABY can print another green candle.
It's whether buyers can defend higher lows while reclaiming levels that previously acted as resistance. If that starts happening consistently, the conversation changes from "relief rally" to "trend rebuilding."
Until then, I'm treating every move as evidence, not confirmation.
The market is asking a simple question:
Is this just a bounce inside a downtrend, or the beginning of confidence returning to Babylon?
That's the question I'm watching—not today's percentage change.
@babylonlabs_io #baby $BABY
{spot}(BABYUSDT)
Everyone is watching the price.
I'm watching the reaction.
BABY has spent weeks under pressure, and the daily chart still looks heavy. Most people see that and immediately decide the story is over. But what caught my attention isn't the downtrend—it's how buyers keep stepping in each time price pushes into fresh lows.
On the lower timeframes, today's bounce wasn't a random green candle. It started after another test of the day's low around 0.01061, and buyers managed to reclaim the short-term moving average. That's not enough to call a trend reversal, but it is enough to show that demand hasn't disappeared.
This is the part I keep coming back to.
Babylon's long-term story has always depended on adoption of its Bitcoin staking architecture, not on whether the token has one green day. Markets often price uncertainty long before they price progress. The difficult part is figuring out when the two begin to reconnect.
Right now, price is still trading below the higher-timeframe moving averages. That means the broader trend hasn't changed. Chasing every bounce because "it can't go lower" is just as risky as assuming every rally is only a dead-cat bounce.
For me, the real test isn't whether BABY can print another green candle.
It's whether buyers can defend higher lows while reclaiming levels that previously acted as resistance. If that starts happening consistently, the conversation changes from "relief rally" to "trend rebuilding."
Until then, I'm treating every move as evidence, not confirmation.
The market is asking a simple question:
Is this just a bounce inside a downtrend, or the beginning of confidence returning to Babylon?
That's the question I'm watching—not today's percentage change.
@BabylonLabs_io #baby $BABY
I'm watching the reaction.
BABY has spent weeks under pressure, and the daily chart still looks heavy. Most people see that and immediately decide the story is over. But what caught my attention isn't the downtrend—it's how buyers keep stepping in each time price pushes into fresh lows.
On the lower timeframes, today's bounce wasn't a random green candle. It started after another test of the day's low around 0.01061, and buyers managed to reclaim the short-term moving average. That's not enough to call a trend reversal, but it is enough to show that demand hasn't disappeared.
This is the part I keep coming back to.
Babylon's long-term story has always depended on adoption of its Bitcoin staking architecture, not on whether the token has one green day. Markets often price uncertainty long before they price progress. The difficult part is figuring out when the two begin to reconnect.
Right now, price is still trading below the higher-timeframe moving averages. That means the broader trend hasn't changed. Chasing every bounce because "it can't go lower" is just as risky as assuming every rally is only a dead-cat bounce.
For me, the real test isn't whether BABY can print another green candle.
It's whether buyers can defend higher lows while reclaiming levels that previously acted as resistance. If that starts happening consistently, the conversation changes from "relief rally" to "trend rebuilding."
Until then, I'm treating every move as evidence, not confirmation.
The market is asking a simple question:
Is this just a bounce inside a downtrend, or the beginning of confidence returning to Babylon?
That's the question I'm watching—not today's percentage change.
@BabylonLabs_io #baby $BABY


3
75
The chart is telling a different story depending on the timeframe, and that’s exactly why I’m paying attention to BABY right now.
On the daily chart, price is sitting close to the same area that previously acted as support around 0.0109–0.0113. That level has already been tested more than once, but each bounce has been weaker than the last. Meanwhile, both the 30-minute and 4-hour charts show a clear sequence of lower highs after the sharp move to 0.01337. Momentum hasn’t disappeared overnight—it has been fading candle by candle.
What stands out to me isn’t the pullback itself. Volatile moves are common in meme-driven markets. The more interesting detail is how quickly buyers stopped following through after the breakout. A single explosive candle can attract attention, but sustained strength usually requires demand to keep stepping in. So far, that confirmation hasn’t appeared.
This is the part I keep coming back to: support is only meaningful if buyers defend it with conviction. If the current zone holds and higher lows begin to form on lower timeframes, the recent spike may look more like a reset than a reversal. But if this area breaks cleanly, the market could start treating the breakout as a short-lived liquidity event instead of the beginning of a new trend.
For now, I’m less interested in predicting the next big move than watching how price behaves around this support. Sometimes the reaction at one level tells you far more than the rally that came before it.
So the real question is: Will buyers finally defend this zone, or is the market preparing to discover a new floor?
@babylonlabs_io $BABY #baby
{spot}(BABYUSDT)
The chart is telling a different story depending on the timeframe, and that’s exactly why I’m paying attention to BABY right now.
On the daily chart, price is sitting close to the same area that previously acted as support around 0.0109–0.0113. That level has already been tested more than once, but each bounce has been weaker than the last. Meanwhile, both the 30-minute and 4-hour charts show a clear sequence of lower highs after the sharp move to 0.01337. Momentum hasn’t disappeared overnight—it has been fading candle by candle.
What stands out to me isn’t the pullback itself. Volatile moves are common in meme-driven markets. The more interesting detail is how quickly buyers stopped following through after the breakout. A single explosive candle can attract attention, but sustained strength usually requires demand to keep stepping in. So far, that confirmation hasn’t appeared.
This is the part I keep coming back to: support is only meaningful if buyers defend it with conviction. If the current zone holds and higher lows begin to form on lower timeframes, the recent spike may look more like a reset than a reversal. But if this area breaks cleanly, the market could start treating the breakout as a short-lived liquidity event instead of the beginning of a new trend.
For now, I’m less interested in predicting the next big move than watching how price behaves around this support. Sometimes the reaction at one level tells you far more than the rally that came before it.
So the real question is: Will buyers finally defend this zone, or is the market preparing to discover a new floor?
@BabylonLabs_io $BABY #baby
On the daily chart, price is sitting close to the same area that previously acted as support around 0.0109–0.0113. That level has already been tested more than once, but each bounce has been weaker than the last. Meanwhile, both the 30-minute and 4-hour charts show a clear sequence of lower highs after the sharp move to 0.01337. Momentum hasn’t disappeared overnight—it has been fading candle by candle.
What stands out to me isn’t the pullback itself. Volatile moves are common in meme-driven markets. The more interesting detail is how quickly buyers stopped following through after the breakout. A single explosive candle can attract attention, but sustained strength usually requires demand to keep stepping in. So far, that confirmation hasn’t appeared.
This is the part I keep coming back to: support is only meaningful if buyers defend it with conviction. If the current zone holds and higher lows begin to form on lower timeframes, the recent spike may look more like a reset than a reversal. But if this area breaks cleanly, the market could start treating the breakout as a short-lived liquidity event instead of the beginning of a new trend.
For now, I’m less interested in predicting the next big move than watching how price behaves around this support. Sometimes the reaction at one level tells you far more than the rally that came before it.
So the real question is: Will buyers finally defend this zone, or is the market preparing to discover a new floor?
@BabylonLabs_io $BABY #baby


4
2
82
The first move caught everyone's attention. The second move is the one I'm watching.
On the daily chart, BABY printed a sharp recovery from around 0.01091 to 0.01337 before giving back part of the move. Zoom into the 4-hour chart and the story changes. Instead of panic selling, price is retracing toward the rising 7-period moving average while the 25-period moving average is still climbing underneath. That tells me this isn't just about how high the spike went—it's about whether buyers are willing to defend higher lows after the excitement fades.
Most traders focus on the candle that made the headlines. I think the more important signal is what happens after it. Strong trends don't prove themselves with one explosive candle. They prove themselves when the market absorbs profit-taking without immediately revisiting the lows.
This is the part I keep coming back to. Price is sitting near the daily MA(25), while the 4-hour structure is testing short-term support instead of collapsing. If buyers can keep reclaiming that area, the initial breakout starts looking like the beginning of a trend rather than a one-day event. If they can't, the rally risks becoming another liquidity spike that fades as quickly as it appeared.
That makes the next few candles more valuable than the previous big green one.
The question I'm asking isn't whether BABY can print another large candle. It's whether the market is willing to build a base above its recent breakout zone. In my experience, that's where the strongest trends quietly separate themselves from short-lived pumps.
@babylonlabs_io $BABY #baby
The first move caught everyone's attention. The second move is the one I'm watching.
On the daily chart, BABY printed a sharp recovery from around 0.01091 to 0.01337 before giving back part of the move. Zoom into the 4-hour chart and the story changes. Instead of panic selling, price is retracing toward the rising 7-period moving average while the 25-period moving average is still climbing underneath. That tells me this isn't just about how high the spike went—it's about whether buyers are willing to defend higher lows after the excitement fades.
Most traders focus on the candle that made the headlines. I think the more important signal is what happens after it. Strong trends don't prove themselves with one explosive candle. They prove themselves when the market absorbs profit-taking without immediately revisiting the lows.
This is the part I keep coming back to. Price is sitting near the daily MA(25), while the 4-hour structure is testing short-term support instead of collapsing. If buyers can keep reclaiming that area, the initial breakout starts looking like the beginning of a trend rather than a one-day event. If they can't, the rally risks becoming another liquidity spike that fades as quickly as it appeared.
That makes the next few candles more valuable than the previous big green one.
The question I'm asking isn't whether BABY can print another large candle. It's whether the market is willing to build a base above its recent breakout zone. In my experience, that's where the strongest trends quietly separate themselves from short-lived pumps.
@BabylonLabs_io $BABY #baby
On the daily chart, BABY printed a sharp recovery from around 0.01091 to 0.01337 before giving back part of the move. Zoom into the 4-hour chart and the story changes. Instead of panic selling, price is retracing toward the rising 7-period moving average while the 25-period moving average is still climbing underneath. That tells me this isn't just about how high the spike went—it's about whether buyers are willing to defend higher lows after the excitement fades.
Most traders focus on the candle that made the headlines. I think the more important signal is what happens after it. Strong trends don't prove themselves with one explosive candle. They prove themselves when the market absorbs profit-taking without immediately revisiting the lows.
This is the part I keep coming back to. Price is sitting near the daily MA(25), while the 4-hour structure is testing short-term support instead of collapsing. If buyers can keep reclaiming that area, the initial breakout starts looking like the beginning of a trend rather than a one-day event. If they can't, the rally risks becoming another liquidity spike that fades as quickly as it appeared.
That makes the next few candles more valuable than the previous big green one.
The question I'm asking isn't whether BABY can print another large candle. It's whether the market is willing to build a base above its recent breakout zone. In my experience, that's where the strongest trends quietly separate themselves from short-lived pumps.
@BabylonLabs_io $BABY #baby


4
2
92
The first bounce always gets the attention. The second one tells a better story.
BABY has just reclaimed the 0.0114 area after printing a local low around 0.01091, but what stands out to me isn't the rebound itself. It's how quickly price is running back into the cluster of short-term moving averages instead of breaking cleanly above them. That usually shifts the conversation from "reversal" to "confirmation."
Most traders will focus on whether today's candle is green. I'm more interested in whether buyers can keep accepting higher prices once the excitement fades. A single impulse move is easy to produce in a volatile perpetual market. Sustaining it while reclaiming nearby resistance is the harder part.
This is the detail I keep coming back to: the daily chart is still carrying the weight of a much larger downtrend, while the lower timeframes are trying to build a base. That creates a tug-of-war between short-term momentum traders and longer-term sellers who may see every rally as an opportunity to reduce exposure.
For me, the next move matters less than the behavior around this zone. If BABY starts holding above the short-term averages instead of repeatedly getting rejected, the market narrative begins to change. If it can't, this bounce risks becoming another relief rally inside a broader bearish structure.
The market has already shown it can react sharply from the lows. Now it needs to prove that demand can stay consistent.
That's the chart I'm watching—not the size of the bounce, but whether buyers can turn it into acceptance.
@babylonlabs_io $BABY #baby
The first bounce always gets the attention. The second one tells a better story.
BABY has just reclaimed the 0.0114 area after printing a local low around 0.01091, but what stands out to me isn't the rebound itself. It's how quickly price is running back into the cluster of short-term moving averages instead of breaking cleanly above them. That usually shifts the conversation from "reversal" to "confirmation."
Most traders will focus on whether today's candle is green. I'm more interested in whether buyers can keep accepting higher prices once the excitement fades. A single impulse move is easy to produce in a volatile perpetual market. Sustaining it while reclaiming nearby resistance is the harder part.
This is the detail I keep coming back to: the daily chart is still carrying the weight of a much larger downtrend, while the lower timeframes are trying to build a base. That creates a tug-of-war between short-term momentum traders and longer-term sellers who may see every rally as an opportunity to reduce exposure.
For me, the next move matters less than the behavior around this zone. If BABY starts holding above the short-term averages instead of repeatedly getting rejected, the market narrative begins to change. If it can't, this bounce risks becoming another relief rally inside a broader bearish structure.
The market has already shown it can react sharply from the lows. Now it needs to prove that demand can stay consistent.
That's the chart I'm watching—not the size of the bounce, but whether buyers can turn it into acceptance.
@BabylonLabs_io $BABY #baby
BABY has just reclaimed the 0.0114 area after printing a local low around 0.01091, but what stands out to me isn't the rebound itself. It's how quickly price is running back into the cluster of short-term moving averages instead of breaking cleanly above them. That usually shifts the conversation from "reversal" to "confirmation."
Most traders will focus on whether today's candle is green. I'm more interested in whether buyers can keep accepting higher prices once the excitement fades. A single impulse move is easy to produce in a volatile perpetual market. Sustaining it while reclaiming nearby resistance is the harder part.
This is the detail I keep coming back to: the daily chart is still carrying the weight of a much larger downtrend, while the lower timeframes are trying to build a base. That creates a tug-of-war between short-term momentum traders and longer-term sellers who may see every rally as an opportunity to reduce exposure.
For me, the next move matters less than the behavior around this zone. If BABY starts holding above the short-term averages instead of repeatedly getting rejected, the market narrative begins to change. If it can't, this bounce risks becoming another relief rally inside a broader bearish structure.
The market has already shown it can react sharply from the lows. Now it needs to prove that demand can stay consistent.
That's the chart I'm watching—not the size of the bounce, but whether buyers can turn it into acceptance.
@BabylonLabs_io $BABY #baby


4
89
The strongest moves don't always come from the biggest candles. Sometimes they come from the market refusing to give them back.
That's what I'm watching on BABYUSDT today.
After pushing to a fresh intraday high around 0.01150, price has started to pause instead of collapsing. That may not look exciting, but it's often where trends reveal their real strength. A breakout is easy. Holding above it is much harder.
Most traders are focused on catching the next green candle. I'm paying more attention to whether buyers are willing to defend this new price area. If they can, today's rally becomes more than just a momentum spike—it becomes a sign that the market is accepting higher prices.
This is the part I keep coming back to. The best trends usually slow down before they continue. They absorb profit-taking, shake out late buyers, and then show whether demand is still there. That process tells me far more than another quick pump ever could.
For now, I'm not asking whether BABYUSDT can make another high today.
I'm asking whether today's breakout can survive today's trading session.
That answer will say much more about the quality of this move than the breakout itself.
@babylonlabs_io $BABY #baby
The strongest moves don't always come from the biggest candles. Sometimes they come from the market refusing to give them back.
That's what I'm watching on BABYUSDT today.
After pushing to a fresh intraday high around 0.01150, price has started to pause instead of collapsing. That may not look exciting, but it's often where trends reveal their real strength. A breakout is easy. Holding above it is much harder.
Most traders are focused on catching the next green candle. I'm paying more attention to whether buyers are willing to defend this new price area. If they can, today's rally becomes more than just a momentum spike—it becomes a sign that the market is accepting higher prices.
This is the part I keep coming back to. The best trends usually slow down before they continue. They absorb profit-taking, shake out late buyers, and then show whether demand is still there. That process tells me far more than another quick pump ever could.
For now, I'm not asking whether BABYUSDT can make another high today.
I'm asking whether today's breakout can survive today's trading session.
That answer will say much more about the quality of this move than the breakout itself.
@BabylonLabs_io $BABY #baby
That's what I'm watching on BABYUSDT today.
After pushing to a fresh intraday high around 0.01150, price has started to pause instead of collapsing. That may not look exciting, but it's often where trends reveal their real strength. A breakout is easy. Holding above it is much harder.
Most traders are focused on catching the next green candle. I'm paying more attention to whether buyers are willing to defend this new price area. If they can, today's rally becomes more than just a momentum spike—it becomes a sign that the market is accepting higher prices.
This is the part I keep coming back to. The best trends usually slow down before they continue. They absorb profit-taking, shake out late buyers, and then show whether demand is still there. That process tells me far more than another quick pump ever could.
For now, I'm not asking whether BABYUSDT can make another high today.
I'm asking whether today's breakout can survive today's trading session.
That answer will say much more about the quality of this move than the breakout itself.
@BabylonLabs_io $BABY #baby

1
91
more attention to where they're happening.
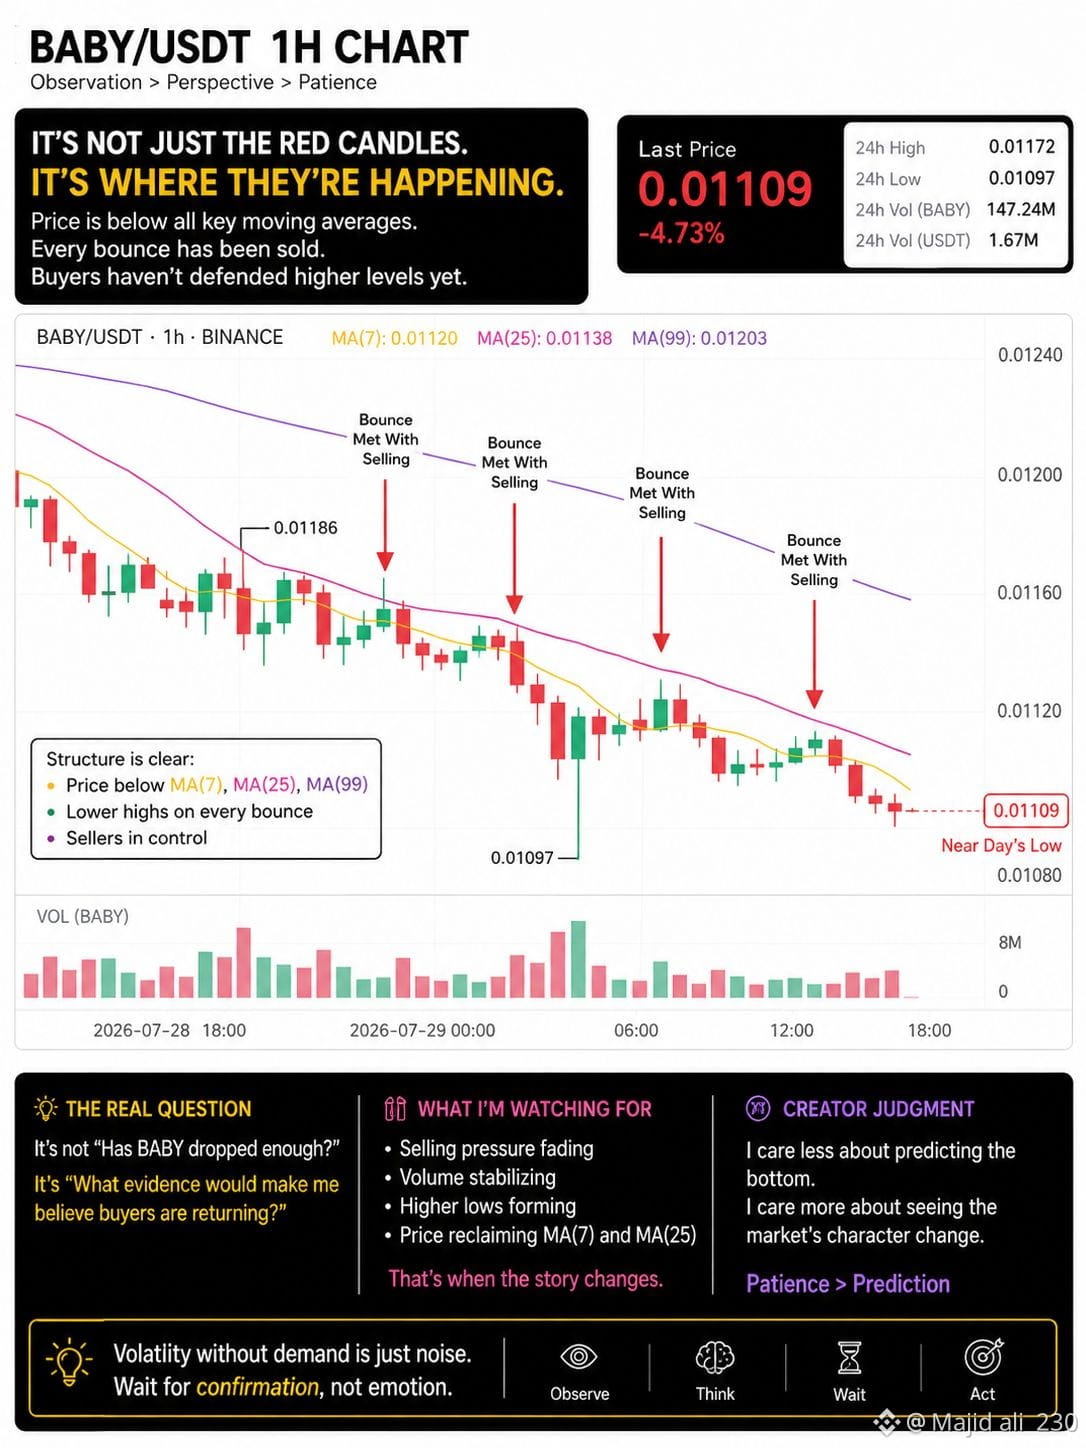
On the 1-hour chart, BABY is trading below its short-, medium-, and long-term moving averages, with price sitting near the day's low after repeated attempts to bounce. That's not just a weak chart—it shows buyers haven't been willing to defend higher levels yet. Every small recovery has been met with fresh selling, which tells me conviction is still missing.
This is the part I keep coming back to: a lot of traders treat new ecosystem tokens as if volatility alone creates opportunity. But volatility without demand is just noise. A token can have active trading, wide price swings, and still spend days searching for a level where real buyers finally step in.
For BABY, I think the next move matters less than how it happens. If price simply spikes on thin momentum, I'm not convinced. What I'd rather see is a period where selling pressure fades, volume begins to stabilize, and higher lows start forming. That's usually a healthier foundation than a single green candle that everyone rushes to chase.
This feels more important than trying to predict the exact bottom. Markets rarely reward impatience, especially after an early downtrend. They reward waiting until the character of the price action changes.
So my question isn't, "Has BABY dropped enough?"
It's, "What evidence would make you believe buyers are returning instead of just taking a short break?"
That's the chart I'm watching—not the price alone, but whether the market starts telling a different story.@babylonlabs_io $BABY #baby
more attention to where they're happening.
On the 1-hour chart, BABY is trading below its short-, medium-, and long-term moving averages, with price sitting near the day's low after repeated attempts to bounce. That's not just a weak chart—it shows buyers haven't been willing to defend higher levels yet. Every small recovery has been met with fresh selling, which tells me conviction is still missing.
This is the part I keep coming back to: a lot of traders treat new ecosystem tokens as if volatility alone creates opportunity. But volatility without demand is just noise. A token can have active trading, wide price swings, and still spend days searching for a level where real buyers finally step in.
For BABY, I think the next move matters less than how it happens. If price simply spikes on thin momentum, I'm not convinced. What I'd rather see is a period where selling pressure fades, volume begins to stabilize, and higher lows start forming. That's usually a healthier foundation than a single green candle that everyone rushes to chase.
This feels more important than trying to predict the exact bottom. Markets rarely reward impatience, especially after an early downtrend. They reward waiting until the character of the price action changes.
So my question isn't, "Has BABY dropped enough?"
It's, "What evidence would make you believe buyers are returning instead of just taking a short break?"
That's the chart I'm watching—not the price alone, but whether the market starts telling a different story.@BabylonLabs_io $BABY #baby
On the 1-hour chart, BABY is trading below its short-, medium-, and long-term moving averages, with price sitting near the day's low after repeated attempts to bounce. That's not just a weak chart—it shows buyers haven't been willing to defend higher levels yet. Every small recovery has been met with fresh selling, which tells me conviction is still missing.
This is the part I keep coming back to: a lot of traders treat new ecosystem tokens as if volatility alone creates opportunity. But volatility without demand is just noise. A token can have active trading, wide price swings, and still spend days searching for a level where real buyers finally step in.
For BABY, I think the next move matters less than how it happens. If price simply spikes on thin momentum, I'm not convinced. What I'd rather see is a period where selling pressure fades, volume begins to stabilize, and higher lows start forming. That's usually a healthier foundation than a single green candle that everyone rushes to chase.
This feels more important than trying to predict the exact bottom. Markets rarely reward impatience, especially after an early downtrend. They reward waiting until the character of the price action changes.
So my question isn't, "Has BABY dropped enough?"
It's, "What evidence would make you believe buyers are returning instead of just taking a short break?"
That's the chart I'm watching—not the price alone, but whether the market starts telling a different story.@BabylonLabs_io $BABY #baby
5
2
81
test. It asks the same question over and over.
That’s exactly what I’m seeing with BABY.
While most attention is on today’s decline, I’m focused on one detail that keeps repeating: 0.0114 has become the market’s decision zone. The daily chart has already revisited it, the 1-hour continues to respect it, and even the 15-minute chart keeps gravitating back to the same area. That’s not confirmation of strength—but it is confirmation that this price matters.
The bigger picture is still cautious. BABY remains below its major moving averages, momentum hasn’t shifted, and every short-term rally has struggled to reclaim higher levels. From a trend perspective, sellers are still in control.
But this is where I think many traders miss the bigger story. Strong support isn’t created because a level holds once. It earns that status through repeated tests. Every revisit reveals whether buyers are becoming more committed or simply delaying another leg down.
This is the detail that changed how I look at the chart. I’m less interested in predicting the next candle and more interested in how the market behaves at a price it clearly keeps defending. If 0.0114 finally breaks with conviction, that tells me far more than today’s red candle. If buyers absorb the pressure again and volume returns, the structure starts to look very different.
For now, I’m not watching the price. I’m watching the battle.
Because when a market keeps returning to the same level, the next reaction often becomes the move that defines the trend—not just the day.
@babylonlabs_io $BABY #baby
test. It asks the same question over and over.
That’s exactly what I’m seeing with BABY.
While most attention is on today’s decline, I’m focused on one detail that keeps repeating: 0.0114 has become the market’s decision zone. The daily chart has already revisited it, the 1-hour continues to respect it, and even the 15-minute chart keeps gravitating back to the same area. That’s not confirmation of strength—but it is confirmation that this price matters.
The bigger picture is still cautious. BABY remains below its major moving averages, momentum hasn’t shifted, and every short-term rally has struggled to reclaim higher levels. From a trend perspective, sellers are still in control.
But this is where I think many traders miss the bigger story. Strong support isn’t created because a level holds once. It earns that status through repeated tests. Every revisit reveals whether buyers are becoming more committed or simply delaying another leg down.
This is the detail that changed how I look at the chart. I’m less interested in predicting the next candle and more interested in how the market behaves at a price it clearly keeps defending. If 0.0114 finally breaks with conviction, that tells me far more than today’s red candle. If buyers absorb the pressure again and volume returns, the structure starts to look very different.
For now, I’m not watching the price. I’m watching the battle.
Because when a market keeps returning to the same level, the next reaction often becomes the move that defines the trend—not just the day.
@BabylonLabs_io $BABY #baby
That’s exactly what I’m seeing with BABY.
While most attention is on today’s decline, I’m focused on one detail that keeps repeating: 0.0114 has become the market’s decision zone. The daily chart has already revisited it, the 1-hour continues to respect it, and even the 15-minute chart keeps gravitating back to the same area. That’s not confirmation of strength—but it is confirmation that this price matters.
The bigger picture is still cautious. BABY remains below its major moving averages, momentum hasn’t shifted, and every short-term rally has struggled to reclaim higher levels. From a trend perspective, sellers are still in control.
But this is where I think many traders miss the bigger story. Strong support isn’t created because a level holds once. It earns that status through repeated tests. Every revisit reveals whether buyers are becoming more committed or simply delaying another leg down.
This is the detail that changed how I look at the chart. I’m less interested in predicting the next candle and more interested in how the market behaves at a price it clearly keeps defending. If 0.0114 finally breaks with conviction, that tells me far more than today’s red candle. If buyers absorb the pressure again and volume returns, the structure starts to look very different.
For now, I’m not watching the price. I’m watching the battle.
Because when a market keeps returning to the same level, the next reaction often becomes the move that defines the trend—not just the day.
@BabylonLabs_io $BABY #baby


1
84
The chart is telling a different story than the timeline on Crypto X.
After BABY pushed to 0.01296, sellers stepped in almost immediately and erased the move within a few 15-minute candles. What caught my attention wasn't the rejection itself—volatile launches do that all the time. It was how quickly buyers stopped defending higher prices once momentum faded.
That changes the question.
Instead of asking, "Can BABY bounce from here?" I'm asking, "Who is still willing to buy after the excitement disappears?" Those are two very different markets.
The volume spike during the sell-off suggests participation is still there, but participation alone doesn't create a trend. It only tells us that price discovery is still happening. Until buyers prove they can absorb selling and reclaim key moving averages, every bounce risks becoming another opportunity for short-term traders to exit.
This is the part I keep coming back to: the first sharp pullback after an initial expansion often reveals more about a market than the breakout itself. Strong markets usually attract buyers into weakness. Weak markets keep making lower highs because confidence leaves faster than liquidity.
I'm not treating today's drop as a verdict on BABY. I'm treating it as the beginning of the market's first real stress test. That feels more important than trying to predict the next candle.
So here's the question I'm watching over the next few sessions: if price revisits this area again, will buyers defend it with conviction, or will this level simply become another stop on the way lower?
That answer will probably matter more than today's red candle.@babylonlabs_io $BABY #baby
The chart is telling a different story than the timeline on Crypto X.
After BABY pushed to 0.01296, sellers stepped in almost immediately and erased the move within a few 15-minute candles. What caught my attention wasn't the rejection itself—volatile launches do that all the time. It was how quickly buyers stopped defending higher prices once momentum faded.
That changes the question.
Instead of asking, "Can BABY bounce from here?" I'm asking, "Who is still willing to buy after the excitement disappears?" Those are two very different markets.
The volume spike during the sell-off suggests participation is still there, but participation alone doesn't create a trend. It only tells us that price discovery is still happening. Until buyers prove they can absorb selling and reclaim key moving averages, every bounce risks becoming another opportunity for short-term traders to exit.
This is the part I keep coming back to: the first sharp pullback after an initial expansion often reveals more about a market than the breakout itself. Strong markets usually attract buyers into weakness. Weak markets keep making lower highs because confidence leaves faster than liquidity.
I'm not treating today's drop as a verdict on BABY. I'm treating it as the beginning of the market's first real stress test. That feels more important than trying to predict the next candle.
So here's the question I'm watching over the next few sessions: if price revisits this area again, will buyers defend it with conviction, or will this level simply become another stop on the way lower?
That answer will probably matter more than today's red candle.@BabylonLabs_io $BABY #baby
After BABY pushed to 0.01296, sellers stepped in almost immediately and erased the move within a few 15-minute candles. What caught my attention wasn't the rejection itself—volatile launches do that all the time. It was how quickly buyers stopped defending higher prices once momentum faded.
That changes the question.
Instead of asking, "Can BABY bounce from here?" I'm asking, "Who is still willing to buy after the excitement disappears?" Those are two very different markets.
The volume spike during the sell-off suggests participation is still there, but participation alone doesn't create a trend. It only tells us that price discovery is still happening. Until buyers prove they can absorb selling and reclaim key moving averages, every bounce risks becoming another opportunity for short-term traders to exit.
This is the part I keep coming back to: the first sharp pullback after an initial expansion often reveals more about a market than the breakout itself. Strong markets usually attract buyers into weakness. Weak markets keep making lower highs because confidence leaves faster than liquidity.
I'm not treating today's drop as a verdict on BABY. I'm treating it as the beginning of the market's first real stress test. That feels more important than trying to predict the next candle.
So here's the question I'm watching over the next few sessions: if price revisits this area again, will buyers defend it with conviction, or will this level simply become another stop on the way lower?
That answer will probably matter more than today's red candle.@BabylonLabs_io $BABY #baby

4
3
98
The easiest money is made in the excitement. The biggest money is often made in the patience that follows.
BABY exploded to 0.01278, but the move that matters now isn't the breakout—it's the market's refusal to completely give it back. After the volatility cooled, price found itself battling around 0.01248 instead of collapsing to where the rally began.
That's the detail I can't ignore.
Breakouts attract attention. Holding higher prices attracts conviction. Those are two very different things.
Right now, the chart is asking a simple question: Are buyers defending value, or just defending emotion? The answer won't come from another oversized green candle. It'll come from how price behaves during these quieter candles, when FOMO disappears and only real demand remains.
I've learned to trust consolidation more than celebration. A market that can stay strong after the excitement usually tells a clearer story than one that only knows how to spike.
For me, this isn't about predicting the next move. It's about watching whether BABY can turn a breakout into a foundation. If it can, today's consolidation may end up being remembered as the start of a trend—not the end of a pump.
The loudest candle got everyone's attention. The quiet candles will decide whether it actually mattered.a@babylonlabs_io $BABY #baby
The easiest money is made in the excitement. The biggest money is often made in the patience that follows.
BABY exploded to 0.01278, but the move that matters now isn't the breakout—it's the market's refusal to completely give it back. After the volatility cooled, price found itself battling around 0.01248 instead of collapsing to where the rally began.
That's the detail I can't ignore.
Breakouts attract attention. Holding higher prices attracts conviction. Those are two very different things.
Right now, the chart is asking a simple question: Are buyers defending value, or just defending emotion? The answer won't come from another oversized green candle. It'll come from how price behaves during these quieter candles, when FOMO disappears and only real demand remains.
I've learned to trust consolidation more than celebration. A market that can stay strong after the excitement usually tells a clearer story than one that only knows how to spike.
For me, this isn't about predicting the next move. It's about watching whether BABY can turn a breakout into a foundation. If it can, today's consolidation may end up being remembered as the start of a trend—not the end of a pump.
The loudest candle got everyone's attention. The quiet candles will decide whether it actually mattered.a@BabylonLabs_io $BABY #baby
BABY exploded to 0.01278, but the move that matters now isn't the breakout—it's the market's refusal to completely give it back. After the volatility cooled, price found itself battling around 0.01248 instead of collapsing to where the rally began.
That's the detail I can't ignore.
Breakouts attract attention. Holding higher prices attracts conviction. Those are two very different things.
Right now, the chart is asking a simple question: Are buyers defending value, or just defending emotion? The answer won't come from another oversized green candle. It'll come from how price behaves during these quieter candles, when FOMO disappears and only real demand remains.
I've learned to trust consolidation more than celebration. A market that can stay strong after the excitement usually tells a clearer story than one that only knows how to spike.
For me, this isn't about predicting the next move. It's about watching whether BABY can turn a breakout into a foundation. If it can, today's consolidation may end up being remembered as the start of a trend—not the end of a pump.
The loudest candle got everyone's attention. The quiet candles will decide whether it actually mattered.a@BabylonLabs_io $BABY #baby

82
Most traders are staring at BABY's next candle. I'm watching what happens when the market finally stops hesitating.
After a sharp sell-off, BABY has settled into a tight consolidation between support and resistance. That might look boring, but these quiet phases often reveal more than the impulsive moves. Every failed push higher shows sellers are still active. Every defense of the lows shows buyers haven't disappeared either. The market is building pressure—it just hasn't chosen a direction yet.
This is where I think many traders get it wrong. They rush to trade the breakout instead of judging the quality of the breakout. A move without volume is just noise. A breakout that immediately loses its level is often a trap. The real edge comes from watching whether the market accepts higher prices or rejects them just as quickly.
This is the detail that changed how I look at BABY. I'm no longer trying to predict the first move. I'm waiting to see which side can actually hold control after the move begins. That's the difference between momentum and a fakeout.
For now, BABY isn't giving certainty—it's giving a test of patience. And in my experience, patience is often rewarded more than prediction.
The question I'm asking isn't, "Will BABY break out?" It's "When it does, will the market have enough conviction to keep price there?" That's the move worth paying attention to.
@babylonlabs_io $BABY #baby
Most traders are staring at BABY's next candle. I'm watching what happens when the market finally stops hesitating.
After a sharp sell-off, BABY has settled into a tight consolidation between support and resistance. That might look boring, but these quiet phases often reveal more than the impulsive moves. Every failed push higher shows sellers are still active. Every defense of the lows shows buyers haven't disappeared either. The market is building pressure—it just hasn't chosen a direction yet.
This is where I think many traders get it wrong. They rush to trade the breakout instead of judging the quality of the breakout. A move without volume is just noise. A breakout that immediately loses its level is often a trap. The real edge comes from watching whether the market accepts higher prices or rejects them just as quickly.
This is the detail that changed how I look at BABY. I'm no longer trying to predict the first move. I'm waiting to see which side can actually hold control after the move begins. That's the difference between momentum and a fakeout.
For now, BABY isn't giving certainty—it's giving a test of patience. And in my experience, patience is often rewarded more than prediction.
The question I'm asking isn't, "Will BABY break out?" It's "When it does, will the market have enough conviction to keep price there?" That's the move worth paying attention to.
@BabylonLabs_io $BABY #baby
After a sharp sell-off, BABY has settled into a tight consolidation between support and resistance. That might look boring, but these quiet phases often reveal more than the impulsive moves. Every failed push higher shows sellers are still active. Every defense of the lows shows buyers haven't disappeared either. The market is building pressure—it just hasn't chosen a direction yet.
This is where I think many traders get it wrong. They rush to trade the breakout instead of judging the quality of the breakout. A move without volume is just noise. A breakout that immediately loses its level is often a trap. The real edge comes from watching whether the market accepts higher prices or rejects them just as quickly.
This is the detail that changed how I look at BABY. I'm no longer trying to predict the first move. I'm waiting to see which side can actually hold control after the move begins. That's the difference between momentum and a fakeout.
For now, BABY isn't giving certainty—it's giving a test of patience. And in my experience, patience is often rewarded more than prediction.
The question I'm asking isn't, "Will BABY break out?" It's "When it does, will the market have enough conviction to keep price there?" That's the move worth paying attention to.
@BabylonLabs_io $BABY #baby

2
69
·
--
Bearish
That is why I'm paying attention to Trustless Bitcoin Vaults from @babylonlabs_io . The biggest shift isn't higher yields or another Bitcoin narrative—it's the attempt to reduce trust assumptions while keeping BTC secured by Bitcoin through a Taproot-based vault and using cryptographic proofs to coordinate across networks. That's a very different design philosophy from simply wrapping assets and hoping the bridge remains the weakest link.
This is the detail that changed how I look at it. Infrastructure isn't interesting because it's flashy. It's interesting because it quietly determines who holds power when markets become volatile. If the security model is stronger from day one, every application built on top starts from a better foundation.
Most people focus on features. I'm watching assumptions. The projects that spend more effort removing trust than adding marketing are usually the ones worth following over multiple cycles, because strong infrastructure compounds in ways price charts can't immediately show.
We're still early enough that the biggest winners may not be the loudest narratives, but the protocols solving problems users don't fully appreciate until something breaks. For me, that's why Babylon's TBV stands out. The real innovation isn't moving Bitcoin—it's questioning whether we should ever have to give up control of it in the first place.
Will reducing trust assumptions become the standard for Bitcoin-powered DeFi, or remain a niche approach? That's the question I'm watching most.
@babylonlabs_io $BABY #baby
{spot}(BABYUSDT)
That is why I'm paying attention to Trustless Bitcoin Vaults from @BabylonLabs_io . The biggest shift isn't higher yields or another Bitcoin narrative—it's the attempt to reduce trust assumptions while keeping BTC secured by Bitcoin through a Taproot-based vault and using cryptographic proofs to coordinate across networks. That's a very different design philosophy from simply wrapping assets and hoping the bridge remains the weakest link.
This is the detail that changed how I look at it. Infrastructure isn't interesting because it's flashy. It's interesting because it quietly determines who holds power when markets become volatile. If the security model is stronger from day one, every application built on top starts from a better foundation.
Most people focus on features. I'm watching assumptions. The projects that spend more effort removing trust than adding marketing are usually the ones worth following over multiple cycles, because strong infrastructure compounds in ways price charts can't immediately show.
We're still early enough that the biggest winners may not be the loudest narratives, but the protocols solving problems users don't fully appreciate until something breaks. For me, that's why Babylon's TBV stands out. The real innovation isn't moving Bitcoin—it's questioning whether we should ever have to give up control of it in the first place.
Will reducing trust assumptions become the standard for Bitcoin-powered DeFi, or remain a niche approach? That's the question I'm watching most.
@BabylonLabs_io $BABY #baby
This is the detail that changed how I look at it. Infrastructure isn't interesting because it's flashy. It's interesting because it quietly determines who holds power when markets become volatile. If the security model is stronger from day one, every application built on top starts from a better foundation.
Most people focus on features. I'm watching assumptions. The projects that spend more effort removing trust than adding marketing are usually the ones worth following over multiple cycles, because strong infrastructure compounds in ways price charts can't immediately show.
We're still early enough that the biggest winners may not be the loudest narratives, but the protocols solving problems users don't fully appreciate until something breaks. For me, that's why Babylon's TBV stands out. The real innovation isn't moving Bitcoin—it's questioning whether we should ever have to give up control of it in the first place.
Will reducing trust assumptions become the standard for Bitcoin-powered DeFi, or remain a niche approach? That's the question I'm watching most.
@BabylonLabs_io $BABY #baby

3
1
91
Price flushed to around $0.01243, then buyers stepped in almost instantly. That doesn't automatically mean the bottom is in, but it does tell us one thing: there was enough demand waiting below to reject the move before panic selling could fully take over.
What I'm watching now isn't whether $BABY bounces 2% or 3%. It's whether this reaction becomes a real support level or just a temporary pause before another wave of selling.
On the 15-minute chart, price is still trading below the short-term moving averages, so momentum hasn't shifted yet. A single green candle after a sell-off is easy to celebrate. Holding above the recent low while reclaiming those moving averages is much harder—and far more meaningful.
This is the detail that changed how I'm looking at this chart. The first rebound catches attention, but the second test usually reveals intent. If buyers defend the area again with stronger volume, that tells a very different story than a one-time reaction followed by another breakdown.
Too many traders focus on predicting the next candle. I'd rather watch how the market behaves around levels where both buyers and sellers have already shown conviction. That's where the better clues usually appear.
For me, the next question isn't "Will $BABY pump?" It's much simpler:
Can buyers prove that $0.01243 was accumulation instead of just a brief relief bounce?@babylonlabs_io $BABY #baby
Price flushed to around $0.01243, then buyers stepped in almost instantly. That doesn't automatically mean the bottom is in, but it does tell us one thing: there was enough demand waiting below to reject the move before panic selling could fully take over.
What I'm watching now isn't whether $BABY bounces 2% or 3%. It's whether this reaction becomes a real support level or just a temporary pause before another wave of selling.
On the 15-minute chart, price is still trading below the short-term moving averages, so momentum hasn't shifted yet. A single green candle after a sell-off is easy to celebrate. Holding above the recent low while reclaiming those moving averages is much harder—and far more meaningful.
This is the detail that changed how I'm looking at this chart. The first rebound catches attention, but the second test usually reveals intent. If buyers defend the area again with stronger volume, that tells a very different story than a one-time reaction followed by another breakdown.
Too many traders focus on predicting the next candle. I'd rather watch how the market behaves around levels where both buyers and sellers have already shown conviction. That's where the better clues usually appear.
For me, the next question isn't "Will $BABY pump?" It's much simpler:
Can buyers prove that $0.01243 was accumulation instead of just a brief relief bounce?@BabylonLabs_io $BABY #baby
What I'm watching now isn't whether $BABY bounces 2% or 3%. It's whether this reaction becomes a real support level or just a temporary pause before another wave of selling.
On the 15-minute chart, price is still trading below the short-term moving averages, so momentum hasn't shifted yet. A single green candle after a sell-off is easy to celebrate. Holding above the recent low while reclaiming those moving averages is much harder—and far more meaningful.
This is the detail that changed how I'm looking at this chart. The first rebound catches attention, but the second test usually reveals intent. If buyers defend the area again with stronger volume, that tells a very different story than a one-time reaction followed by another breakdown.
Too many traders focus on predicting the next candle. I'd rather watch how the market behaves around levels where both buyers and sellers have already shown conviction. That's where the better clues usually appear.
For me, the next question isn't "Will $BABY pump?" It's much simpler:
Can buyers prove that $0.01243 was accumulation instead of just a brief relief bounce?@BabylonLabs_io $BABY #baby

6
2
105
·
--
Bearish
The part that keeps pulling me back isn't that Newton launched its Mainnet Beta. It's where the protocol chooses to intervene.
Most blockchain infrastructure waits until after a transaction is executed to detect problems. Newton's design shifts that logic forward by evaluating policies before settlement and producing verifiable attestations when those policies are satisfied. That sounds like a subtle architectural choice, but I think it changes the conversation from "monitoring" to "preventing." �
Magic Newton +1
This feels more important than the headline because automation is becoming normal. The more decisions wallets and AI agents make on our behalf, the less useful "we'll detect it later" becomes. If permissions, risk checks, and policy enforcement happen before assets move, the trust model starts looking very different. That's a harder problem than simply making transactions faster.
The other detail I'm watching is how this evolves during the Mainnet Beta. Official materials describe NEWT as supporting staking, protocol fees, and the authorization framework that powers verifiable onchain automation. Those pieces only become meaningful if developers actually build workflows that depend on them. �
Magic Newton +1
That's why I'm paying more attention to adoption of the authorization layer than short-term price action.
The real test isn't whether people use AI onchain. It's whether they trust automated actions enough to let them move real value under enforceable rules.
@NewtonProtocol $NEWT #Newt
{spot}(NEWTUSDT)
The part that keeps pulling me back isn't that Newton launched its Mainnet Beta. It's where the protocol chooses to intervene.
Most blockchain infrastructure waits until after a transaction is executed to detect problems. Newton's design shifts that logic forward by evaluating policies before settlement and producing verifiable attestations when those policies are satisfied. That sounds like a subtle architectural choice, but I think it changes the conversation from "monitoring" to "preventing." �
Magic Newton +1
This feels more important than the headline because automation is becoming normal. The more decisions wallets and AI agents make on our behalf, the less useful "we'll detect it later" becomes. If permissions, risk checks, and policy enforcement happen before assets move, the trust model starts looking very different. That's a harder problem than simply making transactions faster.
The other detail I'm watching is how this evolves during the Mainnet Beta. Official materials describe NEWT as supporting staking, protocol fees, and the authorization framework that powers verifiable onchain automation. Those pieces only become meaningful if developers actually build workflows that depend on them. �
Magic Newton +1
That's why I'm paying more attention to adoption of the authorization layer than short-term price action.
The real test isn't whether people use AI onchain. It's whether they trust automated actions enough to let them move real value under enforceable rules.
@NewtonProtocol $NEWT #Newt
Most blockchain infrastructure waits until after a transaction is executed to detect problems. Newton's design shifts that logic forward by evaluating policies before settlement and producing verifiable attestations when those policies are satisfied. That sounds like a subtle architectural choice, but I think it changes the conversation from "monitoring" to "preventing." �
Magic Newton +1
This feels more important than the headline because automation is becoming normal. The more decisions wallets and AI agents make on our behalf, the less useful "we'll detect it later" becomes. If permissions, risk checks, and policy enforcement happen before assets move, the trust model starts looking very different. That's a harder problem than simply making transactions faster.
The other detail I'm watching is how this evolves during the Mainnet Beta. Official materials describe NEWT as supporting staking, protocol fees, and the authorization framework that powers verifiable onchain automation. Those pieces only become meaningful if developers actually build workflows that depend on them. �
Magic Newton +1
That's why I'm paying more attention to adoption of the authorization layer than short-term price action.
The real test isn't whether people use AI onchain. It's whether they trust automated actions enough to let them move real value under enforceable rules.
@NewtonProtocol $NEWT #Newt

69
Article
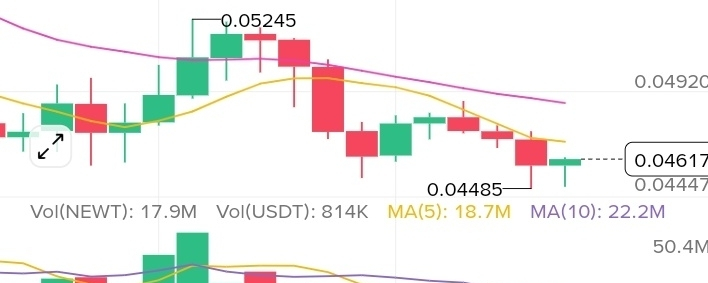
Reading a Weak Market: What the NEWTUSDT Chart Really Reveals Beyond the CandlesticksAt first glance, the NEWTUSDT daily chart looks unremarkable. Price is drifting lower, the moving averages are sloping downward, and volatility appears contained rather than dramatic. Many traders would stop there, label it "bearish," and move on. That conclusion is not necessarily wrong—but it misses the more interesting story.
Markets rarely communicate through a single candle. They reveal themselves through relationships: the relationship between price and trend, between participation and conviction, and between expectations and reality. Those relationships often matter far more than the latest red or green bar.
One detail that immediately stands out is the alignment of the moving averages. The shorter-term averages remain below the longer-term trend, and all of them continue pointing downward. This isn't simply a sign that price has fallen. It suggests that each new wave of trading has consistently accepted lower valuations than the one before it. In practical terms, buyers are still reacting to price rather than defining it. They are providing temporary support, not changing the market's direction.
An equally important observation is how weak rallies behave. Strong markets tend to reject lower prices quickly. They produce impulsive recoveries that force short sellers to cover and convince sidelined buyers to participate. Weak markets behave differently. Every bounce becomes an opportunity for existing holders to reduce exposure rather than increase it. As selling pressure appears on relatively small recoveries, the market slowly develops a staircase pattern where each recovery reaches a lower ceiling than the previous one.
The recent price action reflects exactly this kind of environment. There is no evidence of panic selling, yet there is also no indication that demand is becoming aggressive. Instead, the market seems comfortable trading within a gradually declining range. Ironically, this type of price action can be more dangerous than a sharp decline because it slowly drains optimism. Traders continue expecting a reversal while the trend quietly persists in the opposite direction.
Volume adds another layer to this picture. Although daily participation has not disappeared, it has become less effective. Volume alone never proves buying or selling pressure. What matters is what price accomplishes with that volume. When meaningful trading activity produces only small upward movement before sellers regain control, it often indicates that liquidity is being absorbed by stronger hands distributing positions rather than accumulating them.
Another overlooked feature is market psychology around local lows. Every time price approaches recent support, attention naturally increases. Many participants assume that because a level held previously, it should continue holding. Markets are not built around memory; they are built around current supply and demand. A support level weakens every time it is tested because each bounce consumes part of the available buying interest. If fresh demand does not replace exhausted buyers, the probability of a breakdown gradually increases.
Perhaps the most valuable lesson from this chart has little to do with technical indicators themselves. Indicators describe what has already happened. They rarely explain why participants are behaving the way they are. A declining moving average does not create a bearish market; it simply reflects weeks of sellers consistently accepting lower prices. Understanding this distinction changes how traders interpret signals. Instead of reacting mechanically whenever price crosses a line, experienced traders ask what collective behavior caused that line to move in the first place.
This distinction becomes especially important in cryptocurrency markets, where narratives often dominate short-term decision-making. New listings, ecosystem announcements, and social media enthusiasm can temporarily overwhelm technical weakness. Yet if those catalysts fail to attract sustained buying, the underlying trend usually reasserts itself once excitement fades. Technical structure ultimately reflects where real capital chooses to stay, not where temporary attention happens to focus.
The chart therefore illustrates something broader than a single token's performance. It demonstrates how trends gradually shape expectations. As prices decline, optimism turns into caution. Caution eventually becomes patience. Finally, patience gives way to indifference. Ironically, genuine trend reversals often begin only after this emotional transition has largely completed—not because indicators suddenly improve, but because selling pressure has quietly exhausted itself.
For traders, the most useful takeaway is not predicting the next candle. It is recognizing the current market environment. At present, the evidence favors a market that remains under seller control despite occasional relief rallies. Until price begins producing higher highs, higher lows, and stronger buying participation capable of overcoming the downward trend, every recovery should be viewed as a hypothesis rather than confirmation that a new bull phase has begun.
In financial markets, the hardest skill is not forecasting the future. It is accurately describing the present without allowing hope, fear, or recent experience to distort the evidence. This chart serves as a reminder that successful analysis is less about finding certainty and more about understanding the balance of probabilities hidden beneath seemingly ordinary price movements.
@NewtonProtocol $NEWT #Newt
Reading a Weak Market: What the NEWTUSDT Chart Really Reveals Beyond the Candlesticks
At first glance, the NEWTUSDT daily chart looks unremarkable. Price is drifting lower, the moving averages are sloping downward, and volatility appears contained rather than dramatic. Many traders would stop there, label it "bearish," and move on. That conclusion is not necessarily wrong—but it misses the more interesting story.
Markets rarely communicate through a single candle. They reveal themselves through relationships: the relationship between price and trend, between participation and conviction, and between expectations and reality. Those relationships often matter far more than the latest red or green bar.
One detail that immediately stands out is the alignment of the moving averages. The shorter-term averages remain below the longer-term trend, and all of them continue pointing downward. This isn't simply a sign that price has fallen. It suggests that each new wave of trading has consistently accepted lower valuations than the one before it. In practical terms, buyers are still reacting to price rather than defining it. They are providing temporary support, not changing the market's direction.
An equally important observation is how weak rallies behave. Strong markets tend to reject lower prices quickly. They produce impulsive recoveries that force short sellers to cover and convince sidelined buyers to participate. Weak markets behave differently. Every bounce becomes an opportunity for existing holders to reduce exposure rather than increase it. As selling pressure appears on relatively small recoveries, the market slowly develops a staircase pattern where each recovery reaches a lower ceiling than the previous one.
The recent price action reflects exactly this kind of environment. There is no evidence of panic selling, yet there is also no indication that demand is becoming aggressive. Instead, the market seems comfortable trading within a gradually declining range. Ironically, this type of price action can be more dangerous than a sharp decline because it slowly drains optimism. Traders continue expecting a reversal while the trend quietly persists in the opposite direction.
Volume adds another layer to this picture. Although daily participation has not disappeared, it has become less effective. Volume alone never proves buying or selling pressure. What matters is what price accomplishes with that volume. When meaningful trading activity produces only small upward movement before sellers regain control, it often indicates that liquidity is being absorbed by stronger hands distributing positions rather than accumulating them.
Another overlooked feature is market psychology around local lows. Every time price approaches recent support, attention naturally increases. Many participants assume that because a level held previously, it should continue holding. Markets are not built around memory; they are built around current supply and demand. A support level weakens every time it is tested because each bounce consumes part of the available buying interest. If fresh demand does not replace exhausted buyers, the probability of a breakdown gradually increases.
Perhaps the most valuable lesson from this chart has little to do with technical indicators themselves. Indicators describe what has already happened. They rarely explain why participants are behaving the way they are. A declining moving average does not create a bearish market; it simply reflects weeks of sellers consistently accepting lower prices. Understanding this distinction changes how traders interpret signals. Instead of reacting mechanically whenever price crosses a line, experienced traders ask what collective behavior caused that line to move in the first place.
This distinction becomes especially important in cryptocurrency markets, where narratives often dominate short-term decision-making. New listings, ecosystem announcements, and social media enthusiasm can temporarily overwhelm technical weakness. Yet if those catalysts fail to attract sustained buying, the underlying trend usually reasserts itself once excitement fades. Technical structure ultimately reflects where real capital chooses to stay, not where temporary attention happens to focus.
The chart therefore illustrates something broader than a single token's performance. It demonstrates how trends gradually shape expectations. As prices decline, optimism turns into caution. Caution eventually becomes patience. Finally, patience gives way to indifference. Ironically, genuine trend reversals often begin only after this emotional transition has largely completed—not because indicators suddenly improve, but because selling pressure has quietly exhausted itself.
For traders, the most useful takeaway is not predicting the next candle. It is recognizing the current market environment. At present, the evidence favors a market that remains under seller control despite occasional relief rallies. Until price begins producing higher highs, higher lows, and stronger buying participation capable of overcoming the downward trend, every recovery should be viewed as a hypothesis rather than confirmation that a new bull phase has begun.
In financial markets, the hardest skill is not forecasting the future. It is accurately describing the present without allowing hope, fear, or recent experience to distort the evidence. This chart serves as a reminder that successful analysis is less about finding certainty and more about understanding the balance of probabilities hidden beneath seemingly ordinary price movements.
@NewtonProtocol $NEWT #Newt
Markets rarely communicate through a single candle. They reveal themselves through relationships: the relationship between price and trend, between participation and conviction, and between expectations and reality. Those relationships often matter far more than the latest red or green bar.
One detail that immediately stands out is the alignment of the moving averages. The shorter-term averages remain below the longer-term trend, and all of them continue pointing downward. This isn't simply a sign that price has fallen. It suggests that each new wave of trading has consistently accepted lower valuations than the one before it. In practical terms, buyers are still reacting to price rather than defining it. They are providing temporary support, not changing the market's direction.
An equally important observation is how weak rallies behave. Strong markets tend to reject lower prices quickly. They produce impulsive recoveries that force short sellers to cover and convince sidelined buyers to participate. Weak markets behave differently. Every bounce becomes an opportunity for existing holders to reduce exposure rather than increase it. As selling pressure appears on relatively small recoveries, the market slowly develops a staircase pattern where each recovery reaches a lower ceiling than the previous one.
The recent price action reflects exactly this kind of environment. There is no evidence of panic selling, yet there is also no indication that demand is becoming aggressive. Instead, the market seems comfortable trading within a gradually declining range. Ironically, this type of price action can be more dangerous than a sharp decline because it slowly drains optimism. Traders continue expecting a reversal while the trend quietly persists in the opposite direction.
Volume adds another layer to this picture. Although daily participation has not disappeared, it has become less effective. Volume alone never proves buying or selling pressure. What matters is what price accomplishes with that volume. When meaningful trading activity produces only small upward movement before sellers regain control, it often indicates that liquidity is being absorbed by stronger hands distributing positions rather than accumulating them.
Another overlooked feature is market psychology around local lows. Every time price approaches recent support, attention naturally increases. Many participants assume that because a level held previously, it should continue holding. Markets are not built around memory; they are built around current supply and demand. A support level weakens every time it is tested because each bounce consumes part of the available buying interest. If fresh demand does not replace exhausted buyers, the probability of a breakdown gradually increases.
Perhaps the most valuable lesson from this chart has little to do with technical indicators themselves. Indicators describe what has already happened. They rarely explain why participants are behaving the way they are. A declining moving average does not create a bearish market; it simply reflects weeks of sellers consistently accepting lower prices. Understanding this distinction changes how traders interpret signals. Instead of reacting mechanically whenever price crosses a line, experienced traders ask what collective behavior caused that line to move in the first place.
This distinction becomes especially important in cryptocurrency markets, where narratives often dominate short-term decision-making. New listings, ecosystem announcements, and social media enthusiasm can temporarily overwhelm technical weakness. Yet if those catalysts fail to attract sustained buying, the underlying trend usually reasserts itself once excitement fades. Technical structure ultimately reflects where real capital chooses to stay, not where temporary attention happens to focus.
The chart therefore illustrates something broader than a single token's performance. It demonstrates how trends gradually shape expectations. As prices decline, optimism turns into caution. Caution eventually becomes patience. Finally, patience gives way to indifference. Ironically, genuine trend reversals often begin only after this emotional transition has largely completed—not because indicators suddenly improve, but because selling pressure has quietly exhausted itself.
For traders, the most useful takeaway is not predicting the next candle. It is recognizing the current market environment. At present, the evidence favors a market that remains under seller control despite occasional relief rallies. Until price begins producing higher highs, higher lows, and stronger buying participation capable of overcoming the downward trend, every recovery should be viewed as a hypothesis rather than confirmation that a new bull phase has begun.
In financial markets, the hardest skill is not forecasting the future. It is accurately describing the present without allowing hope, fear, or recent experience to distort the evidence. This chart serves as a reminder that successful analysis is less about finding certainty and more about understanding the balance of probabilities hidden beneath seemingly ordinary price movements.
@NewtonProtocol $NEWT #Newt
83
NEWTUSDT Analysis | Market Structure Speaks Louder Than Hype
Everyone is waiting for a bounce. The chart isn't.
NEWTUSDT continues to trade below its key moving averages, with the 7 MA below the 25 MA and both sitting far beneath the 99 MA. This alignment reflects a market where sellers still control the broader trend, even if short-term relief rallies appear.
The recent candles reveal an important detail: every recovery attempt has been weak and short-lived. Buyers are stepping in, but not with enough conviction to break resistance or establish higher highs. That's a sign of low confidence rather than hidden strength.
Volume is also fading. Many traders assume lower volume means selling is over, but often it simply means participation is drying up. Without fresh demand, price can continue drifting lower even without aggressive selling.
The key zone to watch is around $0.044–0.045. Holding above it could trigger a relief bounce, but losing it may open the door to another leg down. For any sustainable reversal, price needs to reclaim the 25 MA with rising volume and begin forming higher highs and higher lows.
Current Bias: Bearish until proven otherwise.
Remember: Oversold doesn't mean undervalued. Trend always deserves more respect than hope.
Not financial advice. Always manage risk.
@NewtonProtocol $NEWT #Newt
NEWTUSDT Analysis | Market Structure Speaks Louder Than Hype
Everyone is waiting for a bounce. The chart isn't.
NEWTUSDT continues to trade below its key moving averages, with the 7 MA below the 25 MA and both sitting far beneath the 99 MA. This alignment reflects a market where sellers still control the broader trend, even if short-term relief rallies appear.
The recent candles reveal an important detail: every recovery attempt has been weak and short-lived. Buyers are stepping in, but not with enough conviction to break resistance or establish higher highs. That's a sign of low confidence rather than hidden strength.
Volume is also fading. Many traders assume lower volume means selling is over, but often it simply means participation is drying up. Without fresh demand, price can continue drifting lower even without aggressive selling.
The key zone to watch is around $0.044–0.045. Holding above it could trigger a relief bounce, but losing it may open the door to another leg down. For any sustainable reversal, price needs to reclaim the 25 MA with rising volume and begin forming higher highs and higher lows.
Current Bias: Bearish until proven otherwise.
Remember: Oversold doesn't mean undervalued. Trend always deserves more respect than hope.
Not financial advice. Always manage risk.
@NewtonProtocol $NEWT #Newt
Everyone is waiting for a bounce. The chart isn't.
NEWTUSDT continues to trade below its key moving averages, with the 7 MA below the 25 MA and both sitting far beneath the 99 MA. This alignment reflects a market where sellers still control the broader trend, even if short-term relief rallies appear.
The recent candles reveal an important detail: every recovery attempt has been weak and short-lived. Buyers are stepping in, but not with enough conviction to break resistance or establish higher highs. That's a sign of low confidence rather than hidden strength.
Volume is also fading. Many traders assume lower volume means selling is over, but often it simply means participation is drying up. Without fresh demand, price can continue drifting lower even without aggressive selling.
The key zone to watch is around $0.044–0.045. Holding above it could trigger a relief bounce, but losing it may open the door to another leg down. For any sustainable reversal, price needs to reclaim the 25 MA with rising volume and begin forming higher highs and higher lows.
Current Bias: Bearish until proven otherwise.
Remember: Oversold doesn't mean undervalued. Trend always deserves more respect than hope.
Not financial advice. Always manage risk.
@NewtonProtocol $NEWT #Newt

65

Article
Paid Partnership with @newton_xyz
I've spent a lot of time looking at blockchain infrastructure oveI've spent a lot of time looking at blockchain infrastructure over the years, and one pattern keeps repeating: we build faster networks, but we rarely improve how people actually coordinate value across them. Through that lens, Newton Protocol caught my attention for a different reason.
The interesting part isn't simply that the Newton Mainnet Beta exists. It's the design philosophy behind it. Most infrastructure conversations focus on throughput or lower fees, but those metrics only matter if they reduce friction for real users and developers. What makes an ecosystem sustainable is whether builders can create applications without constantly reinventing trust, automation, and coordination.
Newton Protocol appears to be moving toward a model where programmable coordination becomes part of the infrastructure instead of an afterthought. That may sound subtle, but it changes how developers think about building decentralized applications. Instead of treating automation as something layered on top, it becomes integrated into the protocol's foundation.
Mainnet Beta is also where architecture starts meeting reality. Test environments are useful, but public beta networks reveal how systems behave under genuine user activity, unexpected interactions, and continuous iteration. That's where assumptions get challenged and protocols either mature or expose the areas that still need refinement.
For me, the value isn't in short-term excitement. It's in watching whether a protocol creates better incentives for developers, stronger reliability for users, and an ecosystem that can evolve without sacrificing decentralization. Those are much harder problems than increasing transaction numbers, and they're ultimately the ones that determine long-term relevance.
I'll be watching how the Newton Mainnet Beta develops and how the community builds around it. Infrastructure succeeds when people stop talking about the infrastructure itself because it simply works—and that's the standard every serious protocol should aim_x$NEWT @NewtonProtocol #Newt
Paid Partnership with @newton_xyz I've spent a lot of time looking at blockchain infrastructure ove
I've spent a lot of time looking at blockchain infrastructure over the years, and one pattern keeps repeating: we build faster networks, but we rarely improve how people actually coordinate value across them. Through that lens, Newton Protocol caught my attention for a different reason.
The interesting part isn't simply that the Newton Mainnet Beta exists. It's the design philosophy behind it. Most infrastructure conversations focus on throughput or lower fees, but those metrics only matter if they reduce friction for real users and developers. What makes an ecosystem sustainable is whether builders can create applications without constantly reinventing trust, automation, and coordination.
Newton Protocol appears to be moving toward a model where programmable coordination becomes part of the infrastructure instead of an afterthought. That may sound subtle, but it changes how developers think about building decentralized applications. Instead of treating automation as something layered on top, it becomes integrated into the protocol's foundation.
Mainnet Beta is also where architecture starts meeting reality. Test environments are useful, but public beta networks reveal how systems behave under genuine user activity, unexpected interactions, and continuous iteration. That's where assumptions get challenged and protocols either mature or expose the areas that still need refinement.
For me, the value isn't in short-term excitement. It's in watching whether a protocol creates better incentives for developers, stronger reliability for users, and an ecosystem that can evolve without sacrificing decentralization. Those are much harder problems than increasing transaction numbers, and they're ultimately the ones that determine long-term relevance.
I'll be watching how the Newton Mainnet Beta develops and how the community builds around it. Infrastructure succeeds when people stop talking about the infrastructure itself because it simply works—and that's the standard every serious protocol should aim_x$NEWT @NewtonProtocol #Newt
The interesting part isn't simply that the Newton Mainnet Beta exists. It's the design philosophy behind it. Most infrastructure conversations focus on throughput or lower fees, but those metrics only matter if they reduce friction for real users and developers. What makes an ecosystem sustainable is whether builders can create applications without constantly reinventing trust, automation, and coordination.
Newton Protocol appears to be moving toward a model where programmable coordination becomes part of the infrastructure instead of an afterthought. That may sound subtle, but it changes how developers think about building decentralized applications. Instead of treating automation as something layered on top, it becomes integrated into the protocol's foundation.
Mainnet Beta is also where architecture starts meeting reality. Test environments are useful, but public beta networks reveal how systems behave under genuine user activity, unexpected interactions, and continuous iteration. That's where assumptions get challenged and protocols either mature or expose the areas that still need refinement.
For me, the value isn't in short-term excitement. It's in watching whether a protocol creates better incentives for developers, stronger reliability for users, and an ecosystem that can evolve without sacrificing decentralization. Those are much harder problems than increasing transaction numbers, and they're ultimately the ones that determine long-term relevance.
I'll be watching how the Newton Mainnet Beta develops and how the community builds around it. Infrastructure succeeds when people stop talking about the infrastructure itself because it simply works—and that's the standard every serious protocol should aim_x$NEWT @NewtonProtocol #Newt
72
Most people judge a blockchain by its token price. I prefer to judge it by how it behaves when real users start interacting with it.
That's why the Newton Mainnet Beta deserves attention. This is the phase where assumptions meet reality—performance, stability, developer experience, and community feedback all become measurable instead of theoretical. Networks that embrace this process usually build stronger foundations than those chasing short-term hype.
I'm watching @NewtonProtocol because sustainable ecosystems are created through continuous iteration, transparent improvements, and active builders—not marketing alone. If the team keeps refining the network based on real-world data, the long-term value proposition for the ecosystem becomes much more compelling.
Curious to see how the community helps shape the next chapter for $NEWT #Newt
{spot}(NEWTUSDT)
Most people judge a blockchain by its token price. I prefer to judge it by how it behaves when real users start interacting with it.
That's why the Newton Mainnet Beta deserves attention. This is the phase where assumptions meet reality—performance, stability, developer experience, and community feedback all become measurable instead of theoretical. Networks that embrace this process usually build stronger foundations than those chasing short-term hype.
I'm watching @NewtonProtocol because sustainable ecosystems are created through continuous iteration, transparent improvements, and active builders—not marketing alone. If the team keeps refining the network based on real-world data, the long-term value proposition for the ecosystem becomes much more compelling.
Curious to see how the community helps shape the next chapter for $NEWT #Newt
That's why the Newton Mainnet Beta deserves attention. This is the phase where assumptions meet reality—performance, stability, developer experience, and community feedback all become measurable instead of theoretical. Networks that embrace this process usually build stronger foundations than those chasing short-term hype.
I'm watching @NewtonProtocol because sustainable ecosystems are created through continuous iteration, transparent improvements, and active builders—not marketing alone. If the team keeps refining the network based on real-world data, the long-term value proposition for the ecosystem becomes much more compelling.
Curious to see how the community helps shape the next chapter for $NEWT #Newt

2
80
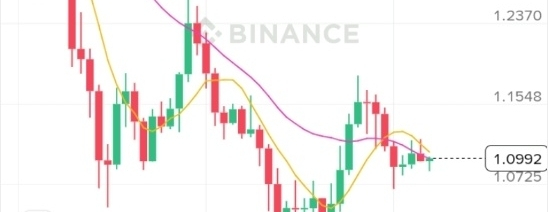
Article
V6The easiest trade to talk about is a breakout. The hardest one to understand is a market that refuses to choose a direction.
That's where I think XRP is today.
Looking at the daily chart, price has recovered from the recent low near $1.00, but every attempt to build momentum has faded before reaching the previous swing highs. Instead of trending, XRP is compressing. That isn't exciting, but it often reveals more about market psychology than a single explosive candle.
What stands out to me isn't the price itself—it's the relationship between the moving averages.
The short-term averages are beginning to flatten, while the 99-day moving average remains significantly higher. This tells me short-term sentiment is improving, but the longer-term trend hasn't fully shifted. Until those two start moving in the same direction, every rally has to prove itself.
This is the part I keep coming back to.
Many traders treat consolidation as "nothing happening." I see it differently. Consolidation is where the market decides whether recent buyers have enough conviction to absorb selling pressure without giving back the entire recovery.
Volume adds another layer to that story.
The strongest green candles during the rebound were accompanied by higher trading activity. More recently, volume has started to cool as price moves sideways. That doesn't automatically invalidate the recovery, but it does mean buyers haven't yet shown the level of commitment that usually supports a sustained trend.
That's why I'm watching volume just as closely as price.
One high-volume breakout above nearby resistance would tell me far more than several days of small green candles. Likewise, a loss of support on expanding volume would reveal that sellers are regaining control.
This feels more important than guessing the next price target.
Too many discussions around XRP focus on where price could go. I think the better question is whether the market is creating the conditions that make those targets realistic.
Right now, XRP isn't sending a strong bullish signal or a strong bearish one.
It's asking the market to make a decision.
Until participation increases and the structure becomes clearer, patience may be the most valuable position a trader can have.
So instead of asking, "When will XRP break out?" I'm asking a different question:
When the breakout finally comes, will the volume confirm it—or expose it as just another temporary move? @NewtonProtocol $NEWT #newt
V6
The easiest trade to talk about is a breakout. The hardest one to understand is a market that refuses to choose a direction.
That's where I think XRP is today.
Looking at the daily chart, price has recovered from the recent low near $1.00, but every attempt to build momentum has faded before reaching the previous swing highs. Instead of trending, XRP is compressing. That isn't exciting, but it often reveals more about market psychology than a single explosive candle.
What stands out to me isn't the price itself—it's the relationship between the moving averages.
The short-term averages are beginning to flatten, while the 99-day moving average remains significantly higher. This tells me short-term sentiment is improving, but the longer-term trend hasn't fully shifted. Until those two start moving in the same direction, every rally has to prove itself.
This is the part I keep coming back to.
Many traders treat consolidation as "nothing happening." I see it differently. Consolidation is where the market decides whether recent buyers have enough conviction to absorb selling pressure without giving back the entire recovery.
Volume adds another layer to that story.
The strongest green candles during the rebound were accompanied by higher trading activity. More recently, volume has started to cool as price moves sideways. That doesn't automatically invalidate the recovery, but it does mean buyers haven't yet shown the level of commitment that usually supports a sustained trend.
That's why I'm watching volume just as closely as price.
One high-volume breakout above nearby resistance would tell me far more than several days of small green candles. Likewise, a loss of support on expanding volume would reveal that sellers are regaining control.
This feels more important than guessing the next price target.
Too many discussions around XRP focus on where price could go. I think the better question is whether the market is creating the conditions that make those targets realistic.
Right now, XRP isn't sending a strong bullish signal or a strong bearish one.
It's asking the market to make a decision.
Until participation increases and the structure becomes clearer, patience may be the most valuable position a trader can have.
So instead of asking, "When will XRP break out?" I'm asking a different question:
When the breakout finally comes, will the volume confirm it—or expose it as just another temporary move? @NewtonProtocol $NEWT #newt
That's where I think XRP is today.
Looking at the daily chart, price has recovered from the recent low near $1.00, but every attempt to build momentum has faded before reaching the previous swing highs. Instead of trending, XRP is compressing. That isn't exciting, but it often reveals more about market psychology than a single explosive candle.
What stands out to me isn't the price itself—it's the relationship between the moving averages.
The short-term averages are beginning to flatten, while the 99-day moving average remains significantly higher. This tells me short-term sentiment is improving, but the longer-term trend hasn't fully shifted. Until those two start moving in the same direction, every rally has to prove itself.
This is the part I keep coming back to.
Many traders treat consolidation as "nothing happening." I see it differently. Consolidation is where the market decides whether recent buyers have enough conviction to absorb selling pressure without giving back the entire recovery.
Volume adds another layer to that story.
The strongest green candles during the rebound were accompanied by higher trading activity. More recently, volume has started to cool as price moves sideways. That doesn't automatically invalidate the recovery, but it does mean buyers haven't yet shown the level of commitment that usually supports a sustained trend.
That's why I'm watching volume just as closely as price.
One high-volume breakout above nearby resistance would tell me far more than several days of small green candles. Likewise, a loss of support on expanding volume would reveal that sellers are regaining control.
This feels more important than guessing the next price target.
Too many discussions around XRP focus on where price could go. I think the better question is whether the market is creating the conditions that make those targets realistic.
Right now, XRP isn't sending a strong bullish signal or a strong bearish one.
It's asking the market to make a decision.
Until participation increases and the structure becomes clearer, patience may be the most valuable position a trader can have.
So instead of asking, "When will XRP break out?" I'm asking a different question:
When the breakout finally comes, will the volume confirm it—or expose it as just another temporary move? @NewtonProtocol $NEWT #newt
2
103
Log in to explore more content
Join global crypto users on Binance Square
⚡️ Get latest and useful information about crypto.
💬 Trusted by the world’s largest crypto exchange.
👍 Discover real insights from verified creators.
Email / Phone number
Trending Topics
SaylorHintsStrategyBitcoinBuy
2.2M views
11,912 Discussing
#saylorhintsstrategybitcoinbuy
🚨 SAYLOR JUST DROPPED THE SUNDAY $BTC HINT 👀
Michael Saylor reposted his usual Bitcoin chart again.
If history repeats, those orange dots could be signaling another Strategy BTC purchase is coming. 🟠
And when Saylor buys, the market watches.
🐋 Massive BTC holdings
💰 Continued accumulation strategy
📈 Potential short-term sentiment boost
But here’s the key:
A repost is NOT confirmation of a purchase.
The real signal comes when Strategy officially reports the transaction.
🔥 If another major BTC buy is announced, will the market react this time?
Or is Saylor’s accumulation becoming so routine that traders barely react anymore?
👀 Watch the announcement.
$MSTRB
#BTC #strategy #crypto #BitcoinNews
sdatta
·4 Likes
·3.1k views
BOJRaisesRatesTo31YearHigh
208,376 views
2,972 Discussing
BuffettStepsDownAsBerkshireChairman
100,737 views
1,566 Discussing