
M Onsta YW
89 Posts

M Onsta YW
Report
Block User
10 Following
40 Followers
92 Liked
Posts
All
Quotes
·
--
Bearish
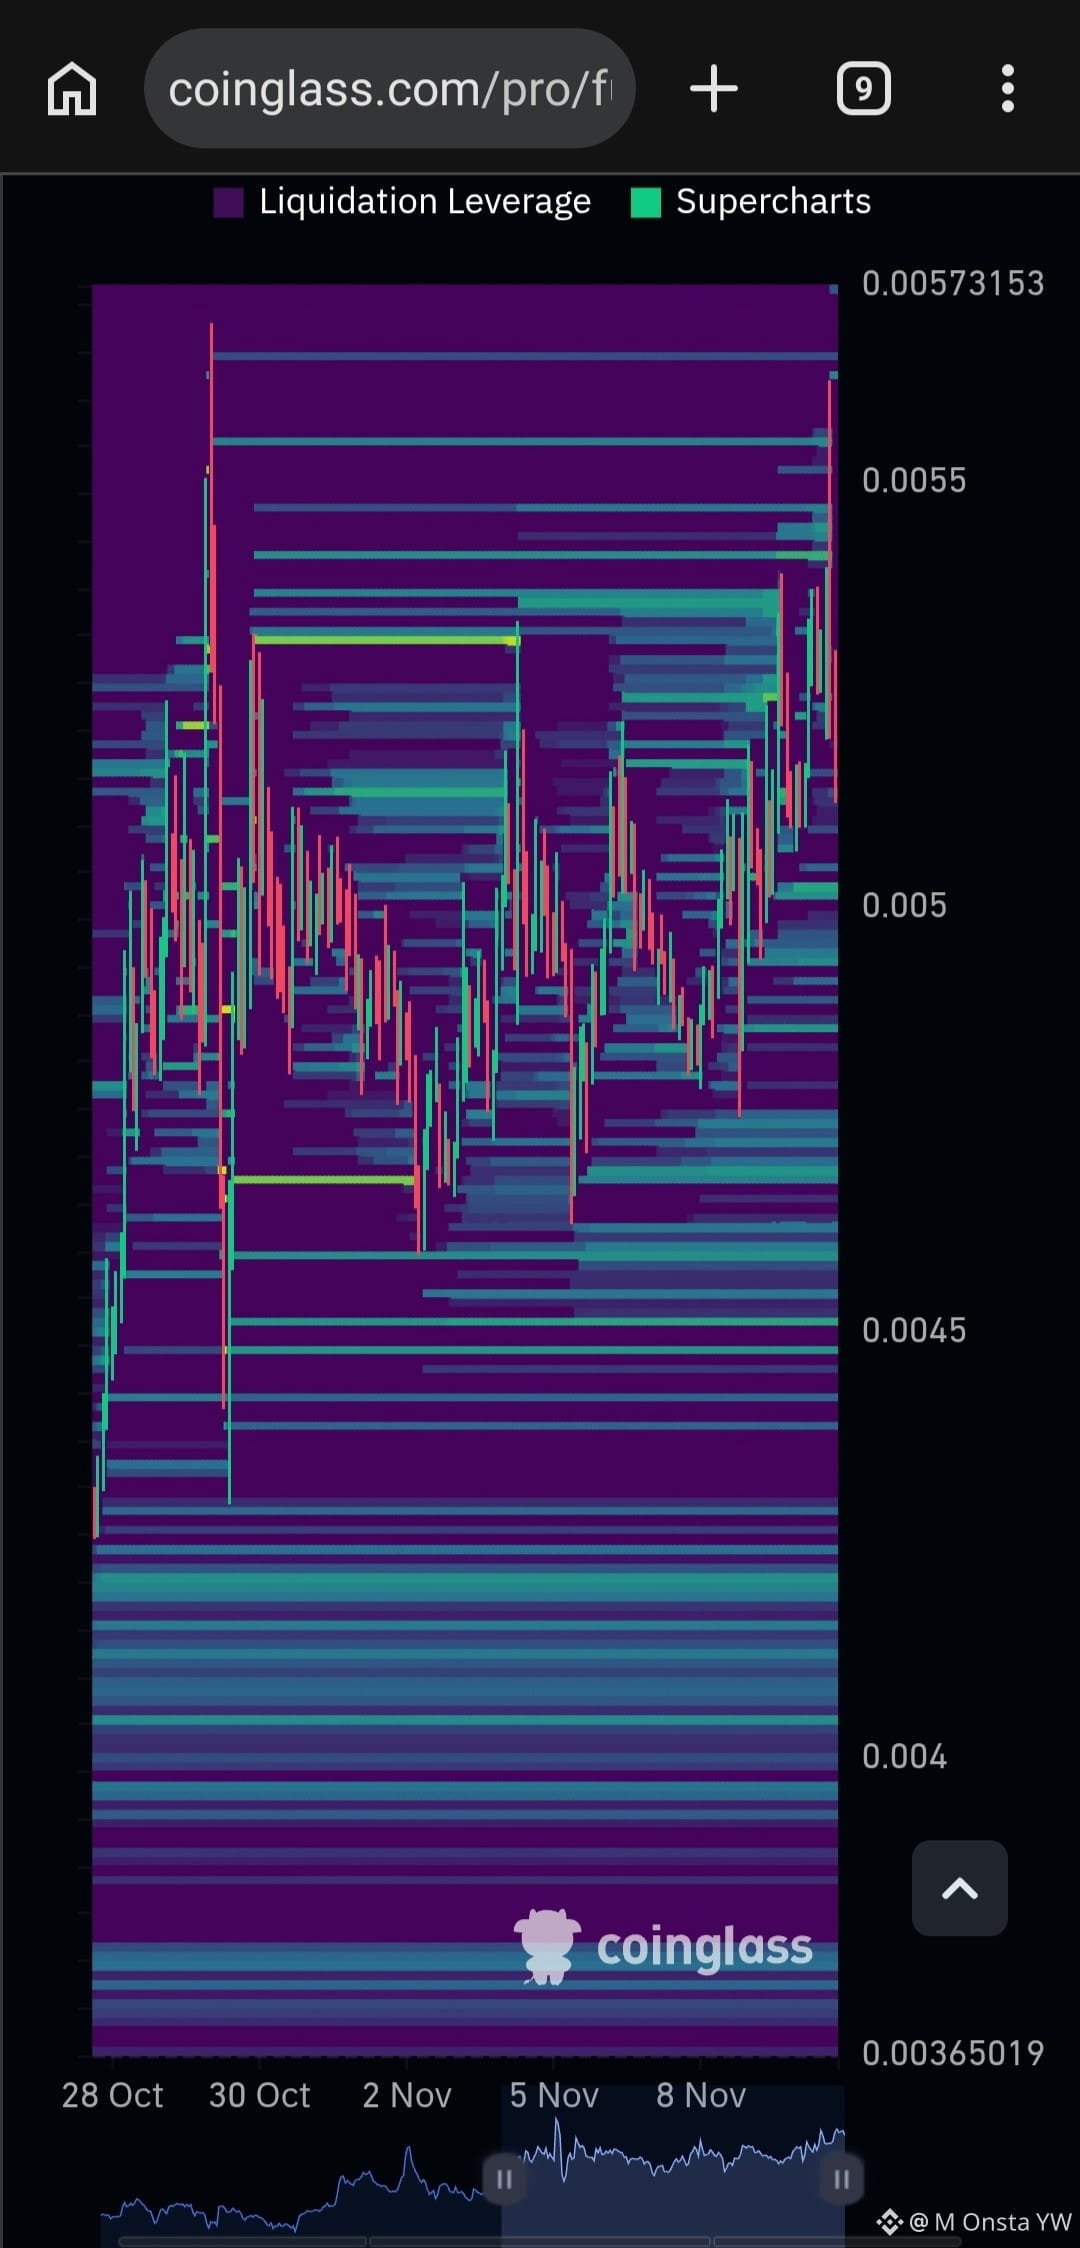
$1000PEPE ⚠️ If leveraged LONG positions become overcrowded, PEPE could face a sharp downside move.
A potential liquidation cascade could trigger:
Forced selling from overleveraged LONG traders.
A liquidity sweep below current price.
A massive shakeout before the next recovery.
🔥 My thesis:
PEPE may need to flush excessive leverage before building momentum for another bullish move.
Don't confuse a temporary pump with a confirmed trend reversal.
First, let the market clear the excess leverage. Then watch for buyers to step in.
The next PEPE move could be decided by liquidity, not hype.
#PEPE #Memecoins #LiquidationHeatmap
$1000PEPE ⚠️ If leveraged LONG positions become overcrowded, PEPE could face a sharp downside move.
A potential liquidation cascade could trigger:
Forced selling from overleveraged LONG traders.
A liquidity sweep below current price.
A massive shakeout before the next recovery.
🔥 My thesis:
PEPE may need to flush excessive leverage before building momentum for another bullish move.
Don't confuse a temporary pump with a confirmed trend reversal.
First, let the market clear the excess leverage. Then watch for buyers to step in.
The next PEPE move could be decided by liquidity, not hype.
#PEPE #Memecoins #LiquidationHeatmap
A potential liquidation cascade could trigger:
Forced selling from overleveraged LONG traders.
A liquidity sweep below current price.
A massive shakeout before the next recovery.
🔥 My thesis:
PEPE may need to flush excessive leverage before building momentum for another bullish move.
Don't confuse a temporary pump with a confirmed trend reversal.
First, let the market clear the excess leverage. Then watch for buyers to step in.
The next PEPE move could be decided by liquidity, not hype.
#PEPE #Memecoins #LiquidationHeatmap
1
84
·
--
Bearish
TOO MANY LONGS. NOT ENOUGH FUEL
BTC may need to sweep downside liquidity and liquidate overleveraged LONG positions before building enough momentum for another rally.
But remember, this is a possible market scenario, not a confirmed move.
I would rather wait for the liquidation sweep, buyer absorption, and a strong reversal signal than blindly chase a SHORT.
Sometimes Bitcoin needs to go down before it can go up.
$BTC $PEPE
TOO MANY LONGS. NOT ENOUGH FUEL
BTC may need to sweep downside liquidity and liquidate overleveraged LONG positions before building enough momentum for another rally.
But remember, this is a possible market scenario, not a confirmed move.
I would rather wait for the liquidation sweep, buyer absorption, and a strong reversal signal than blindly chase a SHORT.
Sometimes Bitcoin needs to go down before it can go up.
$BTC $PEPE
BTC may need to sweep downside liquidity and liquidate overleveraged LONG positions before building enough momentum for another rally.
But remember, this is a possible market scenario, not a confirmed move.
I would rather wait for the liquidation sweep, buyer absorption, and a strong reversal signal than blindly chase a SHORT.
Sometimes Bitcoin needs to go down before it can go up.
$BTC $PEPE
1
118
·
--
Bearish
$BTC BITCOIN IS FACING HEAVY SELLING PRESSURE. WHERE IS THE BOTTOM?
BTC is struggling to regain bullish momentum as sellers continue to dominate the market.
But here's the thing: Bitcoin doesn't just need a bounce. It needs FUEL to move higher again.
🔥 What could fuel the next rally?
Strong spot buying pressure.
Fresh institutional inflows.
Increasing buying volume.
Healthy Open Interest without excessive leverage.
Positive market sentiment.
📊 KEY BTC SUPPORT LEVELS TO WATCH:
🟢 $73,700 – Immediate support zone.
🟡 $71,800 – Next important support.
🔴 $70,000 – Major psychological support.
⚠️ $68,200 – Deeper downside support.
Resistance to reclaim:
$76,800
$78,000
My perspective:
As long as BTC remains below $76,800, selling pressure remains a concern.
A breakdown below $73,700 could expose lower support levels.
However, if buyers step in with strong volume, we could see a recovery.
Bitcoin needs fuel before it can fly again. 🚀
What do you think?
Are we accumulating before the next rally, or is another leg down coming?
$PEPE $ETH
$BTC BITCOIN IS FACING HEAVY SELLING PRESSURE. WHERE IS THE BOTTOM?
BTC is struggling to regain bullish momentum as sellers continue to dominate the market.
But here's the thing: Bitcoin doesn't just need a bounce. It needs FUEL to move higher again.
🔥 What could fuel the next rally?
Strong spot buying pressure.
Fresh institutional inflows.
Increasing buying volume.
Healthy Open Interest without excessive leverage.
Positive market sentiment.
📊 KEY BTC SUPPORT LEVELS TO WATCH:
🟢 $73,700 – Immediate support zone.
🟡 $71,800 – Next important support.
🔴 $70,000 – Major psychological support.
⚠️ $68,200 – Deeper downside support.
Resistance to reclaim:
$76,800
$78,000
My perspective:
As long as BTC remains below $76,800, selling pressure remains a concern.
A breakdown below $73,700 could expose lower support levels.
However, if buyers step in with strong volume, we could see a recovery.
Bitcoin needs fuel before it can fly again. 🚀
What do you think?
Are we accumulating before the next rally, or is another leg down coming?
$PEPE $ETH
BTC is struggling to regain bullish momentum as sellers continue to dominate the market.
But here's the thing: Bitcoin doesn't just need a bounce. It needs FUEL to move higher again.
🔥 What could fuel the next rally?
Strong spot buying pressure.
Fresh institutional inflows.
Increasing buying volume.
Healthy Open Interest without excessive leverage.
Positive market sentiment.
📊 KEY BTC SUPPORT LEVELS TO WATCH:
🟢 $73,700 – Immediate support zone.
🟡 $71,800 – Next important support.
🔴 $70,000 – Major psychological support.
⚠️ $68,200 – Deeper downside support.
Resistance to reclaim:
$76,800
$78,000
My perspective:
As long as BTC remains below $76,800, selling pressure remains a concern.
A breakdown below $73,700 could expose lower support levels.
However, if buyers step in with strong volume, we could see a recovery.
Bitcoin needs fuel before it can fly again. 🚀
What do you think?
Are we accumulating before the next rally, or is another leg down coming?
$PEPE $ETH
1
81
·
--
$PEPE Yesterday, PEPE was everywhere. Today, the excitement seems to be cooling down.
But let's look beyond the price action and examine what the on-chain data is telling us.
🐋 Whale Activity:
$27.6M PEPE withdrawn from exchanges over the last 7 days.
$10.2M deposited into exchanges.
Net exchange outflow: +$17.4M.
39 tracked whale wallets were involved.
📊 What does this mean?
The hype may be fading, but tracked whale activity doesn't yet show widespread distribution.
Exchange outflows could indicate accumulation or cold storage movements, not necessarily fresh buying.
The next important signal is whether whale withdrawals continue while retail interest and trading volume decline.
PEPE might be entering a post-hype consolidation phase.
Are whales accumulating before the next move, or are retail traders simply losing interest?
Watch the on-chain data, not just the candles.
DYOR $BTC
$PEPE Yesterday, PEPE was everywhere. Today, the excitement seems to be cooling down.
But let's look beyond the price action and examine what the on-chain data is telling us.
🐋 Whale Activity:
$27.6M PEPE withdrawn from exchanges over the last 7 days.
$10.2M deposited into exchanges.
Net exchange outflow: +$17.4M.
39 tracked whale wallets were involved.
📊 What does this mean?
The hype may be fading, but tracked whale activity doesn't yet show widespread distribution.
Exchange outflows could indicate accumulation or cold storage movements, not necessarily fresh buying.
The next important signal is whether whale withdrawals continue while retail interest and trading volume decline.
PEPE might be entering a post-hype consolidation phase.
Are whales accumulating before the next move, or are retail traders simply losing interest?
Watch the on-chain data, not just the candles.
DYOR $BTC
But let's look beyond the price action and examine what the on-chain data is telling us.
🐋 Whale Activity:
$27.6M PEPE withdrawn from exchanges over the last 7 days.
$10.2M deposited into exchanges.
Net exchange outflow: +$17.4M.
39 tracked whale wallets were involved.
📊 What does this mean?
The hype may be fading, but tracked whale activity doesn't yet show widespread distribution.
Exchange outflows could indicate accumulation or cold storage movements, not necessarily fresh buying.
The next important signal is whether whale withdrawals continue while retail interest and trading volume decline.
PEPE might be entering a post-hype consolidation phase.
Are whales accumulating before the next move, or are retail traders simply losing interest?
Watch the on-chain data, not just the candles.
DYOR $BTC
3
229
·
--
Bitcoin Under Pressure: What’s Behind the Latest Drop?
Bitcoin is facing renewed selling pressure, and several factors are contributing to the decline:
📉 Higher-than-expected US inflation is raising concerns about the Fed’s interest rate outlook.
🏦 Spot Bitcoin ETFs are seeing significant outflows, signaling weaker institutional demand.
⚠️ Massive futures liquidations are accelerating downside momentum, with leveraged LONG positions taking a heavy hit.
The short term market bias remains bearish, but traders should be cautious of a potential short squeeze.
Don't chase the move. Watch liquidity, Open Interest, Funding Rates, and volume before entering a position.
Stay disciplined. Protect your capital.
$BTC $PEPE
Bitcoin Under Pressure: What’s Behind the Latest Drop?
Bitcoin is facing renewed selling pressure, and several factors are contributing to the decline:
📉 Higher-than-expected US inflation is raising concerns about the Fed’s interest rate outlook.
🏦 Spot Bitcoin ETFs are seeing significant outflows, signaling weaker institutional demand.
⚠️ Massive futures liquidations are accelerating downside momentum, with leveraged LONG positions taking a heavy hit.
The short term market bias remains bearish, but traders should be cautious of a potential short squeeze.
Don't chase the move. Watch liquidity, Open Interest, Funding Rates, and volume before entering a position.
Stay disciplined. Protect your capital.
$BTC $PEPE
Bitcoin is facing renewed selling pressure, and several factors are contributing to the decline:
📉 Higher-than-expected US inflation is raising concerns about the Fed’s interest rate outlook.
🏦 Spot Bitcoin ETFs are seeing significant outflows, signaling weaker institutional demand.
⚠️ Massive futures liquidations are accelerating downside momentum, with leveraged LONG positions taking a heavy hit.
The short term market bias remains bearish, but traders should be cautious of a potential short squeeze.
Don't chase the move. Watch liquidity, Open Interest, Funding Rates, and volume before entering a position.
Stay disciplined. Protect your capital.
$BTC $PEPE
1
134
·
--
$CYBER PENIPUAN, ini hanya untuk menghabiskan $ SHORT KERAS?
$CYBER PENIPUAN, ini hanya untuk menghabiskan $ SHORT KERAS?
1
1
232
·
--
$JCT MENURUT SAYA AKAN BERHARI-HARI, BAGAIMANA MENURUTMU?
$JCT MENURUT SAYA AKAN BERHARI-HARI, BAGAIMANA MENURUTMU?
JCT $0.25
JCT $0.35
JCT $0.5
JCT $1
4 day(s) left
5
1
7.5k
·
--
$ZEC Analysis
Daily Timeframe (1D)
Bullish Consolidation
RSI(6): 46.42
MA7: $1,320.74
MA25: $1,307.44
MA99: $1,239.10
The price is slightly below MA7 but above MA25. This indicates that daily momentum is not yet fully bullish, despite the ongoing recovery.
Scenario 1 — Bullish
Estimated technical probability: 45%
If ZEC reclaims $1,320–$1,333 and breaks above $1,351 with strong volume:
Targets: $1,398 → $1,450
If the breakout above $1,398 is confirmed, the next potential targets are $1,500–$1,577.
Scenario 2 — Bearish
Estimated technical probability: 15%
If the 4H candle closes below $1,270, selling pressure could increase significantly.
Targets: $1,244 → $1,200 → $1,158
$ZEC Analysis
Daily Timeframe (1D)
Bullish Consolidation
RSI(6): 46.42
MA7: $1,320.74
MA25: $1,307.44
MA99: $1,239.10
The price is slightly below MA7 but above MA25. This indicates that daily momentum is not yet fully bullish, despite the ongoing recovery.
Scenario 1 — Bullish
Estimated technical probability: 45%
If ZEC reclaims $1,320–$1,333 and breaks above $1,351 with strong volume:
Targets: $1,398 → $1,450
If the breakout above $1,398 is confirmed, the next potential targets are $1,500–$1,577.
Scenario 2 — Bearish
Estimated technical probability: 15%
If the 4H candle closes below $1,270, selling pressure could increase significantly.
Targets: $1,244 → $1,200 → $1,158
Daily Timeframe (1D)
Bullish Consolidation
RSI(6): 46.42
MA7: $1,320.74
MA25: $1,307.44
MA99: $1,239.10
The price is slightly below MA7 but above MA25. This indicates that daily momentum is not yet fully bullish, despite the ongoing recovery.
Scenario 1 — Bullish
Estimated technical probability: 45%
If ZEC reclaims $1,320–$1,333 and breaks above $1,351 with strong volume:
Targets: $1,398 → $1,450
If the breakout above $1,398 is confirmed, the next potential targets are $1,500–$1,577.
Scenario 2 — Bearish
Estimated technical probability: 15%
If the 4H candle closes below $1,270, selling pressure could increase significantly.
Targets: $1,244 → $1,200 → $1,158
1
238
·
--
Bearish
$VVV I Told You So
I already warned about this in my previous post
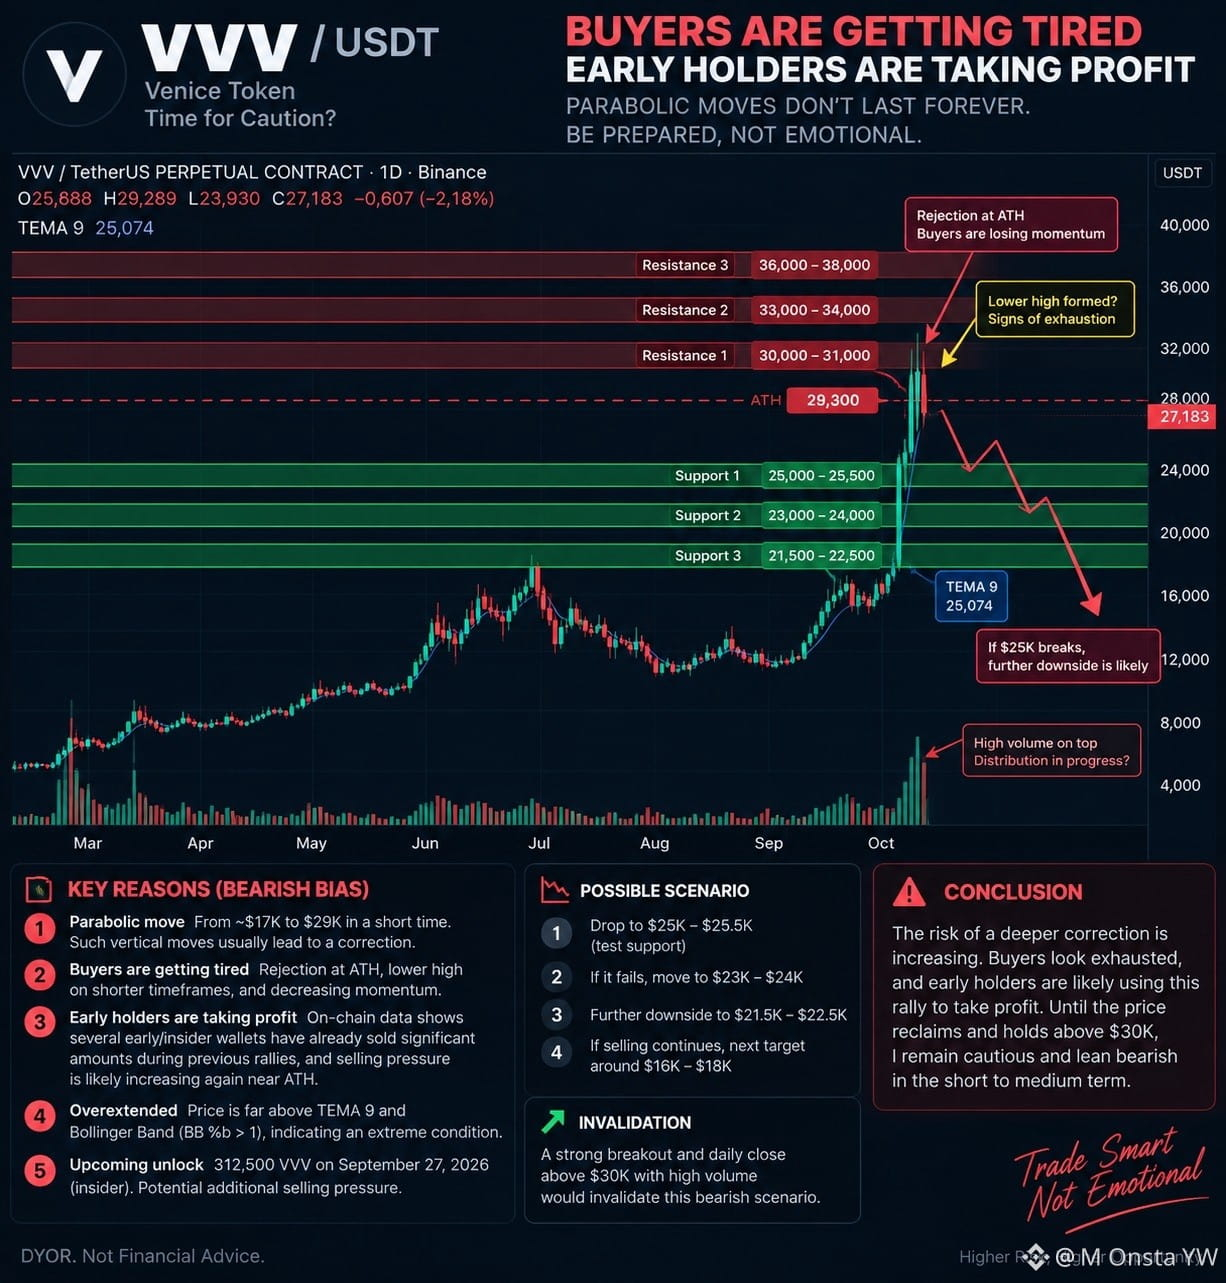
VVV went parabolic from $17K to nearly $29K, and I said the risk was no longer simply "how high can it go?"
#
The real question was:
Who is buying here and who is taking profit into that demand?
And now we're seeing the first serious reaction.
📉 $29K rejected
📉 Buyers are losing momentum
📉 Strong selling volume appearing
📉 Price has fallen back below the TEMA 9 on the 15m
📉 Early holders have already been taking profit
📉 Price was extremely overextended after the parabolic move
Current price: ~$27K
The important level now is:
$25K–$25.5K
If this support fails, I would expect:
$25K → $23–24K → $21.5–22.5K
And if selling pressure continues to accelerate, we could eventually see a deeper retracement toward the $18–20K area.
This is exactly why I was warning about late buyers becoming exit liquidity
The market doesn't need to crash immediately
It can simply do:
FOMO → rejection → lower highs → support breaks → panic selling.
For now, $29K has clearly rejected
Let's see whether buyers can defend $25K
If they can't…
The chart could get very ugly 👀
And remember:
A parabolic pump doesn't mean the trend can go up forever
DYOR. Not financial advice
$VVV I Told You So
I already warned about this in my previous post
VVV went parabolic from $17K to nearly $29K, and I said the risk was no longer simply "how high can it go?"
#
The real question was:
Who is buying here and who is taking profit into that demand?
And now we're seeing the first serious reaction.
📉 $29K rejected
📉 Buyers are losing momentum
📉 Strong selling volume appearing
📉 Price has fallen back below the TEMA 9 on the 15m
📉 Early holders have already been taking profit
📉 Price was extremely overextended after the parabolic move
Current price: ~$27K
The important level now is:
$25K–$25.5K
If this support fails, I would expect:
$25K → $23–24K → $21.5–22.5K
And if selling pressure continues to accelerate, we could eventually see a deeper retracement toward the $18–20K area.
This is exactly why I was warning about late buyers becoming exit liquidity
The market doesn't need to crash immediately
It can simply do:
FOMO → rejection → lower highs → support breaks → panic selling.
For now, $29K has clearly rejected
Let's see whether buyers can defend $25K
If they can't…
The chart could get very ugly 👀
And remember:
A parabolic pump doesn't mean the trend can go up forever
DYOR. Not financial advice
I already warned about this in my previous post
VVV went parabolic from $17K to nearly $29K, and I said the risk was no longer simply "how high can it go?"
#
The real question was:
Who is buying here and who is taking profit into that demand?
And now we're seeing the first serious reaction.
📉 $29K rejected
📉 Buyers are losing momentum
📉 Strong selling volume appearing
📉 Price has fallen back below the TEMA 9 on the 15m
📉 Early holders have already been taking profit
📉 Price was extremely overextended after the parabolic move
Current price: ~$27K
The important level now is:
$25K–$25.5K
If this support fails, I would expect:
$25K → $23–24K → $21.5–22.5K
And if selling pressure continues to accelerate, we could eventually see a deeper retracement toward the $18–20K area.
This is exactly why I was warning about late buyers becoming exit liquidity
The market doesn't need to crash immediately
It can simply do:
FOMO → rejection → lower highs → support breaks → panic selling.
For now, $29K has clearly rejected
Let's see whether buyers can defend $25K
If they can't…
The chart could get very ugly 👀
And remember:
A parabolic pump doesn't mean the trend can go up forever
DYOR. Not financial advice
241
·
--
Bearish
$VVV holders: be careful
Everyone is looking at $30K
I'm looking at who is selling into that excitement
$17K → $29.3K in a parabolic move
ATH rejection
Buyers losing momentum
Early holders taking profit
Extreme extension above TEMA 9
Massive volume near the top
312.5K VVV insider unlock coming Sep 27
The question isn't whether VVV can reach $30K
The question is whether late buyers are becoming exit liquidity for early holders
Lose $25K, and the chart starts looking very different
$23–24K next
$21.5–22.5K after that
And if those fail, $18–20K becomes a realistic downside zone
Above $30K with a strong daily close = bearish thesis invalidated
Until then, I'm watching the downside. 👀
Don't confuse a strong pump with an endless pump.
$VVV holders: be careful
Everyone is looking at $30K
I'm looking at who is selling into that excitement
$17K → $29.3K in a parabolic move
ATH rejection
Buyers losing momentum
Early holders taking profit
Extreme extension above TEMA 9
Massive volume near the top
312.5K VVV insider unlock coming Sep 27
The question isn't whether VVV can reach $30K
The question is whether late buyers are becoming exit liquidity for early holders
Lose $25K, and the chart starts looking very different
$23–24K next
$21.5–22.5K after that
And if those fail, $18–20K becomes a realistic downside zone
Above $30K with a strong daily close = bearish thesis invalidated
Until then, I'm watching the downside. 👀
Don't confuse a strong pump with an endless pump.
Everyone is looking at $30K
I'm looking at who is selling into that excitement
$17K → $29.3K in a parabolic move
ATH rejection
Buyers losing momentum
Early holders taking profit
Extreme extension above TEMA 9
Massive volume near the top
312.5K VVV insider unlock coming Sep 27
The question isn't whether VVV can reach $30K
The question is whether late buyers are becoming exit liquidity for early holders
Lose $25K, and the chart starts looking very different
$23–24K next
$21.5–22.5K after that
And if those fail, $18–20K becomes a realistic downside zone
Above $30K with a strong daily close = bearish thesis invalidated
Until then, I'm watching the downside. 👀
Don't confuse a strong pump with an endless pump.
1
169
·
--
Bullish
$BTC $ETH Uang pintar keluar saatnya masuk ke $DEXE Apakah akan mencetak ATH baru ? 🚀
DYOR
$BTC $ETH Uang pintar keluar saatnya masuk ke $DEXE Apakah akan mencetak ATH baru ? 🚀
DYOR
DYOR
2
342

·
--
Bearish
$1000LUNC LUNA TIDAK MEMILIKI KEPERCAYAAN INVESTOR, INGAT KEJADIAN LUNA DI MASA LALU HARGA TERJUN HAMPIR KE 0
$1000LUNC LUNA TIDAK MEMILIKI KEPERCAYAAN INVESTOR, INGAT KEJADIAN LUNA DI MASA LALU HARGA TERJUN HAMPIR KE 0
2
2
2
2.1k
Log in to explore more content
Join global crypto users on Binance Square
⚡️ Get latest and useful information about crypto.
💬 Trusted by the world’s largest crypto exchange.
👍 Discover real insights from verified creators.
Email / Phone number