
pvrvnxiv-nba
6 Posts

pvrvnxiv-nba
20 Following
0 Followers
0 Liked
Posts
🟣 Right now, the situation is tilting slightly more in favor of an upward move, since the cluster of short positions is much closer to the price. Therefore, I would first expect an attempt to absorb liquidity in the 83–86k range, and only then watch for a reaction
But here’s where the altcoins will come into play: if there’s a correction from $86–87k back to $80, BTC will enter a new sideways range and will likely cede some of its dominance to previously oversold altcoins
#onchain
But here’s where the altcoins will come into play: if there’s a correction from $86–87k back to $80, BTC will enter a new sideways range and will likely cede some of its dominance to previously oversold altcoins
#onchain
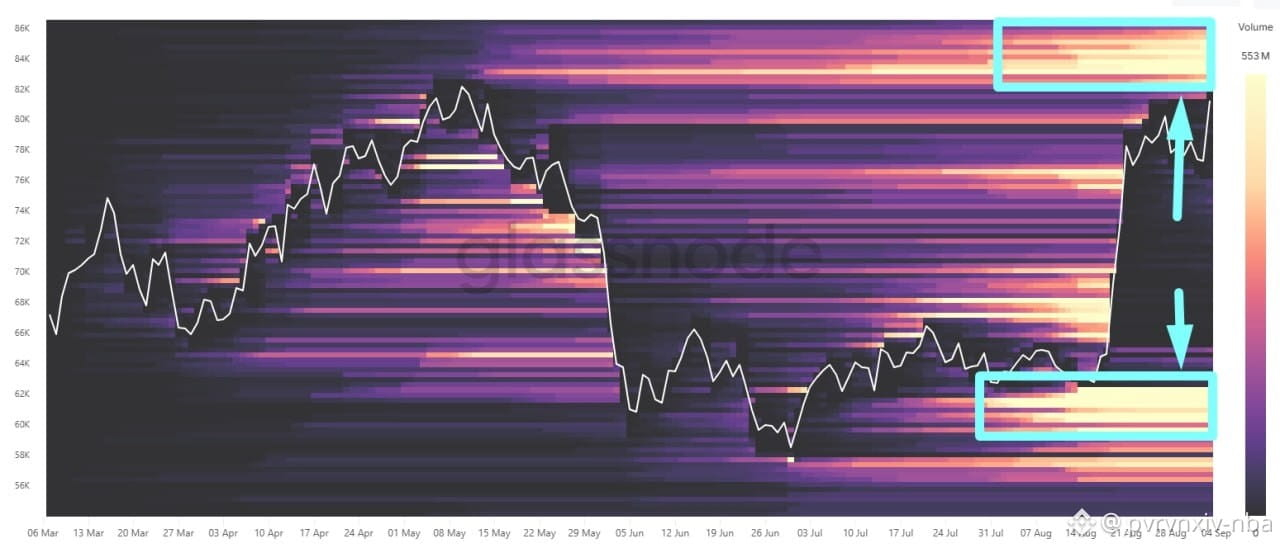
📌 BTC is trapped between two walls of liquidations
• The screenshot shows a heat map of potential futures liquidations across all exchanges. The brighter the area, the more leveraged positions will be forced to close when the corresponding price is reached. Short sellers are at the top; long positions are at the bottom
⠀
1) The pump on August 19 wiped out a significant portion of the shorts on the way up, but the price never reached the largest cluster of liquidations in the $83,000–$86,000 range. Moreover, on August 27, after breaking above $80,000, BTC encountered selling pressure and pulled back to $76,000, closing out some of the late longs that had entered the market after the initial rally
⠀
2) Right now, BTC is approaching the upper zone again, and the bulk of short sellers are still active there. If the price finds support at the lower boundary around $83,000, a cascade of forced buying could quickly push it up to $85,000–$86,000. This aligns perfectly with my expectation of another upward surge following the consolidation mentioned in my previous review, but the liquidation of short positions alone does not guarantee a sustained rally—after liquidity is absorbed, the momentum may run out, and the market will once again need regular spot buyers.
3) And here’s another important point. Below, there’s still a resistance level in the $60,000–$63,000 range, where a large volume of what are now long liquidations has accumulated. It withstood both the pump on August 19 and the subsequent pullback, so it remains intact for now. If the market completely gives back its recent gains and begins to retreat toward the summer lows, the closing of these positions will not only accelerate the sell-off but will, with a high degree of probability, push the market below the most recent low at 58,000. Even if this is currently a stress scenario rather than the main one.
⠀
#onchain
• The screenshot shows a heat map of potential futures liquidations across all exchanges. The brighter the area, the more leveraged positions will be forced to close when the corresponding price is reached. Short sellers are at the top; long positions are at the bottom
⠀
1) The pump on August 19 wiped out a significant portion of the shorts on the way up, but the price never reached the largest cluster of liquidations in the $83,000–$86,000 range. Moreover, on August 27, after breaking above $80,000, BTC encountered selling pressure and pulled back to $76,000, closing out some of the late longs that had entered the market after the initial rally
⠀
2) Right now, BTC is approaching the upper zone again, and the bulk of short sellers are still active there. If the price finds support at the lower boundary around $83,000, a cascade of forced buying could quickly push it up to $85,000–$86,000. This aligns perfectly with my expectation of another upward surge following the consolidation mentioned in my previous review, but the liquidation of short positions alone does not guarantee a sustained rally—after liquidity is absorbed, the momentum may run out, and the market will once again need regular spot buyers.
3) And here’s another important point. Below, there’s still a resistance level in the $60,000–$63,000 range, where a large volume of what are now long liquidations has accumulated. It withstood both the pump on August 19 and the subsequent pullback, so it remains intact for now. If the market completely gives back its recent gains and begins to retreat toward the summer lows, the closing of these positions will not only accelerate the sell-off but will, with a high degree of probability, push the market below the most recent low at 58,000. Even if this is currently a stress scenario rather than the main one.
⠀
#onchain
🟢 Meanwhile, short-term holders have formed a new base for BTC
• The CBD-STH chart shows the distribution of short-term traders’ coins by average holding period. The brighter the zone, the more BTC was accumulated in that price range
1) At the end of 2025, the largest cluster was in the $84,000–$90,000 range, but the price failed to hold it. After the downward breakout, a significant portion of short-term holders found themselves in the red, and BTC quickly plummeted to the next major trading zone. Upon a rebound, this zone could become the strongest resistance, as some of the holders trapped at the top will try to dump their coins at break-even and forget about this market as if it were a bad dream. However, we’re dealing with a historic STH-CBD, and over time, some of the coins may have already moved into the LTH category (having held their BTC for more than 155 days) or been sold; therefore, I’ll verify the actual supply overhang separately using the overall BTC distribution map.
2) A new STH basis has now formed in the $62,000–$67,000 range, which roughly coincides with the accumulation zone during the prolonged downtrend in 2024. What’s most interesting is that both when the price fell to this zone in February 2026 and during the subsequent retest in June, short-term traders were in no hurry to accumulate BTC due to severe market panic. The heatmap shows that the main accumulation began only in late July–early August, which is where the hottest area appeared
—
🟣 Therefore, I think BTC will now trade within the upper range for some time, gradually pushing the average TVH of short-term traders higher. At the same time, a return to the lower cluster cannot be ruled out—the 62–67k area is becoming the main support for the latest rebound
As long as the price stays above it, the structure looks rather bullish, but only locally. Losing this zone would mean that the new base didn’t hold, and short-term traders will once again start exiting en masse at a loss
#onchain
• The CBD-STH chart shows the distribution of short-term traders’ coins by average holding period. The brighter the zone, the more BTC was accumulated in that price range
1) At the end of 2025, the largest cluster was in the $84,000–$90,000 range, but the price failed to hold it. After the downward breakout, a significant portion of short-term holders found themselves in the red, and BTC quickly plummeted to the next major trading zone. Upon a rebound, this zone could become the strongest resistance, as some of the holders trapped at the top will try to dump their coins at break-even and forget about this market as if it were a bad dream. However, we’re dealing with a historic STH-CBD, and over time, some of the coins may have already moved into the LTH category (having held their BTC for more than 155 days) or been sold; therefore, I’ll verify the actual supply overhang separately using the overall BTC distribution map.
2) A new STH basis has now formed in the $62,000–$67,000 range, which roughly coincides with the accumulation zone during the prolonged downtrend in 2024. What’s most interesting is that both when the price fell to this zone in February 2026 and during the subsequent retest in June, short-term traders were in no hurry to accumulate BTC due to severe market panic. The heatmap shows that the main accumulation began only in late July–early August, which is where the hottest area appeared
—
🟣 Therefore, I think BTC will now trade within the upper range for some time, gradually pushing the average TVH of short-term traders higher. At the same time, a return to the lower cluster cannot be ruled out—the 62–67k area is becoming the main support for the latest rebound
As long as the price stays above it, the structure looks rather bullish, but only locally. Losing this zone would mean that the new base didn’t hold, and short-term traders will once again start exiting en masse at a loss
#onchain
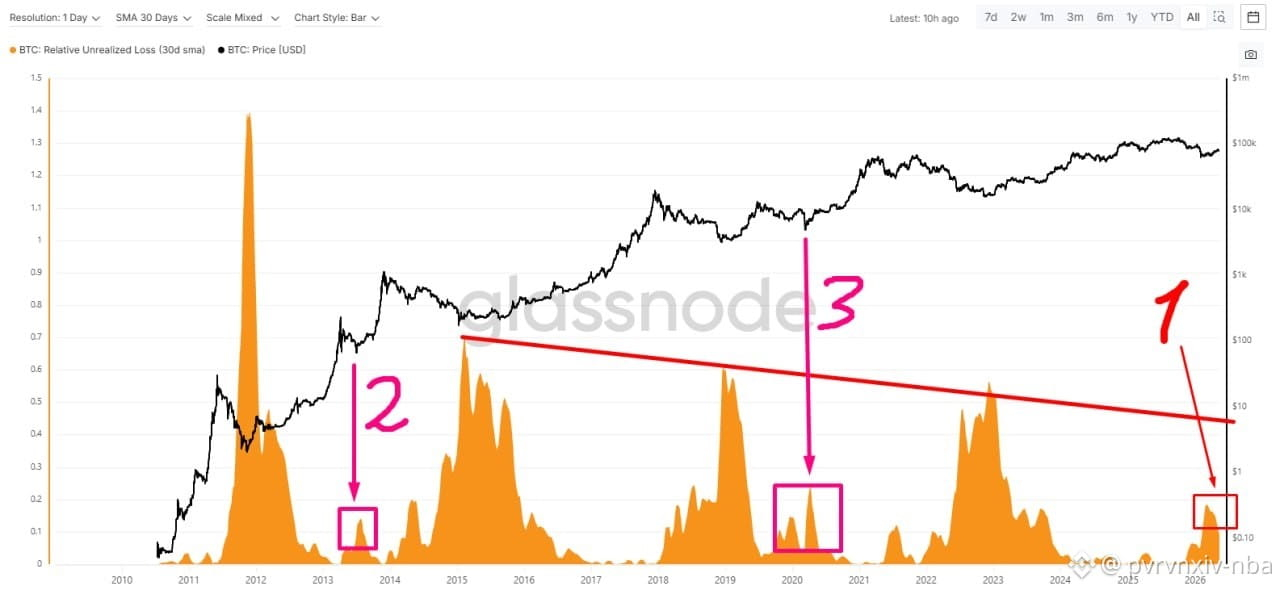
🟠 The chart below shows the ratio of unrealized losses (NUPL) for ALL BTC holders (expressed in USDT) to total market capitalization, in %. At the peak of the decline on February 6, the NUPL ratio jumped to 25%. However, given that we are looking at the entire history (since 2010), it makes sense to smooth these figures to at least a 30-day average, which is what I did. Therefore, the peak NUPL ratio in late February–early March reached ~18% on average (point #1)
Visually, each new cycle is characterized by a decrease in the share of unrealized losses, so it would not be surprising if the current bear market bottom is reached with less pain than in 2022. But even so, if we remove the very first cycle from the equation (due to its extreme volatility) and perform a linear regression, we can see that the hypothetical bottom in the current cycle could be reached around a 40% share of unrealized losses on a monthly average
Could this be a “local” major loss before the next ATH is reached? It could be, as was the case at point #1 (the Mt. Gox debacle) and point #2 (the pandemic). However, visually it doesn’t look the same, because there are no obvious force majeure events targeting both all markets and crypto specifically (like the Chinese ban in May 2021), and the timing is already stretching out too long (force majeure events are usually clear-cut and happen quickly)
—
• Therefore, overall, I’m still leaning more toward a decline. Even if the price of BTC rises even higher now, the key resistance level will remain around $89,000–$90,000, as the point where the structural weakness of the leading crypto asset begins to shift.
#onchain #BTC #ATH $BTC
Visually, each new cycle is characterized by a decrease in the share of unrealized losses, so it would not be surprising if the current bear market bottom is reached with less pain than in 2022. But even so, if we remove the very first cycle from the equation (due to its extreme volatility) and perform a linear regression, we can see that the hypothetical bottom in the current cycle could be reached around a 40% share of unrealized losses on a monthly average
Could this be a “local” major loss before the next ATH is reached? It could be, as was the case at point #1 (the Mt. Gox debacle) and point #2 (the pandemic). However, visually it doesn’t look the same, because there are no obvious force majeure events targeting both all markets and crypto specifically (like the Chinese ban in May 2021), and the timing is already stretching out too long (force majeure events are usually clear-cut and happen quickly)
—
• Therefore, overall, I’m still leaning more toward a decline. Even if the price of BTC rises even higher now, the key resistance level will remain around $89,000–$90,000, as the point where the structural weakness of the leading crypto asset begins to shift.
#onchain #BTC #ATH $BTC
Log in to explore more content