
Muneeb-Shahzad
12 Posts

Muneeb-Shahzad
Report
Block User
Open Trade
Frequent Trader
2.2 Years
4 Following
11 Followers
14 Liked
Posts
Portfolio
$TFUEL
{spot}(TFUELUSDT)
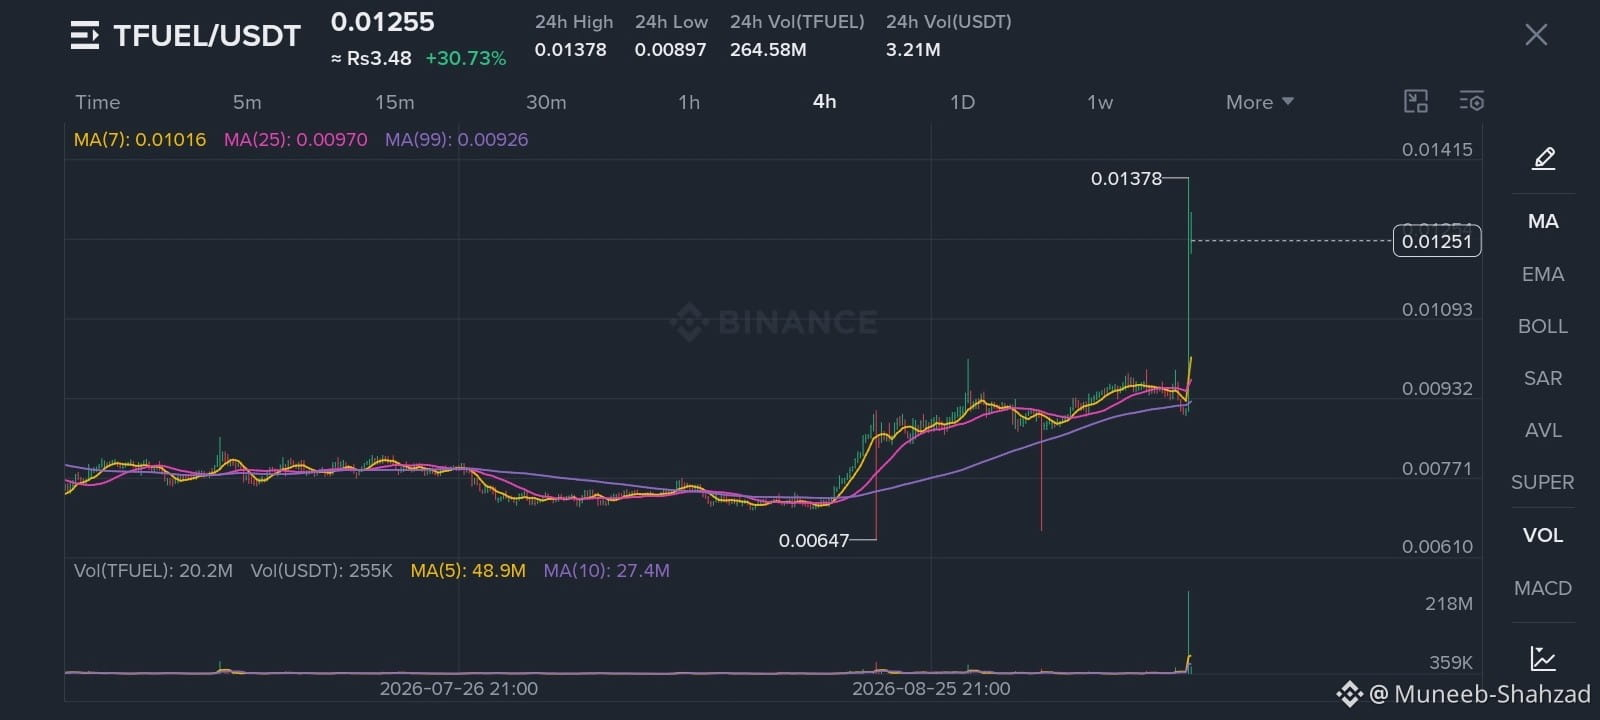
TFUEL is trading at $0.01266 as of 2026-09-11, up +31.88% over the past 24 hours. Its session range was $0.00897–$0.01378, which signals unusually high volatility and strong short-term momentum; the wide range also means pullback risk is elevated after the sharp move.
Above is the live TFUEL/USDT candlestick chart—use it to inspect the recent candle structure, volume, and intraday swings.
This is market analysis only and not investment advice.
$TFUEL
TFUEL is trading at $0.01266 as of 2026-09-11, up +31.88% over the past 24 hours. Its session range was $0.00897–$0.01378, which signals unusually high volatility and strong short-term momentum; the wide range also means pullback risk is elevated after the sharp move.
Above is the live TFUEL/USDT candlestick chart—use it to inspect the recent candle structure, volume, and intraday swings.
This is market analysis only and not investment advice.
TFUEL is trading at $0.01266 as of 2026-09-11, up +31.88% over the past 24 hours. Its session range was $0.00897–$0.01378, which signals unusually high volatility and strong short-term momentum; the wide range also means pullback risk is elevated after the sharp move.
Above is the live TFUEL/USDT candlestick chart—use it to inspect the recent candle structure, volume, and intraday swings.
This is market analysis only and not investment advice.
69
$FF
{spot}(FFUSDT)
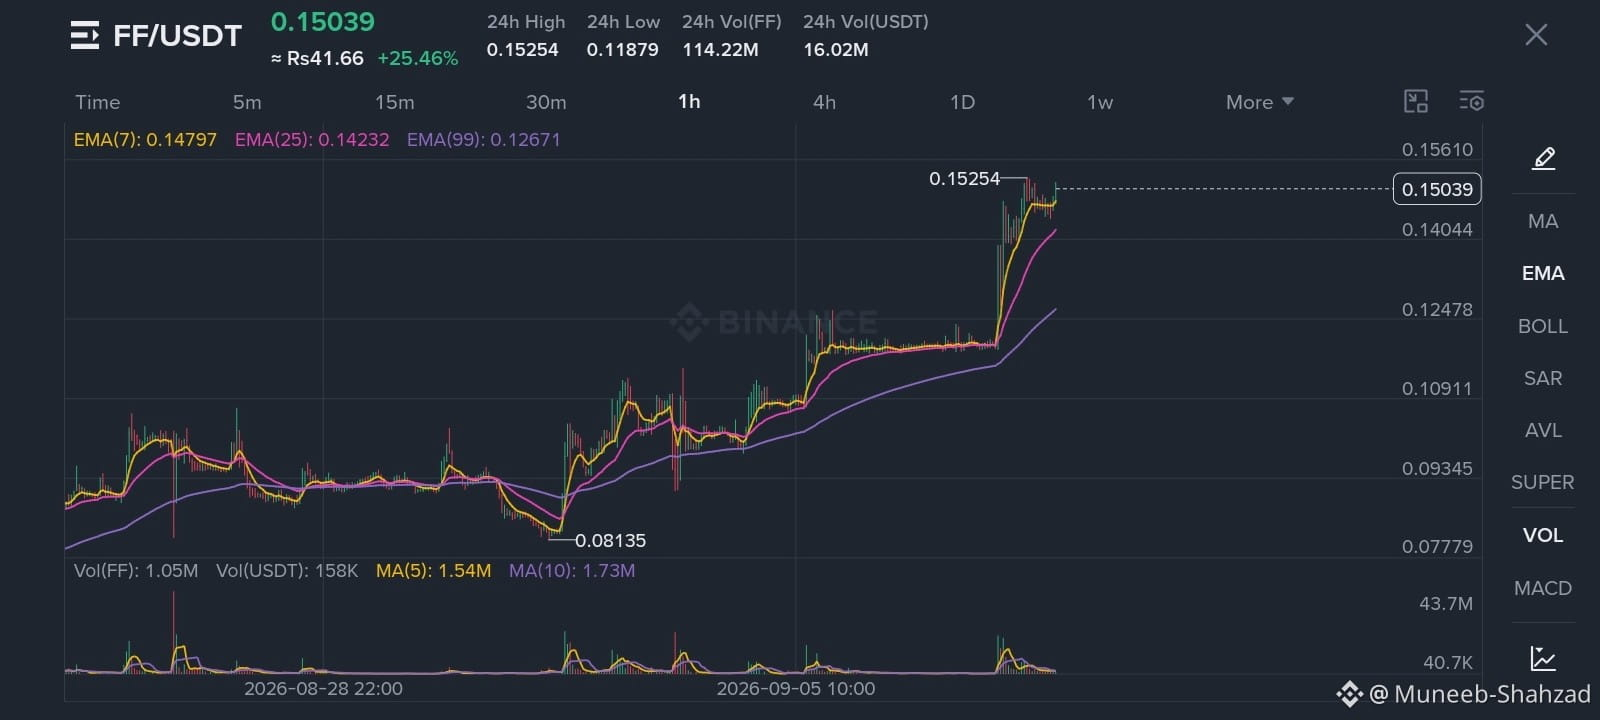
Current price: around $0.147. FF has recently shown strong momentum, with the Sep. 8 daily candle gaining about 24% and closing near $0.150.
Trend: Short-term trend is bullish, but Sep. 9 is currently showing some profit-taking after the sharp rally.
Resistance: $0.151–$0.152 is the immediate resistance zone.
Support: $0.145, then $0.135–$0.140; a deeper support area is around $0.118–$0.123.
Bullish scenario: A strong daily close above $0.152 could open the way toward $0.16–$0.18.
Bearish scenario: Losing $0.145 could trigger a pullback toward $0.135 or lower.
FF's circulating supply is about 3.14B, with a 10B maximum supply, so future token unlocks/dilution are worth watching.
Overall: Short-term bullish but extended. I would avoid chasing a huge green candle and instead watch how price reacts around $0.145–$0.152.
$FF
Current price: around $0.147. FF has recently shown strong momentum, with the Sep. 8 daily candle gaining about 24% and closing near $0.150.
Trend: Short-term trend is bullish, but Sep. 9 is currently showing some profit-taking after the sharp rally.
Resistance: $0.151–$0.152 is the immediate resistance zone.
Support: $0.145, then $0.135–$0.140; a deeper support area is around $0.118–$0.123.
Bullish scenario: A strong daily close above $0.152 could open the way toward $0.16–$0.18.
Bearish scenario: Losing $0.145 could trigger a pullback toward $0.135 or lower.
FF's circulating supply is about 3.14B, with a 10B maximum supply, so future token unlocks/dilution are worth watching.
Overall: Short-term bullish but extended. I would avoid chasing a huge green candle and instead watch how price reacts around $0.145–$0.152.
Current price: around $0.147. FF has recently shown strong momentum, with the Sep. 8 daily candle gaining about 24% and closing near $0.150.
Trend: Short-term trend is bullish, but Sep. 9 is currently showing some profit-taking after the sharp rally.
Resistance: $0.151–$0.152 is the immediate resistance zone.
Support: $0.145, then $0.135–$0.140; a deeper support area is around $0.118–$0.123.
Bullish scenario: A strong daily close above $0.152 could open the way toward $0.16–$0.18.
Bearish scenario: Losing $0.145 could trigger a pullback toward $0.135 or lower.
FF's circulating supply is about 3.14B, with a 10B maximum supply, so future token unlocks/dilution are worth watching.
Overall: Short-term bullish but extended. I would avoid chasing a huge green candle and instead watch how price reacts around $0.145–$0.152.
41
$MOVE
{spot}(MOVEUSDT)
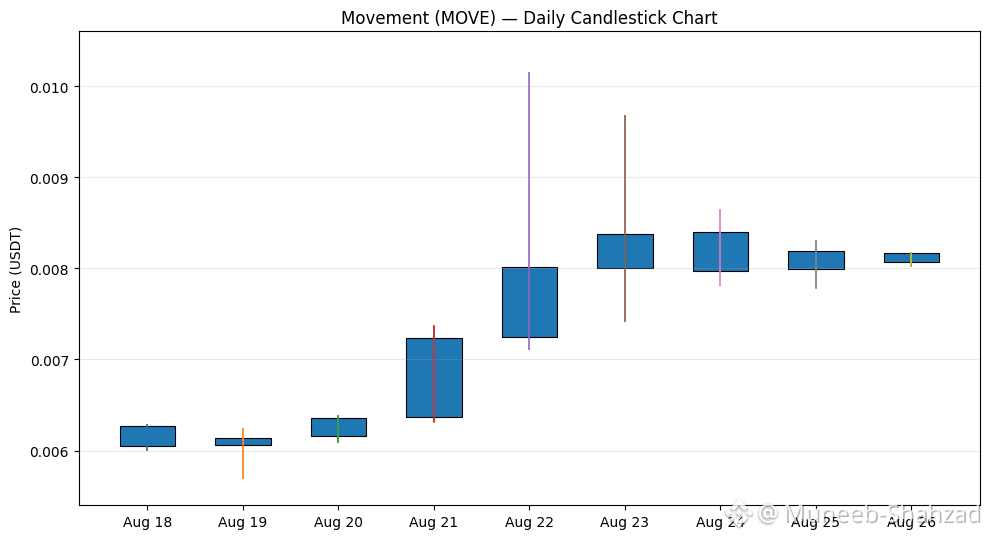
Movement (MOVE) is showing strong short-term recovery momentum. Recent data shows MOVE rising from around $0.0058–$0.0060 on Aug 18–19 to about $0.00807 on Aug 26. The biggest move came around Aug 22–23, when price briefly reached above $0.0096–$0.0101.
Key levels:
🟢 Support: $0.0078–$0.0080
🟡 Major support: ~$0.0071–$0.0074
🔴 Resistance: $0.0086–$0.0090
🔴 Major resistance: ~$0.0096–$0.0101
My view: Short-term structure is bullish but volatile. Holding above ~$0.0078–$0.0080 could keep the recovery alive, while a break above $0.0090 would improve the bullish setup. Losing $0.0074 would weaken it considerably.
The Aug 26 session had an open around $0.00817, high $0.00817, low $0.00803, and close around $0.00807.
$MOVE
Movement (MOVE) is showing strong short-term recovery momentum. Recent data shows MOVE rising from around $0.0058–$0.0060 on Aug 18–19 to about $0.00807 on Aug 26. The biggest move came around Aug 22–23, when price briefly reached above $0.0096–$0.0101.
Key levels:
🟢 Support: $0.0078–$0.0080
🟡 Major support: ~$0.0071–$0.0074
🔴 Resistance: $0.0086–$0.0090
🔴 Major resistance: ~$0.0096–$0.0101
My view: Short-term structure is bullish but volatile. Holding above ~$0.0078–$0.0080 could keep the recovery alive, while a break above $0.0090 would improve the bullish setup. Losing $0.0074 would weaken it considerably.
The Aug 26 session had an open around $0.00817, high $0.00817, low $0.00803, and close around $0.00807.
Movement (MOVE) is showing strong short-term recovery momentum. Recent data shows MOVE rising from around $0.0058–$0.0060 on Aug 18–19 to about $0.00807 on Aug 26. The biggest move came around Aug 22–23, when price briefly reached above $0.0096–$0.0101.
Key levels:
🟢 Support: $0.0078–$0.0080
🟡 Major support: ~$0.0071–$0.0074
🔴 Resistance: $0.0086–$0.0090
🔴 Major resistance: ~$0.0096–$0.0101
My view: Short-term structure is bullish but volatile. Holding above ~$0.0078–$0.0080 could keep the recovery alive, while a break above $0.0090 would improve the bullish setup. Losing $0.0074 would weaken it considerably.
The Aug 26 session had an open around $0.00817, high $0.00817, low $0.00803, and close around $0.00807.
83
$PORTAL
{spot}(PORTALUSDT)
As of 26 Aug 2026, PORTAL is around $0.0144–$0.0182, depending on the exchange/data snapshot. CoinMarketCap shows about $0.0144, ~$12.6M market cap and ~$40.9M 24h volume.
Technical view:
📈 Short-term: Bullish recovery after the May 2026 low near $0.00736.
⚠️ Resistance: Around $0.0200–$0.0220. A strong daily close above this zone could improve momentum.
🟢 Support: Around $0.0125–$0.0130, then $0.0100–$0.0105.
🔥 Volume: Recent volume has been very high, suggesting strong speculative interest.
📊 PORTAL remains far below its 2024 all-time high, so volatility/risk is extremely high.
My bias: 🟡 Neutral-to-bullish above $0.0125, but I'd want to see a breakout above $0.020–$0.022 before calling it strongly bullish.
Candlestick chart
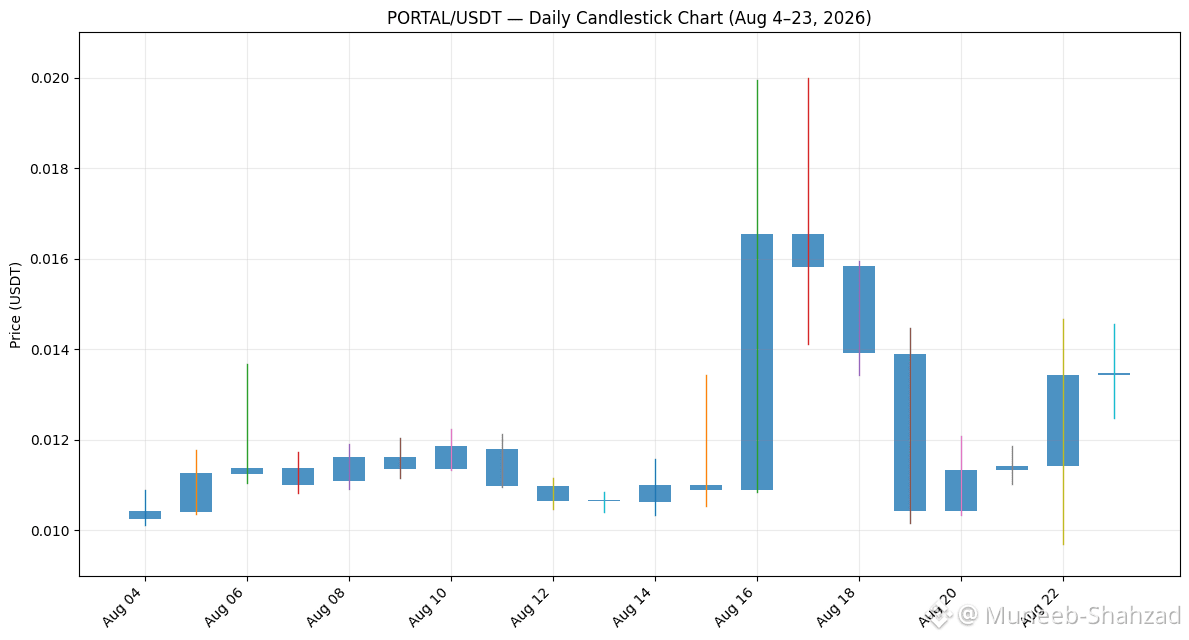
The chart below uses daily PORTAL/USDT OHLC data through Aug 23, where the latest available historical table shows a close around $0.01347.
$PORTAL
As of 26 Aug 2026, PORTAL is around $0.0144–$0.0182, depending on the exchange/data snapshot. CoinMarketCap shows about $0.0144, ~$12.6M market cap and ~$40.9M 24h volume.
Technical view:
📈 Short-term: Bullish recovery after the May 2026 low near $0.00736.
⚠️ Resistance: Around $0.0200–$0.0220. A strong daily close above this zone could improve momentum.
🟢 Support: Around $0.0125–$0.0130, then $0.0100–$0.0105.
🔥 Volume: Recent volume has been very high, suggesting strong speculative interest.
📊 PORTAL remains far below its 2024 all-time high, so volatility/risk is extremely high.
My bias: 🟡 Neutral-to-bullish above $0.0125, but I'd want to see a breakout above $0.020–$0.022 before calling it strongly bullish.
Candlestick chart
The chart below uses daily PORTAL/USDT OHLC data through Aug 23, where the latest available historical table shows a close around $0.01347.
As of 26 Aug 2026, PORTAL is around $0.0144–$0.0182, depending on the exchange/data snapshot. CoinMarketCap shows about $0.0144, ~$12.6M market cap and ~$40.9M 24h volume.
Technical view:
📈 Short-term: Bullish recovery after the May 2026 low near $0.00736.
⚠️ Resistance: Around $0.0200–$0.0220. A strong daily close above this zone could improve momentum.
🟢 Support: Around $0.0125–$0.0130, then $0.0100–$0.0105.
🔥 Volume: Recent volume has been very high, suggesting strong speculative interest.
📊 PORTAL remains far below its 2024 all-time high, so volatility/risk is extremely high.
My bias: 🟡 Neutral-to-bullish above $0.0125, but I'd want to see a breakout above $0.020–$0.022 before calling it strongly bullish.
Candlestick chart
The chart below uses daily PORTAL/USDT OHLC data through Aug 23, where the latest available historical table shows a close around $0.01347.
60
$EDEN
{spot}(EDENUSDT)
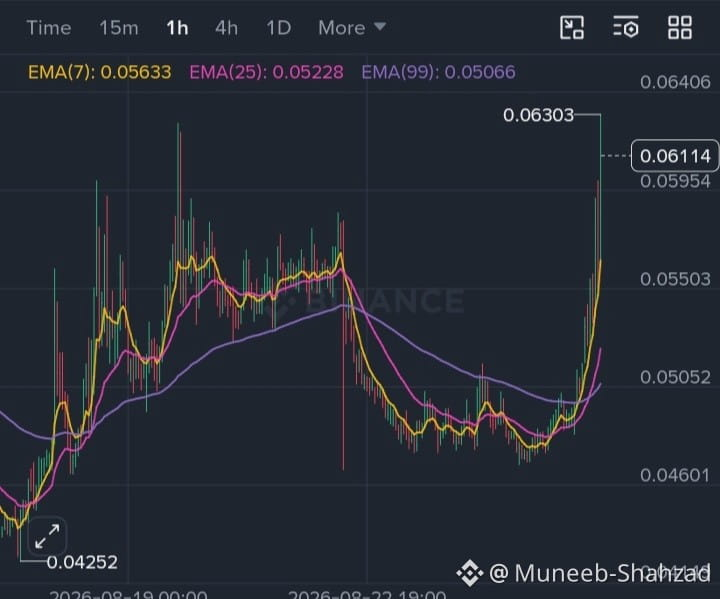
EDEN is the utility/governance token of OpenEden, a real-world-assets (RWA) project focused on tokenized U.S. Treasury products and related on-chain financial products.
Technically, EDEN has shown high volatility recently. It moved from around $0.043 on Aug 15 to $0.073 on Aug 13 before a sharp pullback, then recovered toward the $0.05–$0.057 area by Aug 26.
Investing.com +1
Key levels from the recent daily candles:
🟢 Support: ~$0.047–0.050
🟢 Stronger support: ~$0.043
🔴 Resistance: ~$0.058–0.062
🔴 Major resistance: ~$0.073–0.087
The recent price action suggests recovery after a major correction, but volatility is still very high. A sustained break above $0.062 would improve the bullish setup; losing $0.047 could reopen downside toward ~$0.043.
$EDEN
EDEN is the utility/governance token of OpenEden, a real-world-assets (RWA) project focused on tokenized U.S. Treasury products and related on-chain financial products.
Technically, EDEN has shown high volatility recently. It moved from around $0.043 on Aug 15 to $0.073 on Aug 13 before a sharp pullback, then recovered toward the $0.05–$0.057 area by Aug 26.
Investing.com +1
Key levels from the recent daily candles:
🟢 Support: ~$0.047–0.050
🟢 Stronger support: ~$0.043
🔴 Resistance: ~$0.058–0.062
🔴 Major resistance: ~$0.073–0.087
The recent price action suggests recovery after a major correction, but volatility is still very high. A sustained break above $0.062 would improve the bullish setup; losing $0.047 could reopen downside toward ~$0.043.
EDEN is the utility/governance token of OpenEden, a real-world-assets (RWA) project focused on tokenized U.S. Treasury products and related on-chain financial products.
Technically, EDEN has shown high volatility recently. It moved from around $0.043 on Aug 15 to $0.073 on Aug 13 before a sharp pullback, then recovered toward the $0.05–$0.057 area by Aug 26.
Investing.com +1
Key levels from the recent daily candles:
🟢 Support: ~$0.047–0.050
🟢 Stronger support: ~$0.043
🔴 Resistance: ~$0.058–0.062
🔴 Major resistance: ~$0.073–0.087
The recent price action suggests recovery after a major correction, but volatility is still very high. A sustained break above $0.062 would improve the bullish setup; losing $0.047 could reopen downside toward ~$0.043.
64
$BMT
{spot}(BMTUSDT)
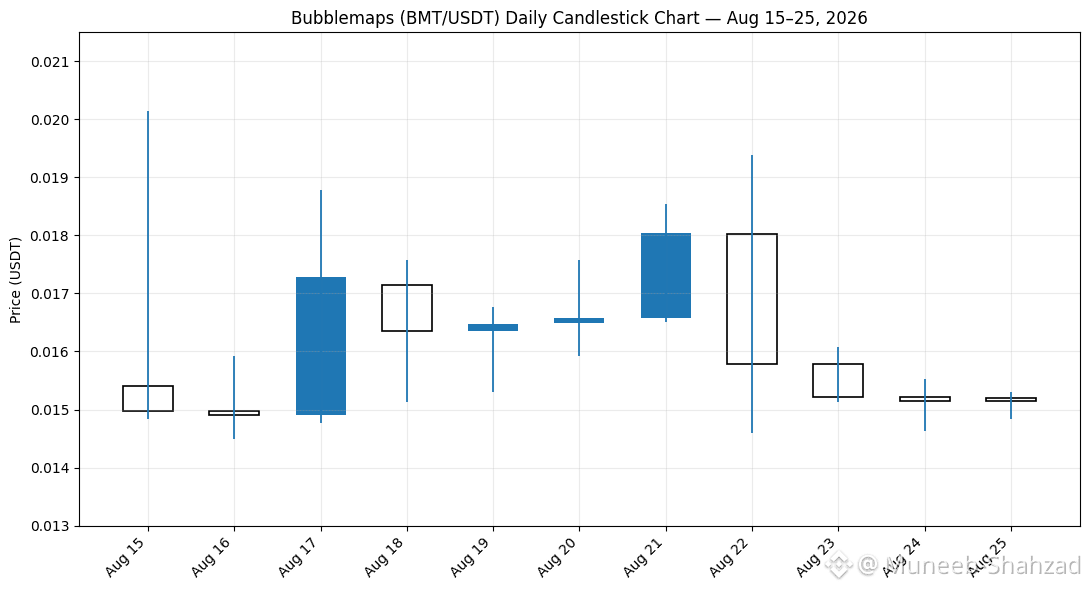
BMT is the token of Bubblemaps, an on-chain analytics platform that visualizes blockchain wallet activity.
Current setup: BMT is trading around $0.0151. The recent chart shows a sharp move from about $0.013 to above $0.018, followed by a correction back toward $0.015.
$BMT
BMT is the token of Bubblemaps, an on-chain analytics platform that visualizes blockchain wallet activity.
Current setup: BMT is trading around $0.0151. The recent chart shows a sharp move from about $0.013 to above $0.018, followed by a correction back toward $0.015.
BMT is the token of Bubblemaps, an on-chain analytics platform that visualizes blockchain wallet activity.
Current setup: BMT is trading around $0.0151. The recent chart shows a sharp move from about $0.013 to above $0.018, followed by a correction back toward $0.015.
90
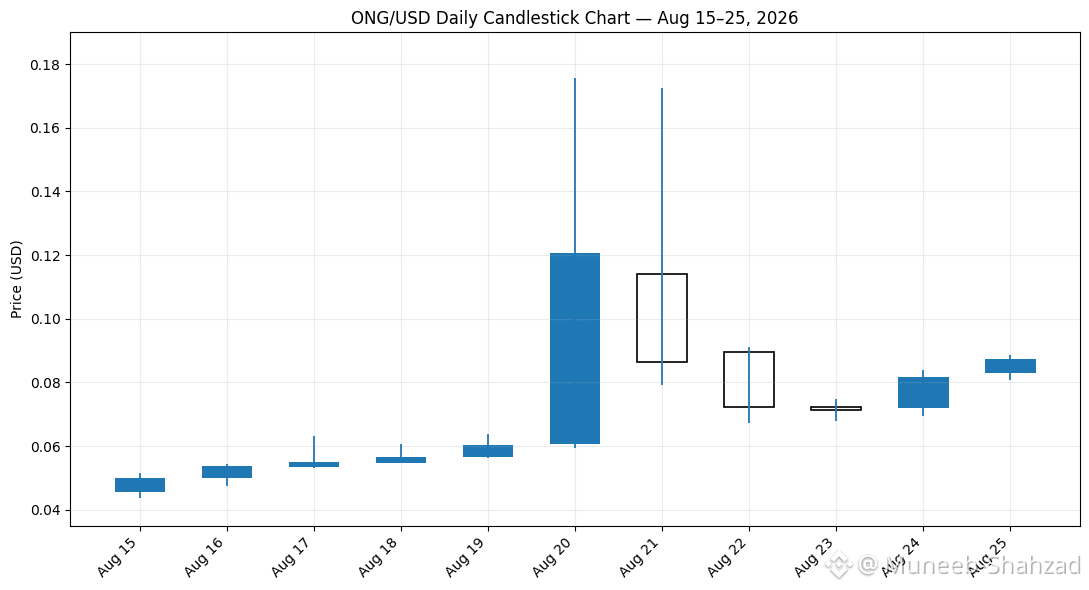
$ONG ONG has shown a very strong but highly volatile recovery in August. From around $0.045 on Aug 15, it reached a spike above $0.17 on Aug 20–21, followed by a sharp correction. By Aug 25, ONG was around $0.087, with the day showing roughly +6.5% on the Binance historical feed.
{spot}(ONGUSDT)
$ONG ONG has shown a very strong but highly volatile recovery in August. From around $0.045 on Aug 15, it reached a spike above $0.17 on Aug 20–21, followed by a sharp correction. By Aug 25, ONG was around $0.087, with the day showing roughly +6.5% on the Binance historical feed.
76
Log in to explore more content
Join global crypto users on Binance Square
⚡️ Get latest and useful information about crypto.
💬 Trusted by the world’s largest crypto exchange.
👍 Discover real insights from verified creators.
Email / Phone number
Trending Topics
CryptoSelloffTriggersMultipleWhaleLiquidations
39,902 views
620 Discussing
Crypto Liquidations Top $2B in 24 Hours as 329,000 Traders Are Wiped Out
Binance News
·24 Likes
·20.4k views
USSpotXRPETFsSeeLargestWeeklyOutflowIn8Months
71,230 views
882 Discussing
WillFOMCMinutesReinforceRateHikeExpectations?
10,655 views
258 Discussing