
SnEmroz
2k Posts

SnEmroz
Report
Block User
Crypto Trader | Scalper | Challenge Master Sharing smart setups & Trade Psychology | Quality - Quantity I DYOR I (X- Marks_BTC )
High-Frequency Trader
7.8 Years
36 Following
8.8K+ Followers
9.6K+ Liked
Posts
All
Quotes
Videos
PINNED
·
--
Bullish
Look at these screenshots.
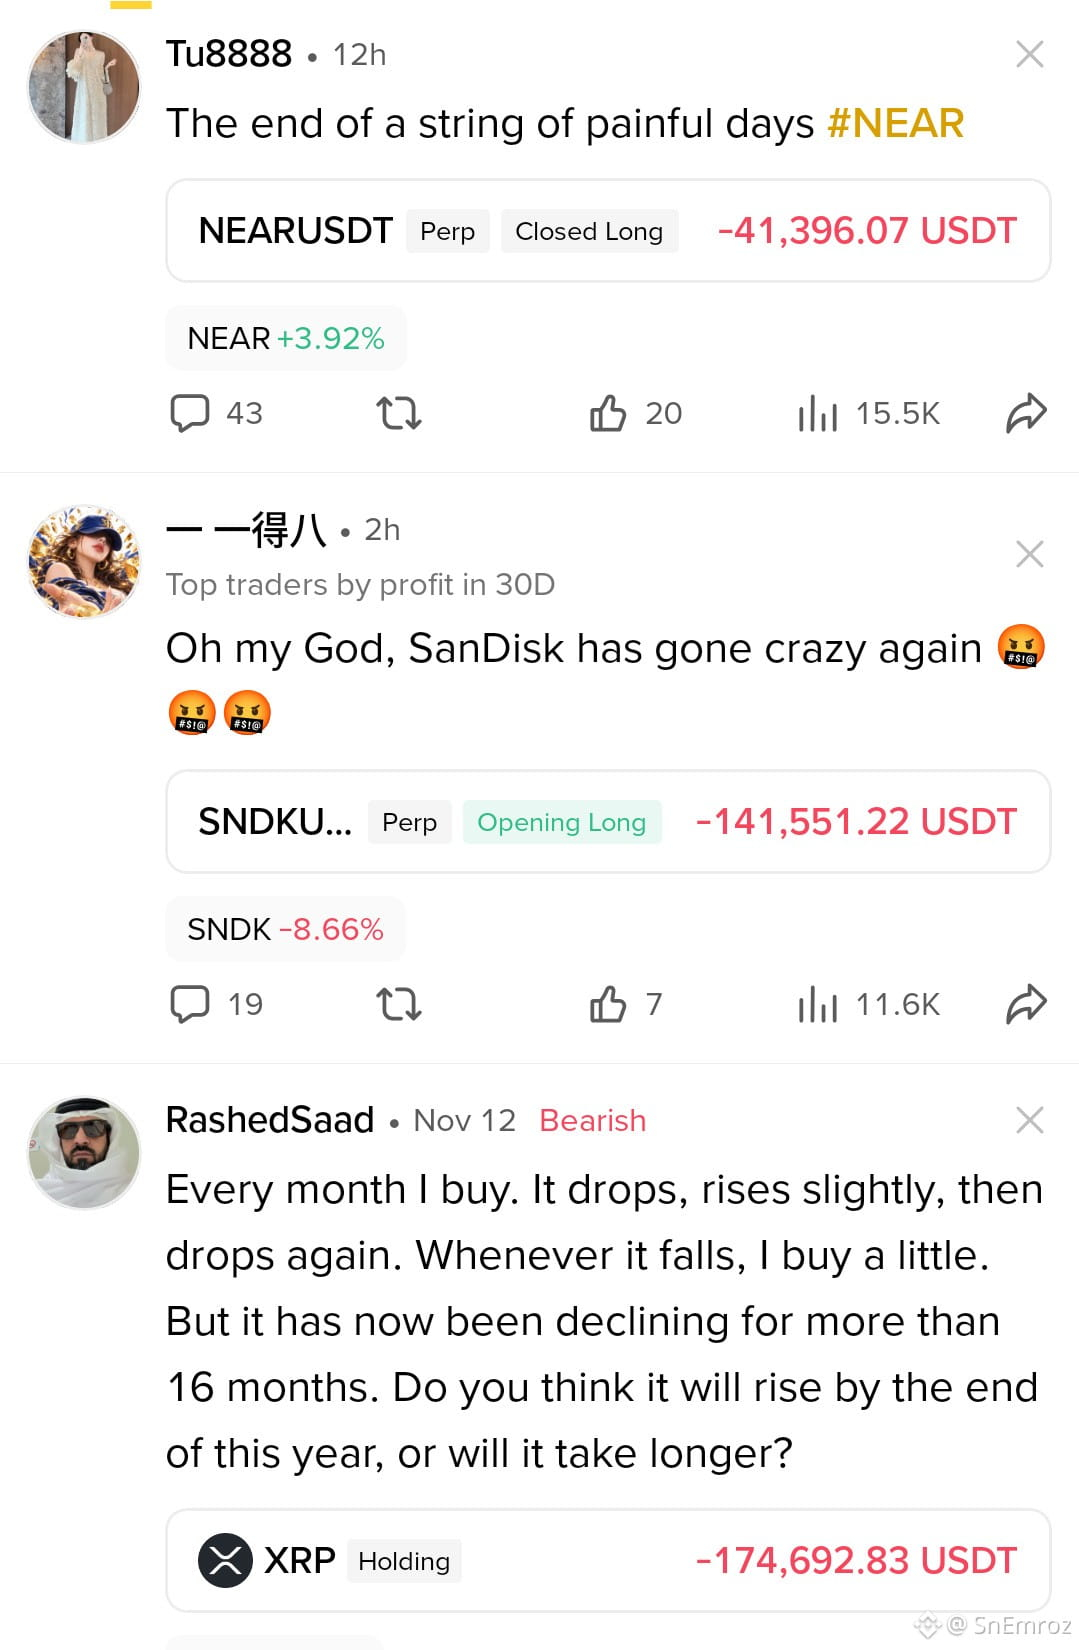
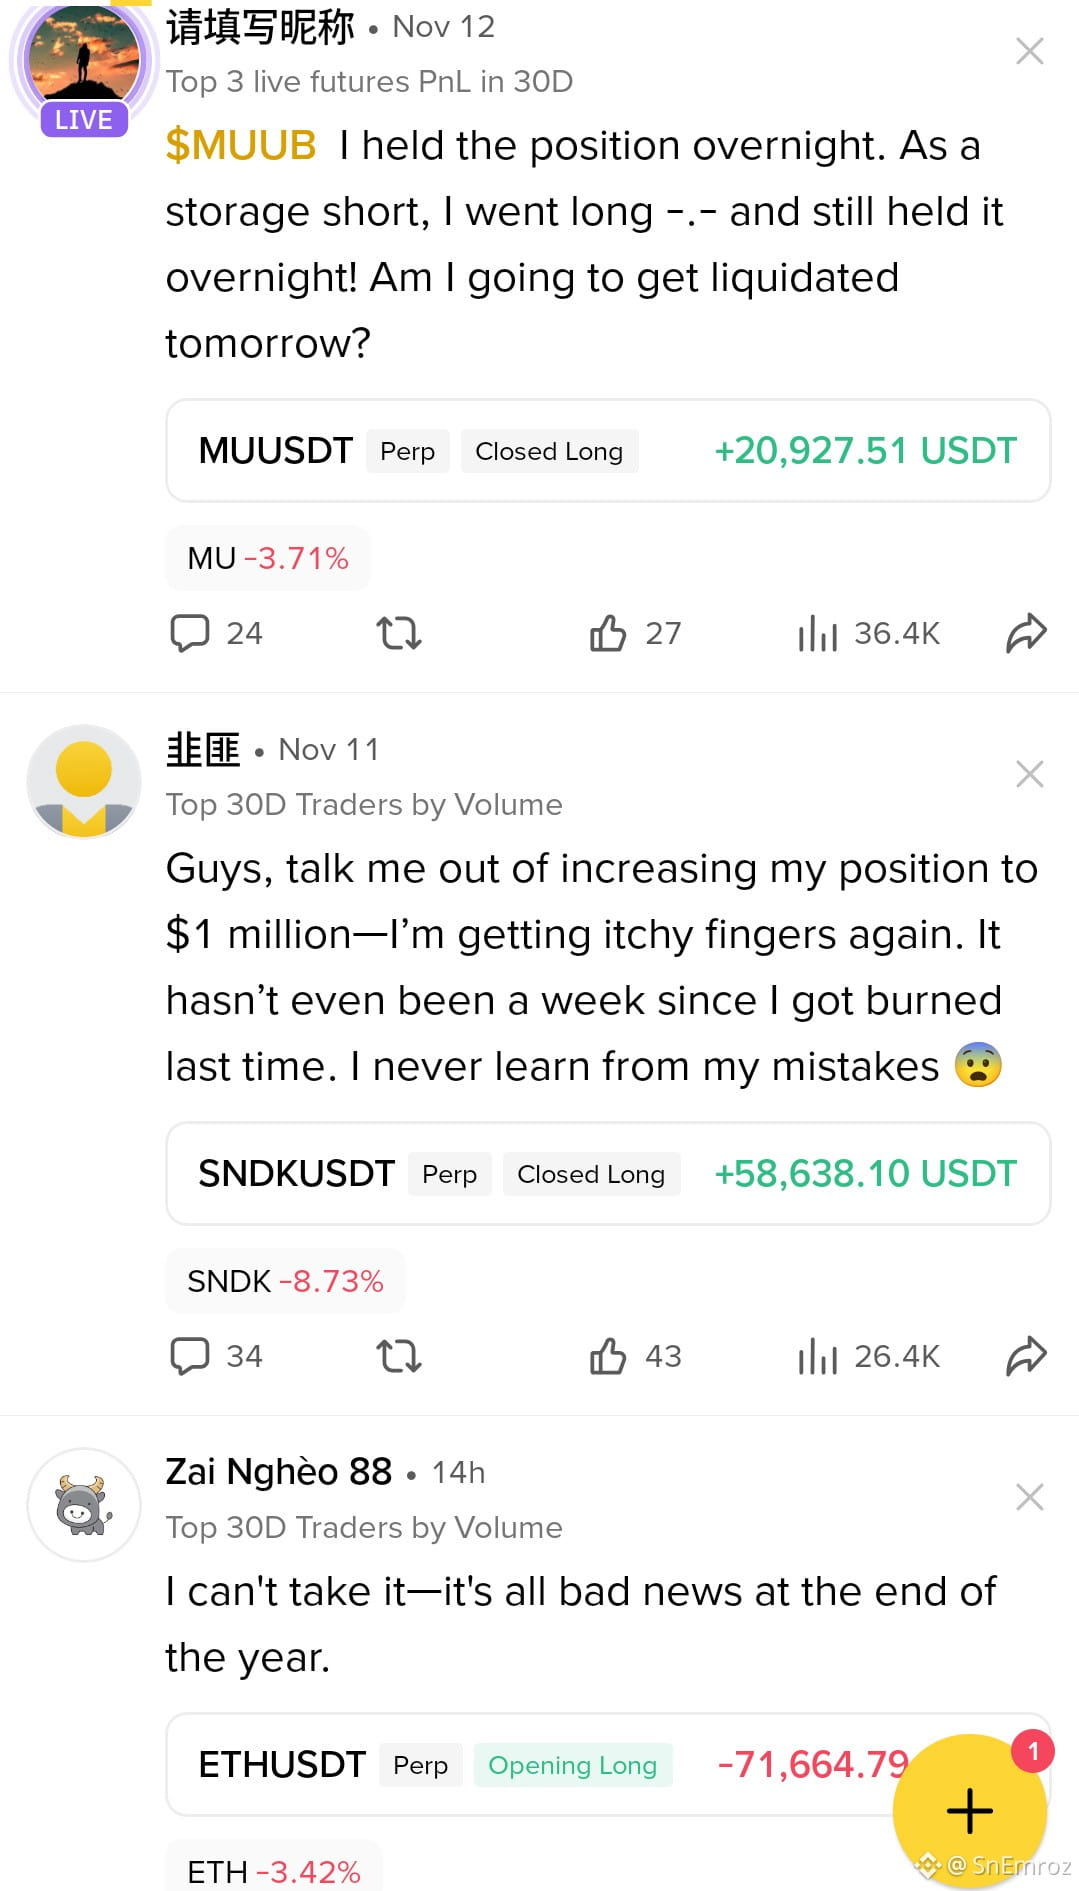
some big players are also taking massive losses. One trader lost over $41K on a NEAR long. Another showed a loss of more than $141K on SNDK. And others are struggling with the same emotional battle.
The question is why does this happen even when they have trading experience and market knowledge?
One major reason is poor trading psychology.
Many traders want profit on every trade. They don't want to accept a loss. They hold losing positions. wait for the market to recover. and sometimes increase their exposure. Instead of protecting their capital. they let their emotions control their decisions.
That's why I have decided to train 20 lucky people in trading completely free of cost.
What will they learn?
✅ How to read charts and understand market behaviour.
✅ How to identify trading setups and wait for confirmation.
✅ How to plan entries, take profits, and manage stop losses.
✅ How to control emotions and accept losses.
✅ How to manage risk and protect trading capital.
✅ How to analyse their trades and learn from mistakes.
The goal is not to promise anyone misleading. It's to help them build real trading knowledge. practise with discipline and understand how to manage risk. They will learn through practical market examples and guided exercises.
No course fees❌. No payment❌. Just learning✅.
So are you interested in becoming one of these 20 people?
Comment I'M IN below. 👇
Look at these screenshots.
some big players are also taking massive losses. One trader lost over $41K on a NEAR long. Another showed a loss of more than $141K on SNDK. And others are struggling with the same emotional battle.
The question is why does this happen even when they have trading experience and market knowledge?
One major reason is poor trading psychology.
Many traders want profit on every trade. They don't want to accept a loss. They hold losing positions. wait for the market to recover. and sometimes increase their exposure. Instead of protecting their capital. they let their emotions control their decisions.
That's why I have decided to train 20 lucky people in trading completely free of cost.
What will they learn?
✅ How to read charts and understand market behaviour.
✅ How to identify trading setups and wait for confirmation.
✅ How to plan entries, take profits, and manage stop losses.
✅ How to control emotions and accept losses.
✅ How to manage risk and protect trading capital.
✅ How to analyse their trades and learn from mistakes.
The goal is not to promise anyone misleading. It's to help them build real trading knowledge. practise with discipline and understand how to manage risk. They will learn through practical market examples and guided exercises.
No course fees❌. No payment❌. Just learning✅.
So are you interested in becoming one of these 20 people?
Comment I'M IN below. 👇
some big players are also taking massive losses. One trader lost over $41K on a NEAR long. Another showed a loss of more than $141K on SNDK. And others are struggling with the same emotional battle.
The question is why does this happen even when they have trading experience and market knowledge?
One major reason is poor trading psychology.
Many traders want profit on every trade. They don't want to accept a loss. They hold losing positions. wait for the market to recover. and sometimes increase their exposure. Instead of protecting their capital. they let their emotions control their decisions.
That's why I have decided to train 20 lucky people in trading completely free of cost.
What will they learn?
✅ How to read charts and understand market behaviour.
✅ How to identify trading setups and wait for confirmation.
✅ How to plan entries, take profits, and manage stop losses.
✅ How to control emotions and accept losses.
✅ How to manage risk and protect trading capital.
✅ How to analyse their trades and learn from mistakes.
The goal is not to promise anyone misleading. It's to help them build real trading knowledge. practise with discipline and understand how to manage risk. They will learn through practical market examples and guided exercises.
No course fees❌. No payment❌. Just learning✅.
So are you interested in becoming one of these 20 people?
Comment I'M IN below. 👇
2
1
1.1k
·
--
Bullish
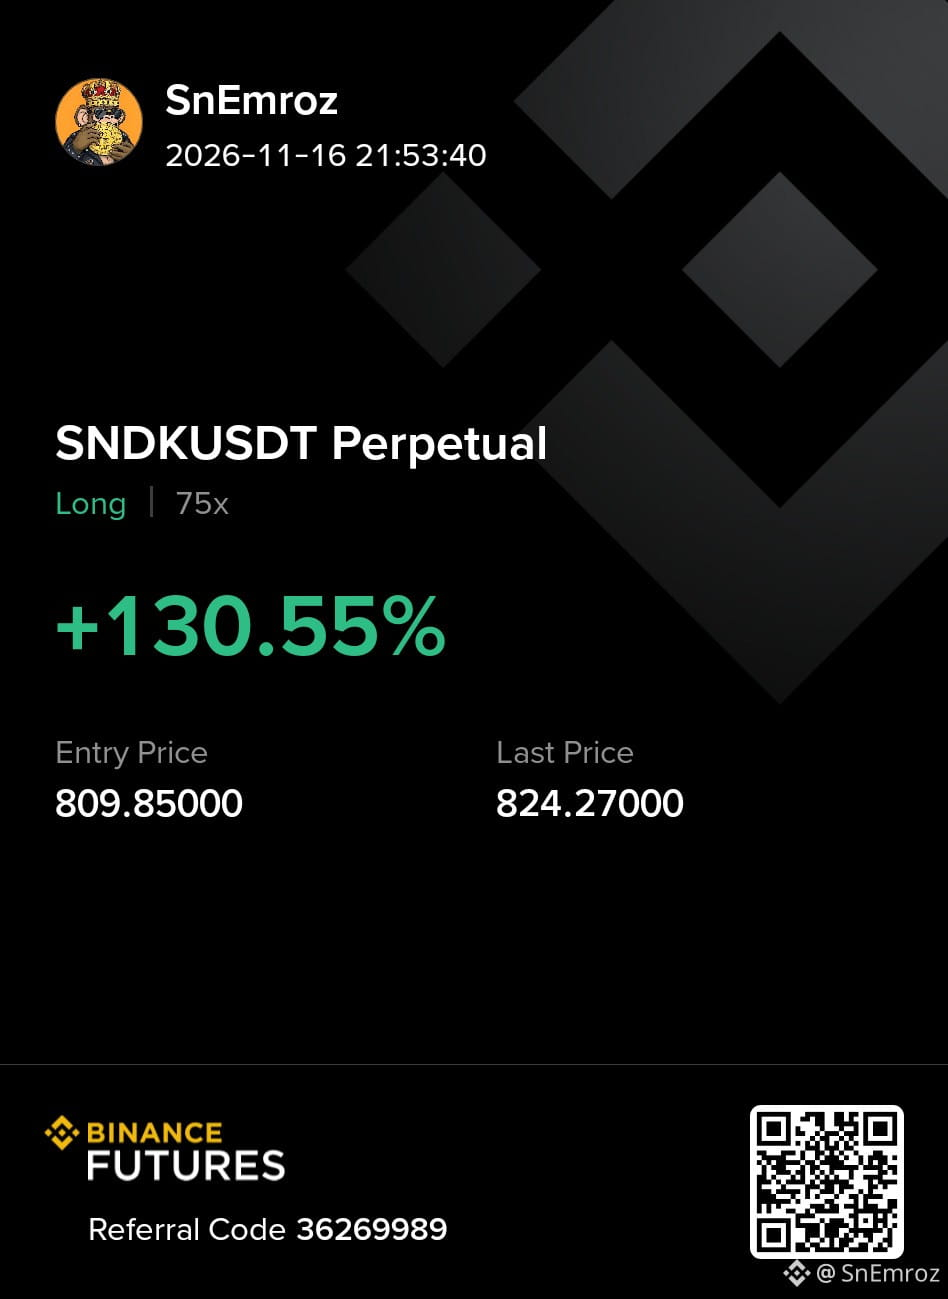
Long $SNDK 197.8 USDT
Look why I took $SNDK the long.
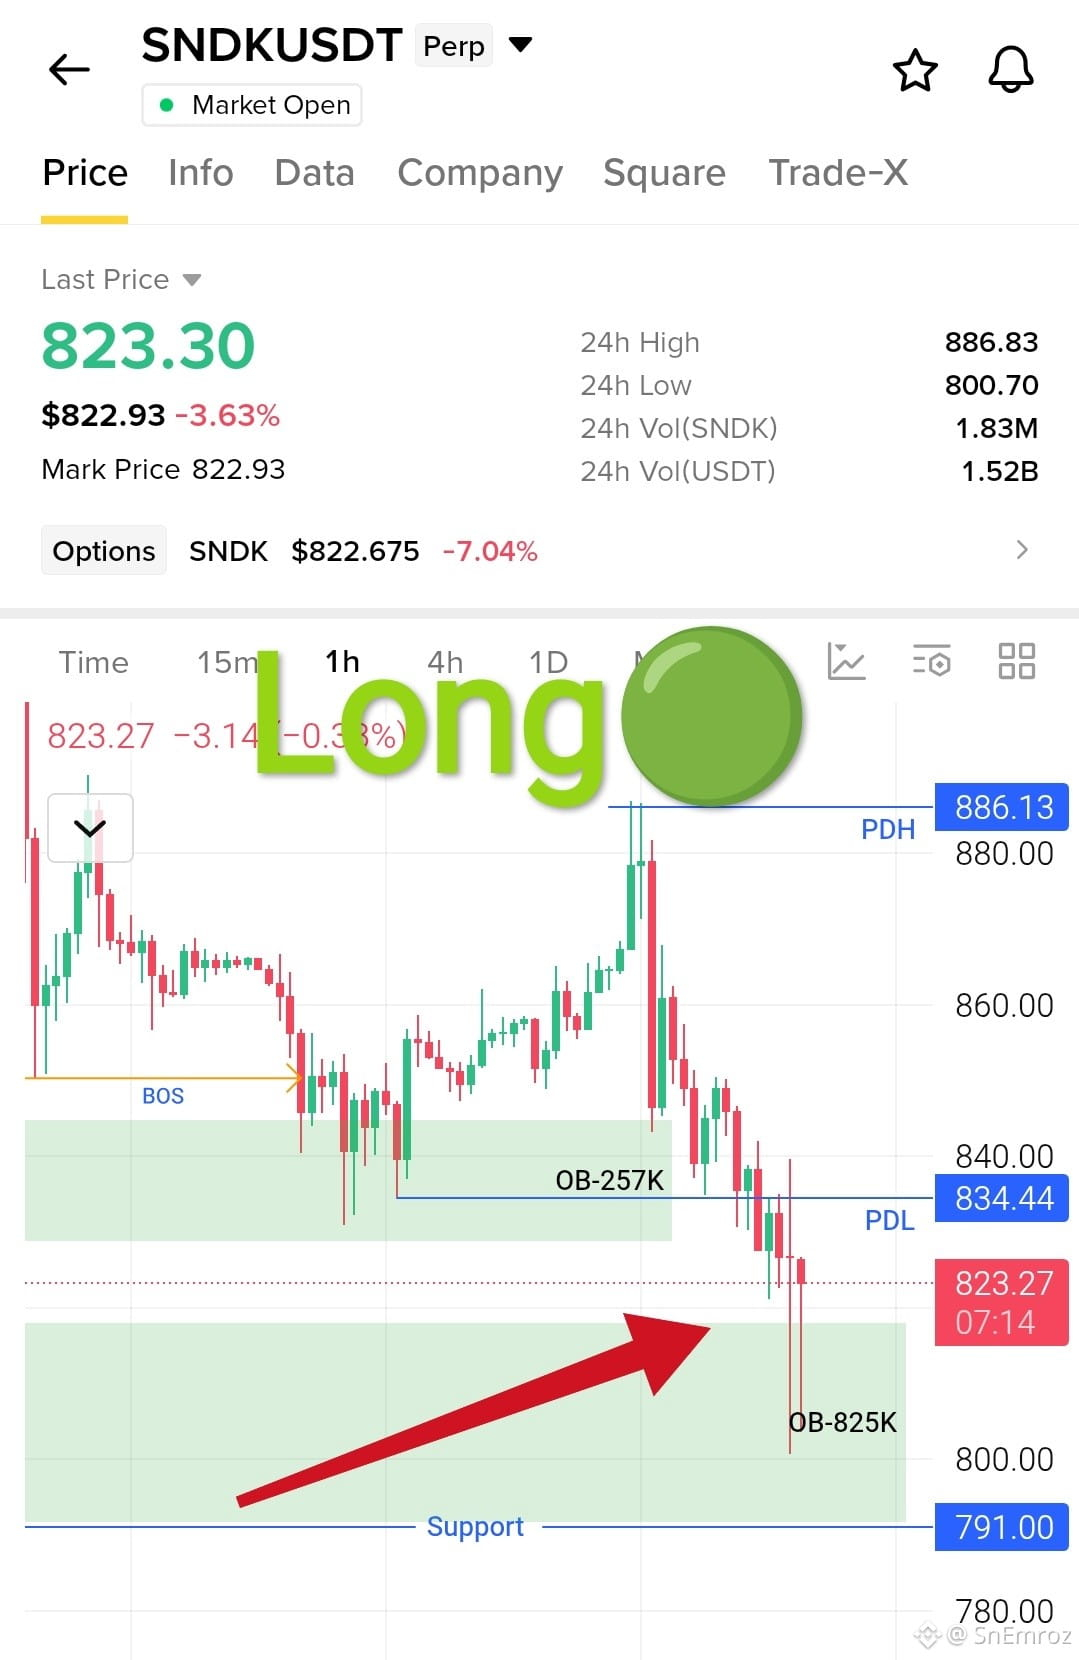
Price came down hard from the $886 area and kept making red candles. Then it dropped into the 1h order block between $792 and $818. This is the zone that was marked as OB 825K on the chart and the support line at $791 sits right at the bottom of it.
{future}(SNDKUSDT)
Here is what I saw. Price tapped the zone and swept down to $800 and left a long wick. That wick says sellers pushed price down but could not keep it there. Buyers took the other side. The sweep took the liquidity under the last lows and that is the moment I want to buy.
Price is now $823 and the first target is $834 which is the previous day low. After that the next areas are $860 and then the previous day high near $886.
Look why I took $SNDK the long.
Price came down hard from the $886 area and kept making red candles. Then it dropped into the 1h order block between $792 and $818. This is the zone that was marked as OB 825K on the chart and the support line at $791 sits right at the bottom of it.
Here is what I saw. Price tapped the zone and swept down to $800 and left a long wick. That wick says sellers pushed price down but could not keep it there. Buyers took the other side. The sweep took the liquidity under the last lows and that is the moment I want to buy.
Price is now $823 and the first target is $834 which is the previous day low. After that the next areas are $860 and then the previous day high near $886.
Price came down hard from the $886 area and kept making red candles. Then it dropped into the 1h order block between $792 and $818. This is the zone that was marked as OB 825K on the chart and the support line at $791 sits right at the bottom of it.
Here is what I saw. Price tapped the zone and swept down to $800 and left a long wick. That wick says sellers pushed price down but could not keep it there. Buyers took the other side. The sweep took the liquidity under the last lows and that is the moment I want to buy.
Price is now $823 and the first target is $834 which is the previous day low. After that the next areas are $860 and then the previous day high near $886.
1
635
·
--
Bullish
Stocks are falling. Crypto is falling. Bonds are falling. Gold and silver are falling too.
Everyone is asking the same thing. Where do I put my money now.
Here is what I see. When all markets move down together there is no hiding place. The people who win in these times are not the ones who find a magic asset. They are the ones who stay ready.
Stay liquid. Money in your hand is power when the price gets cheap.
Stay small. If you must trade then trade with a size that lets you sleep at night.
Stay patient. Do not jump into every green candle. Wait for the market to show a base and a confirmation.
Stay learning. A weak market is the best school. Study your mistakes and fix your rules.
Remember one thing. Every big rally in history started when most people were scared and sure that it was over.
I do not know where the bottom is and nobody does. But I know that fear passes and prepared traders are the ones who benefit.
What is your plan right now. Write it in the comments. I want to read it.
And never risk more than you can afford to lose.
Stocks are falling. Crypto is falling. Bonds are falling. Gold and silver are falling too.
Everyone is asking the same thing. Where do I put my money now.
Here is what I see. When all markets move down together there is no hiding place. The people who win in these times are not the ones who find a magic asset. They are the ones who stay ready.
Stay liquid. Money in your hand is power when the price gets cheap.
Stay small. If you must trade then trade with a size that lets you sleep at night.
Stay patient. Do not jump into every green candle. Wait for the market to show a base and a confirmation.
Stay learning. A weak market is the best school. Study your mistakes and fix your rules.
Remember one thing. Every big rally in history started when most people were scared and sure that it was over.
I do not know where the bottom is and nobody does. But I know that fear passes and prepared traders are the ones who benefit.
What is your plan right now. Write it in the comments. I want to read it.
And never risk more than you can afford to lose.
Everyone is asking the same thing. Where do I put my money now.
Here is what I see. When all markets move down together there is no hiding place. The people who win in these times are not the ones who find a magic asset. They are the ones who stay ready.
Stay liquid. Money in your hand is power when the price gets cheap.
Stay small. If you must trade then trade with a size that lets you sleep at night.
Stay patient. Do not jump into every green candle. Wait for the market to show a base and a confirmation.
Stay learning. A weak market is the best school. Study your mistakes and fix your rules.
Remember one thing. Every big rally in history started when most people were scared and sure that it was over.
I do not know where the bottom is and nobody does. But I know that fear passes and prepared traders are the ones who benefit.
What is your plan right now. Write it in the comments. I want to read it.
And never risk more than you can afford to lose.

110
·
--
Bullish
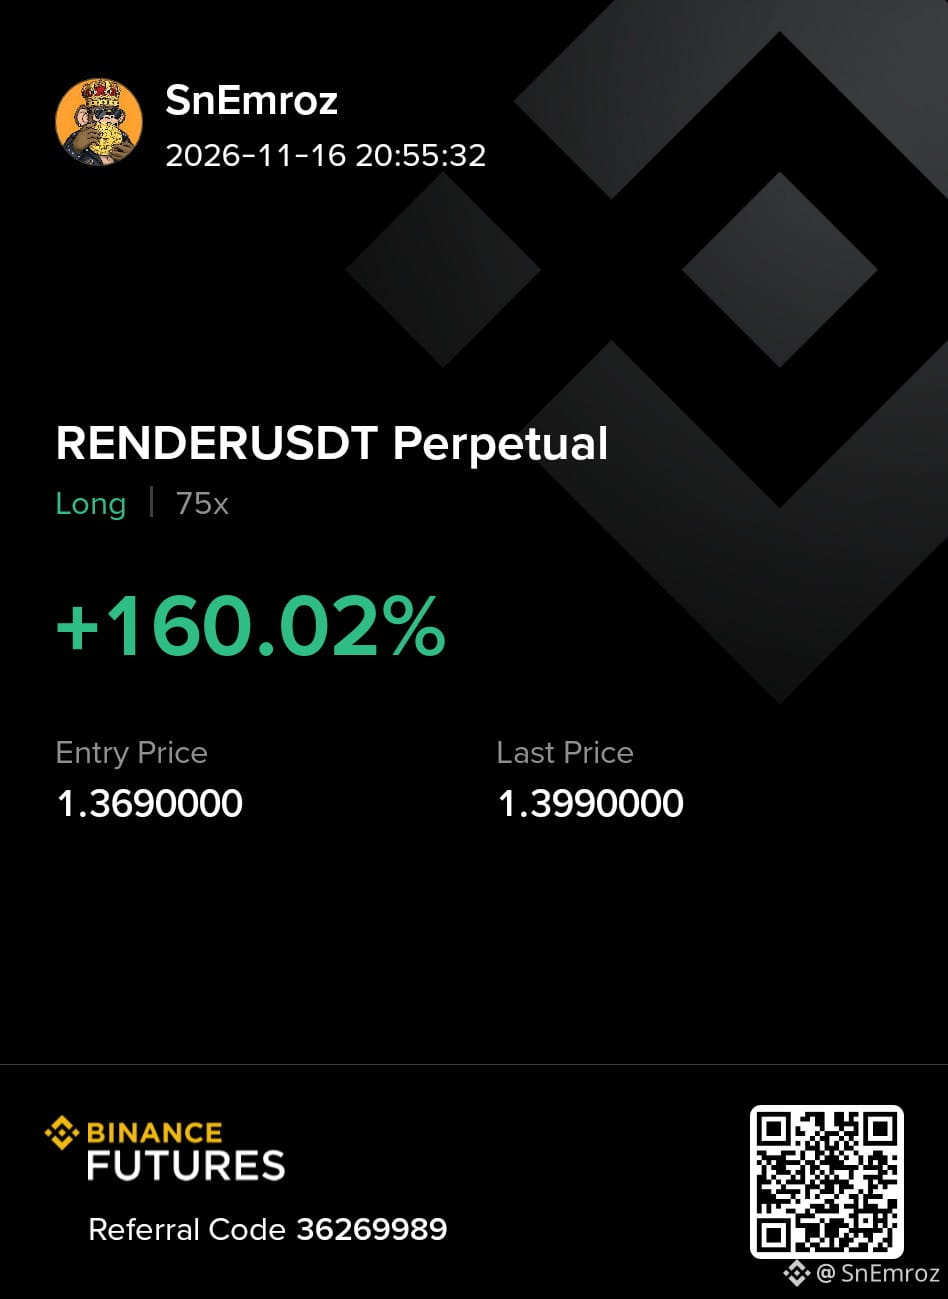
When Market Became Trade..
$RENDER
{future}(RENDERUSDT)
People forget this Sleeping King⚠️
When Market Became Trade..
$RENDER
People forget this Sleeping King⚠️
$RENDER
People forget this Sleeping King⚠️
1
114
·
--
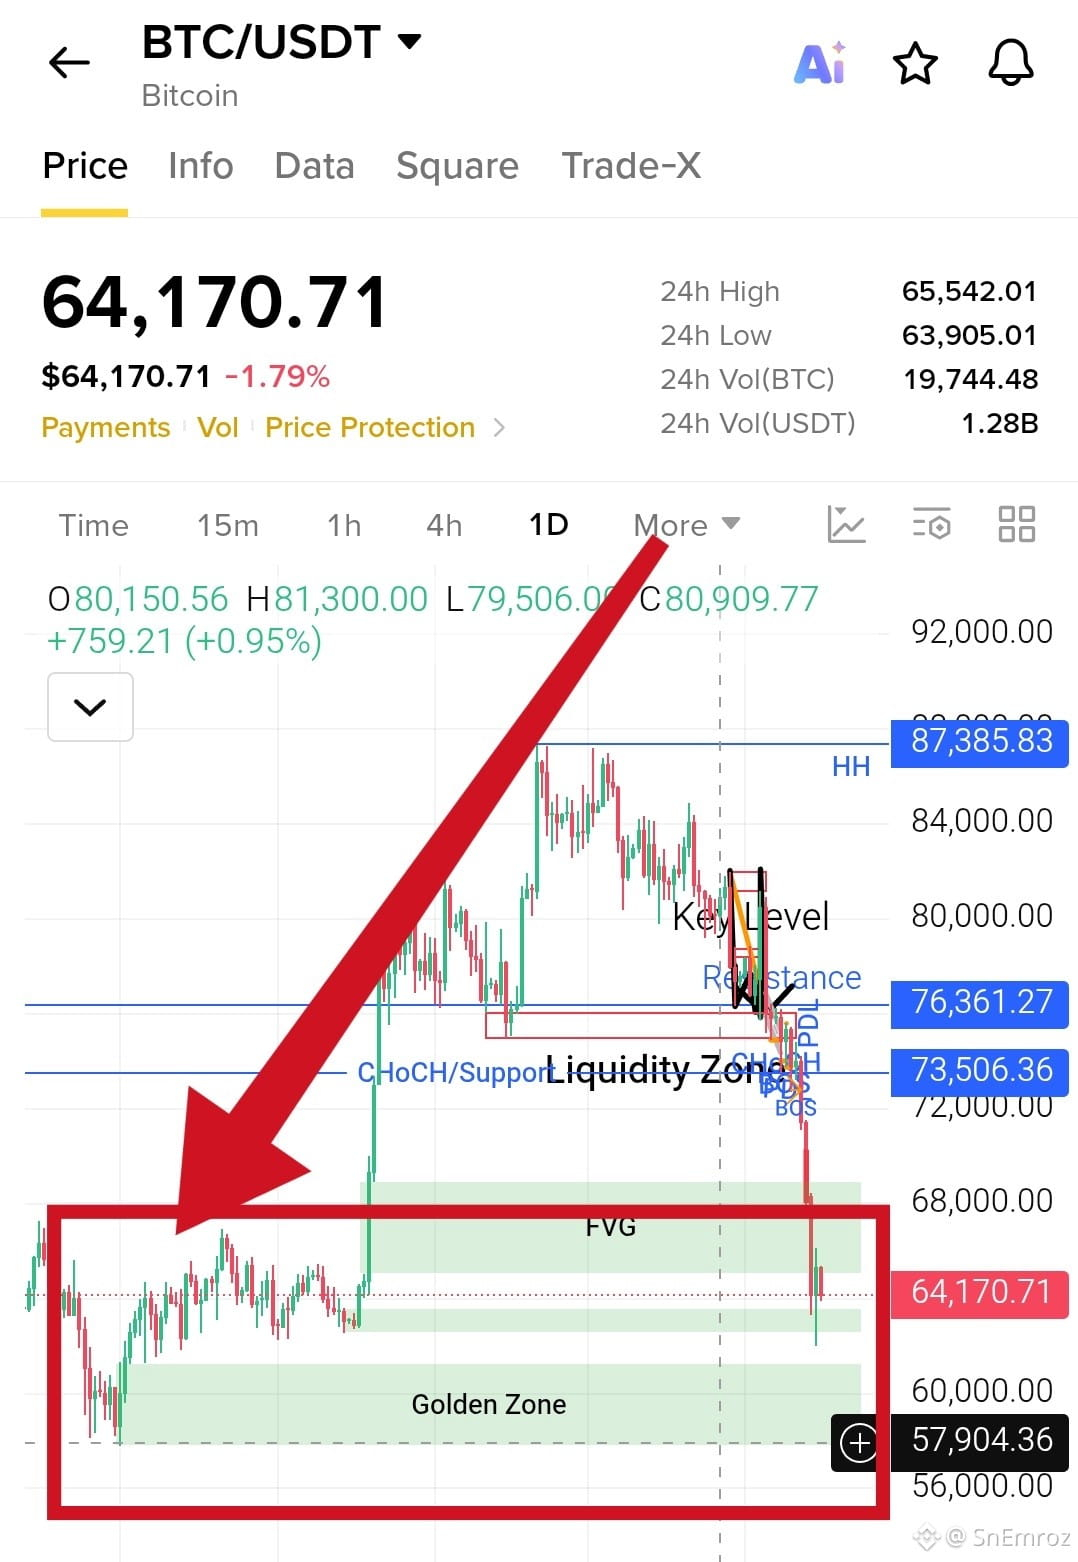
I think before the $BTC rally it could go down around $57000 to $60000.
$BTC
{future}(BTCUSDT)
Price now is $64170. The bloodbath broke the support at $73500 and the market is still making lower highs and lower lows. The bounces so far are small and weak. Price is also still under the fair value gap between $65000 and $68900 which is a place sellers like.
Below us the daily golden zone sits between $57800 and $61000. That is the big demand area on the chart and it is also where price left the last strong base. Price has not touched it yet. Markets like to go and take the liquidity in a zone like this before a real move up.
So my view is simple. A move down into $57000 to $60000 first. Then I look for the reaction. A daily close back above $61000 after the sweep would be the first sign that buyers are back. After that the targets are the fair value gap near $68900 and later $73500 and $76360.
I think before the $BTC rally it could go down around $57000 to $60000.
$BTC
Price now is $64170. The bloodbath broke the support at $73500 and the market is still making lower highs and lower lows. The bounces so far are small and weak. Price is also still under the fair value gap between $65000 and $68900 which is a place sellers like.
Below us the daily golden zone sits between $57800 and $61000. That is the big demand area on the chart and it is also where price left the last strong base. Price has not touched it yet. Markets like to go and take the liquidity in a zone like this before a real move up.
So my view is simple. A move down into $57000 to $60000 first. Then I look for the reaction. A daily close back above $61000 after the sweep would be the first sign that buyers are back. After that the targets are the fair value gap near $68900 and later $73500 and $76360.
$BTC
Price now is $64170. The bloodbath broke the support at $73500 and the market is still making lower highs and lower lows. The bounces so far are small and weak. Price is also still under the fair value gap between $65000 and $68900 which is a place sellers like.
Below us the daily golden zone sits between $57800 and $61000. That is the big demand area on the chart and it is also where price left the last strong base. Price has not touched it yet. Markets like to go and take the liquidity in a zone like this before a real move up.
So my view is simple. A move down into $57000 to $60000 first. Then I look for the reaction. A daily close back above $61000 after the sweep would be the first sign that buyers are back. After that the targets are the fair value gap near $68900 and later $73500 and $76360.
98
·
--
Bullish
2
1
747
·
--
Bullish
BREAKING🔥. Michael Saylor Strategy has bought $31 million worth of #Bitcoin .
While BTC is getting pushed down and the market talks about the $ANTHROPIC IPO the biggest corporate holder keeps buying. Saylor is buying the dip.
Think about it. Retail panics in every bloodbath. Big players use the same fear to build their position. That is the difference between emotion and a plan.
A $31 million buy is also small compared to what Strategy holds. It does not mean BTC will go up tomorrow. Do not buy only because Saylor bought. He has a different time frame and a different risk level than you.
What do you think. Is this a real signal or just noise. Tell me in the comments.
$BTC
{spot}(BTCUSDT)
$ANTHROPIC
{future}(ANTHROPICUSDT)
BREAKING🔥. Michael Saylor Strategy has bought $31 million worth of #Bitcoin .
While BTC is getting pushed down and the market talks about the $ANTHROPIC IPO the biggest corporate holder keeps buying. Saylor is buying the dip.
Think about it. Retail panics in every bloodbath. Big players use the same fear to build their position. That is the difference between emotion and a plan.
A $31 million buy is also small compared to what Strategy holds. It does not mean BTC will go up tomorrow. Do not buy only because Saylor bought. He has a different time frame and a different risk level than you.
What do you think. Is this a real signal or just noise. Tell me in the comments.
$BTC
$ANTHROPIC
While BTC is getting pushed down and the market talks about the $ANTHROPIC IPO the biggest corporate holder keeps buying. Saylor is buying the dip.
Think about it. Retail panics in every bloodbath. Big players use the same fear to build their position. That is the difference between emotion and a plan.
A $31 million buy is also small compared to what Strategy holds. It does not mean BTC will go up tomorrow. Do not buy only because Saylor bought. He has a different time frame and a different risk level than you.
What do you think. Is this a real signal or just noise. Tell me in the comments.
$BTC
$ANTHROPIC

2
392
·
--
Sometimes I get crazy when I see someone's whole balance risk in a single Trade.
Have you ever try?
$H
Sometimes I get crazy when I see someone's whole balance risk in a single Trade.
Have you ever try?
$H
Have you ever try?
$H
104
·
--
Bullish
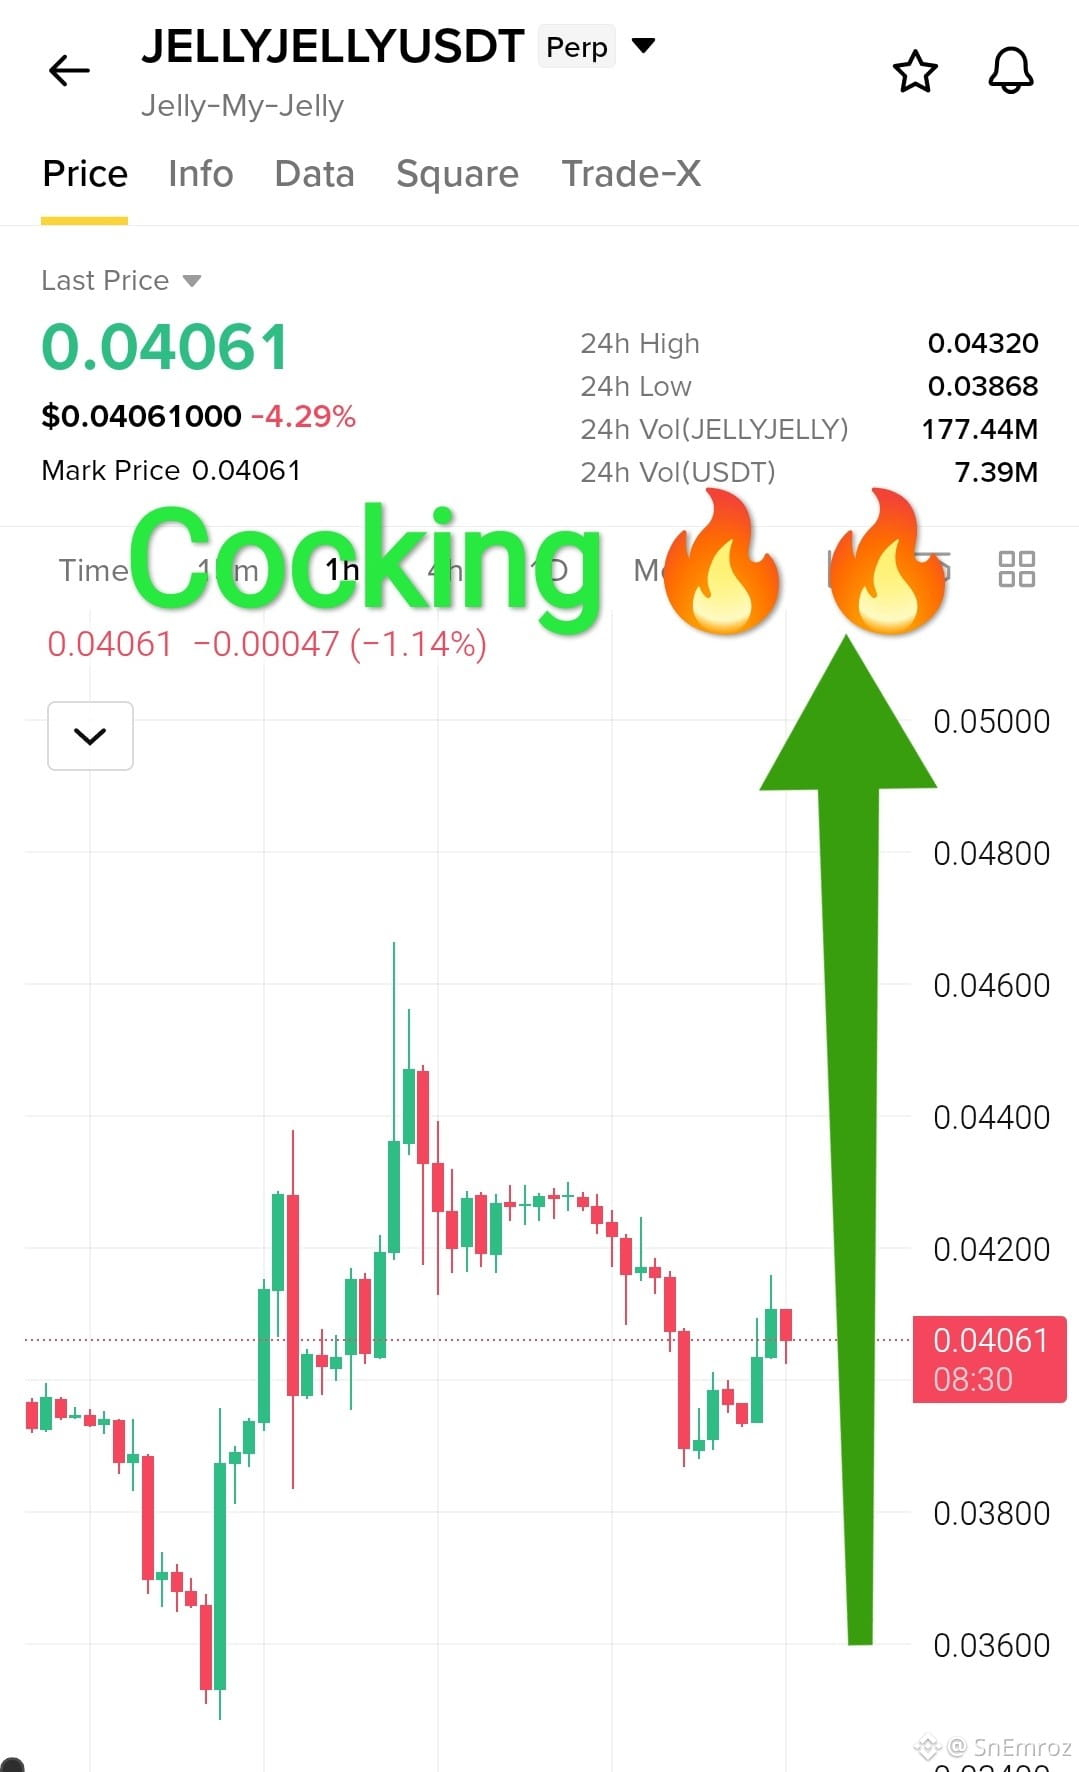
JELLYJELLY is cooking.
Everyone ran away when it dropped. The same people are watching it now and wishing they stayed.
The market does not reward the loudest trader. It rewards the one who stays calm and keeps going when the chart looks ugly.
$JELLYJELLY
{future}(JELLYJELLYUSDT)
Every big move starts quietly. A little higher low. A little more patience. Then one day it flies and the ones who waited with a plan are the ones who smile.
Stay patient. Trust your plan. Protect your capital.
Your time is coming.
JELLYJELLY is cooking.
Everyone ran away when it dropped. The same people are watching it now and wishing they stayed.
The market does not reward the loudest trader. It rewards the one who stays calm and keeps going when the chart looks ugly.
$JELLYJELLY
Every big move starts quietly. A little higher low. A little more patience. Then one day it flies and the ones who waited with a plan are the ones who smile.
Stay patient. Trust your plan. Protect your capital.
Your time is coming.
Everyone ran away when it dropped. The same people are watching it now and wishing they stayed.
The market does not reward the loudest trader. It rewards the one who stays calm and keeps going when the chart looks ugly.
$JELLYJELLY
Every big move starts quietly. A little higher low. A little more patience. Then one day it flies and the ones who waited with a plan are the ones who smile.
Stay patient. Trust your plan. Protect your capital.
Your time is coming.
144
·
--
Bullish
$SUI
{future}(SUIUSDT)
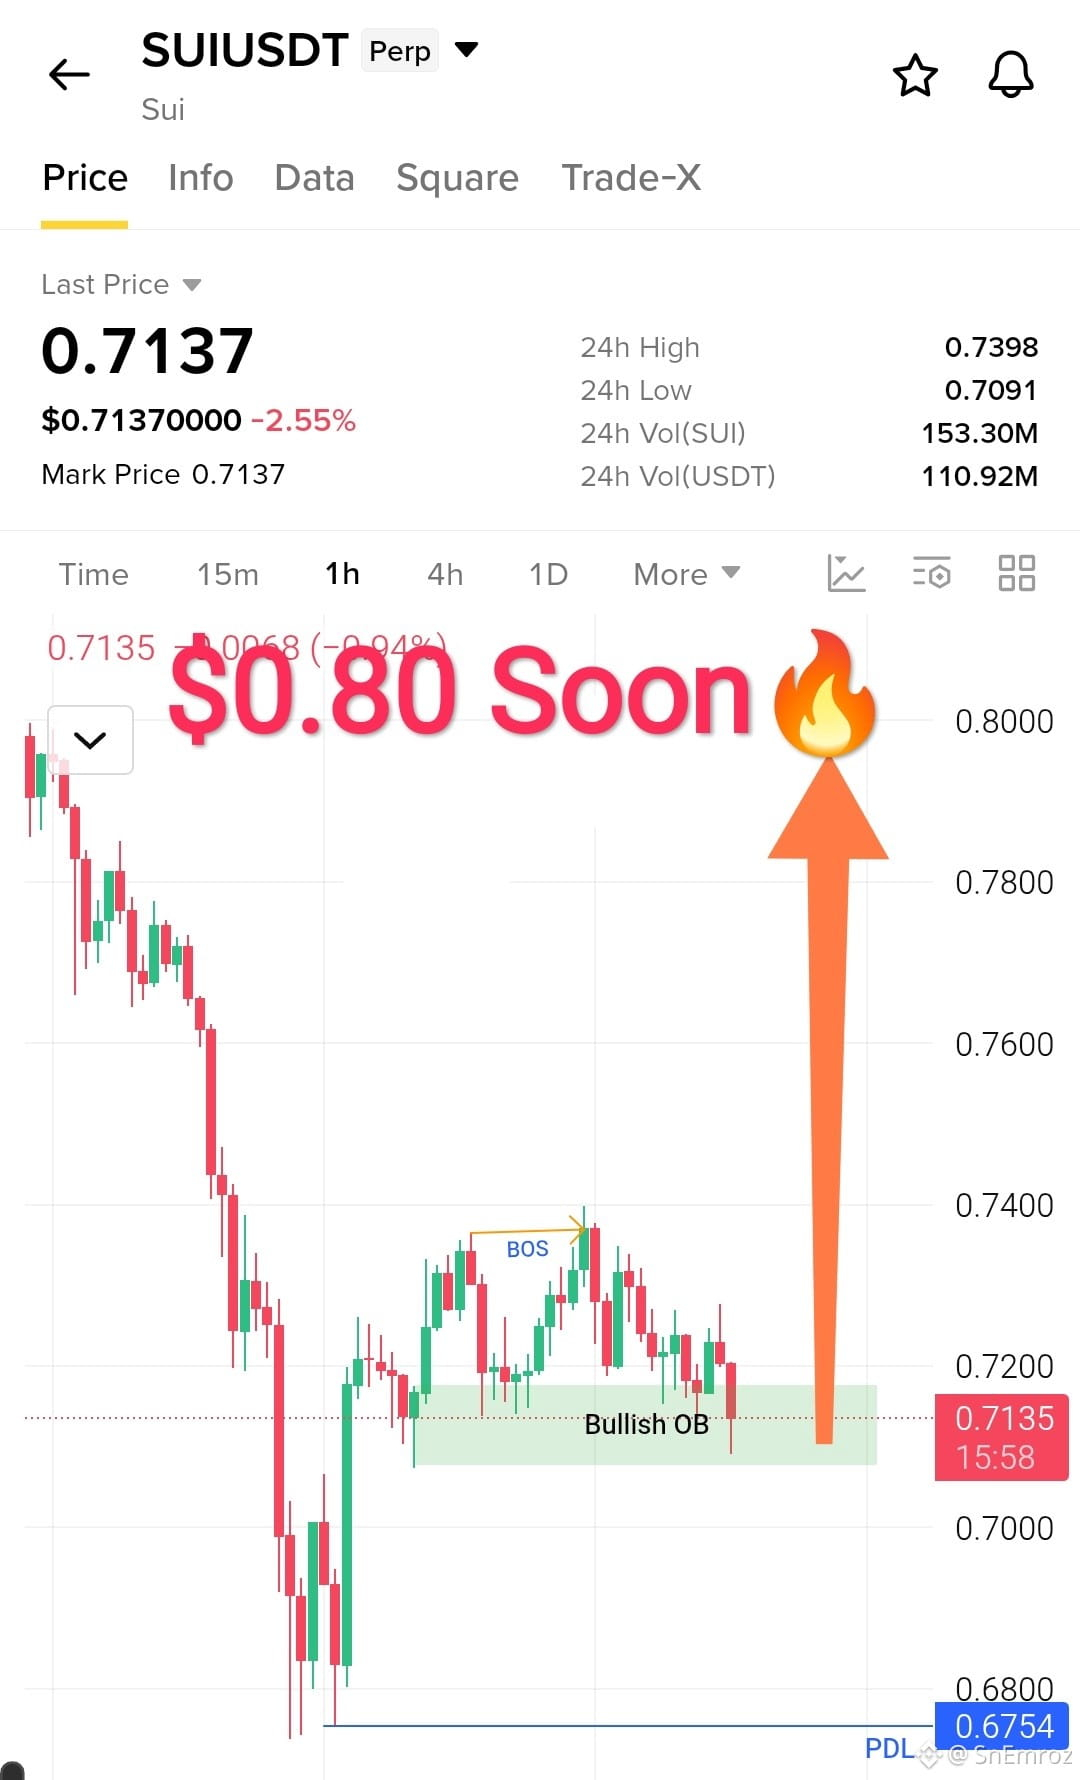
$0.80 soon.
Price is $0.7137 and sitting inside the 1h bullish order block between $0.7080 and $0.7180. Before this price made a BOS to the upside and now it is back to retest the zone. Buyers are stepping in here.
The plan is simple. A 1h close above $0.7400 opens the way to $0.7600 and then $0.80.
#SUİ
$SUI
$0.80 soon.
Price is $0.7137 and sitting inside the 1h bullish order block between $0.7080 and $0.7180. Before this price made a BOS to the upside and now it is back to retest the zone. Buyers are stepping in here.
The plan is simple. A 1h close above $0.7400 opens the way to $0.7600 and then $0.80.
#SUİ
$0.80 soon.
Price is $0.7137 and sitting inside the 1h bullish order block between $0.7080 and $0.7180. Before this price made a BOS to the upside and now it is back to retest the zone. Buyers are stepping in here.
The plan is simple. A 1h close above $0.7400 opens the way to $0.7600 and then $0.80.
#SUİ
1
1k
·
--
Bullish
Another quick one and this time on $JCT
{future}(JCTUSDT)
.
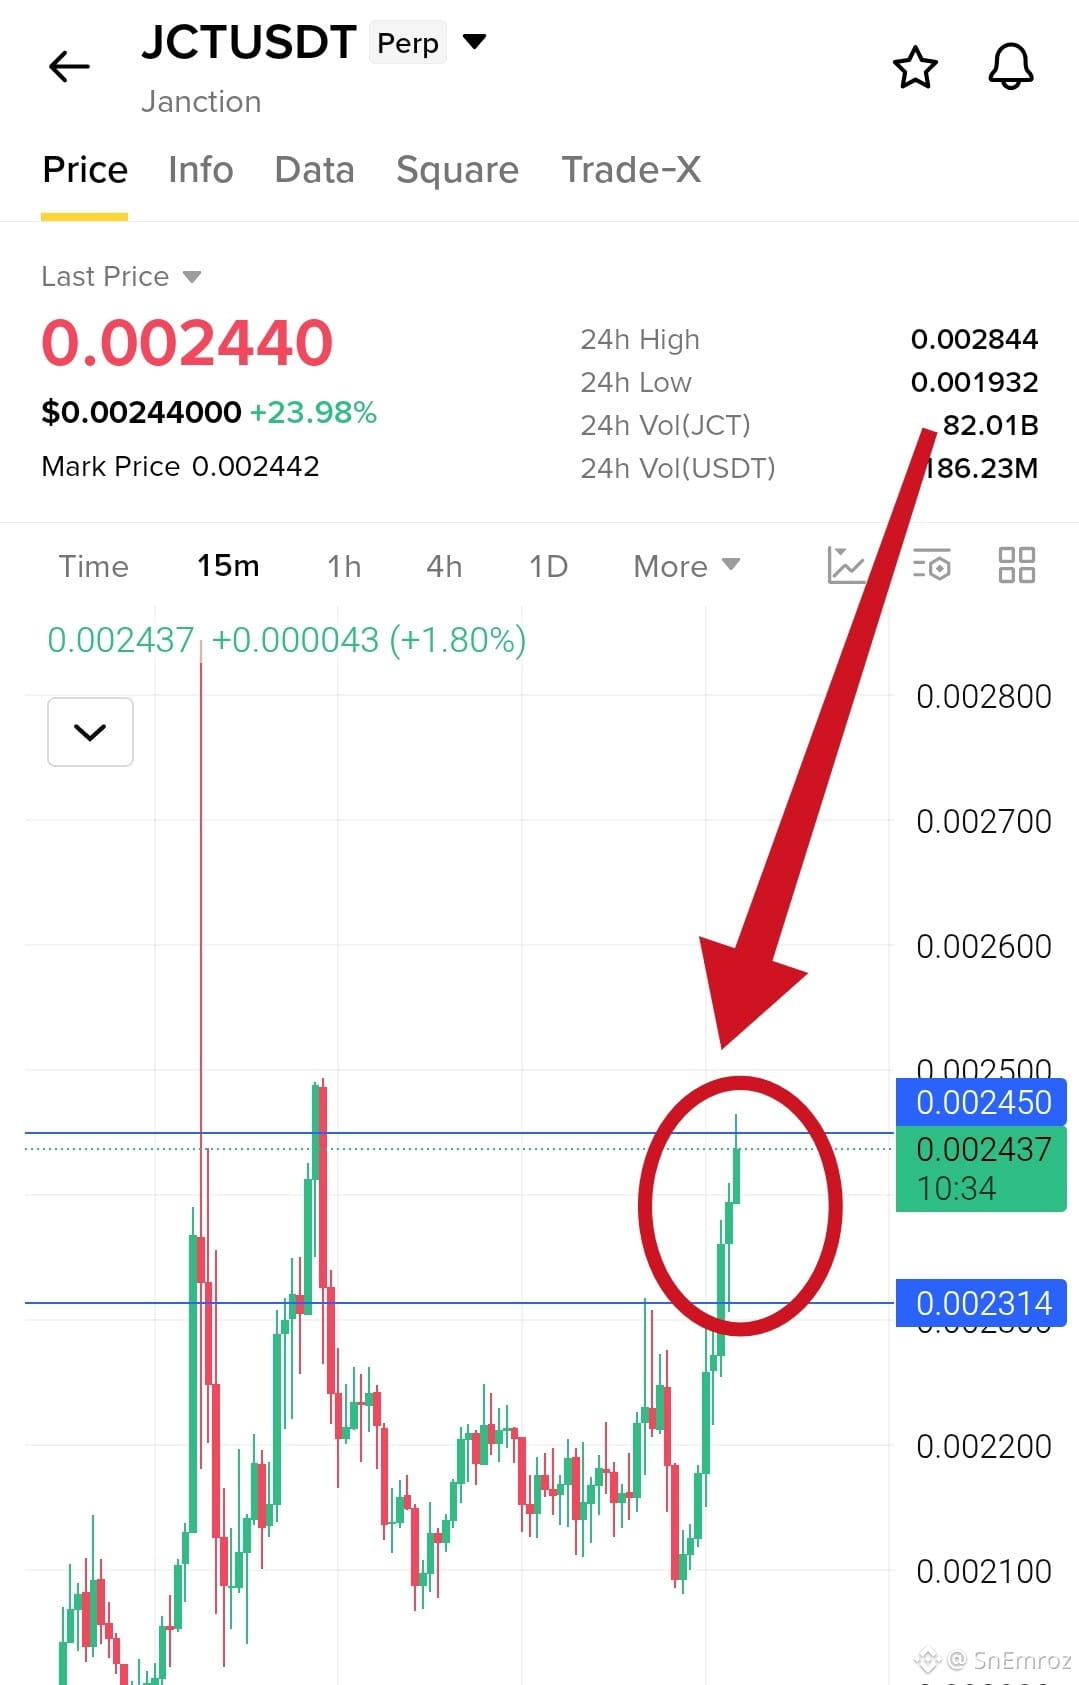
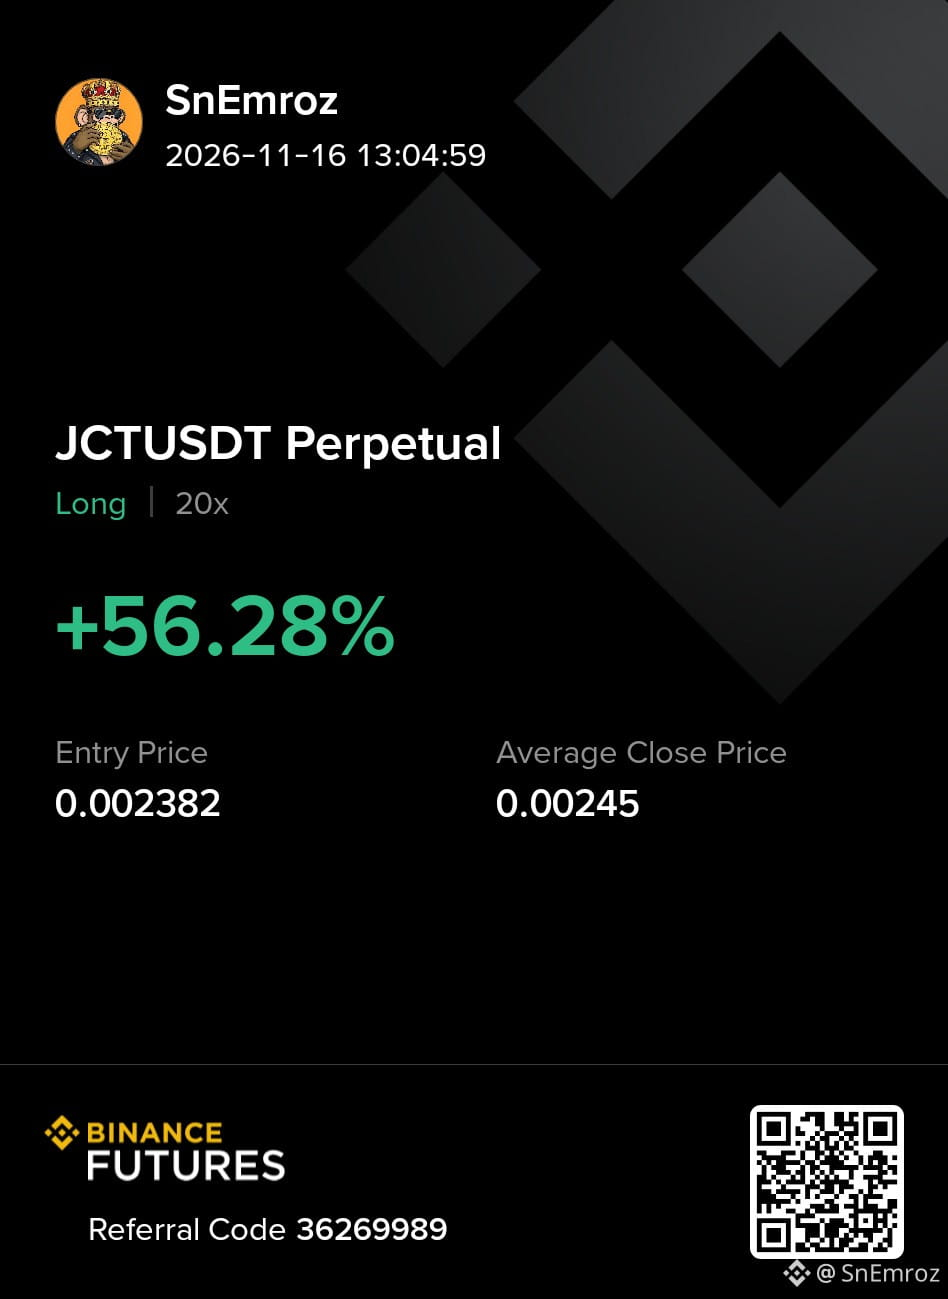
I took the long from $0.002382 and closed at $0.00245. That is only a 2.8% move in price. With 20x leverage it became +56% on the card. This is what a scalp is. A small move and a fast exit.
The chart is the 15m. Price broke above the $0.002314 level and pushed up with strong green candles. I did not wait for the top. The next resistance was the $0.002450 line and I closed right there. The price touched $0.002437 and I was out. A scalp is not about catching the whole move. It is about taking a clean piece and leaving.
Here is what I want you to see. The same 20x that made +56% can also make a big loss on a 2.8% move the other way. Scalping with high leverage only works with a tight stop loss and a fast exit. No stop and no plan and it can wipe you out in a few candles.
3 rules I follow for a scalp. Enter near a level and not in the middle of nowhere. Know my stop before I click. Close at the next resistance and do not get greedy.
Another quick one and this time on $JCT
.
I took the long from $0.002382 and closed at $0.00245. That is only a 2.8% move in price. With 20x leverage it became +56% on the card. This is what a scalp is. A small move and a fast exit.
The chart is the 15m. Price broke above the $0.002314 level and pushed up with strong green candles. I did not wait for the top. The next resistance was the $0.002450 line and I closed right there. The price touched $0.002437 and I was out. A scalp is not about catching the whole move. It is about taking a clean piece and leaving.
Here is what I want you to see. The same 20x that made +56% can also make a big loss on a 2.8% move the other way. Scalping with high leverage only works with a tight stop loss and a fast exit. No stop and no plan and it can wipe you out in a few candles.
3 rules I follow for a scalp. Enter near a level and not in the middle of nowhere. Know my stop before I click. Close at the next resistance and do not get greedy.
.
I took the long from $0.002382 and closed at $0.00245. That is only a 2.8% move in price. With 20x leverage it became +56% on the card. This is what a scalp is. A small move and a fast exit.
The chart is the 15m. Price broke above the $0.002314 level and pushed up with strong green candles. I did not wait for the top. The next resistance was the $0.002450 line and I closed right there. The price touched $0.002437 and I was out. A scalp is not about catching the whole move. It is about taking a clean piece and leaving.
Here is what I want you to see. The same 20x that made +56% can also make a big loss on a 2.8% move the other way. Scalping with high leverage only works with a tight stop loss and a fast exit. No stop and no plan and it can wipe you out in a few candles.
3 rules I follow for a scalp. Enter near a level and not in the middle of nowhere. Know my stop before I click. Close at the next resistance and do not get greedy.
2
599
·
--
Bearish
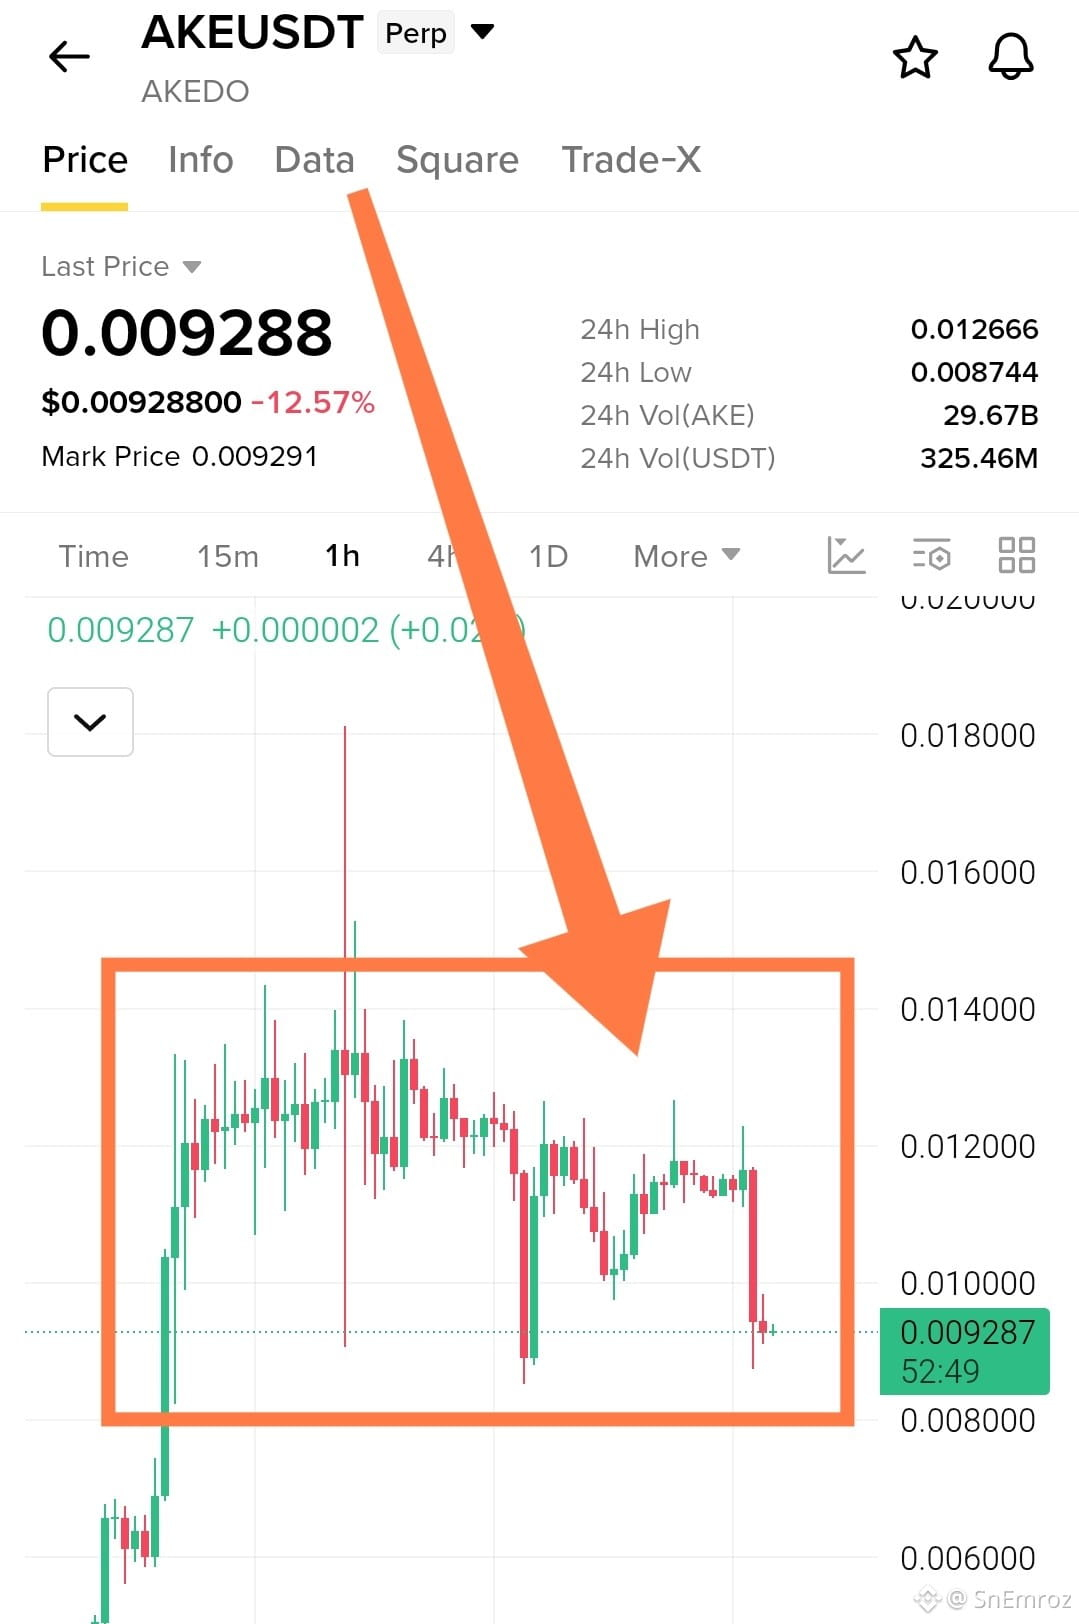
Although I am in position my eyes are still looking for BOS in this chart.
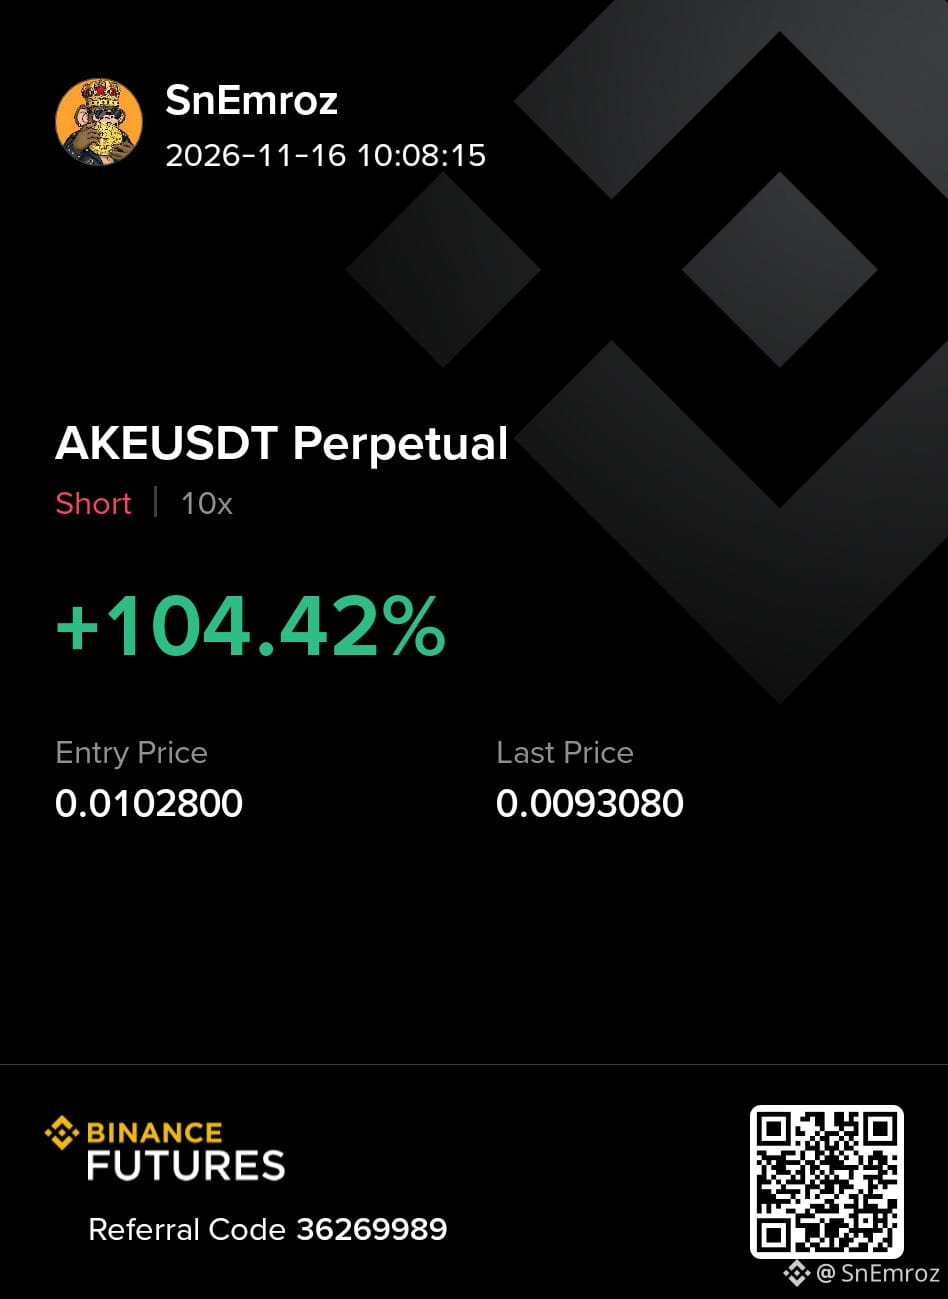
I am short from $0.0102800 and price is now $0.0093080. That is around +104% on 10x. Nice. But a profit on the screen is not a reason to relax. The market does not care about my entry.
You open trade with me by click Here 👇👇🥹
{future}(AKEUSDT)
Price dropped about 12% on the day and the last 1h candle was a heavy red one from $0.0117 down to $0.0093. After that we see only small candles and a tiny bounce. That is a pause and not a trend change. The market is still making lower highs and lower lows. The 24h low is $0.008744 and price is sitting close to it.
So what am I watching. I want to see a bearish BOS on the 1h. That means a 1h close below $0.0087 which is the 24h low. A wick below it is not enough. I need the candle to close below. That tells me sellers are still in control and the move can continue to the next demand zone near $0.0080.
If price does not break $0.0087 and starts to bounce then the short slows down. A 1h close above $0.0117 which is the top of the big red candle would show buyers are back. In that case the short has no more edge and I close.
#AKE
Although I am in position my eyes are still looking for BOS in this chart.
I am short from $0.0102800 and price is now $0.0093080. That is around +104% on 10x. Nice. But a profit on the screen is not a reason to relax. The market does not care about my entry.
You open trade with me by click Here 👇👇🥹
Price dropped about 12% on the day and the last 1h candle was a heavy red one from $0.0117 down to $0.0093. After that we see only small candles and a tiny bounce. That is a pause and not a trend change. The market is still making lower highs and lower lows. The 24h low is $0.008744 and price is sitting close to it.
So what am I watching. I want to see a bearish BOS on the 1h. That means a 1h close below $0.0087 which is the 24h low. A wick below it is not enough. I need the candle to close below. That tells me sellers are still in control and the move can continue to the next demand zone near $0.0080.
If price does not break $0.0087 and starts to bounce then the short slows down. A 1h close above $0.0117 which is the top of the big red candle would show buyers are back. In that case the short has no more edge and I close.
#AKE
I am short from $0.0102800 and price is now $0.0093080. That is around +104% on 10x. Nice. But a profit on the screen is not a reason to relax. The market does not care about my entry.
You open trade with me by click Here 👇👇🥹
Price dropped about 12% on the day and the last 1h candle was a heavy red one from $0.0117 down to $0.0093. After that we see only small candles and a tiny bounce. That is a pause and not a trend change. The market is still making lower highs and lower lows. The 24h low is $0.008744 and price is sitting close to it.
So what am I watching. I want to see a bearish BOS on the 1h. That means a 1h close below $0.0087 which is the 24h low. A wick below it is not enough. I need the candle to close below. That tells me sellers are still in control and the move can continue to the next demand zone near $0.0080.
If price does not break $0.0087 and starts to bounce then the short slows down. A 1h close above $0.0117 which is the top of the big red candle would show buyers are back. In that case the short has no more edge and I close.
#AKE
1
1
1.7k
·
--
Bearish
Everyone can open a trade and make profit. But how many people keep the profit. At the end of the day they lose the entire capital along with the profit. Because of mindset.
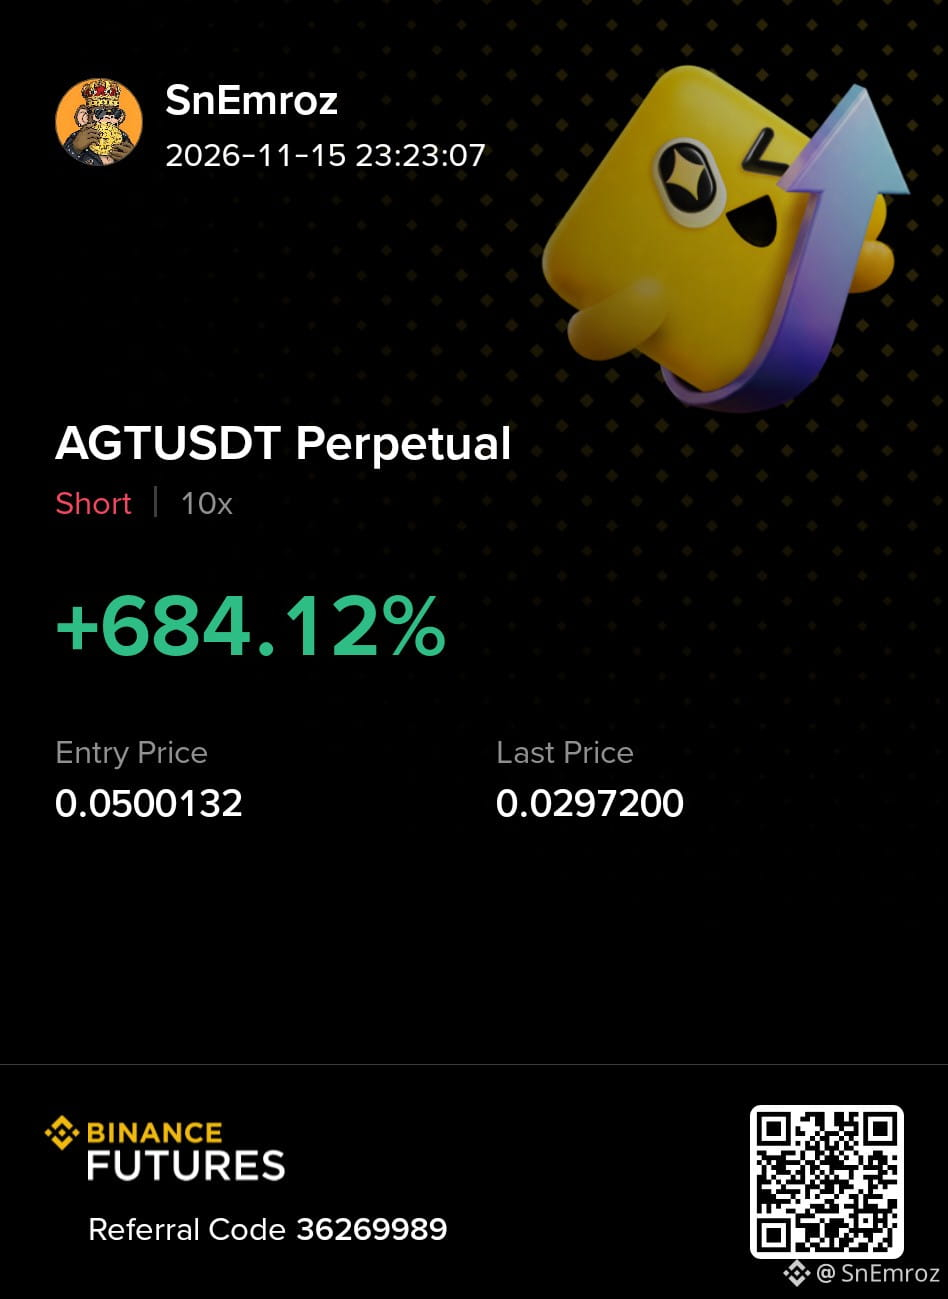
This AGT short gave me +684% on 10x. Entry was 0.0500132 and price is now at 0.0297200. Looks great on the screen. But the screen does not show the real work.
{future}(AGTUSDT)
The real work is what you do after the profit shows up. Most traders see green and think it will go on forever. They do not take profit. They do not move the stop loss to breakeven. They add more size because they feel unstoppable. Then one reversal candle and everything goes back to the market.
Profit on the screen is not your profit until you close it. I plan the exit before I plan the entry. I take profit in parts and I protect the rest with my stop loss. A small profit in my hand is better than a big profit I gave back.
Greed is the one thing that turns a winning trade into a loss. A good strategy cannot save a trader with a weak mindset.
Tell me in the comments. Did you ever have a big profit and lose it all back. Share your story. I read every comment.
Everyone can open a trade and make profit. But how many people keep the profit. At the end of the day they lose the entire capital along with the profit. Because of mindset.
This AGT short gave me +684% on 10x. Entry was 0.0500132 and price is now at 0.0297200. Looks great on the screen. But the screen does not show the real work.
The real work is what you do after the profit shows up. Most traders see green and think it will go on forever. They do not take profit. They do not move the stop loss to breakeven. They add more size because they feel unstoppable. Then one reversal candle and everything goes back to the market.
Profit on the screen is not your profit until you close it. I plan the exit before I plan the entry. I take profit in parts and I protect the rest with my stop loss. A small profit in my hand is better than a big profit I gave back.
Greed is the one thing that turns a winning trade into a loss. A good strategy cannot save a trader with a weak mindset.
Tell me in the comments. Did you ever have a big profit and lose it all back. Share your story. I read every comment.
This AGT short gave me +684% on 10x. Entry was 0.0500132 and price is now at 0.0297200. Looks great on the screen. But the screen does not show the real work.
The real work is what you do after the profit shows up. Most traders see green and think it will go on forever. They do not take profit. They do not move the stop loss to breakeven. They add more size because they feel unstoppable. Then one reversal candle and everything goes back to the market.
Profit on the screen is not your profit until you close it. I plan the exit before I plan the entry. I take profit in parts and I protect the rest with my stop loss. A small profit in my hand is better than a big profit I gave back.
Greed is the one thing that turns a winning trade into a loss. A good strategy cannot save a trader with a weak mindset.
Tell me in the comments. Did you ever have a big profit and lose it all back. Share your story. I read every comment.
2
690
·
--
Bullish
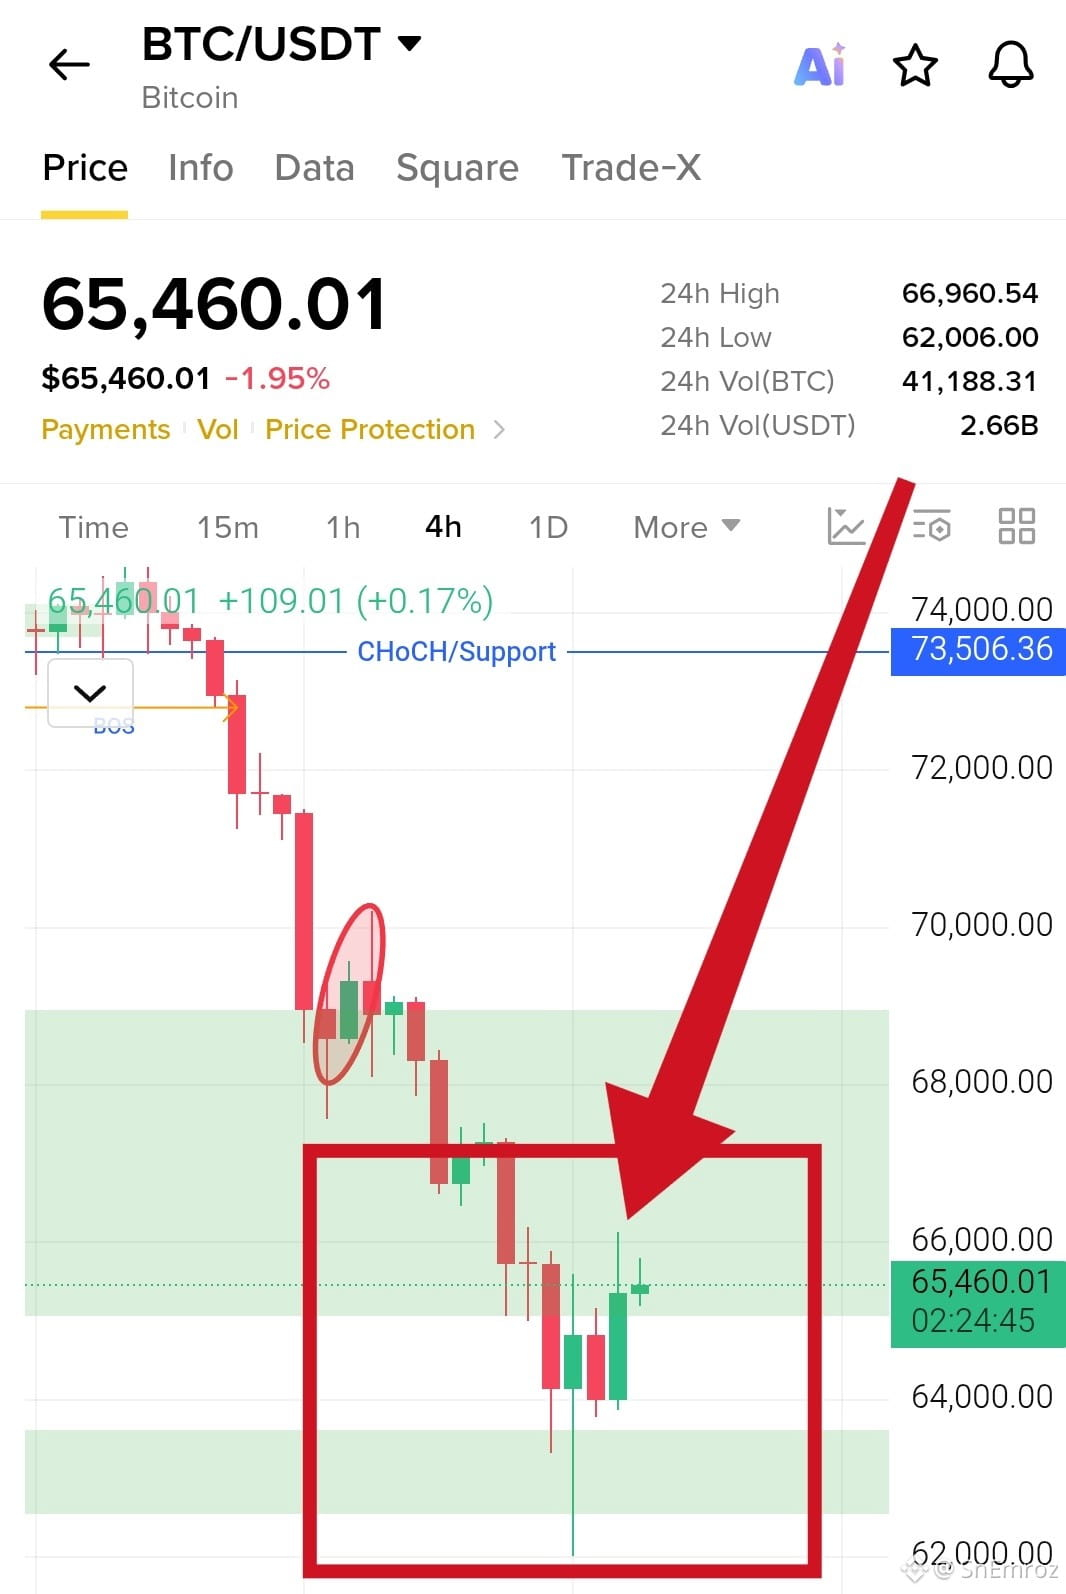
$BTC liquidity sweep looks confirmed and the market is getting ready for the next wave.
Price now is $65460. After the bloodbath from the $73500 area price kept dropping with strong red candles. Then it dipped to $62006 and took out the stops below the last lows. Price came back fast and left a long wick. Buyers also defended the demand zone near $62500 to $63600. After that we got higher 4h candles and the 24h high is $66960.
{future}(BTCUSDT)
This is the sweep I was waiting for. But the trend is still down until price breaks the structure above. The market is still inside the fair value gap that runs from $65000 up to $68900. That is the area where sellers can come back.
Price holds above $65000 and gives a 4h close above $66960. Then the next target is $68900 at the top of the gap. A 4h close above $68900 opens the way to $70000 and later the $73500 support turned resistance.
Price loses $65000 and closes below it on the 4h. Then buyers lose the first defense and price can retest the sweep low near $62000. If that breaks the next wave down can start fast.
#EarningsSeason #BTC
$BTC liquidity sweep looks confirmed and the market is getting ready for the next wave.
Price now is $65460. After the bloodbath from the $73500 area price kept dropping with strong red candles. Then it dipped to $62006 and took out the stops below the last lows. Price came back fast and left a long wick. Buyers also defended the demand zone near $62500 to $63600. After that we got higher 4h candles and the 24h high is $66960.
This is the sweep I was waiting for. But the trend is still down until price breaks the structure above. The market is still inside the fair value gap that runs from $65000 up to $68900. That is the area where sellers can come back.
Price holds above $65000 and gives a 4h close above $66960. Then the next target is $68900 at the top of the gap. A 4h close above $68900 opens the way to $70000 and later the $73500 support turned resistance.
Price loses $65000 and closes below it on the 4h. Then buyers lose the first defense and price can retest the sweep low near $62000. If that breaks the next wave down can start fast.
#EarningsSeason #BTC
Price now is $65460. After the bloodbath from the $73500 area price kept dropping with strong red candles. Then it dipped to $62006 and took out the stops below the last lows. Price came back fast and left a long wick. Buyers also defended the demand zone near $62500 to $63600. After that we got higher 4h candles and the 24h high is $66960.
This is the sweep I was waiting for. But the trend is still down until price breaks the structure above. The market is still inside the fair value gap that runs from $65000 up to $68900. That is the area where sellers can come back.
Price holds above $65000 and gives a 4h close above $66960. Then the next target is $68900 at the top of the gap. A 4h close above $68900 opens the way to $70000 and later the $73500 support turned resistance.
Price loses $65000 and closes below it on the 4h. Then buyers lose the first defense and price can retest the sweep low near $62000. If that breaks the next wave down can start fast.
#EarningsSeason #BTC
416
·
--
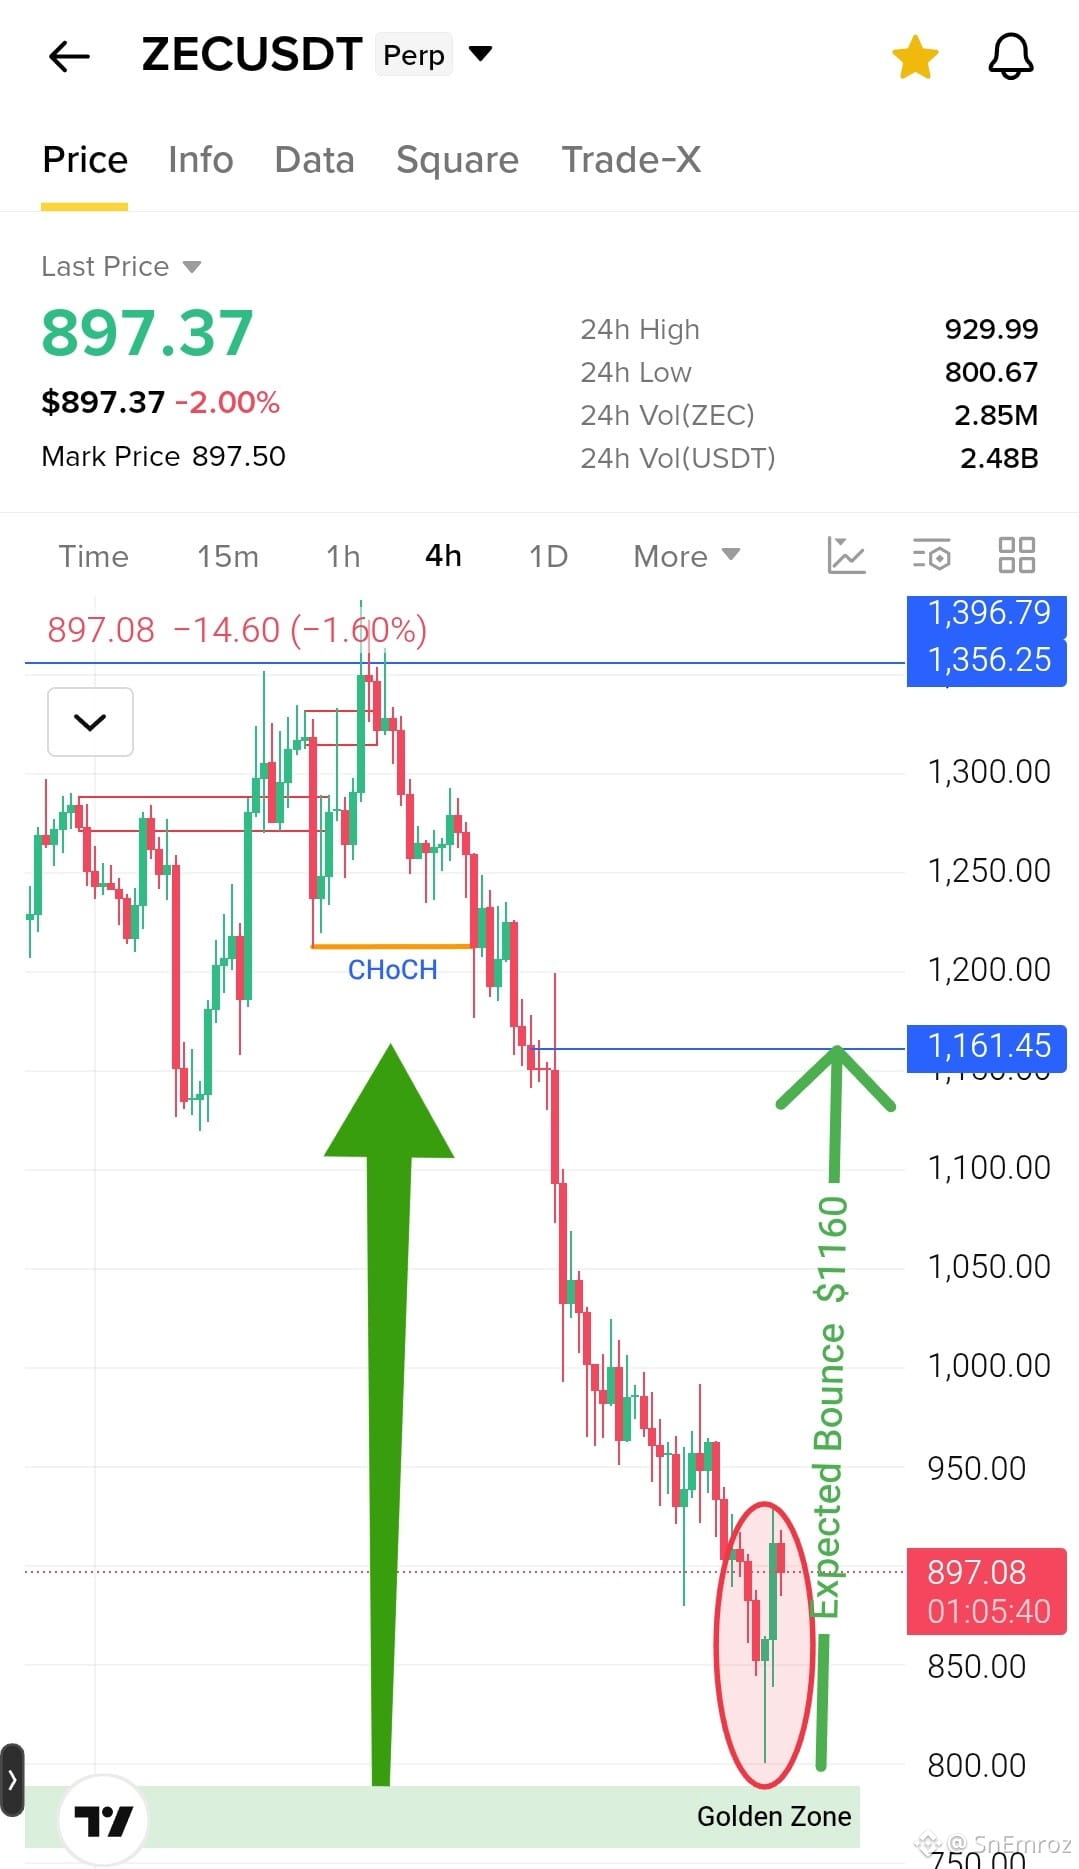
$ZEC just swept the liquidity below and I expect a bounce from here.
Price now is $897. After the bloodbath from the $1356 area price kept making lower highs and lower lows for days. Then price dropped to $800 and took out the stops below the last lows. It bounced back fast and left a long wick on the 4h candle. This is a classic liquidity sweep. Sellers got in late and buyers took the other side.
$ZEC
{future}(ZECUSDT)
Right now price is holding above $850 and the 24h high is $930. That is the first level buyers need to break. Under us the golden zone sits at $787 to $759. That is the deeper support if the sweep fails.
Bullish scenario. Price holds above $800 and gives a 4h close above $930. Then the next area is $1000. A 4h close above $1000 opens the way to the bigger target at $1160. That is the area where price broke down before and I mark it as the expected bounce target.
Bearish scenario. Price loses $800 and closes below it on the 4h. Then the sweep was not a bottom and price can drop into the golden zone at $787 to $759.
For now the sweep is done and buyers are showing up. A bounce is the likely path but the trend is still down so I treat it as a bounce and not a trend change. I wait for the 4h close above $930 to confirm.
$ZEC just swept the liquidity below and I expect a bounce from here.
Price now is $897. After the bloodbath from the $1356 area price kept making lower highs and lower lows for days. Then price dropped to $800 and took out the stops below the last lows. It bounced back fast and left a long wick on the 4h candle. This is a classic liquidity sweep. Sellers got in late and buyers took the other side.
$ZEC
Right now price is holding above $850 and the 24h high is $930. That is the first level buyers need to break. Under us the golden zone sits at $787 to $759. That is the deeper support if the sweep fails.
Bullish scenario. Price holds above $800 and gives a 4h close above $930. Then the next area is $1000. A 4h close above $1000 opens the way to the bigger target at $1160. That is the area where price broke down before and I mark it as the expected bounce target.
Bearish scenario. Price loses $800 and closes below it on the 4h. Then the sweep was not a bottom and price can drop into the golden zone at $787 to $759.
For now the sweep is done and buyers are showing up. A bounce is the likely path but the trend is still down so I treat it as a bounce and not a trend change. I wait for the 4h close above $930 to confirm.
Price now is $897. After the bloodbath from the $1356 area price kept making lower highs and lower lows for days. Then price dropped to $800 and took out the stops below the last lows. It bounced back fast and left a long wick on the 4h candle. This is a classic liquidity sweep. Sellers got in late and buyers took the other side.
$ZEC
Right now price is holding above $850 and the 24h high is $930. That is the first level buyers need to break. Under us the golden zone sits at $787 to $759. That is the deeper support if the sweep fails.
Bullish scenario. Price holds above $800 and gives a 4h close above $930. Then the next area is $1000. A 4h close above $1000 opens the way to the bigger target at $1160. That is the area where price broke down before and I mark it as the expected bounce target.
Bearish scenario. Price loses $800 and closes below it on the 4h. Then the sweep was not a bottom and price can drop into the golden zone at $787 to $759.
For now the sweep is done and buyers are showing up. A bounce is the likely path but the trend is still down so I treat it as a bounce and not a trend change. I wait for the 4h close above $930 to confirm.
1
731
·
--
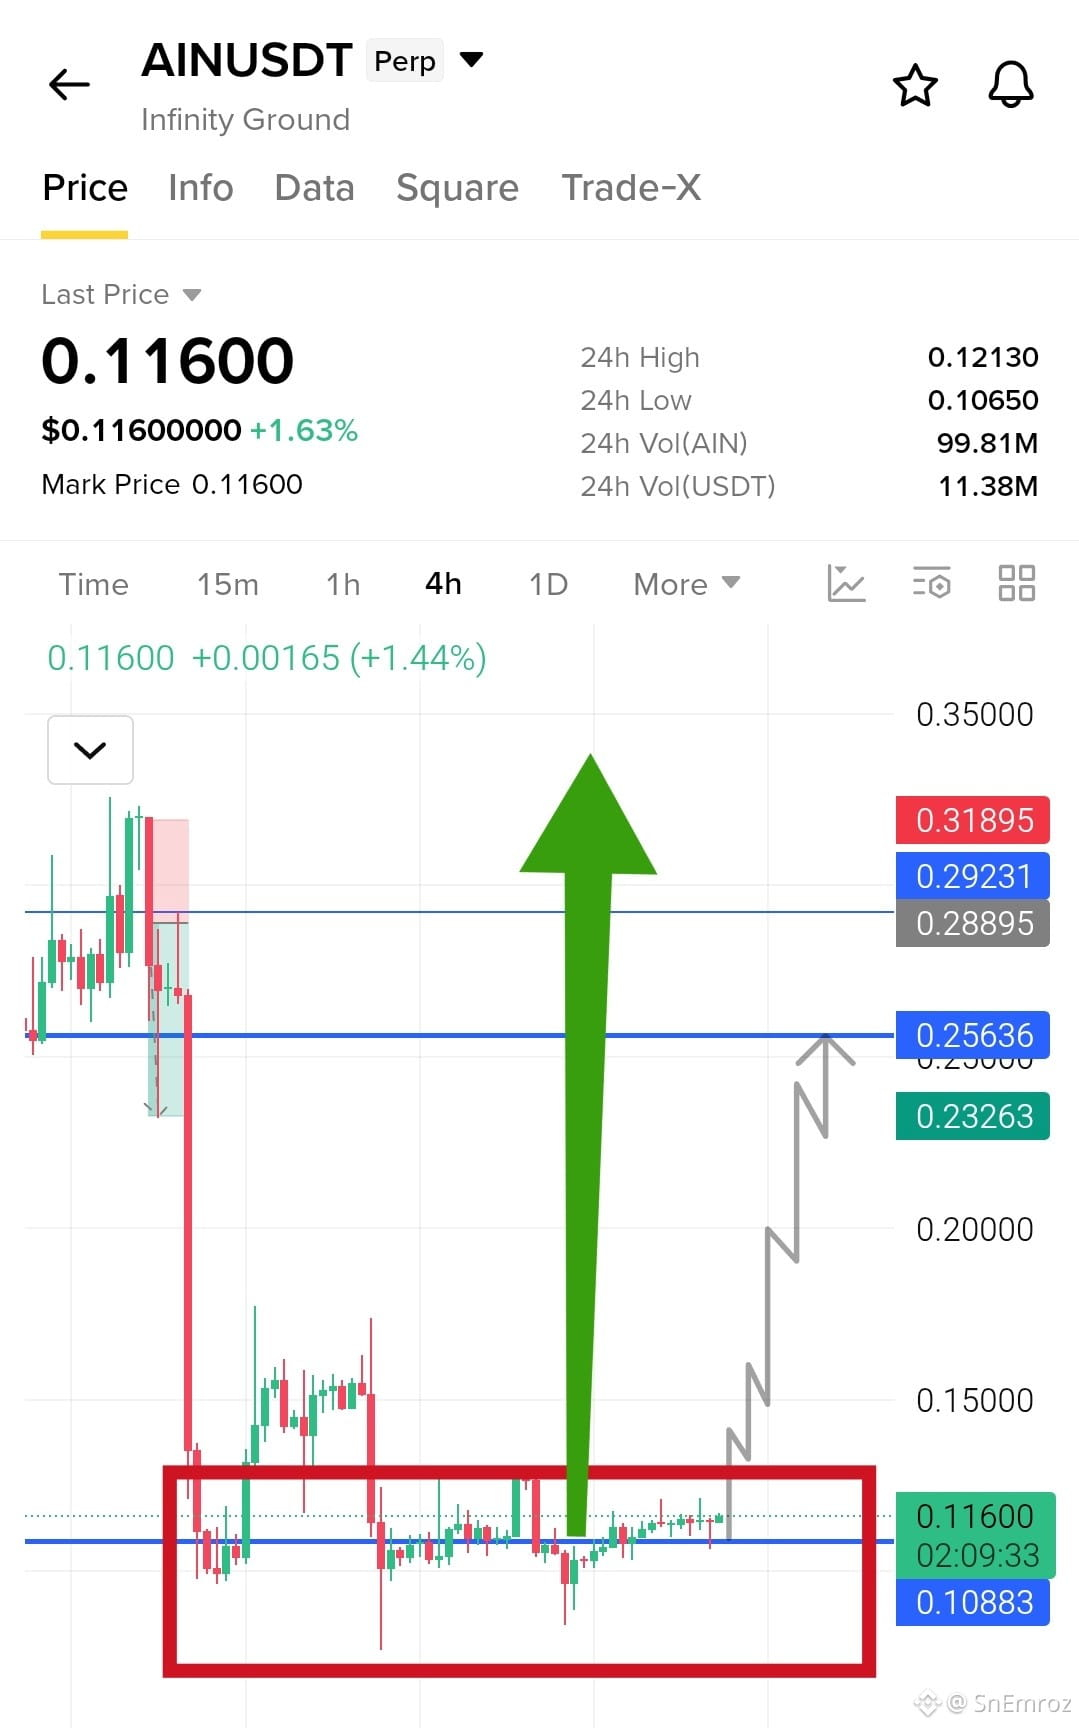
$AIN Bottom looks confirmed and AIN is getting ready to fly.
Price now is $0.1160 and up around 1.6% on the day. After the huge bloodbath from the $0.29 area price made a hard bottom and has been moving sideways for a long time. Sellers tried to push it lower many times and every time buyers bought back. The last 4h candles are small and higher and price is holding above the support line near $0.1088. That is a sign selling pressure is drying up.
{future}(AINUSDT)
The range is roughly $0.1065 to $0.1270. Above it the first resistance is $0.1500. After that the next areas are $0.2000 and $0.2326. The bigger target is the $0.2564 line where price broke down from.
Bullish scenario. Price holds $0.1088 and gives a 4h close above $0.1270. Then $0.1500 is the first target. A 4h close above $0.1500 opens the way to $0.2000 and higher.
Bearish scenario. Price loses $0.1065 and closes below it on the 4h. Then the base fails and price can go back to the wick low near $0.0775.
For now buyers are in control of the base and price is building pressure under the range top. I wait for the 4h close above $0.1270 as confirmation and not guess the breakout.
$AIN Bottom looks confirmed and AIN is getting ready to fly.
Price now is $0.1160 and up around 1.6% on the day. After the huge bloodbath from the $0.29 area price made a hard bottom and has been moving sideways for a long time. Sellers tried to push it lower many times and every time buyers bought back. The last 4h candles are small and higher and price is holding above the support line near $0.1088. That is a sign selling pressure is drying up.
The range is roughly $0.1065 to $0.1270. Above it the first resistance is $0.1500. After that the next areas are $0.2000 and $0.2326. The bigger target is the $0.2564 line where price broke down from.
Bullish scenario. Price holds $0.1088 and gives a 4h close above $0.1270. Then $0.1500 is the first target. A 4h close above $0.1500 opens the way to $0.2000 and higher.
Bearish scenario. Price loses $0.1065 and closes below it on the 4h. Then the base fails and price can go back to the wick low near $0.0775.
For now buyers are in control of the base and price is building pressure under the range top. I wait for the 4h close above $0.1270 as confirmation and not guess the breakout.
Price now is $0.1160 and up around 1.6% on the day. After the huge bloodbath from the $0.29 area price made a hard bottom and has been moving sideways for a long time. Sellers tried to push it lower many times and every time buyers bought back. The last 4h candles are small and higher and price is holding above the support line near $0.1088. That is a sign selling pressure is drying up.
The range is roughly $0.1065 to $0.1270. Above it the first resistance is $0.1500. After that the next areas are $0.2000 and $0.2326. The bigger target is the $0.2564 line where price broke down from.
Bullish scenario. Price holds $0.1088 and gives a 4h close above $0.1270. Then $0.1500 is the first target. A 4h close above $0.1500 opens the way to $0.2000 and higher.
Bearish scenario. Price loses $0.1065 and closes below it on the 4h. Then the base fails and price can go back to the wick low near $0.0775.
For now buyers are in control of the base and price is building pressure under the range top. I wait for the 4h close above $0.1270 as confirmation and not guess the breakout.
912
·
--
Bullish
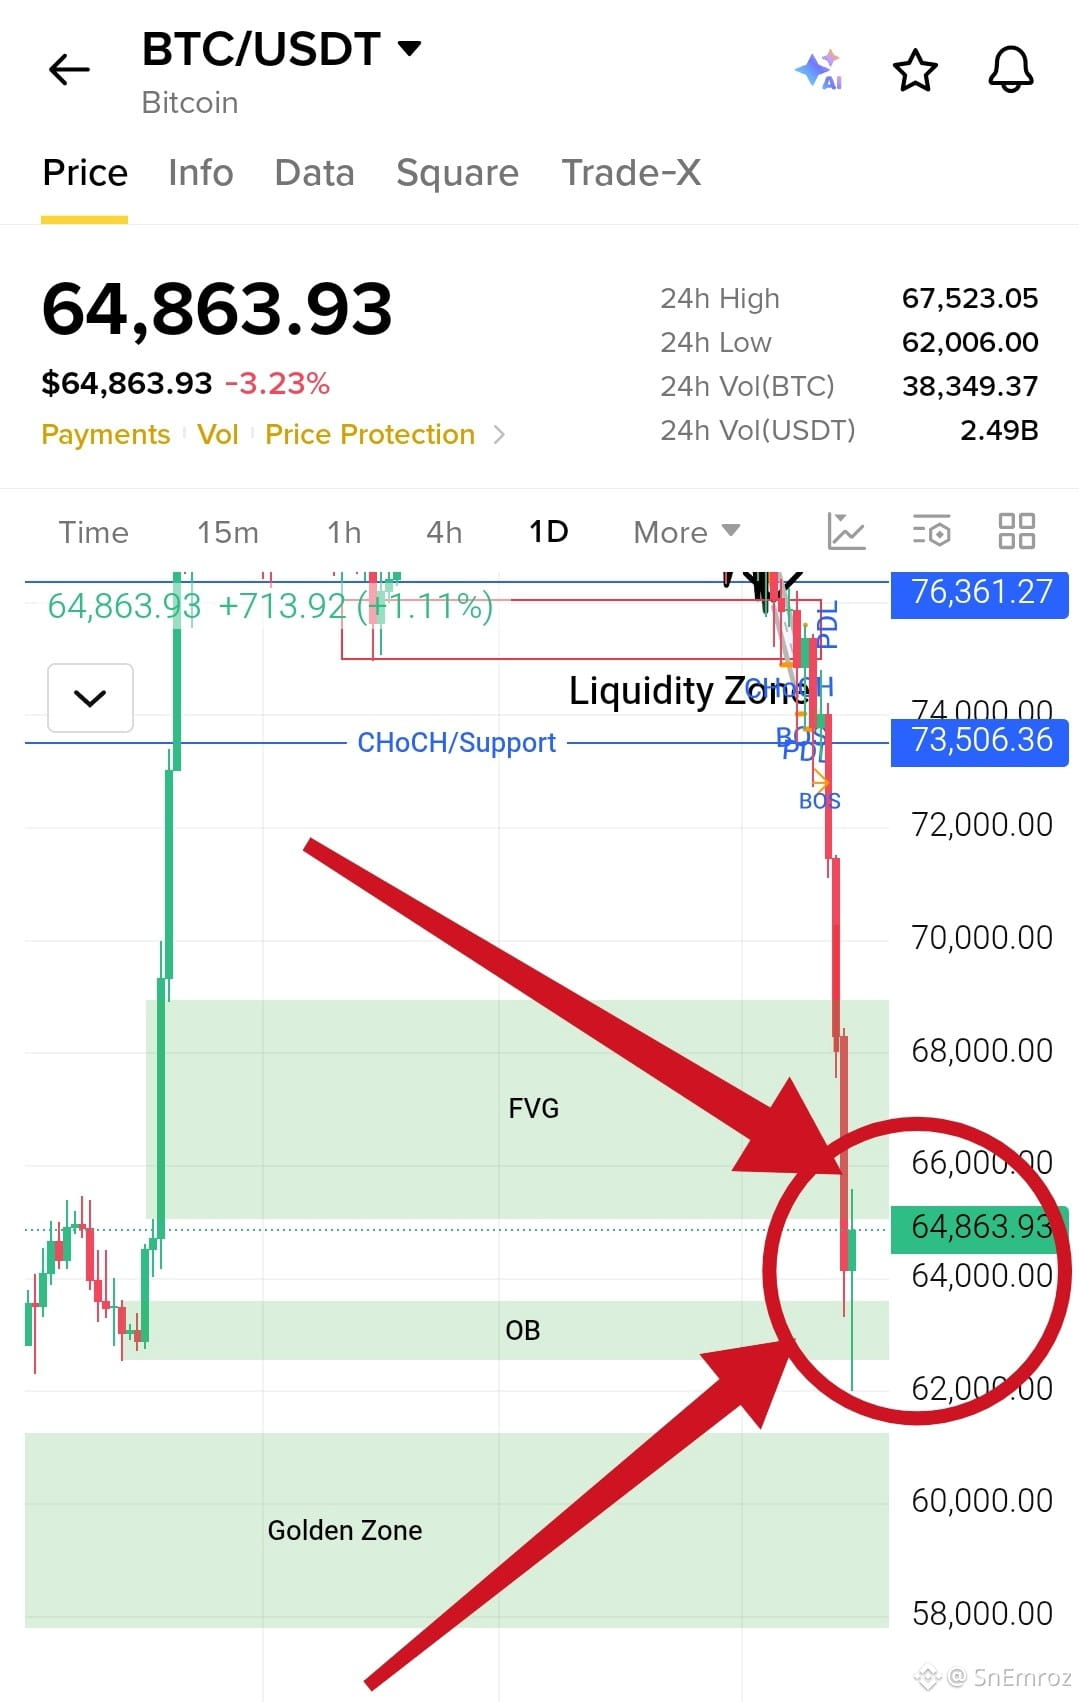
Before the bloodbath some people tried to catch the falling knife. And now they get a little bit of treatment.
Price now is $64864. The daily candle swept down to $62006 and bounced back with a long wick. That wick tells us buyers stepped in at the daily order block around $62500 to $63500. The bounce is about 1% on the daily candle. That is small compared to the full drop from the $73500 area.
Do not get too excited yet. The structure is still bearish. The drop broke the support near $73500 and price made lower highs and lower lows. The bounce is only a relief move so far.
Above us there is a fair value gap between $65000 and $68900. Price can go up into it and sellers can come back strong. That is the first big test for any bounce. A daily close above $68900 would be the first sign that buyers are really taking control.
Bearish scenario. Price fails to hold $62500 and closes below it on the daily. Then the next area is the golden zone at $61200 to $57700. This is where I expect the next big reaction.
$BTC
{future}(BTCUSDT)
Bullish scenario. Price holds above $62500 and keeps closing higher. Then the move can go to $65000 and the fair value gap up to $68900. Above that the next area is $73500.
For now this is a bounce inside a bearish trend. Catching a falling knife can work but it can also cut your hand. I wait for the daily close and let the market show its hand.
Before the bloodbath some people tried to catch the falling knife. And now they get a little bit of treatment.
Price now is $64864. The daily candle swept down to $62006 and bounced back with a long wick. That wick tells us buyers stepped in at the daily order block around $62500 to $63500. The bounce is about 1% on the daily candle. That is small compared to the full drop from the $73500 area.
Do not get too excited yet. The structure is still bearish. The drop broke the support near $73500 and price made lower highs and lower lows. The bounce is only a relief move so far.
Above us there is a fair value gap between $65000 and $68900. Price can go up into it and sellers can come back strong. That is the first big test for any bounce. A daily close above $68900 would be the first sign that buyers are really taking control.
Bearish scenario. Price fails to hold $62500 and closes below it on the daily. Then the next area is the golden zone at $61200 to $57700. This is where I expect the next big reaction.
$BTC
Bullish scenario. Price holds above $62500 and keeps closing higher. Then the move can go to $65000 and the fair value gap up to $68900. Above that the next area is $73500.
For now this is a bounce inside a bearish trend. Catching a falling knife can work but it can also cut your hand. I wait for the daily close and let the market show its hand.
Price now is $64864. The daily candle swept down to $62006 and bounced back with a long wick. That wick tells us buyers stepped in at the daily order block around $62500 to $63500. The bounce is about 1% on the daily candle. That is small compared to the full drop from the $73500 area.
Do not get too excited yet. The structure is still bearish. The drop broke the support near $73500 and price made lower highs and lower lows. The bounce is only a relief move so far.
Above us there is a fair value gap between $65000 and $68900. Price can go up into it and sellers can come back strong. That is the first big test for any bounce. A daily close above $68900 would be the first sign that buyers are really taking control.
Bearish scenario. Price fails to hold $62500 and closes below it on the daily. Then the next area is the golden zone at $61200 to $57700. This is where I expect the next big reaction.
$BTC
Bullish scenario. Price holds above $62500 and keeps closing higher. Then the move can go to $65000 and the fair value gap up to $68900. Above that the next area is $73500.
For now this is a bounce inside a bearish trend. Catching a falling knife can work but it can also cut your hand. I wait for the daily close and let the market show its hand.
1
470
·
--
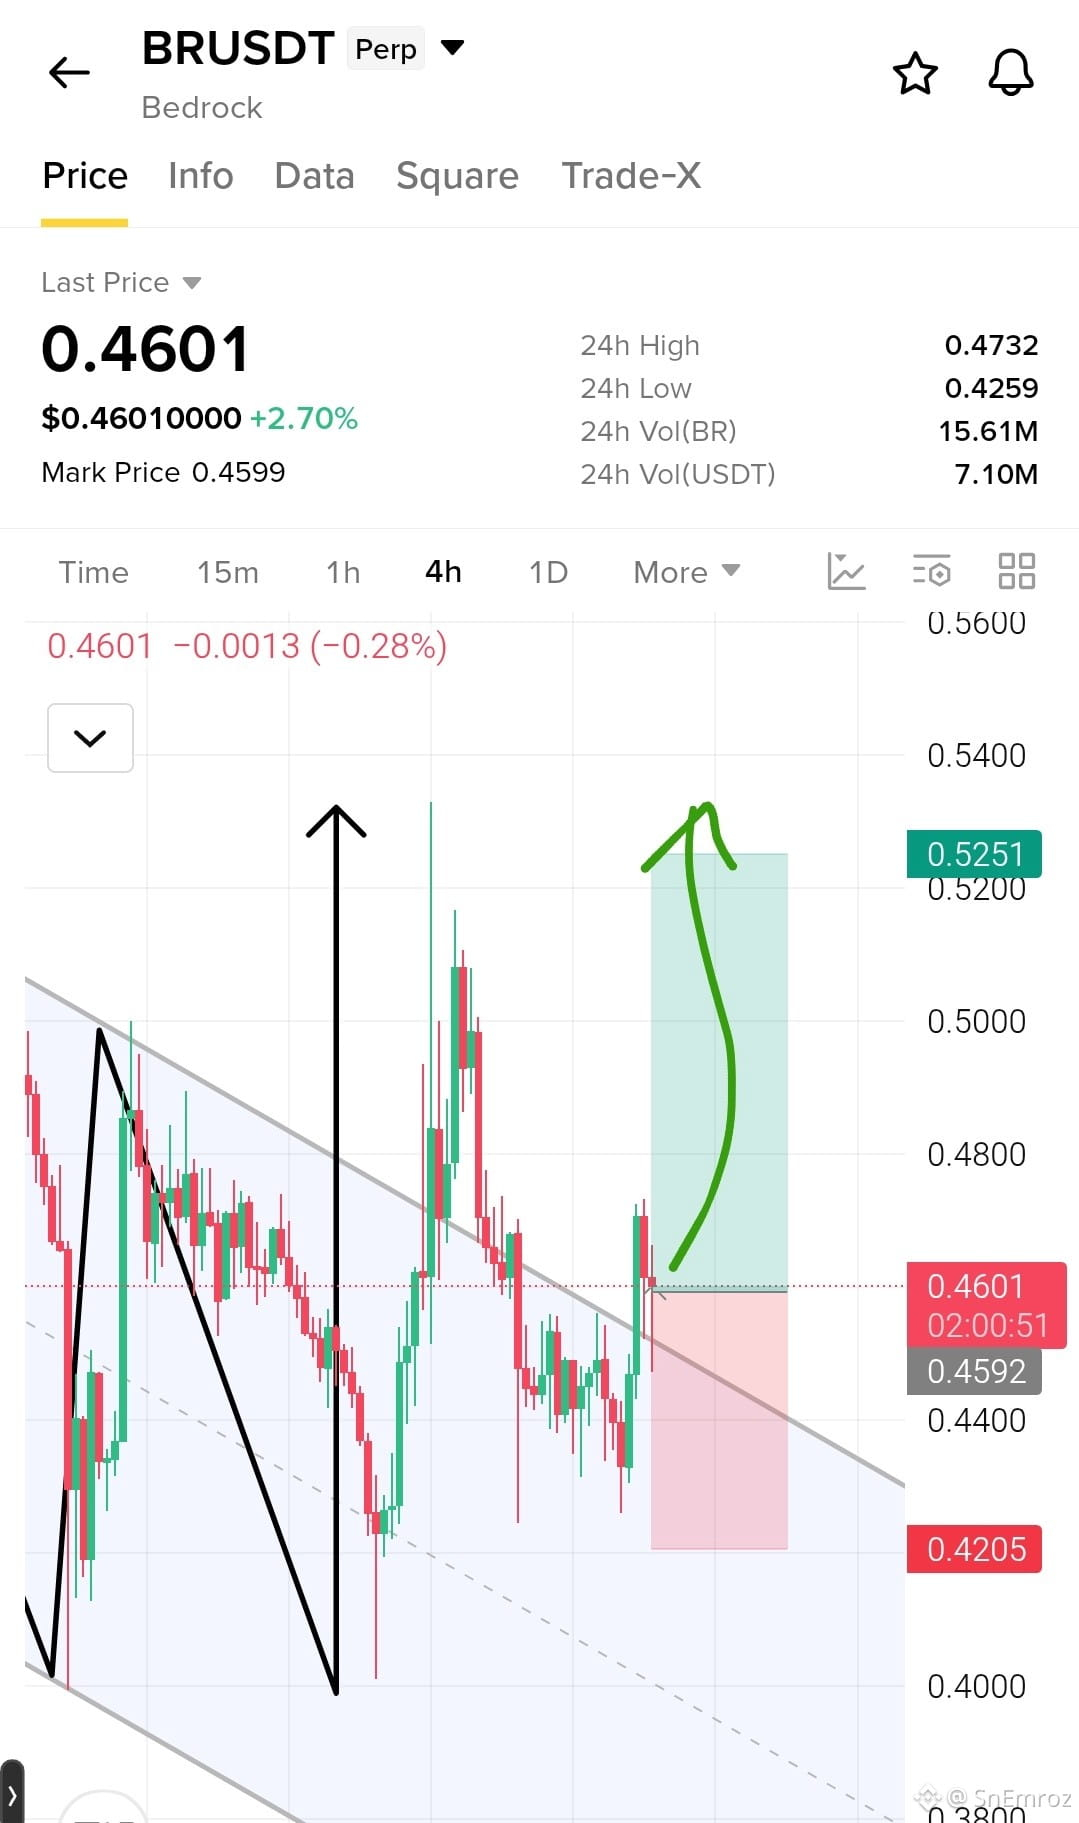
🟢 $BR Long Setup 4h Chart
🔶 Breakout from the falling channel
✏️ BR spiked to the 0.70 area and then sold off for weeks inside a falling channel. Price kept making lower highs and lower lows. Now price is pushing above the upper trendline and the last 4h candles are holding near it. If buyers keep control the channel is done and price can move to the previous high zone near 0.5251.
🟢 $BR Entry 0.4590
👇👇 Click Here To Open Trade 👇👇
{future}(BRUSDT)
✅ Take Profits
TP1 0.4750
TP2 0.5000
TP3 0.5251
❌ Stop Loss 0.4205
Wait for the 4h candle to hold above the trendline. If it falls back inside the channel the breakout is weak.
🟢 $BR Long Setup 4h Chart
🔶 Breakout from the falling channel
✏️ BR spiked to the 0.70 area and then sold off for weeks inside a falling channel. Price kept making lower highs and lower lows. Now price is pushing above the upper trendline and the last 4h candles are holding near it. If buyers keep control the channel is done and price can move to the previous high zone near 0.5251.
🟢 $BR Entry 0.4590
👇👇 Click Here To Open Trade 👇👇
✅ Take Profits
TP1 0.4750
TP2 0.5000
TP3 0.5251
❌ Stop Loss 0.4205
Wait for the 4h candle to hold above the trendline. If it falls back inside the channel the breakout is weak.
🔶 Breakout from the falling channel
✏️ BR spiked to the 0.70 area and then sold off for weeks inside a falling channel. Price kept making lower highs and lower lows. Now price is pushing above the upper trendline and the last 4h candles are holding near it. If buyers keep control the channel is done and price can move to the previous high zone near 0.5251.
🟢 $BR Entry 0.4590
👇👇 Click Here To Open Trade 👇👇
✅ Take Profits
TP1 0.4750
TP2 0.5000
TP3 0.5251
❌ Stop Loss 0.4205
Wait for the 4h candle to hold above the trendline. If it falls back inside the channel the breakout is weak.
1
407
·
--
Bullish
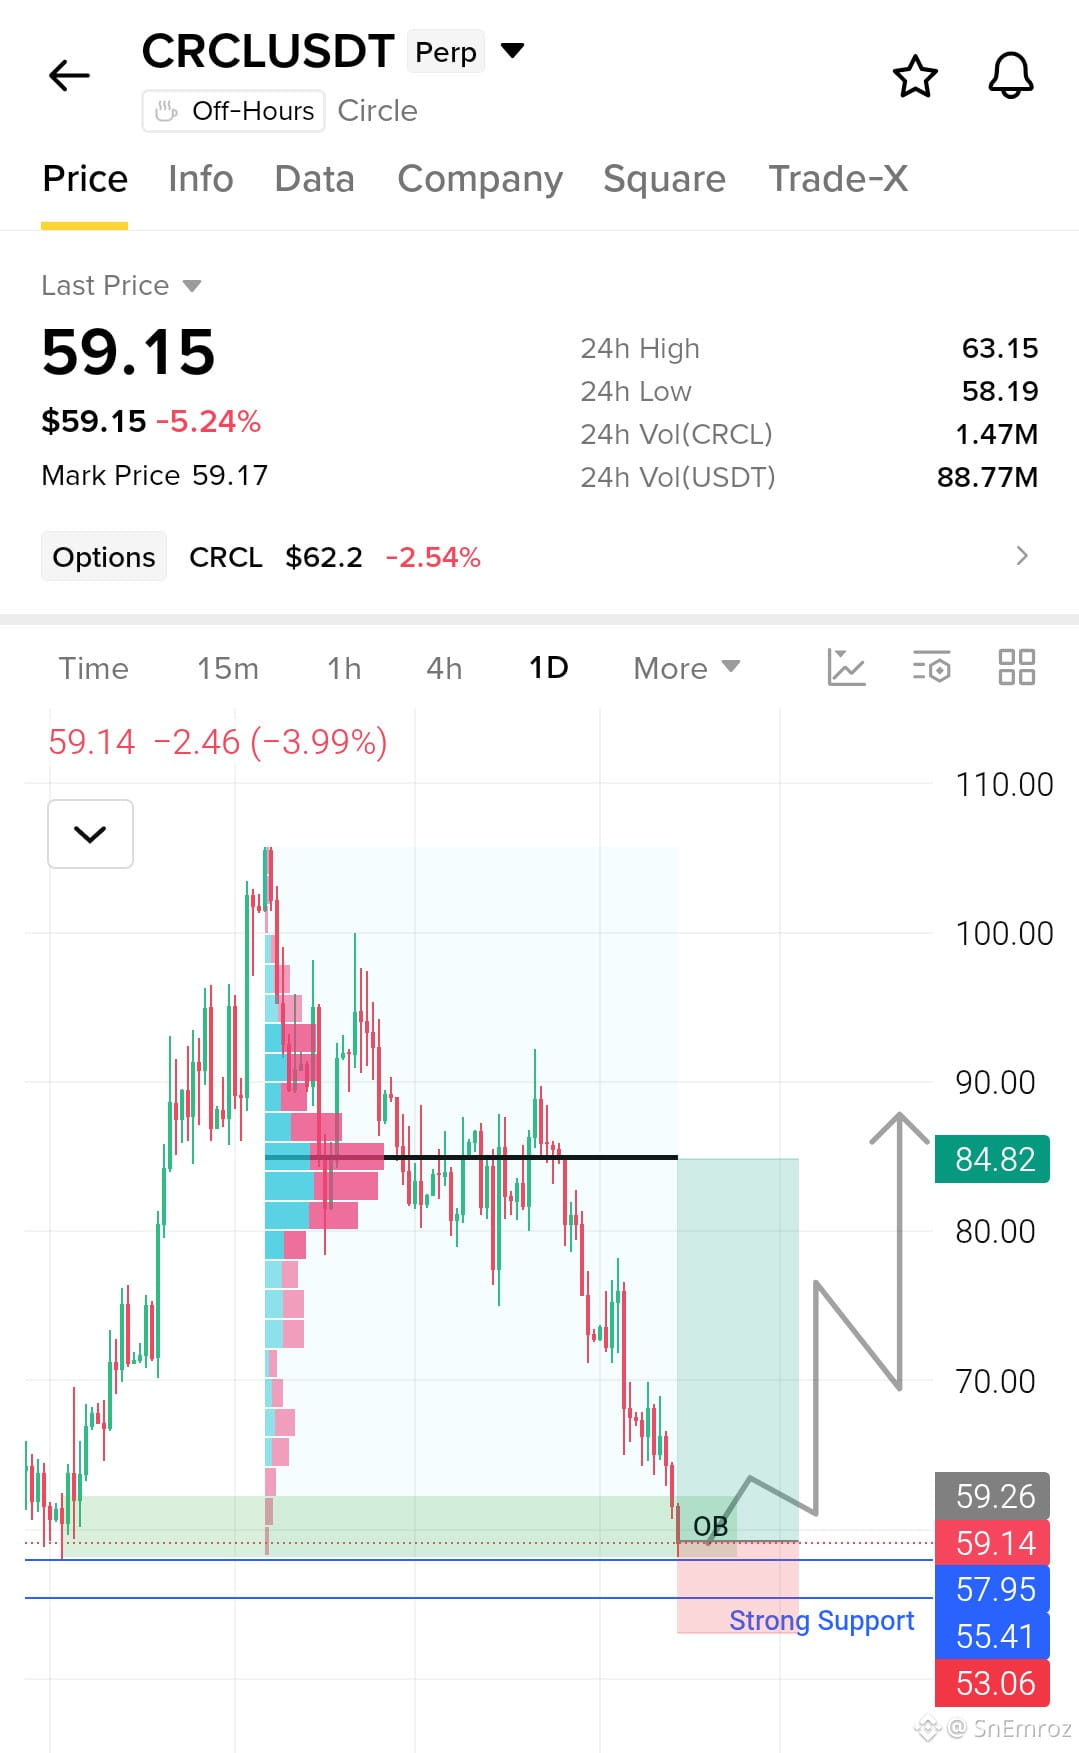
🟢 $CRCL Long Setup 1D Chart
🔶 Deep pullback into the daily demand zone
✏️ CRCL ran up to the 106 area and then sold off hard. Price lost almost half from the top. Now it is sitting on the daily order block and the strong support near 57.95 and 55.41. Sellers are slowing down here. The heavy volume zone above is near 84.82 and that is the main target if buyers take control.
🟢 $CRCL Entry 59.26
👇👇 Click Here To Direct Open Chart 👇👎
{future}(CRCLUSDT)
✅ Take Profits
TP1 62.20
TP2 70.00
TP3 84.82
❌ Stop Loss 53.06
This trade is long time frame. If you can hold with a strong mind you can take it. Otherwise leave it.
🟢 $CRCL Long Setup 1D Chart
🔶 Deep pullback into the daily demand zone
✏️ CRCL ran up to the 106 area and then sold off hard. Price lost almost half from the top. Now it is sitting on the daily order block and the strong support near 57.95 and 55.41. Sellers are slowing down here. The heavy volume zone above is near 84.82 and that is the main target if buyers take control.
🟢 $CRCL Entry 59.26
👇👇 Click Here To Direct Open Chart 👇👎
✅ Take Profits
TP1 62.20
TP2 70.00
TP3 84.82
❌ Stop Loss 53.06
This trade is long time frame. If you can hold with a strong mind you can take it. Otherwise leave it.
🔶 Deep pullback into the daily demand zone
✏️ CRCL ran up to the 106 area and then sold off hard. Price lost almost half from the top. Now it is sitting on the daily order block and the strong support near 57.95 and 55.41. Sellers are slowing down here. The heavy volume zone above is near 84.82 and that is the main target if buyers take control.
🟢 $CRCL Entry 59.26
👇👇 Click Here To Direct Open Chart 👇👎
✅ Take Profits
TP1 62.20
TP2 70.00
TP3 84.82
❌ Stop Loss 53.06
This trade is long time frame. If you can hold with a strong mind you can take it. Otherwise leave it.
626
·
--
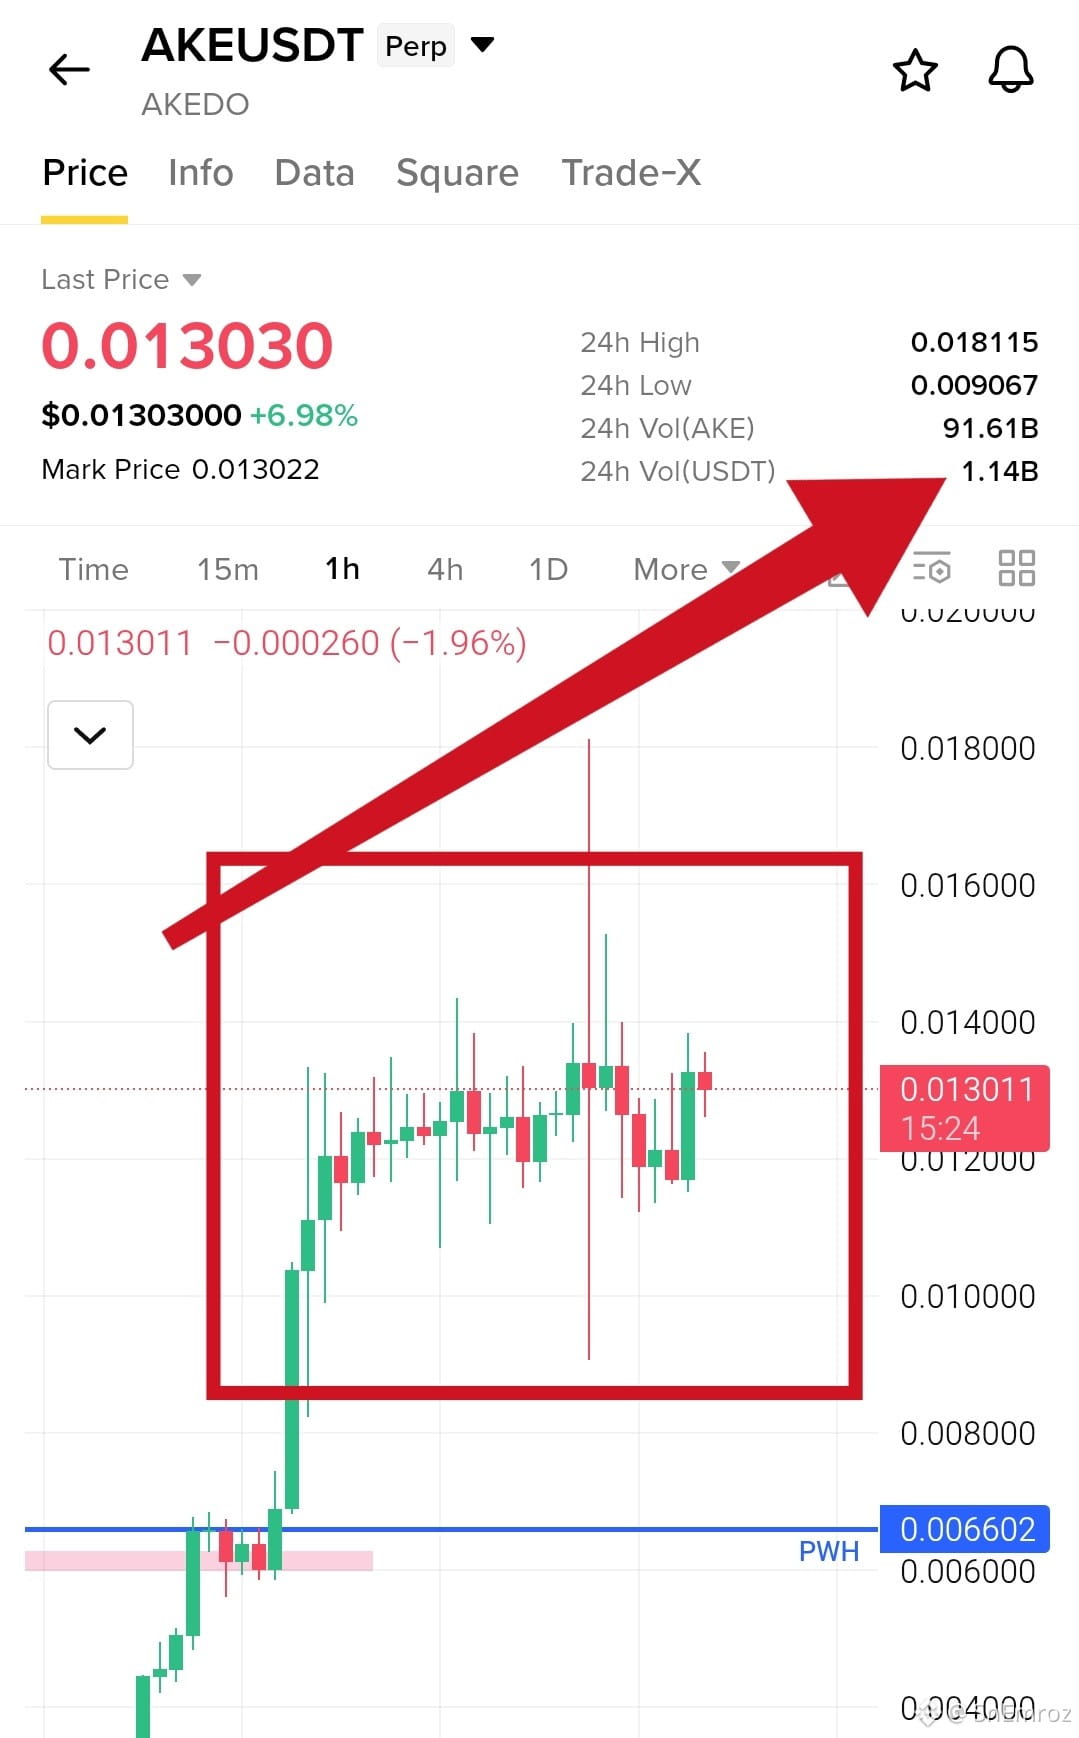
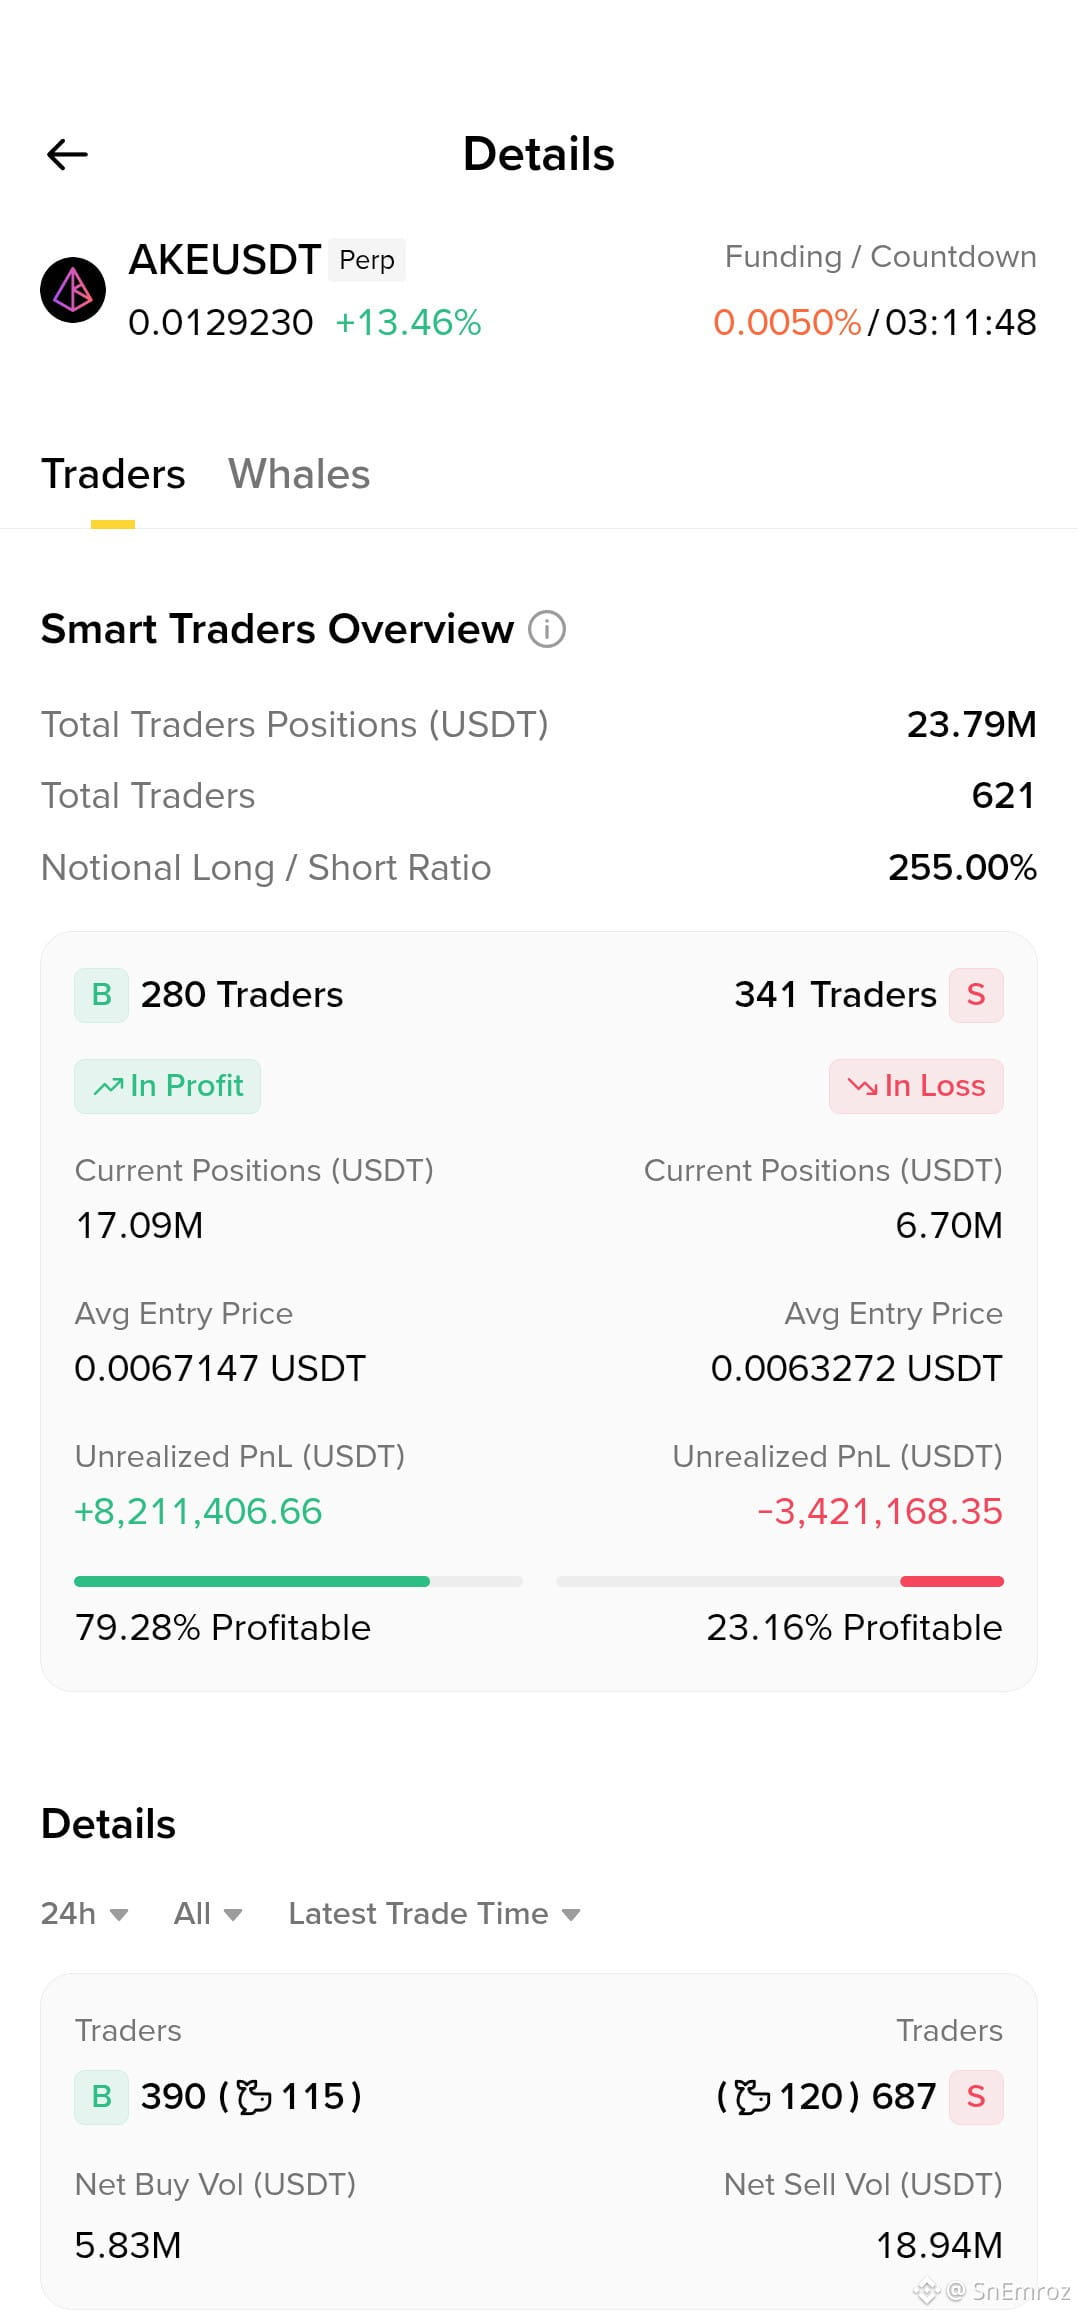
$AKE is moving sideways after a huge pump and the smart trader data tells an interesting story.
Price now is $0.01303 and up around 7% on the day. It ran from the weekly high near $0.0066 all the way to a spike at $0.0181. Since then price is stuck in a range between $0.0115 and $0.0143. There was a big wick down to $0.0091 and a big wick up to $0.0181 and both got rejected fast. That is a sign of heavy liquidation on both sides.
$AKE
{future}(AKEUSDT)
Now look at the smart traders. 280 traders are long and 341 are short. The longs hold $17.09M with average entry at $0.0067. They are sitting on $8.21M profit and 79% of them are profitable. The shorts hold $6.70M with average entry at $0.0063. They are down $3.42M and only 23% of them are profitable.
The long side is much bigger and sitting on big profit. In the last 24h net sell volume is $18.94M against net buy volume of $5.83M. So the early buyers look like they are selling into this strength while price moves sideways. That is a warning for late buyers.
Bullish scenario. Price holds above $0.0115 and gives a 1h close above $0.0143. Then trapped shorts get squeezed and price can retest $0.0160 and the wick high near $0.0181.
Bearish scenario. Price loses $0.0115 with a 1h close below it. Then profit taking from early longs can pull price back to $0.0091 and the fall can be fast because their entries are far below at $0.0067.
$AKE is moving sideways after a huge pump and the smart trader data tells an interesting story.
Price now is $0.01303 and up around 7% on the day. It ran from the weekly high near $0.0066 all the way to a spike at $0.0181. Since then price is stuck in a range between $0.0115 and $0.0143. There was a big wick down to $0.0091 and a big wick up to $0.0181 and both got rejected fast. That is a sign of heavy liquidation on both sides.
$AKE
Now look at the smart traders. 280 traders are long and 341 are short. The longs hold $17.09M with average entry at $0.0067. They are sitting on $8.21M profit and 79% of them are profitable. The shorts hold $6.70M with average entry at $0.0063. They are down $3.42M and only 23% of them are profitable.
The long side is much bigger and sitting on big profit. In the last 24h net sell volume is $18.94M against net buy volume of $5.83M. So the early buyers look like they are selling into this strength while price moves sideways. That is a warning for late buyers.
Bullish scenario. Price holds above $0.0115 and gives a 1h close above $0.0143. Then trapped shorts get squeezed and price can retest $0.0160 and the wick high near $0.0181.
Bearish scenario. Price loses $0.0115 with a 1h close below it. Then profit taking from early longs can pull price back to $0.0091 and the fall can be fast because their entries are far below at $0.0067.
Price now is $0.01303 and up around 7% on the day. It ran from the weekly high near $0.0066 all the way to a spike at $0.0181. Since then price is stuck in a range between $0.0115 and $0.0143. There was a big wick down to $0.0091 and a big wick up to $0.0181 and both got rejected fast. That is a sign of heavy liquidation on both sides.
$AKE
Now look at the smart traders. 280 traders are long and 341 are short. The longs hold $17.09M with average entry at $0.0067. They are sitting on $8.21M profit and 79% of them are profitable. The shorts hold $6.70M with average entry at $0.0063. They are down $3.42M and only 23% of them are profitable.
The long side is much bigger and sitting on big profit. In the last 24h net sell volume is $18.94M against net buy volume of $5.83M. So the early buyers look like they are selling into this strength while price moves sideways. That is a warning for late buyers.
Bullish scenario. Price holds above $0.0115 and gives a 1h close above $0.0143. Then trapped shorts get squeezed and price can retest $0.0160 and the wick high near $0.0181.
Bearish scenario. Price loses $0.0115 with a 1h close below it. Then profit taking from early longs can pull price back to $0.0091 and the fall can be fast because their entries are far below at $0.0067.
1
900
Log in to explore more content
Join global crypto users on Binance Square
⚡️ Get latest and useful information about crypto.
💬 Trusted by the world’s largest crypto exchange.
👍 Discover real insights from verified creators.
Email / Phone number
Trending Topics
A Packed Week of Earnings and Data Tests Markets
51,115 views
340 Discussing
🚨🇺🇸 BIG WEEK AHEAD FOR THE MARKETS!
Markets are pricing in a Fed rate hike in December and $BTC could see some big moves next week.
Here's what's coming:
• Monday: Fed Chair Warsh speaks
• Tuesday: US Retail Sales + $NVDA earnings
• Wednesday: FOMC Minutes
• Thursday: Jobless Claims + Philly Fed Index
• Friday: Consumer Sentiment + Fed speeches
All eyes on $BTC as another important week begins.
#bitcoin
Mookie
·14 Likes
·6.1k views
AnthropicIPOTestsInvestorAppetiteForAI
86,424 views
1,205 Discussing
BitcoinExtendsLosingStreakToSixWeeks
48,447 views
558 Discussing