
Bullish_Vortex
17.2k Posts

Bullish_Vortex
 Square Verified+
Report
Block User
X: @Ericledger0 KITE 868531 Hello 👋 Guys Follow My Signal And Profitable Trade 70%
Open Trade
Frequent Trader
2.2 Years
735 Following
38.4K+ Followers
36.9K+ Liked
Posts
Portfolio
All
Quotes
Videos
Live
$BR
{future}(BRUSDT)
USDT Long Setup | Strong Breakout Momentum
BR/USDT is showing an aggressive bullish recovery on the 1H chart. After hitting a 24-hour low of $0.41214, the price has formed a strong V-shaped recovery with massive green candles. It is currently trading at **$0.45096**, testing its 24h high.
The volume is expanding significantly during this upward push, which strongly supports the buyers. The price action indicates that bulls are in full control.
Key Levels:
Current Price: ~$0.45096
Immediate Resistance: $0.45096 (24h high - currently testing)
Major Support: $0.41214 (24h low)
Trade Setup (Long):
Entry Zone: $0.44500 - $0.45100 (Current breakout zone)
TP1: $0.46000
· TP2: $0.47500
TP3: $0.49000
Stop Loss (SL): $0.43000 (Below the recent consolidation area)Market Outlook:
The setup strongly favors bulls. A clean 1H candle close above the current resistance ($0.45096) with continued volume will confirm the breakout for higher targets. However, a quick rejection here might lead to a short-term pullback to the $0.4400 - $0.4350 area before the next leg up.
Disclaimer: This is not financial advice. Always do your own research and manage your risk.
$BR
USDT Long Setup | Strong Breakout Momentum
BR/USDT is showing an aggressive bullish recovery on the 1H chart. After hitting a 24-hour low of $0.41214, the price has formed a strong V-shaped recovery with massive green candles. It is currently trading at **$0.45096**, testing its 24h high.
The volume is expanding significantly during this upward push, which strongly supports the buyers. The price action indicates that bulls are in full control.
Key Levels:
Current Price: ~$0.45096
Immediate Resistance: $0.45096 (24h high - currently testing)
Major Support: $0.41214 (24h low)
Trade Setup (Long):
Entry Zone: $0.44500 - $0.45100 (Current breakout zone)
TP1: $0.46000
· TP2: $0.47500
TP3: $0.49000
Stop Loss (SL): $0.43000 (Below the recent consolidation area)Market Outlook:
The setup strongly favors bulls. A clean 1H candle close above the current resistance ($0.45096) with continued volume will confirm the breakout for higher targets. However, a quick rejection here might lead to a short-term pullback to the $0.4400 - $0.4350 area before the next leg up.
Disclaimer: This is not financial advice. Always do your own research and manage your risk.
USDT Long Setup | Strong Breakout Momentum
BR/USDT is showing an aggressive bullish recovery on the 1H chart. After hitting a 24-hour low of $0.41214, the price has formed a strong V-shaped recovery with massive green candles. It is currently trading at **$0.45096**, testing its 24h high.
The volume is expanding significantly during this upward push, which strongly supports the buyers. The price action indicates that bulls are in full control.
Key Levels:
Current Price: ~$0.45096
Immediate Resistance: $0.45096 (24h high - currently testing)
Major Support: $0.41214 (24h low)
Trade Setup (Long):
Entry Zone: $0.44500 - $0.45100 (Current breakout zone)
TP1: $0.46000
· TP2: $0.47500
TP3: $0.49000
Stop Loss (SL): $0.43000 (Below the recent consolidation area)Market Outlook:
The setup strongly favors bulls. A clean 1H candle close above the current resistance ($0.45096) with continued volume will confirm the breakout for higher targets. However, a quick rejection here might lead to a short-term pullback to the $0.4400 - $0.4350 area before the next leg up.
Disclaimer: This is not financial advice. Always do your own research and manage your risk.
1
133
$HYPE USDT - I'm cancelling my $100 bullish target. Here's what changed.
I have been strongly bullish on HYPE for weeks. I believed the recent decline was a correction before another move toward $100. But the daily chart has now given me a reason to change that view.
And when the market proves my analysis wrong, I change my plan.
The Structure Has Changed
The key difference is how HYPE broke support. A quick liquidity sweep followed by a recovery would have kept my bullish thesis alive. Instead, price closed decisively below the previous structure, confirming a bearish market structure shift on my chart.
The $76.75 support has been lost, and the fair value gap between roughly $82 and $87.36 is now an important potential resistance zone.
That changes everything for my previous setup.
My New Trading Perspective
I'm watching for a relief bounce, potentially back toward the broken structure and bearish FVG. Such a recovery would not automatically mean the trend has turned bullish again.
If price reaches that resistance area and forms a lower high with clear bearish rejection, I will consider a short setup. I also plan to use a suitable recovery to reassess or close my remaining spot exposure.My next major downside level is around $64.33. If that area fails, the $60-$50 region becomes a possible longer-term extension, not a confirmed destination.
Risk Management
I will not short blindly after such a sharp decline. I want a confirmed rejection, a defined stop-loss and an acceptable risk-to-reward ratio before entering.
A sustained reclaim above $87.36 would weaken my current bearish thesis and force another reassessment.
For anyone still holding HYPE, be careful about treating every green candle as the beginning of a new bull run.
I was bullish when the structure supported it. Now the evidence has changed.
My $100 target is off the table for this setup, and my current bias is strongly bearish.
Protecting capital matters more than defending an old prediction.
im looking also $BTC USDT move
{future}(HYPEUSDT)
$HYPE USDT - I'm cancelling my $100 bullish target. Here's what changed.
I have been strongly bullish on HYPE for weeks. I believed the recent decline was a correction before another move toward $100. But the daily chart has now given me a reason to change that view.
And when the market proves my analysis wrong, I change my plan.
The Structure Has Changed
The key difference is how HYPE broke support. A quick liquidity sweep followed by a recovery would have kept my bullish thesis alive. Instead, price closed decisively below the previous structure, confirming a bearish market structure shift on my chart.
The $76.75 support has been lost, and the fair value gap between roughly $82 and $87.36 is now an important potential resistance zone.
That changes everything for my previous setup.
My New Trading Perspective
I'm watching for a relief bounce, potentially back toward the broken structure and bearish FVG. Such a recovery would not automatically mean the trend has turned bullish again.
If price reaches that resistance area and forms a lower high with clear bearish rejection, I will consider a short setup. I also plan to use a suitable recovery to reassess or close my remaining spot exposure.My next major downside level is around $64.33. If that area fails, the $60-$50 region becomes a possible longer-term extension, not a confirmed destination.
Risk Management
I will not short blindly after such a sharp decline. I want a confirmed rejection, a defined stop-loss and an acceptable risk-to-reward ratio before entering.
A sustained reclaim above $87.36 would weaken my current bearish thesis and force another reassessment.
For anyone still holding HYPE, be careful about treating every green candle as the beginning of a new bull run.
I was bullish when the structure supported it. Now the evidence has changed.
My $100 target is off the table for this setup, and my current bias is strongly bearish.
Protecting capital matters more than defending an old prediction.
im looking also $BTC USDT move
I have been strongly bullish on HYPE for weeks. I believed the recent decline was a correction before another move toward $100. But the daily chart has now given me a reason to change that view.
And when the market proves my analysis wrong, I change my plan.
The Structure Has Changed
The key difference is how HYPE broke support. A quick liquidity sweep followed by a recovery would have kept my bullish thesis alive. Instead, price closed decisively below the previous structure, confirming a bearish market structure shift on my chart.
The $76.75 support has been lost, and the fair value gap between roughly $82 and $87.36 is now an important potential resistance zone.
That changes everything for my previous setup.
My New Trading Perspective
I'm watching for a relief bounce, potentially back toward the broken structure and bearish FVG. Such a recovery would not automatically mean the trend has turned bullish again.
If price reaches that resistance area and forms a lower high with clear bearish rejection, I will consider a short setup. I also plan to use a suitable recovery to reassess or close my remaining spot exposure.My next major downside level is around $64.33. If that area fails, the $60-$50 region becomes a possible longer-term extension, not a confirmed destination.
Risk Management
I will not short blindly after such a sharp decline. I want a confirmed rejection, a defined stop-loss and an acceptable risk-to-reward ratio before entering.
A sustained reclaim above $87.36 would weaken my current bearish thesis and force another reassessment.
For anyone still holding HYPE, be careful about treating every green candle as the beginning of a new bull run.
I was bullish when the structure supported it. Now the evidence has changed.
My $100 target is off the table for this setup, and my current bias is strongly bearish.
Protecting capital matters more than defending an old prediction.
im looking also $BTC USDT move
2
163
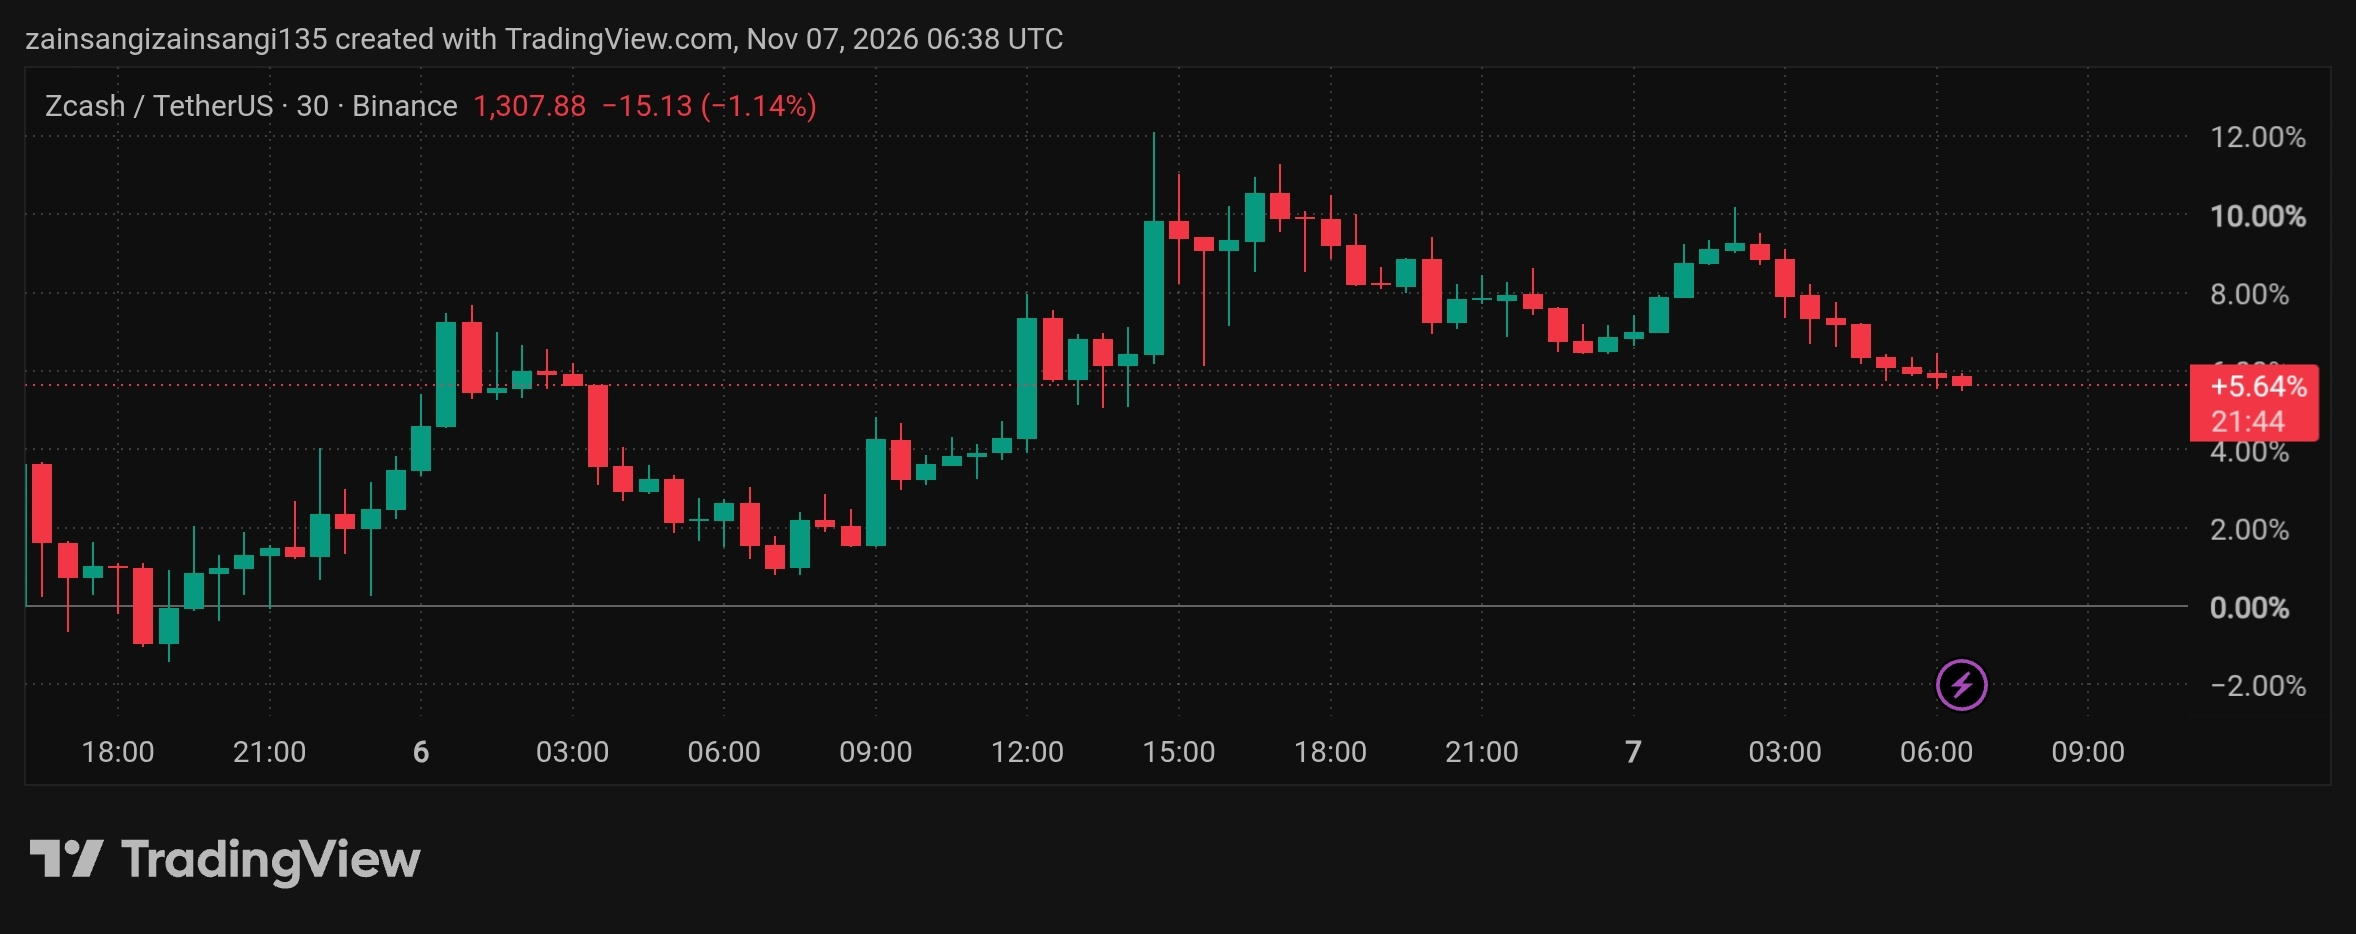
🚀 $ZEC (Zcash) – Bulls Are Taking Control!
I'm watching $ZEC closely because buyers are showing strong strength. The price is around $1,357, up approximately 3.72% in 24 hours. Bulls are pushing higher, and the next breakout could bring another exciting move!
📊 Trade Setup:
- Current Price: $1,357
- 24H Change: +3.72%
- Buy Zone: $1,329 – $1,350
- TP1: $1,405
- TP2: $1,486
- TP3: $1,581
- Stop Loss: $1,290
📍 Key Levels:
- Support: $1,302
- Strong Support: $1,249
- Resistance: $1,354
- Major Resistance: $1,405
🔥 Market Feeling: BULLISH
I'm seeing positive momentum in ZEC. A strong breakout above $1,354 could open the door toward higher targets. But if buyers lose $1,302, a deeper pullback is possible.
Don't chase the price. Wait for confirmation and manage your risk.
❤️ Follow for more!
📢 Share with your trading fam!
{future}(ZECUSDT)
🚀 $ZEC (Zcash) – Bulls Are Taking Control!
I'm watching $ZEC closely because buyers are showing strong strength. The price is around $1,357, up approximately 3.72% in 24 hours. Bulls are pushing higher, and the next breakout could bring another exciting move!
📊 Trade Setup:
- Current Price: $1,357
- 24H Change: +3.72%
- Buy Zone: $1,329 – $1,350
- TP1: $1,405
- TP2: $1,486
- TP3: $1,581
- Stop Loss: $1,290
📍 Key Levels:
- Support: $1,302
- Strong Support: $1,249
- Resistance: $1,354
- Major Resistance: $1,405
🔥 Market Feeling: BULLISH
I'm seeing positive momentum in ZEC. A strong breakout above $1,354 could open the door toward higher targets. But if buyers lose $1,302, a deeper pullback is possible.
Don't chase the price. Wait for confirmation and manage your risk.
❤️ Follow for more!
📢 Share with your trading fam!
I'm watching $ZEC closely because buyers are showing strong strength. The price is around $1,357, up approximately 3.72% in 24 hours. Bulls are pushing higher, and the next breakout could bring another exciting move!
📊 Trade Setup:
- Current Price: $1,357
- 24H Change: +3.72%
- Buy Zone: $1,329 – $1,350
- TP1: $1,405
- TP2: $1,486
- TP3: $1,581
- Stop Loss: $1,290
📍 Key Levels:
- Support: $1,302
- Strong Support: $1,249
- Resistance: $1,354
- Major Resistance: $1,405
🔥 Market Feeling: BULLISH
I'm seeing positive momentum in ZEC. A strong breakout above $1,354 could open the door toward higher targets. But if buyers lose $1,302, a deeper pullback is possible.
Don't chase the price. Wait for confirmation and manage your risk.
❤️ Follow for more!
📢 Share with your trading fam!
207
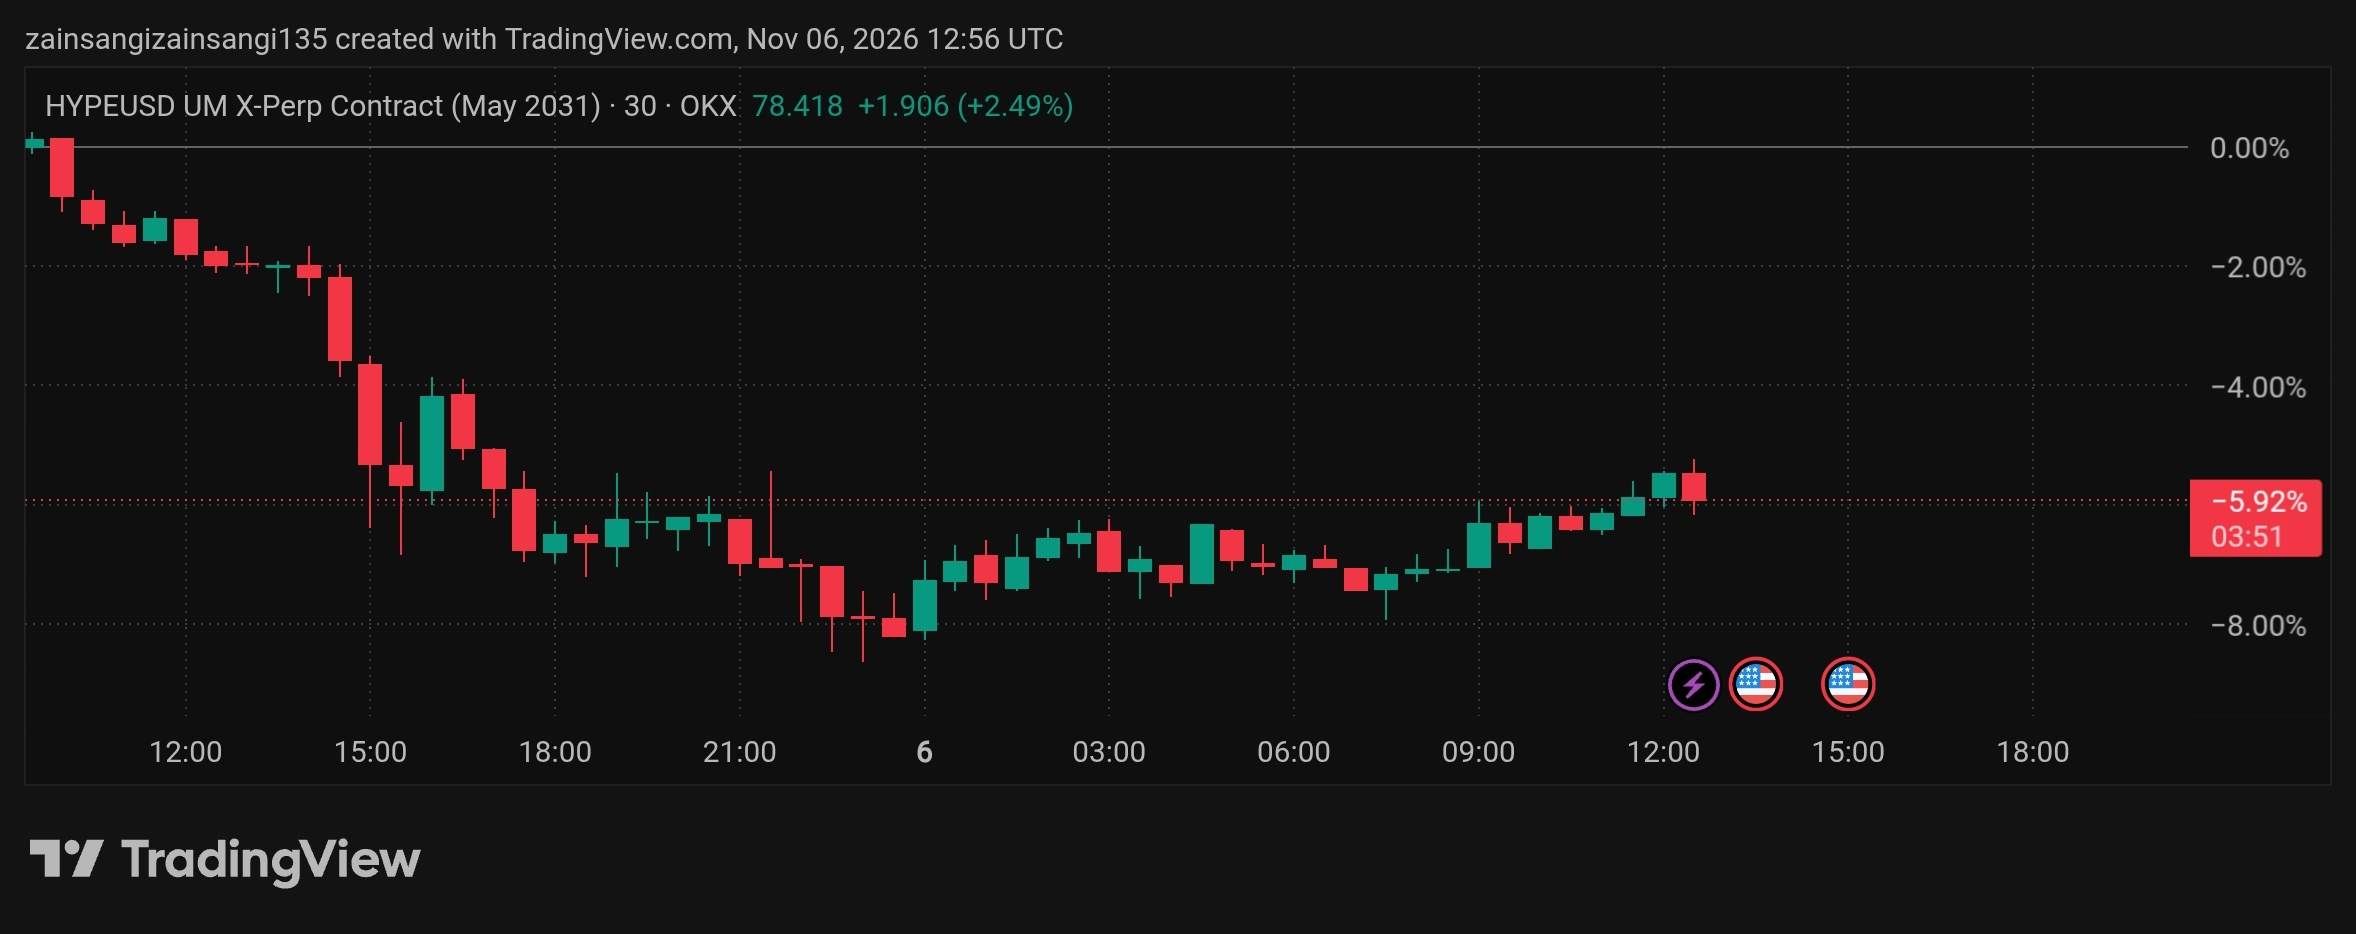
🔥 $HYPE – BIG MOVE COMING? WATCH THIS LEVEL!
I'm watching $HYPE closely because sellers are putting strong pressure on the price. HYPE is trading around $77.62, down 7.06% in the last 24 hours. Buyers need to step in now to stop this correction.
Current Price: $77.62
24H Change: -7.06%
Buy Zone: $74.95 – $76.30
Take Profit Targets:
🎯 TP1: $78.24
🎯 TP2: $80.95
🎯 TP3: $84.91
Stop-Loss: $72.80
Key Support: $74.95
Key Resistance: $78.24 – $80.95
Market Feeling: Bearish ⚠️
I'm watching the $75 support area very closely. If buyers defend this zone and push the price back above $78.24, HYPE could start a strong recovery. But if support breaks, another drop could follow.
This is a critical moment. Don't rush into a trade. Wait for confirmation and protect your capital.
❤️ Follow for more
📢 Share with your trading fam.
$HYPE
{future}(HYPEUSDT)
🔥 $HYPE – BIG MOVE COMING? WATCH THIS LEVEL!
I'm watching $HYPE closely because sellers are putting strong pressure on the price. HYPE is trading around $77.62, down 7.06% in the last 24 hours. Buyers need to step in now to stop this correction.
Current Price: $77.62
24H Change: -7.06%
Buy Zone: $74.95 – $76.30
Take Profit Targets:
🎯 TP1: $78.24
🎯 TP2: $80.95
🎯 TP3: $84.91
Stop-Loss: $72.80
Key Support: $74.95
Key Resistance: $78.24 – $80.95
Market Feeling: Bearish ⚠️
I'm watching the $75 support area very closely. If buyers defend this zone and push the price back above $78.24, HYPE could start a strong recovery. But if support breaks, another drop could follow.
This is a critical moment. Don't rush into a trade. Wait for confirmation and protect your capital.
❤️ Follow for more
📢 Share with your trading fam.
$HYPE
I'm watching $HYPE closely because sellers are putting strong pressure on the price. HYPE is trading around $77.62, down 7.06% in the last 24 hours. Buyers need to step in now to stop this correction.
Current Price: $77.62
24H Change: -7.06%
Buy Zone: $74.95 – $76.30
Take Profit Targets:
🎯 TP1: $78.24
🎯 TP2: $80.95
🎯 TP3: $84.91
Stop-Loss: $72.80
Key Support: $74.95
Key Resistance: $78.24 – $80.95
Market Feeling: Bearish ⚠️
I'm watching the $75 support area very closely. If buyers defend this zone and push the price back above $78.24, HYPE could start a strong recovery. But if support breaks, another drop could follow.
This is a critical moment. Don't rush into a trade. Wait for confirmation and protect your capital.
❤️ Follow for more
📢 Share with your trading fam.
$HYPE

529
$NEAR | Short Setup
Leverage: 30x
Entry: 4.016–4.057
TP1: 3.846
TP2: 3.686
TP3: 3.51
SL: 4.161
{future}(NEARUSDT)
$CLANKER
{future}(CLANKERUSDT)
$BMT
{future}(BMTUSDT)
$NEAR | Short Setup
Leverage: 30x
Entry: 4.016–4.057
TP1: 3.846
TP2: 3.686
TP3: 3.51
SL: 4.161
$CLANKER
$BMT
Leverage: 30x
Entry: 4.016–4.057
TP1: 3.846
TP2: 3.686
TP3: 3.51
SL: 4.161
$CLANKER
$BMT
106
$BULLA showing long potential 🤑
Entry: $0.071876 – $0.072309
TP: $0.073854 – $0.074246 – $0.076141
SL: $0.069706
$CLANKER
{future}(CLANKERUSDT)
$BMT
{future}(BMTUSDT)
{future}(BULLAUSDT)
#Write2Earn
$BULLA showing long potential 🤑
Entry: $0.071876 – $0.072309
TP: $0.073854 – $0.074246 – $0.076141
SL: $0.069706
$CLANKER
$BMT
#Write2Earn
Entry: $0.071876 – $0.072309
TP: $0.073854 – $0.074246 – $0.076141
SL: $0.069706
$CLANKER
$BMT
#Write2Earn
176
$QNT is pulling back while keeping its structure intact, with buyers stepping in again.
Entry: 198.24–198.89
TP1: 204.52
TP2: 209.48
TP3: 214.45
SL: 192.92
{future}(QNTUSDT)
$CLANKER
{future}(CLANKERUSDT)
$BMT
{future}(BMTUSDT)
#Write2Earn
$QNT is pulling back while keeping its structure intact, with buyers stepping in again.
Entry: 198.24–198.89
TP1: 204.52
TP2: 209.48
TP3: 214.45
SL: 192.92
$CLANKER
$BMT
#Write2Earn
Entry: 198.24–198.89
TP1: 204.52
TP2: 209.48
TP3: 214.45
SL: 192.92
$CLANKER
$BMT
#Write2Earn

254
$WLD consolidating near support after the correction.
Demand continues supporting current price action following long liquidations at $0.3826.
EP
$0.3800 - $0.3850
TP
$0.4100
$0.4450
$0.4800
SL
$0.3650
Price remains above a key support area despite recent weakness. A reclaim of nearby resistance could trigger expansion toward higher targets.
Let’s go $WLD
{future}(WLDUSDT)
#USMidterms-WhatAreMarketsExpecting? #USOctoberNFP-AreRateCutsStillPossible #AMDBeatsExpectations-AINarrativeContinues #MorganStanleyAmongFirstBanksToUseDTCCTokenization #BinanceHourlyDepositsExceedWithdrawals
$WLD consolidating near support after the correction.
Demand continues supporting current price action following long liquidations at $0.3826.
EP
$0.3800 - $0.3850
TP
$0.4100
$0.4450
$0.4800
SL
$0.3650
Price remains above a key support area despite recent weakness. A reclaim of nearby resistance could trigger expansion toward higher targets.
Let’s go $WLD
#USMidterms-WhatAreMarketsExpecting? #USOctoberNFP-AreRateCutsStillPossible #AMDBeatsExpectations-AINarrativeContinues #MorganStanleyAmongFirstBanksToUseDTCCTokenization #BinanceHourlyDepositsExceedWithdrawals
Demand continues supporting current price action following long liquidations at $0.3826.
EP
$0.3800 - $0.3850
TP
$0.4100
$0.4450
$0.4800
SL
$0.3650
Price remains above a key support area despite recent weakness. A reclaim of nearby resistance could trigger expansion toward higher targets.
Let’s go $WLD
#USMidterms-WhatAreMarketsExpecting? #USOctoberNFP-AreRateCutsStillPossible #AMDBeatsExpectations-AINarrativeContinues #MorganStanleyAmongFirstBanksToUseDTCCTokenization #BinanceHourlyDepositsExceedWithdrawals
65
$TRUMP testing a critical demand zone after flushing leveraged longs at $1.515.
Consolidation indicates absorption and potential reversal momentum.
EP
$1.5100 - $1.5300
TP
$1.6200
$1.7500
$1.8800
SL
$1.4500
Price remains above a key support area despite recent weakness. A reclaim of nearby resistance could trigger expansion toward higher targets.
Let’s go $TRUMP
{future}(TRUMPUSDT)
#USMidterms-WhatAreMarketsExpecting? #USOctoberNFP-AreRateCutsStillPossible #AMDBeatsExpectations-AINarrativeContinues #BinanceHourlyDepositsExceedWithdrawals
$TRUMP testing a critical demand zone after flushing leveraged longs at $1.515.
Consolidation indicates absorption and potential reversal momentum.
EP
$1.5100 - $1.5300
TP
$1.6200
$1.7500
$1.8800
SL
$1.4500
Price remains above a key support area despite recent weakness. A reclaim of nearby resistance could trigger expansion toward higher targets.
Let’s go $TRUMP
#USMidterms-WhatAreMarketsExpecting? #USOctoberNFP-AreRateCutsStillPossible #AMDBeatsExpectations-AINarrativeContinues #BinanceHourlyDepositsExceedWithdrawals
Consolidation indicates absorption and potential reversal momentum.
EP
$1.5100 - $1.5300
TP
$1.6200
$1.7500
$1.8800
SL
$1.4500
Price remains above a key support area despite recent weakness. A reclaim of nearby resistance could trigger expansion toward higher targets.
Let’s go $TRUMP
#USMidterms-WhatAreMarketsExpecting? #USOctoberNFP-AreRateCutsStillPossible #AMDBeatsExpectations-AINarrativeContinues #BinanceHourlyDepositsExceedWithdrawals
90
$BZ demonstrating strong bullish momentum after clearing short liquidity at $104.59.
Price is holding the breakout level, indicating sustained buying pressure.
EP
$103.50 - $105.50
TP
$112.00
$120.00
$128.50
SL
$99.50
Price remains above a key support area despite recent weakness. A reclaim of nearby resistance could trigger expansion toward higher targets.
Let’s go $BZ
{future}(BZUSDT)
#USMidterms-WhatAreMarketsExpecting? #USOctoberNFP-AreRateCutsStillPossible #AMDBeatsExpectations-AINarrativeContinues #BinanceHourlyDepositsExceedWithdrawals
$BZ demonstrating strong bullish momentum after clearing short liquidity at $104.59.
Price is holding the breakout level, indicating sustained buying pressure.
EP
$103.50 - $105.50
TP
$112.00
$120.00
$128.50
SL
$99.50
Price remains above a key support area despite recent weakness. A reclaim of nearby resistance could trigger expansion toward higher targets.
Let’s go $BZ
#USMidterms-WhatAreMarketsExpecting? #USOctoberNFP-AreRateCutsStillPossible #AMDBeatsExpectations-AINarrativeContinues #BinanceHourlyDepositsExceedWithdrawals
Price is holding the breakout level, indicating sustained buying pressure.
EP
$103.50 - $105.50
TP
$112.00
$120.00
$128.50
SL
$99.50
Price remains above a key support area despite recent weakness. A reclaim of nearby resistance could trigger expansion toward higher targets.
Let’s go $BZ
#USMidterms-WhatAreMarketsExpecting? #USOctoberNFP-AreRateCutsStillPossible #AMDBeatsExpectations-AINarrativeContinues #BinanceHourlyDepositsExceedWithdrawals
92
$BOME consolidating near support after the correction.
Demand continues supporting current price action following the long liquidation flush at $0.00062.
EP
$0.00061 - $0.00064
TP
$0.00072
$0.00085
$0.00095
SL
$0.00057
Price remains above a key support area despite recent weakness. A reclaim of nearby resistance could trigger expansion toward higher targets.
Let’s go $BOME
{future}(BOMEUSDT)
#USMidterms-WhatAreMarketsExpecting? #USOctoberNFP-AreRateCutsStillPossible #AMDBeatsExpectations-AINarrativeContinues #BinanceHourlyDepositsExceedWithdrawals
$BOME consolidating near support after the correction.
Demand continues supporting current price action following the long liquidation flush at $0.00062.
EP
$0.00061 - $0.00064
TP
$0.00072
$0.00085
$0.00095
SL
$0.00057
Price remains above a key support area despite recent weakness. A reclaim of nearby resistance could trigger expansion toward higher targets.
Let’s go $BOME
#USMidterms-WhatAreMarketsExpecting? #USOctoberNFP-AreRateCutsStillPossible #AMDBeatsExpectations-AINarrativeContinues #BinanceHourlyDepositsExceedWithdrawals
Demand continues supporting current price action following the long liquidation flush at $0.00062.
EP
$0.00061 - $0.00064
TP
$0.00072
$0.00085
$0.00095
SL
$0.00057
Price remains above a key support area despite recent weakness. A reclaim of nearby resistance could trigger expansion toward higher targets.
Let’s go $BOME
#USMidterms-WhatAreMarketsExpecting? #USOctoberNFP-AreRateCutsStillPossible #AMDBeatsExpectations-AINarrativeContinues #BinanceHourlyDepositsExceedWithdrawals
102
$SOXL holding firm above reclaimed resistance after short liquidations at $75.49.
Momentum remains constructive with sustained volume supporting the breakout structure.
EP
$74.50 - $76.00
TP
$80.00
$85.50
$92.00
SL
$71.50
Price remains above a key support area despite recent weakness. A reclaim of nearby resistance could trigger expansion toward higher targets.
Let’s go $SOXL
{future}(SOXLUSDT)
#USMidterms-WhatAreMarketsExpecting? #USOctoberNFP-AreRateCutsStillPossible #AMDBeatsExpectations-AINarrativeContinues #HongKongToLicenseVirtualAssetCustodyAndAdvisory
$SOXL holding firm above reclaimed resistance after short liquidations at $75.49.
Momentum remains constructive with sustained volume supporting the breakout structure.
EP
$74.50 - $76.00
TP
$80.00
$85.50
$92.00
SL
$71.50
Price remains above a key support area despite recent weakness. A reclaim of nearby resistance could trigger expansion toward higher targets.
Let’s go $SOXL
#USMidterms-WhatAreMarketsExpecting? #USOctoberNFP-AreRateCutsStillPossible #AMDBeatsExpectations-AINarrativeContinues #HongKongToLicenseVirtualAssetCustodyAndAdvisory
Momentum remains constructive with sustained volume supporting the breakout structure.
EP
$74.50 - $76.00
TP
$80.00
$85.50
$92.00
SL
$71.50
Price remains above a key support area despite recent weakness. A reclaim of nearby resistance could trigger expansion toward higher targets.
Let’s go $SOXL
#USMidterms-WhatAreMarketsExpecting? #USOctoberNFP-AreRateCutsStillPossible #AMDBeatsExpectations-AINarrativeContinues #HongKongToLicenseVirtualAssetCustodyAndAdvisory
214
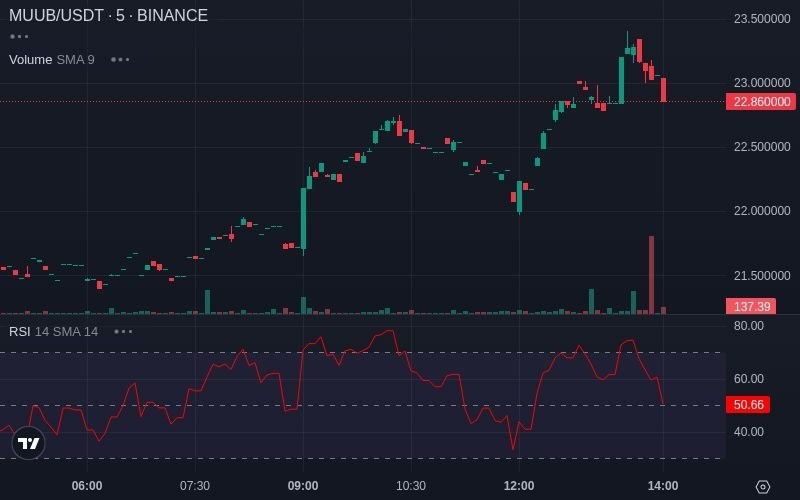
**MUUB/USDT Market Analysis**
MUUB/USDT is currently trading at 22.86 USDT, reflecting a -1.00% decline over the last 24 hours. Despite this slight pullback from recent highs near 23.50 USDT, the market structure remains constructive following a strong intraday rally. Notably, significant whale activity has been detected, with a large buy order of 1.71K MUUB (valued at 39.6K USDT) executed over just 9 minutes. This substantial accumulation, representing over 5% of the current price action, suggests that institutional or high-volume buyers are stepping in to support the asset during this consolidation phase, countering immediate selling pressure.
**Support Zone:** 22.00 – 22.50 USDT
**Resistance Zone:** 23.00 – 23.50 USDT
**Next Bullish Target:** 23.50 USDT if buyers reclaim resistance.
**Bearish Target:** 22.00 USDT if support breaks.
Traders should closely monitor the reaction around the 22.86 USDT level following the recent whale accumulation. A confirmed bounce accompanied by sustained buying volume would validate the strength of this support and signal a potential retest of the 23.50 USDT highs. Conversely, if selling pressure increases and the price fails to hold above 22.50 USDT, it may indicate profit-taking is outweighing demand, leading to a deeper correction toward the 22.00 USDT region.
$MUUB
{spot}(MUUBUSDT)
**MUUB/USDT Market Analysis**
MUUB/USDT is currently trading at 22.86 USDT, reflecting a -1.00% decline over the last 24 hours. Despite this slight pullback from recent highs near 23.50 USDT, the market structure remains constructive following a strong intraday rally. Notably, significant whale activity has been detected, with a large buy order of 1.71K MUUB (valued at 39.6K USDT) executed over just 9 minutes. This substantial accumulation, representing over 5% of the current price action, suggests that institutional or high-volume buyers are stepping in to support the asset during this consolidation phase, countering immediate selling pressure.
**Support Zone:** 22.00 – 22.50 USDT
**Resistance Zone:** 23.00 – 23.50 USDT
**Next Bullish Target:** 23.50 USDT if buyers reclaim resistance.
**Bearish Target:** 22.00 USDT if support breaks.
Traders should closely monitor the reaction around the 22.86 USDT level following the recent whale accumulation. A confirmed bounce accompanied by sustained buying volume would validate the strength of this support and signal a potential retest of the 23.50 USDT highs. Conversely, if selling pressure increases and the price fails to hold above 22.50 USDT, it may indicate profit-taking is outweighing demand, leading to a deeper correction toward the 22.00 USDT region.
$MUUB
MUUB/USDT is currently trading at 22.86 USDT, reflecting a -1.00% decline over the last 24 hours. Despite this slight pullback from recent highs near 23.50 USDT, the market structure remains constructive following a strong intraday rally. Notably, significant whale activity has been detected, with a large buy order of 1.71K MUUB (valued at 39.6K USDT) executed over just 9 minutes. This substantial accumulation, representing over 5% of the current price action, suggests that institutional or high-volume buyers are stepping in to support the asset during this consolidation phase, countering immediate selling pressure.
**Support Zone:** 22.00 – 22.50 USDT
**Resistance Zone:** 23.00 – 23.50 USDT
**Next Bullish Target:** 23.50 USDT if buyers reclaim resistance.
**Bearish Target:** 22.00 USDT if support breaks.
Traders should closely monitor the reaction around the 22.86 USDT level following the recent whale accumulation. A confirmed bounce accompanied by sustained buying volume would validate the strength of this support and signal a potential retest of the 23.50 USDT highs. Conversely, if selling pressure increases and the price fails to hold above 22.50 USDT, it may indicate profit-taking is outweighing demand, leading to a deeper correction toward the 22.00 USDT region.
$MUUB
1
119
🩸 ARIA — LONGS GOT TRAPPED 🩸
I'm being honest with you: this one hurts. $1.95K longs closed at $0.11579.
Buyers rushed in. Buyers got punished. Learn from it. 😔
💰 Price Now: $0.11579
📊 24H Change: ___%
🟡 CAREFUL BUY ZONE: $0.1130 – $0.1145
(only if price holds and turns green)
🎯 Target 1: $0.1190
🎯 Target 2: $0.1230
🎯 Target 3: $0.1280
🛑 Stop-Loss: $0.1105
🧱 Support: $0.1130 / $0.1105
🧊 Resistance: $0.1190 / $0.1230
🌡️ Market Feeling: BEARISH 🐻 (short term)
Weak hands are out. Now we wait for real buyers.
I'm patient. Cash is a position too.
⚠️ Don't catch a falling knife. Wait for the bounce.
Follow for more 📲
Share with your trading fam 🔁
$ARIA
{future}(ARIAUSDT)
🩸 ARIA — LONGS GOT TRAPPED 🩸
I'm being honest with you: this one hurts. $1.95K longs closed at $0.11579.
Buyers rushed in. Buyers got punished. Learn from it. 😔
💰 Price Now: $0.11579
📊 24H Change: ___%
🟡 CAREFUL BUY ZONE: $0.1130 – $0.1145
(only if price holds and turns green)
🎯 Target 1: $0.1190
🎯 Target 2: $0.1230
🎯 Target 3: $0.1280
🛑 Stop-Loss: $0.1105
🧱 Support: $0.1130 / $0.1105
🧊 Resistance: $0.1190 / $0.1230
🌡️ Market Feeling: BEARISH 🐻 (short term)
Weak hands are out. Now we wait for real buyers.
I'm patient. Cash is a position too.
⚠️ Don't catch a falling knife. Wait for the bounce.
Follow for more 📲
Share with your trading fam 🔁
$ARIA
I'm being honest with you: this one hurts. $1.95K longs closed at $0.11579.
Buyers rushed in. Buyers got punished. Learn from it. 😔
💰 Price Now: $0.11579
📊 24H Change: ___%
🟡 CAREFUL BUY ZONE: $0.1130 – $0.1145
(only if price holds and turns green)
🎯 Target 1: $0.1190
🎯 Target 2: $0.1230
🎯 Target 3: $0.1280
🛑 Stop-Loss: $0.1105
🧱 Support: $0.1130 / $0.1105
🧊 Resistance: $0.1190 / $0.1230
🌡️ Market Feeling: BEARISH 🐻 (short term)
Weak hands are out. Now we wait for real buyers.
I'm patient. Cash is a position too.
⚠️ Don't catch a falling knife. Wait for the bounce.
Follow for more 📲
Share with your trading fam 🔁
$ARIA
140
🐂 ZEC — SHORTS SMASHED AT $1,183 🐂
I'm calling it: this is strength. $2.36K in shorts gone at $1183.64.
Bears keep fighting the trend. Trend keeps winning. 💪
💰 Price Now: $1,183.64
📊 24H Change: ___%
🟢 BUY ZONE: $1,160 – $1,178
🎯 Target 1: $1,210
🎯 Target 2: $1,250
🎯 Target 3: $1,300
🛑 Stop-Loss: $1,135
🧱 Support: $1,160 / $1,135
🧊 Resistance: $1,210 / $1,250
🌡️ Market Feeling: BULLISH 🐂
Every dip gets bought. That's not luck. That's demand.
I'm riding the trend, not guessing the top.
⚠️ Big price = big risk. Size small.
Follow for more 📲
Share with your trading fam 🔁
$ZEC
{future}(ZECUSDT)
🐂 ZEC — SHORTS SMASHED AT $1,183 🐂
I'm calling it: this is strength. $2.36K in shorts gone at $1183.64.
Bears keep fighting the trend. Trend keeps winning. 💪
💰 Price Now: $1,183.64
📊 24H Change: ___%
🟢 BUY ZONE: $1,160 – $1,178
🎯 Target 1: $1,210
🎯 Target 2: $1,250
🎯 Target 3: $1,300
🛑 Stop-Loss: $1,135
🧱 Support: $1,160 / $1,135
🧊 Resistance: $1,210 / $1,250
🌡️ Market Feeling: BULLISH 🐂
Every dip gets bought. That's not luck. That's demand.
I'm riding the trend, not guessing the top.
⚠️ Big price = big risk. Size small.
Follow for more 📲
Share with your trading fam 🔁
$ZEC
I'm calling it: this is strength. $2.36K in shorts gone at $1183.64.
Bears keep fighting the trend. Trend keeps winning. 💪
💰 Price Now: $1,183.64
📊 24H Change: ___%
🟢 BUY ZONE: $1,160 – $1,178
🎯 Target 1: $1,210
🎯 Target 2: $1,250
🎯 Target 3: $1,300
🛑 Stop-Loss: $1,135
🧱 Support: $1,160 / $1,135
🧊 Resistance: $1,210 / $1,250
🌡️ Market Feeling: BULLISH 🐂
Every dip gets bought. That's not luck. That's demand.
I'm riding the trend, not guessing the top.
⚠️ Big price = big risk. Size small.
Follow for more 📲
Share with your trading fam 🔁
$ZEC
91
⚡ HOT — $4.9K SHORTS ERASED ⚡
I'm not ignoring this tape. Biggest short burn on the board.
HOT shorts paid $4.9K at $0.00056. Momentum is awake. 💥
💰 Price Now: $0.00056
📊 24H Change: ___%
🟢 BUY ZONE: $0.000548 – $0.000556
🎯 Target 1: $0.000575
🎯 Target 2: $0.000595
🎯 Target 3: $0.000620
🛑 Stop-Loss: $0.000535
🧱 Support: $0.000550 / $0.000535
🧊 Resistance: $0.000575 / $0.000600
🌡️ Market Feeling: BULLISH 🐂
Slow coin. Sudden spark. I'm watching volume, not hype.
If volume dies, I'm out. Simple.
⚠️ No volume = no trade. Wait for it.
Follow for more 📲
Share with your trading fam 🔁
$HOT
{future}(HOTUSDT)
⚡ HOT — $4.9K SHORTS ERASED ⚡
I'm not ignoring this tape. Biggest short burn on the board.
HOT shorts paid $4.9K at $0.00056. Momentum is awake. 💥
💰 Price Now: $0.00056
📊 24H Change: ___%
🟢 BUY ZONE: $0.000548 – $0.000556
🎯 Target 1: $0.000575
🎯 Target 2: $0.000595
🎯 Target 3: $0.000620
🛑 Stop-Loss: $0.000535
🧱 Support: $0.000550 / $0.000535
🧊 Resistance: $0.000575 / $0.000600
🌡️ Market Feeling: BULLISH 🐂
Slow coin. Sudden spark. I'm watching volume, not hype.
If volume dies, I'm out. Simple.
⚠️ No volume = no trade. Wait for it.
Follow for more 📲
Share with your trading fam 🔁
$HOT
I'm not ignoring this tape. Biggest short burn on the board.
HOT shorts paid $4.9K at $0.00056. Momentum is awake. 💥
💰 Price Now: $0.00056
📊 24H Change: ___%
🟢 BUY ZONE: $0.000548 – $0.000556
🎯 Target 1: $0.000575
🎯 Target 2: $0.000595
🎯 Target 3: $0.000620
🛑 Stop-Loss: $0.000535
🧱 Support: $0.000550 / $0.000535
🧊 Resistance: $0.000575 / $0.000600
🌡️ Market Feeling: BULLISH 🐂
Slow coin. Sudden spark. I'm watching volume, not hype.
If volume dies, I'm out. Simple.
⚠️ No volume = no trade. Wait for it.
Follow for more 📲
Share with your trading fam 🔁
$HOT
208
🔥 HUMA — SMALL COIN, LOUD MOVE 🔥
I'm seeing shorts wiped at $0.01965 ($1.87K gone).
Cheap coins move fast when bears panic. Don't blink. 👀
💰 Price Now: $0.01965
📊 24H Change: ___%
🟢 BUY ZONE: $0.01920 – $0.01950
🎯 Target 1: $0.02020
🎯 Target 2: $0.02100
🎯 Target 3: $0.02200
🛑 Stop-Loss: $0.01875
🧱 Support: $0.01920 / $0.01880
🧊 Resistance: $0.02020 / $0.02100
🌡️ Market Feeling: BULLISH 🐂
Buyers are stepping in quiet. That's how runs start.
I'm early. Not late. That's the whole game.
⚠️ Low cap = wild swings. Use a stop. Always.
Follow for more 📲
Share with your trading fam 🔁
$HUMA
{future}(HUMAUSDT)
🔥 HUMA — SMALL COIN, LOUD MOVE 🔥
I'm seeing shorts wiped at $0.01965 ($1.87K gone).
Cheap coins move fast when bears panic. Don't blink. 👀
💰 Price Now: $0.01965
📊 24H Change: ___%
🟢 BUY ZONE: $0.01920 – $0.01950
🎯 Target 1: $0.02020
🎯 Target 2: $0.02100
🎯 Target 3: $0.02200
🛑 Stop-Loss: $0.01875
🧱 Support: $0.01920 / $0.01880
🧊 Resistance: $0.02020 / $0.02100
🌡️ Market Feeling: BULLISH 🐂
Buyers are stepping in quiet. That's how runs start.
I'm early. Not late. That's the whole game.
⚠️ Low cap = wild swings. Use a stop. Always.
Follow for more 📲
Share with your trading fam 🔁
$HUMA
I'm seeing shorts wiped at $0.01965 ($1.87K gone).
Cheap coins move fast when bears panic. Don't blink. 👀
💰 Price Now: $0.01965
📊 24H Change: ___%
🟢 BUY ZONE: $0.01920 – $0.01950
🎯 Target 1: $0.02020
🎯 Target 2: $0.02100
🎯 Target 3: $0.02200
🛑 Stop-Loss: $0.01875
🧱 Support: $0.01920 / $0.01880
🧊 Resistance: $0.02020 / $0.02100
🌡️ Market Feeling: BULLISH 🐂
Buyers are stepping in quiet. That's how runs start.
I'm early. Not late. That's the whole game.
⚠️ Low cap = wild swings. Use a stop. Always.
Follow for more 📲
Share with your trading fam 🔁
$HUMA
103
🚨 ENA — SHORTS JUST GOT BURNED 🚨
I'm watching this one close. Shorts lost $2.76K at $0.17149.
That pain? That's fuel. 🔥
💰 Price Now: $0.1715
📊 24H Change: ___%
🟢 BUY ZONE: $0.1680 – $0.1705
🎯 Target 1: $0.1760
🎯 Target 2: $0.1820
🎯 Target 3: $0.1900
🛑 Stop-Loss: $0.1645
🧱 Support: $0.1680 / $0.1640
🧊 Resistance: $0.1760 / $0.1820
🌡️ Market Feeling: BULLISH 🐂
Bears tried to push it down. They got squeezed instead.
I'm buying the dip, not the fear.
⚠️ Small size. Protect your bag first.
Follow for more 📲
Share with your trading fam 🔁
$ENA
{future}(ENAUSDT)
🚨 ENA — SHORTS JUST GOT BURNED 🚨
I'm watching this one close. Shorts lost $2.76K at $0.17149.
That pain? That's fuel. 🔥
💰 Price Now: $0.1715
📊 24H Change: ___%
🟢 BUY ZONE: $0.1680 – $0.1705
🎯 Target 1: $0.1760
🎯 Target 2: $0.1820
🎯 Target 3: $0.1900
🛑 Stop-Loss: $0.1645
🧱 Support: $0.1680 / $0.1640
🧊 Resistance: $0.1760 / $0.1820
🌡️ Market Feeling: BULLISH 🐂
Bears tried to push it down. They got squeezed instead.
I'm buying the dip, not the fear.
⚠️ Small size. Protect your bag first.
Follow for more 📲
Share with your trading fam 🔁
$ENA
I'm watching this one close. Shorts lost $2.76K at $0.17149.
That pain? That's fuel. 🔥
💰 Price Now: $0.1715
📊 24H Change: ___%
🟢 BUY ZONE: $0.1680 – $0.1705
🎯 Target 1: $0.1760
🎯 Target 2: $0.1820
🎯 Target 3: $0.1900
🛑 Stop-Loss: $0.1645
🧱 Support: $0.1680 / $0.1640
🧊 Resistance: $0.1760 / $0.1820
🌡️ Market Feeling: BULLISH 🐂
Bears tried to push it down. They got squeezed instead.
I'm buying the dip, not the fear.
⚠️ Small size. Protect your bag first.
Follow for more 📲
Share with your trading fam 🔁
$ENA
84
$MRVL swept short liquidations at $175.61, indicating strong upward momentum.
Demand continues supporting current price action after the breakout retest.
EP
$172.50 - $176.00
TP
$185.00
$198.50
$215.00
SL
$166.00
Price remains above a key support area despite recent weakness. A reclaim of nearby resistance could trigger expansion toward higher targets.
Let’s go $MRVL
{future}(MRVLUSDT)
$MRVL swept short liquidations at $175.61, indicating strong upward momentum.
Demand continues supporting current price action after the breakout retest.
EP
$172.50 - $176.00
TP
$185.00
$198.50
$215.00
SL
$166.00
Price remains above a key support area despite recent weakness. A reclaim of nearby resistance could trigger expansion toward higher targets.
Let’s go $MRVL
Demand continues supporting current price action after the breakout retest.
EP
$172.50 - $176.00
TP
$185.00
$198.50
$215.00
SL
$166.00
Price remains above a key support area despite recent weakness. A reclaim of nearby resistance could trigger expansion toward higher targets.
Let’s go $MRVL
49
$SNDK triggered short liquidations at $1110.39, confirming strong buying pressure.
Demand continues supporting current price action following the resistance breakout.
EP
$1085.00 - $1115.00
TP
$1180.00
$1250.00
$1340.00
SL
$1040.00
Price remains above a key support area despite recent weakness. A reclaim of nearby resistance could trigger expansion toward higher targets.
Let’s go $SNDK
{future}(SNDKUSDT)
$SNDK triggered short liquidations at $1110.39, confirming strong buying pressure.
Demand continues supporting current price action following the resistance breakout.
EP
$1085.00 - $1115.00
TP
$1180.00
$1250.00
$1340.00
SL
$1040.00
Price remains above a key support area despite recent weakness. A reclaim of nearby resistance could trigger expansion toward higher targets.
Let’s go $SNDK
Demand continues supporting current price action following the resistance breakout.
EP
$1085.00 - $1115.00
TP
$1180.00
$1250.00
$1340.00
SL
$1040.00
Price remains above a key support area despite recent weakness. A reclaim of nearby resistance could trigger expansion toward higher targets.
Let’s go $SNDK
50
Log in to explore more content
Join global crypto users on Binance Square
⚡️ Get latest and useful information about crypto.
💬 Trusted by the world’s largest crypto exchange.
👍 Discover real insights from verified creators.
Email / Phone number
Trending Topics
NvidiaInvestigatesAfterHuang’sAffairApology
108,011 views
1,177 Discussing
Nvidia Board Opens Probe Into Whether Huang Was Target of Foreign Intelligence Effort
Binance News
·13 Likes
·47k views
BitcoinFiveWeeklyLosses
135,186 views
1,646 Discussing
AIChipSlumpNasdaq
69,977 views
1,021 Discussing