

Blockchain Matrix
13.2k Posts

Blockchain Matrix
Report
Block User
Crypto Trader | 5 Years Experience | Sharing signals and market insights | Twitter/X :@B_Matrix1
Open Trade
Frequent Trader
3.6 Years
111 Following
17.2K+ Followers
17.2K+ Liked
Posts
Portfolio
All
Quotes
Live
PINNED
10K FOLLOWERS STRONG – THANK YOU BINANCE FAMILY!
Reaching 10,000+ followers on Binance is not just a milestone, it’s a community achievement. Every trade idea, every analysis, and every discussion has been powered by your support and engagement.
This journey is just getting started — bigger signals, deeper analysis, and stronger market insights are coming your way.
Here’s to building, trading, and growing together. 🚀
#Binance
#CryptoCommunity
#Milestone
#Write2Earn


11
7
37
198
·
--
Bullish
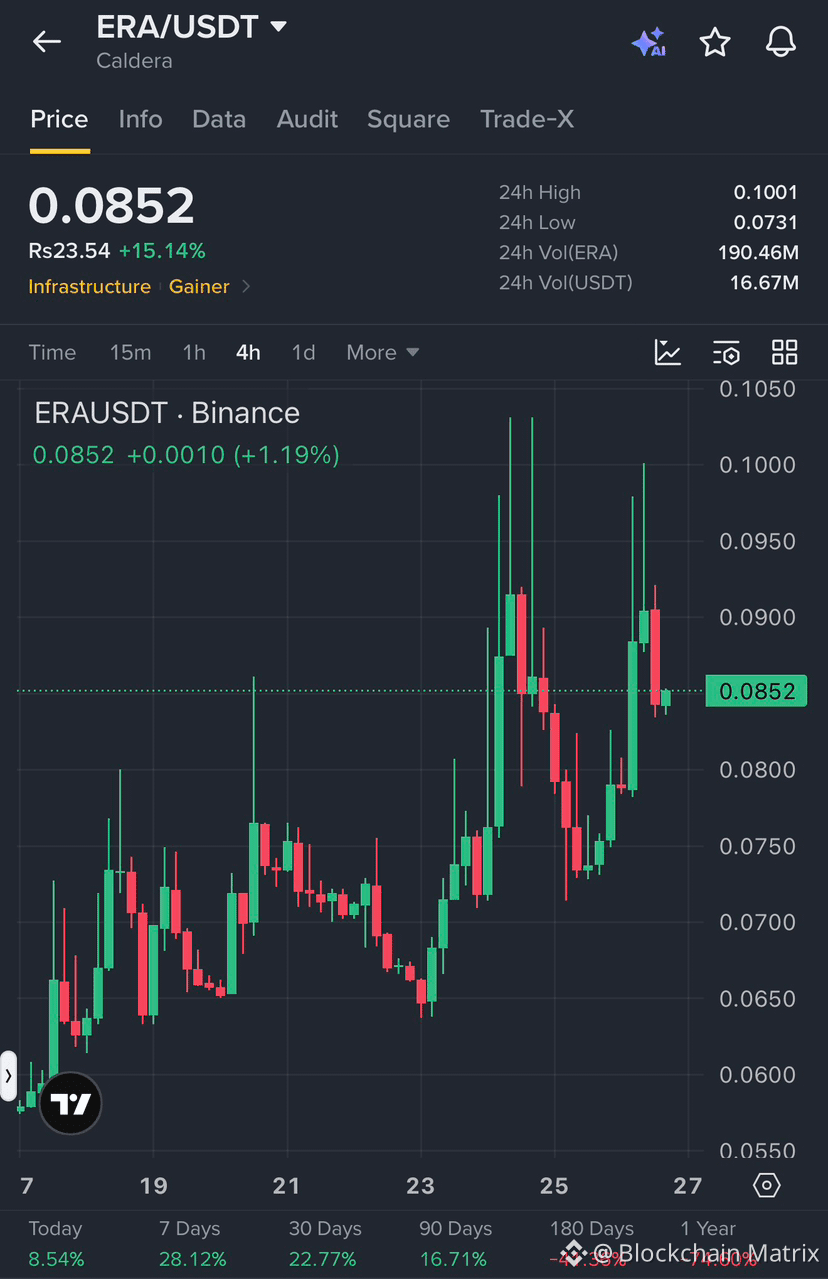
$ERA /USDT — BULLISH SETUP🔥💥
Entry Range: 0.0835–0.0852 Stop Loss: 0.0805
Targets (TP1–TP3):
* TP1: 0.0890
* TP2: 0.0930
* TP3: 0.1000
$ERA is attempting to recover after a pullback from the 0.0900–0.0920 resistance zone. Price is holding near 0.0850, but repeated upper wicks indicate strong selling pressure at higher levels. A breakout above 0.0900 could open the way toward 0.0950–0.1000.
Invalidation: Below 0.0805.
{spot}(ERAUSDT)
$ERA /USDT — BULLISH SETUP🔥💥
Entry Range: 0.0835–0.0852 Stop Loss: 0.0805
Targets (TP1–TP3):
* TP1: 0.0890
* TP2: 0.0930
* TP3: 0.1000
$ERA is attempting to recover after a pullback from the 0.0900–0.0920 resistance zone. Price is holding near 0.0850, but repeated upper wicks indicate strong selling pressure at higher levels. A breakout above 0.0900 could open the way toward 0.0950–0.1000.
Invalidation: Below 0.0805.
105
·
--
Bullish
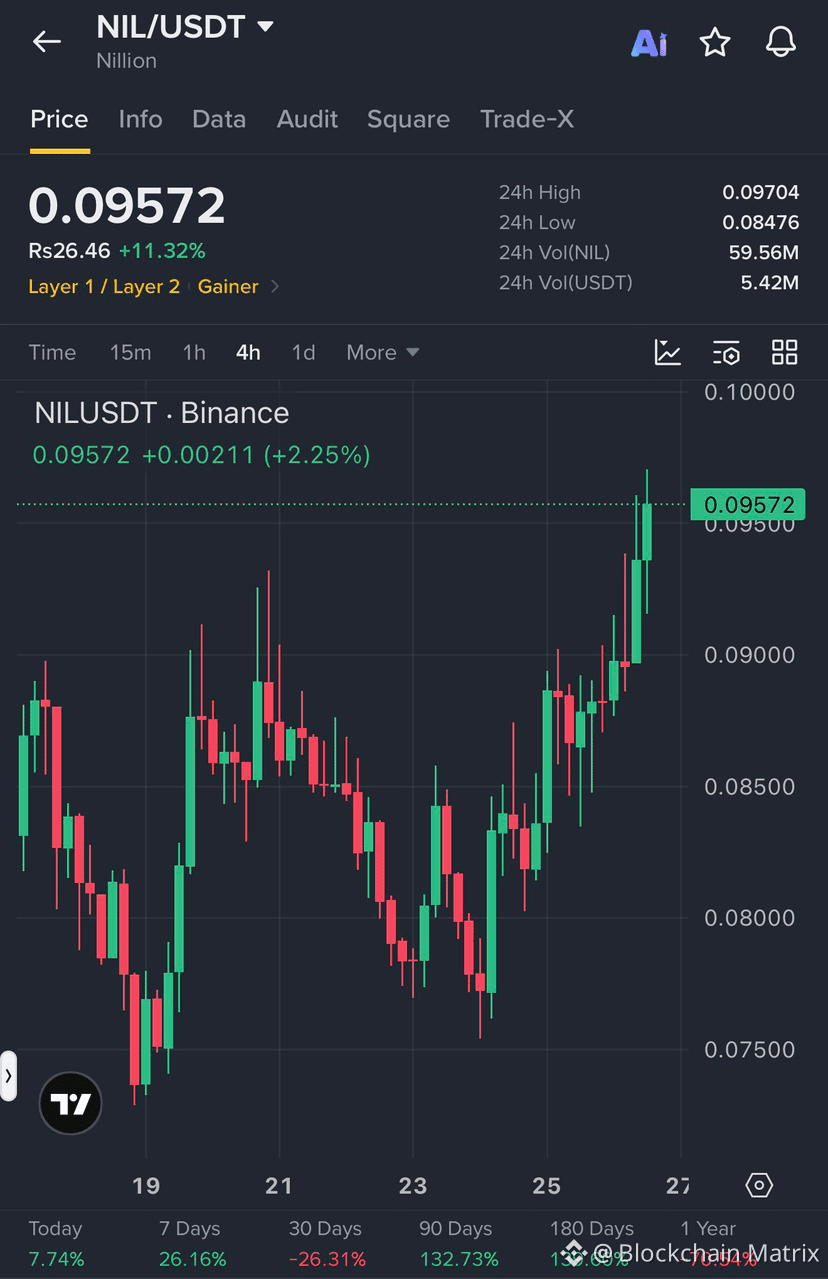
$NIL /USDT — BULLISH SETUP🔥💥
Entry Range: 0.09350–0.09500 Stop Loss: 0.09150
Targets (TP1–TP3):
* TP1: 0.09700
* TP2: 0.09900
* TP3: 0.10200
$NIL is showing strong bullish momentum after breaking above the 0.09000 resistance zone. Price is approaching 0.09700 resistance following a sharp rally. A confirmed breakout could extend the move, but a pullback toward the entry zone is possible after this strong upward candle.
Invalidation: Below 0.09150.
{spot}(NILUSDT)
$NIL /USDT — BULLISH SETUP🔥💥
Entry Range: 0.09350–0.09500 Stop Loss: 0.09150
Targets (TP1–TP3):
* TP1: 0.09700
* TP2: 0.09900
* TP3: 0.10200
$NIL is showing strong bullish momentum after breaking above the 0.09000 resistance zone. Price is approaching 0.09700 resistance following a sharp rally. A confirmed breakout could extend the move, but a pullback toward the entry zone is possible after this strong upward candle.
Invalidation: Below 0.09150.
2
150
·
--
Bullish
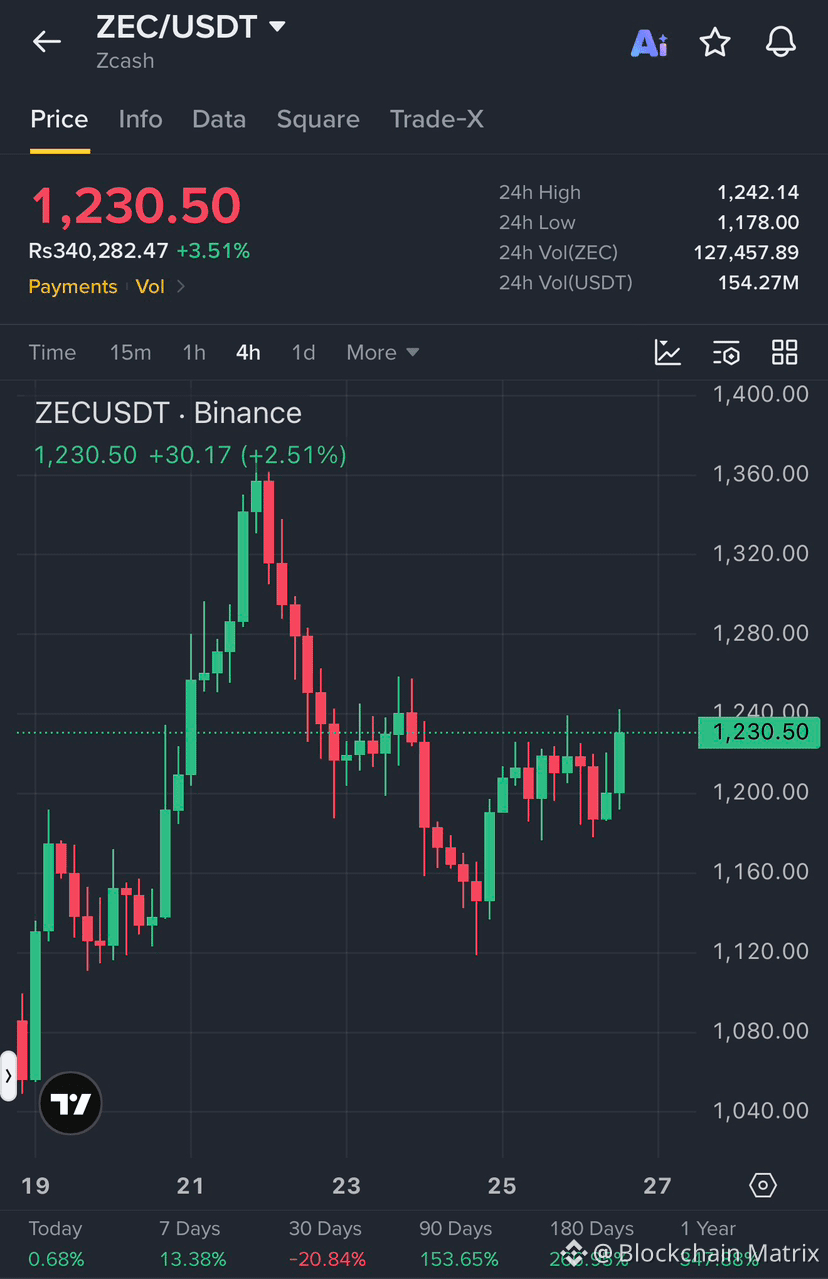
$ZEC LONG TRADE SIGNAL🔥💥
Pair: ZEC/USDT
Entry Zone: $1,220–$1,232
Stop Loss (SL): $1,195
Take Profit Targets:
* TP1: $1,250
* TP2: $1,275
* TP3: $1,300
Technical Analysis: $ZEC is showing a recovery on the 4H chart after bouncing from the $1,150 support area. The latest bullish candle indicates renewed buying pressure, with resistance near $1,240–$1,250. A confirmed breakout above this zone could support further upside, while rejection may trigger a pullback toward $1,200.
Market Outlook: Cautiously bullish while price holds above $1,200. Watch for a confirmed breakout and manage risk carefully.
#ZEC #Zcash #CryptoSignals #TechnicalAnalysis #Binance
1
104
·
--
Bullish
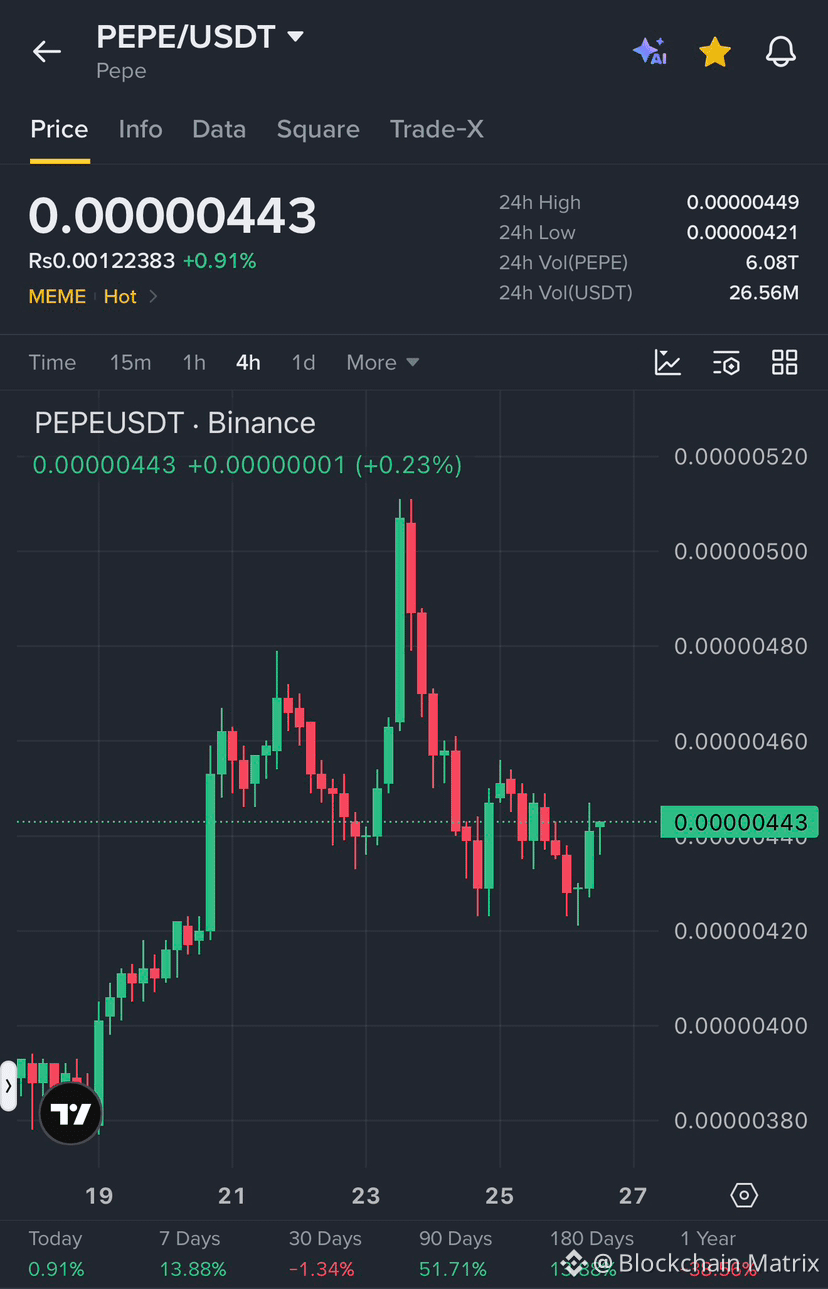
$PEPE /USDT — BULLISH SETUP🔥💥
Entry Range: 0.00000440–0.00000444 Stop Loss: 0.00000428
Targets (TP1–TP3):
* TP1: 0.00000455
* TP2: 0.00000465
* TP3: 0.00000480
$PEPE is attempting a recovery after bouncing from the 0.00000422 support zone. Price is holding near 0.00000443, but resistance remains around 0.00000450–0.00000460. A confirmed breakout could strengthen bullish momentum toward the next targets.
Invalidation: Below 0.00000428.
{spot}(PEPEUSDT)
$PEPE /USDT — BULLISH SETUP🔥💥
Entry Range: 0.00000440–0.00000444 Stop Loss: 0.00000428
Targets (TP1–TP3):
* TP1: 0.00000455
* TP2: 0.00000465
* TP3: 0.00000480
$PEPE is attempting a recovery after bouncing from the 0.00000422 support zone. Price is holding near 0.00000443, but resistance remains around 0.00000450–0.00000460. A confirmed breakout could strengthen bullish momentum toward the next targets.
Invalidation: Below 0.00000428.
1
102
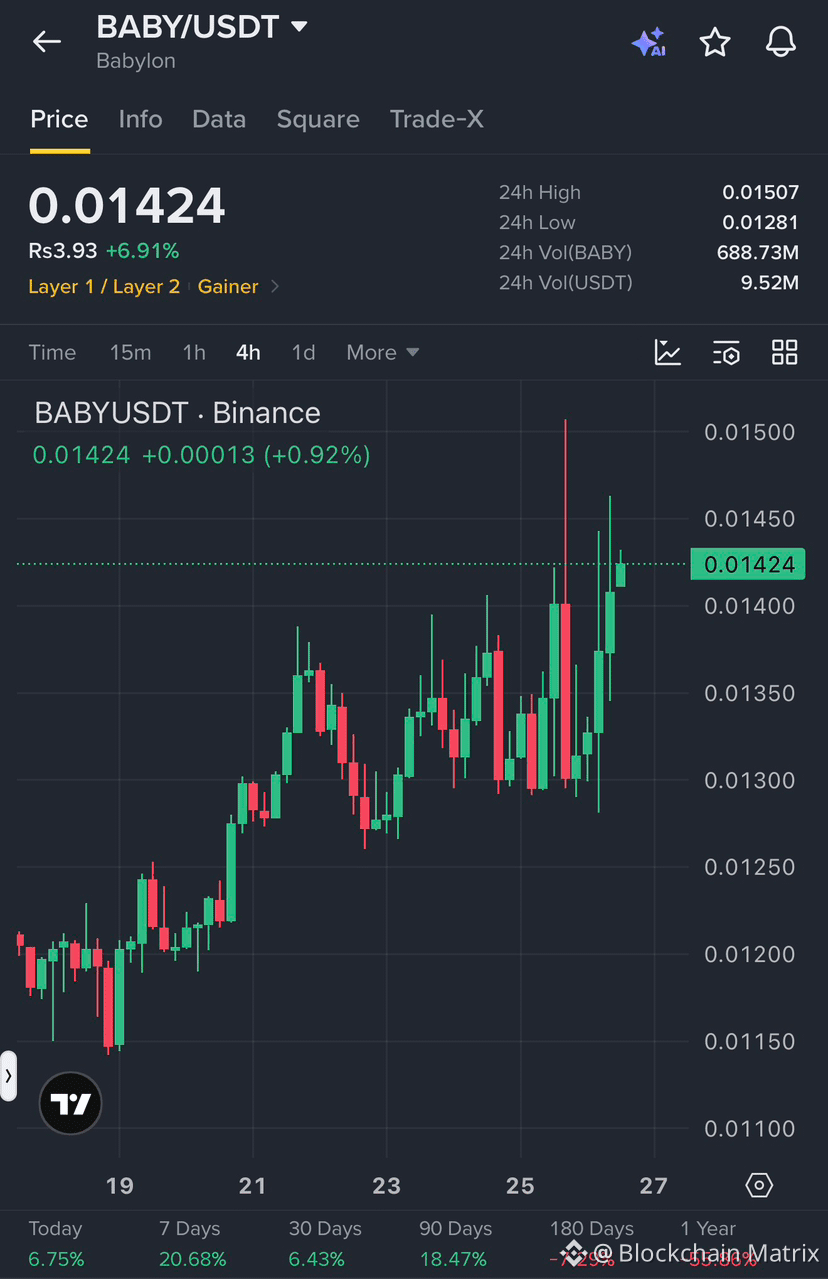
$BABY /USDT — BULLISH SETUP🔥💥
Entry Range: 0.01410–0.01425 Stop Loss: 0.01380
Targets (TP1–TP3):
* TP1: 0.01450
* TP2: 0.01480
* TP3: 0.01500
$BABY is showing bullish momentum with a series of higher moves on the 4H chart. Price is testing resistance near 0.01450, while the recent wick toward 0.01500 shows selling pressure at higher levels. A confirmed breakout could open the way toward 0.01500 and beyond.
Invalidation: Below 0.01380.
{spot}(BABYUSDT)
$BABY /USDT — BULLISH SETUP🔥💥
Entry Range: 0.01410–0.01425 Stop Loss: 0.01380
Targets (TP1–TP3):
* TP1: 0.01450
* TP2: 0.01480
* TP3: 0.01500
$BABY is showing bullish momentum with a series of higher moves on the 4H chart. Price is testing resistance near 0.01450, while the recent wick toward 0.01500 shows selling pressure at higher levels. A confirmed breakout could open the way toward 0.01500 and beyond.
Invalidation: Below 0.01380.
187
#MatrixFamily listen to me carefully…
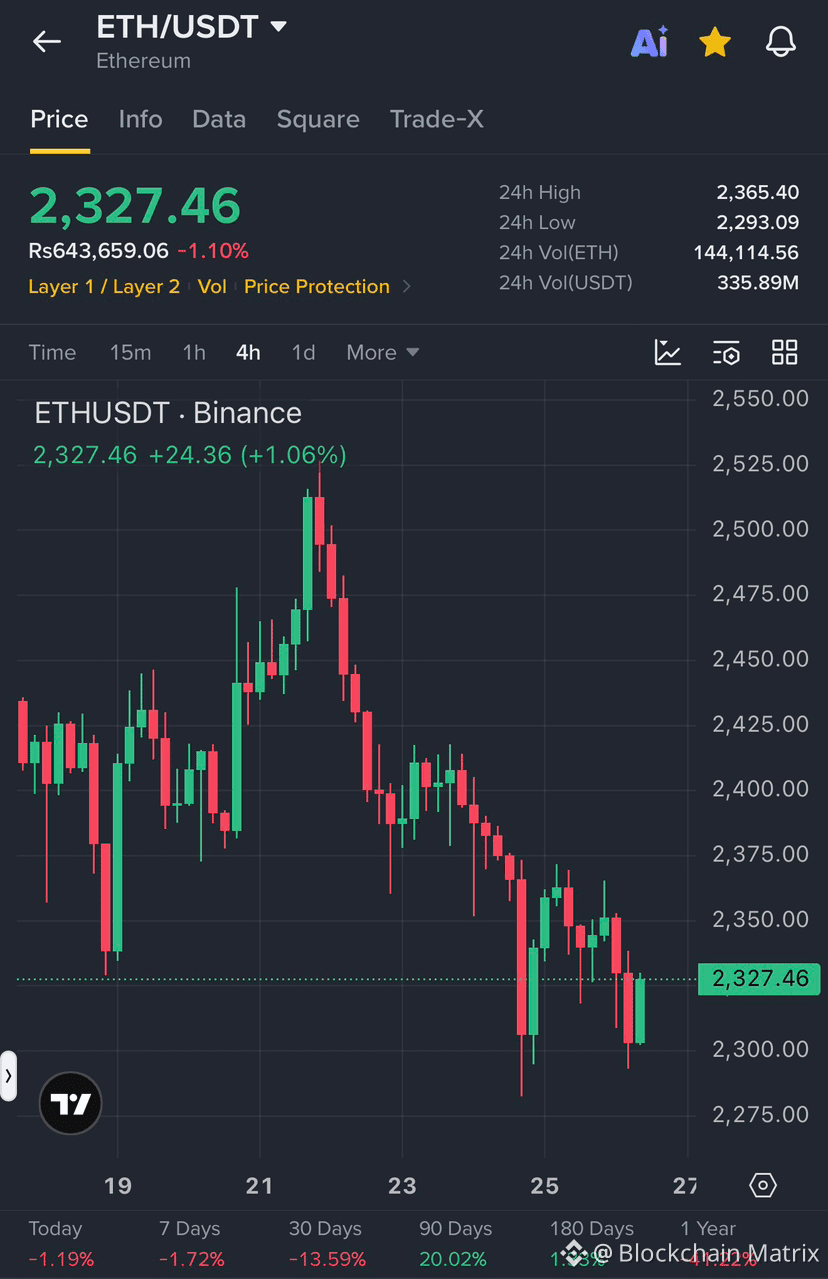
$ETH BULLISH RECOVERY SETUP: Buyers Are Defending the $2,300 Support Zone
Entry Range: $2,320 – $2,335
Stop Loss: $2,290
Targets:
TP1: $2,350
TP2: $2,375
TP3: $2,400
$ETH is attempting a short-term recovery after a strong bearish move on the 4-hour chart. Price has bounced from the $2,300 area, showing that buyers are trying to defend this important support zone.
If ETH holds above $2,300 and breaks through $2,350, bullish momentum could push the price toward $2,375 and $2,400. However, the overall trend remains bearish, so confirmation is important before considering a long entry.
Invalidation: A decisive breakdown below $2,290 would weaken the bullish recovery setup.
Wait for confirmation and manage risk carefully.
{spot}(ETHUSDT)
#MatrixFamily listen to me carefully…
$ETH BULLISH RECOVERY SETUP: Buyers Are Defending the $2,300 Support Zone
Entry Range: $2,320 – $2,335
Stop Loss: $2,290
Targets:
TP1: $2,350
TP2: $2,375
TP3: $2,400
$ETH is attempting a short-term recovery after a strong bearish move on the 4-hour chart. Price has bounced from the $2,300 area, showing that buyers are trying to defend this important support zone.
If ETH holds above $2,300 and breaks through $2,350, bullish momentum could push the price toward $2,375 and $2,400. However, the overall trend remains bearish, so confirmation is important before considering a long entry.
Invalidation: A decisive breakdown below $2,290 would weaken the bullish recovery setup.
Wait for confirmation and manage risk carefully.
134
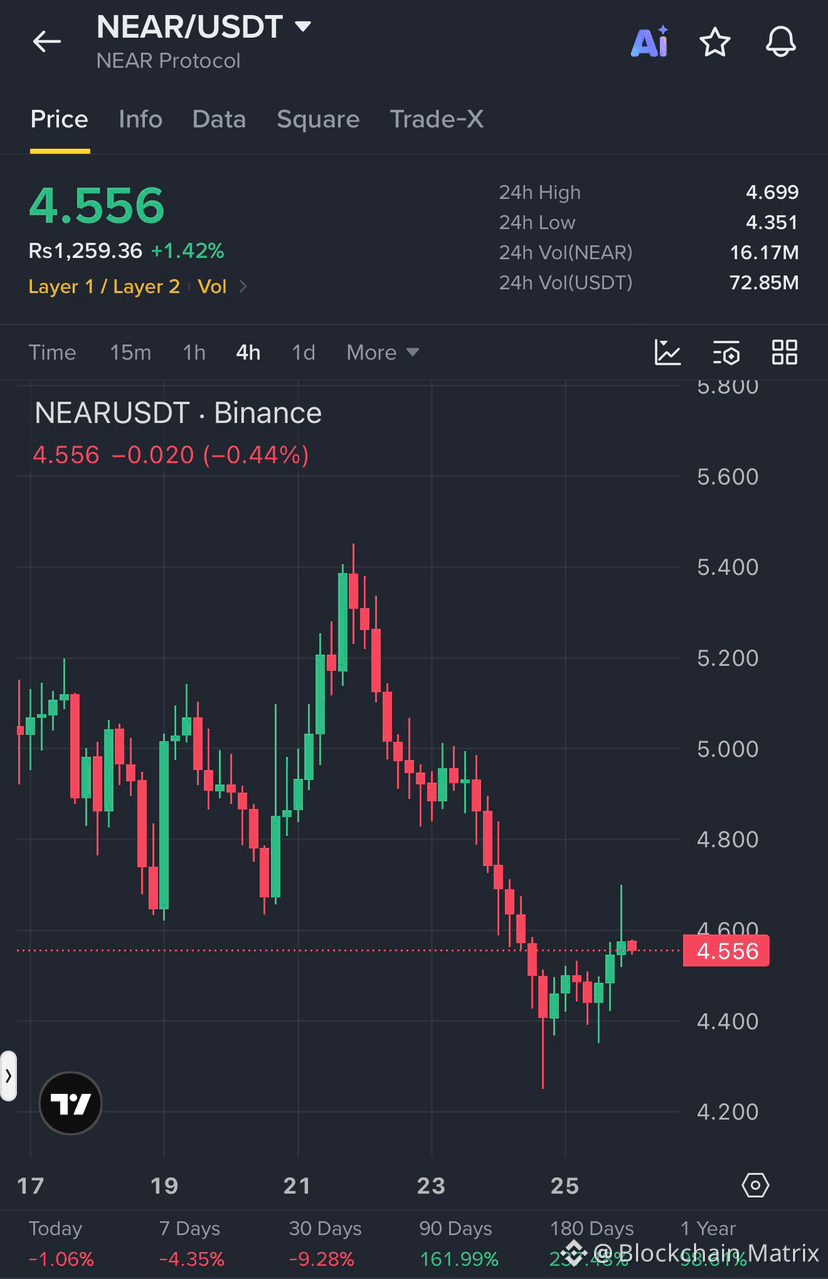
$NEAR /USDT — BEARISH SHORT SETUP🔥💥
Entry Range: 4.55–4.60 Stop Loss: 4.75
Targets (TP1–TP3):
* TP1: 4.45
* TP2: 4.35
* TP3: 4.22
$NEAR remains bearish on the 4H chart, with lower highs and lower lows following rejection near 5.40. The current bounce toward 4.60 is facing resistance. A confirmed rejection could push price back toward the 4.40 support zone.
Invalidation: 4H close above 4.75.
{spot}(NEARUSDT)
$NEAR /USDT — BEARISH SHORT SETUP🔥💥
Entry Range: 4.55–4.60 Stop Loss: 4.75
Targets (TP1–TP3):
* TP1: 4.45
* TP2: 4.35
* TP3: 4.22
$NEAR remains bearish on the 4H chart, with lower highs and lower lows following rejection near 5.40. The current bounce toward 4.60 is facing resistance. A confirmed rejection could push price back toward the 4.40 support zone.
Invalidation: 4H close above 4.75.
56
·
--
Bullish
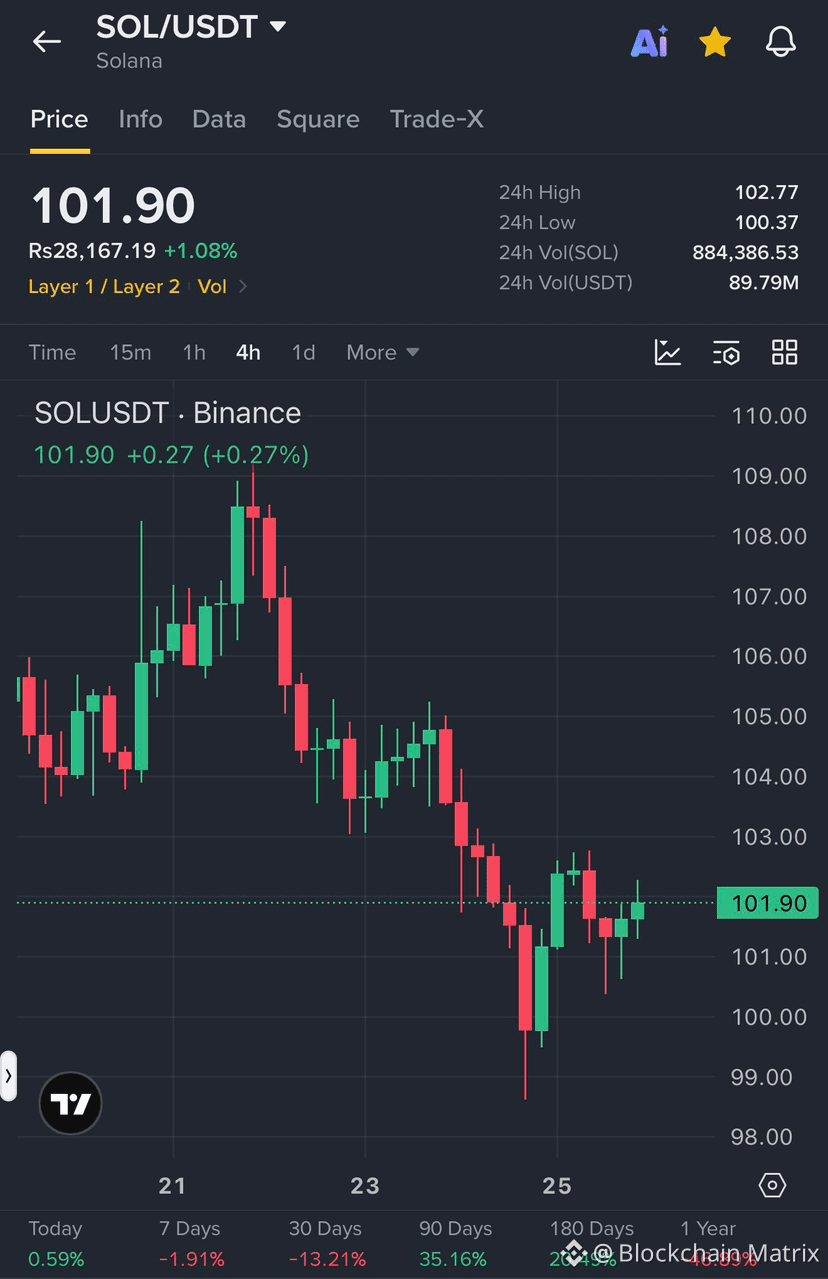
$SOL /USDT — BULLISH SETUP
Entry Range: 101.50–102.00 Stop Loss: 100.30
Targets (TP1–TP3):
* TP1: 102.80
* TP2: 103.80
* TP3: 105.00
$SOL is attempting a recovery after a sharp decline from the 108–109 zone. Buyers are defending the 100–101 support area, but the overall 4H structure remains under pressure. A breakout above 102.80 would strengthen the bullish case.
Invalidation: Below 100.30.
{spot}(SOLUSDT)
$SOL /USDT — BULLISH SETUP
Entry Range: 101.50–102.00 Stop Loss: 100.30
Targets (TP1–TP3):
* TP1: 102.80
* TP2: 103.80
* TP3: 105.00
$SOL is attempting a recovery after a sharp decline from the 108–109 zone. Buyers are defending the 100–101 support area, but the overall 4H structure remains under pressure. A breakout above 102.80 would strengthen the bullish case.
Invalidation: Below 100.30.
47
·
--
Bullish
#MatrixFamily listen to me carefully…..🔥💥
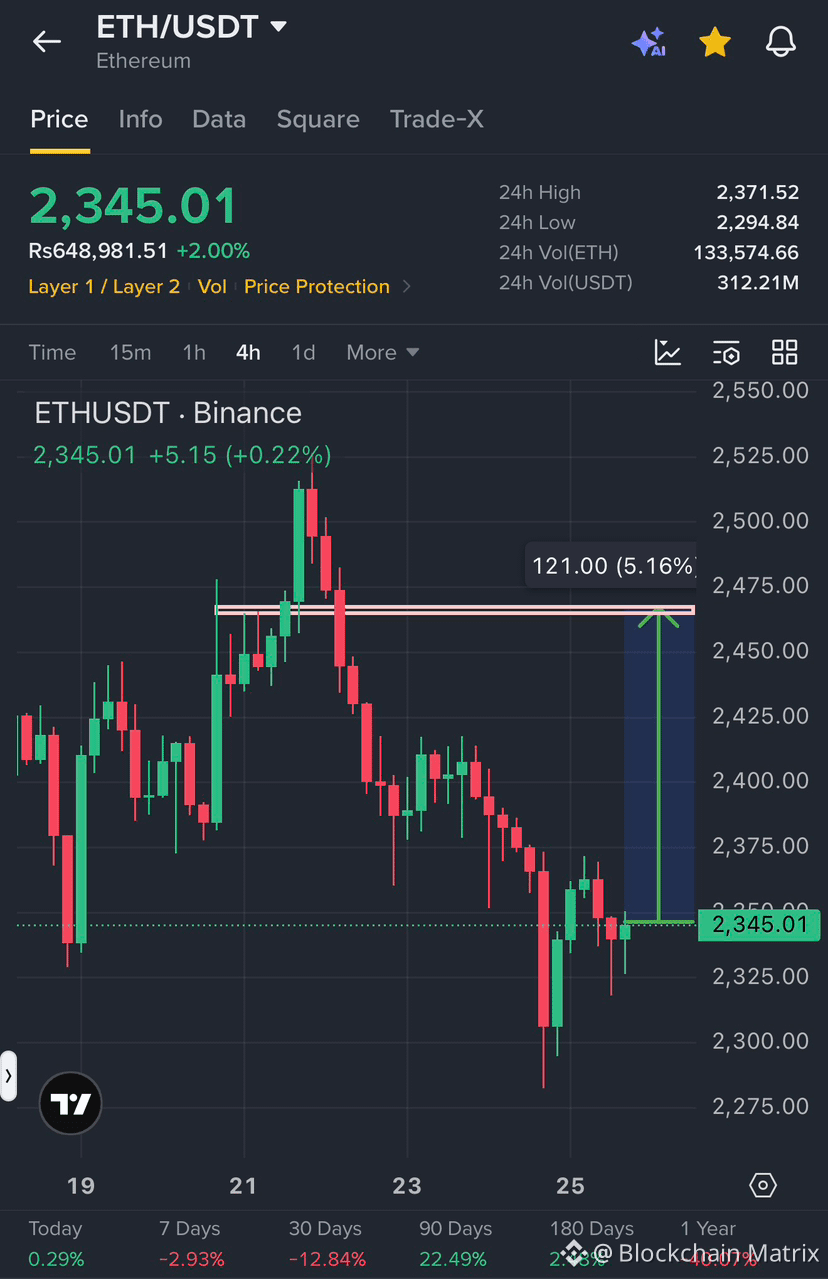
$ETH BULLISH RECOVERY SETUP – WATCH THIS KEY RESISTANCE
$ETH is trading around $2,345 after bouncing back from the $2,290–$2,300 support zone. Buyers are trying to regain control, but the 4H chart still shows a broader short-term downtrend.
Entry Range: $2,335–$2,350
Stop Loss: $2,315
Targets:
TP1: $2,375
TP2: $2,420
TP3: $2,465
Trade Analysis:
$ETH is showing signs of recovery after a sharp sell-off. If buyers maintain support above $2,330 and build bullish momentum, price could move toward $2,375 and then $2,420. The major resistance zone sits around $2,465–$2,470, where sellers previously took control.
A strong 4H close above $2,375 would improve the bullish outlook. However, rejection at resistance could trigger another move lower, so confirmation is important before entering.
Invalidation: A breakdown below $2,315 weakens this bullish setup and increases the risk of further downside.
Wait for confirmation and manage risk carefully. These levels are based on the provided chart, not a guaranteed outcome.
{spot}(ETHUSDT)
#MatrixFamily listen to me carefully…..🔥💥
$ETH BULLISH RECOVERY SETUP – WATCH THIS KEY RESISTANCE
$ETH is trading around $2,345 after bouncing back from the $2,290–$2,300 support zone. Buyers are trying to regain control, but the 4H chart still shows a broader short-term downtrend.
Entry Range: $2,335–$2,350
Stop Loss: $2,315
Targets:
TP1: $2,375
TP2: $2,420
TP3: $2,465
Trade Analysis:
$ETH is showing signs of recovery after a sharp sell-off. If buyers maintain support above $2,330 and build bullish momentum, price could move toward $2,375 and then $2,420. The major resistance zone sits around $2,465–$2,470, where sellers previously took control.
A strong 4H close above $2,375 would improve the bullish outlook. However, rejection at resistance could trigger another move lower, so confirmation is important before entering.
Invalidation: A breakdown below $2,315 weakens this bullish setup and increases the risk of further downside.
Wait for confirmation and manage risk carefully. These levels are based on the provided chart, not a guaranteed outcome.
84
·
--
Bullish
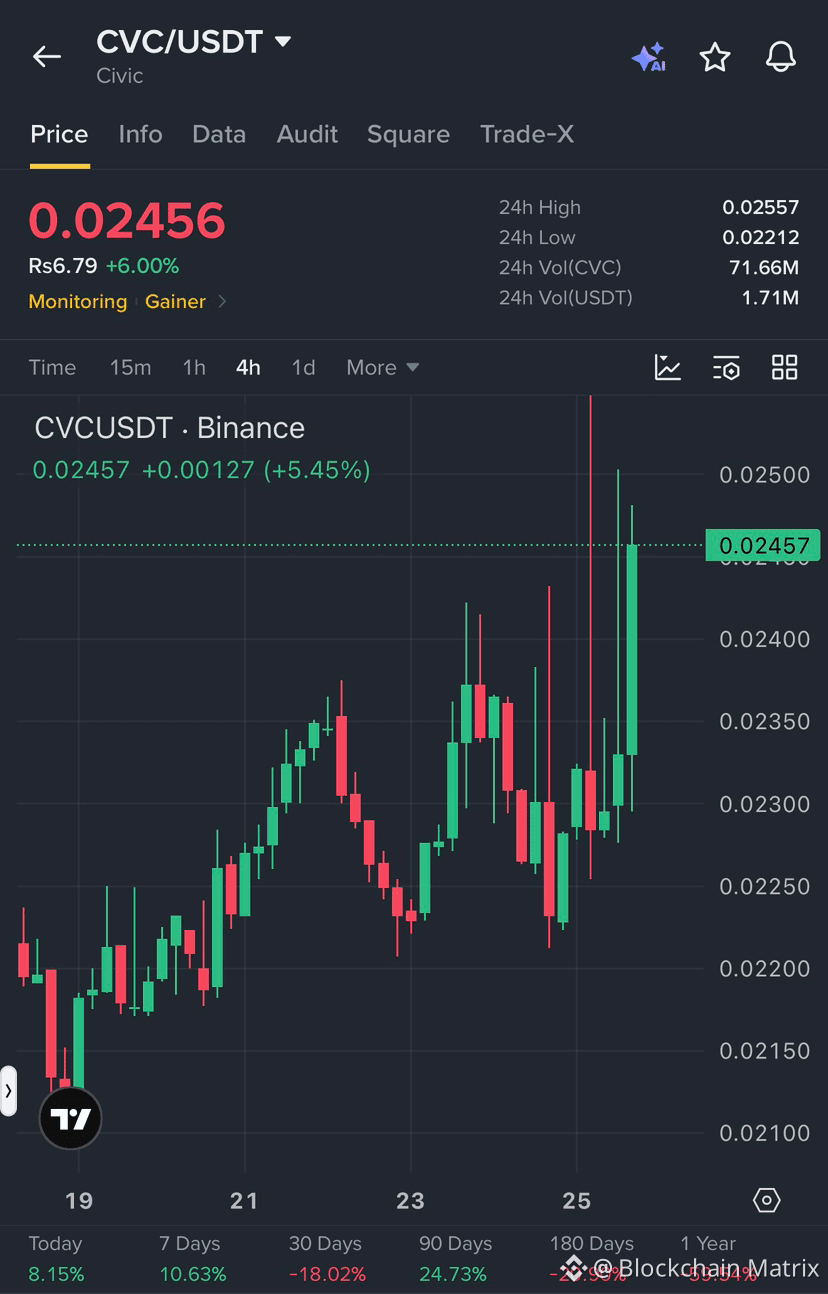
$CVC /USDT — BULLISH SETUP🔥💥
Entry Range: 0.02420–0.02455 Stop Loss: 0.02350
Targets (TP1–TP3):
* TP1: 0.02490
* TP2: 0.02550
* TP3: 0.02620
$CVC is showing strong bullish momentum after rebounding from the 0.02220 support zone. Price is approaching resistance around 0.02500–0.02557. A confirmed breakout could trigger another upward move, but the long wicks indicate volatility and potential rejection.
Invalidation: Below 0.02350.
{spot}(CVCUSDT)
$CVC /USDT — BULLISH SETUP🔥💥
Entry Range: 0.02420–0.02455 Stop Loss: 0.02350
Targets (TP1–TP3):
* TP1: 0.02490
* TP2: 0.02550
* TP3: 0.02620
$CVC is showing strong bullish momentum after rebounding from the 0.02220 support zone. Price is approaching resistance around 0.02500–0.02557. A confirmed breakout could trigger another upward move, but the long wicks indicate volatility and potential rejection.
Invalidation: Below 0.02350.
160
·
--
Bullish
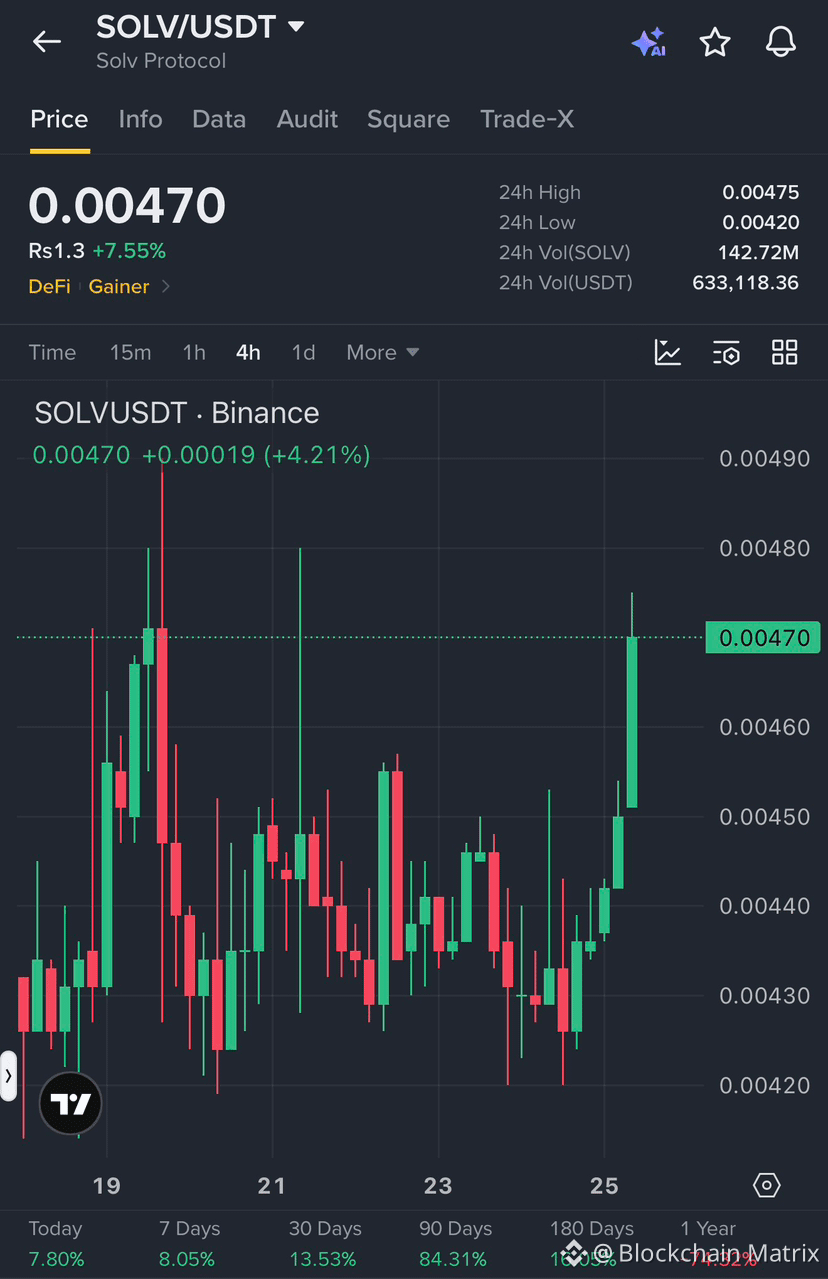
$SOLV /USDT — BULLISH SETUP🔥
Entry Range: 0.00462–0.00470 Stop Loss: 0.00448
Targets:
* TP1: 0.00478
* TP2: 0.00485
* TP3: 0.00495
$SOLV is showing strong bullish momentum after breaking above the 0.00450 resistance zone. Price is approaching 0.00475, so a confirmed breakout could open the door to further upside. Watch for rejection near resistance and avoid chasing a sharp candle.
Invalidation: Below 0.00448.
{spot}(SOLVUSDT)
$SOLV /USDT — BULLISH SETUP🔥
Entry Range: 0.00462–0.00470 Stop Loss: 0.00448
Targets:
* TP1: 0.00478
* TP2: 0.00485
* TP3: 0.00495
$SOLV is showing strong bullish momentum after breaking above the 0.00450 resistance zone. Price is approaching 0.00475, so a confirmed breakout could open the door to further upside. Watch for rejection near resistance and avoid chasing a sharp candle.
Invalidation: Below 0.00448.
77
·
--
Bullish
$SOLV /USDT — BULLISH SETUP🔥
Entry Range: 0.00462–0.00470 Stop Loss: 0.00448
Targets:
* TP1: 0.00478
* TP2: 0.00485
* TP3: 0.00495
$SOLV is showing strong bullish momentum after breaking above the 0.00450 resistance zone. Price is approaching 0.00475, so a confirmed breakout could open the door to further upside. Watch for rejection near resistance and avoid chasing a sharp candle.
Invalidation: Below 0.00448.
{spot}(SOLVUSDT)
$SOLV /USDT — BULLISH SETUP🔥
Entry Range: 0.00462–0.00470 Stop Loss: 0.00448
Targets:
* TP1: 0.00478
* TP2: 0.00485
* TP3: 0.00495
$SOLV is showing strong bullish momentum after breaking above the 0.00450 resistance zone. Price is approaching 0.00475, so a confirmed breakout could open the door to further upside. Watch for rejection near resistance and avoid chasing a sharp candle.
Invalidation: Below 0.00448.
Entry Range: 0.00462–0.00470 Stop Loss: 0.00448
Targets:
* TP1: 0.00478
* TP2: 0.00485
* TP3: 0.00495
$SOLV is showing strong bullish momentum after breaking above the 0.00450 resistance zone. Price is approaching 0.00475, so a confirmed breakout could open the door to further upside. Watch for rejection near resistance and avoid chasing a sharp candle.
Invalidation: Below 0.00448.
144
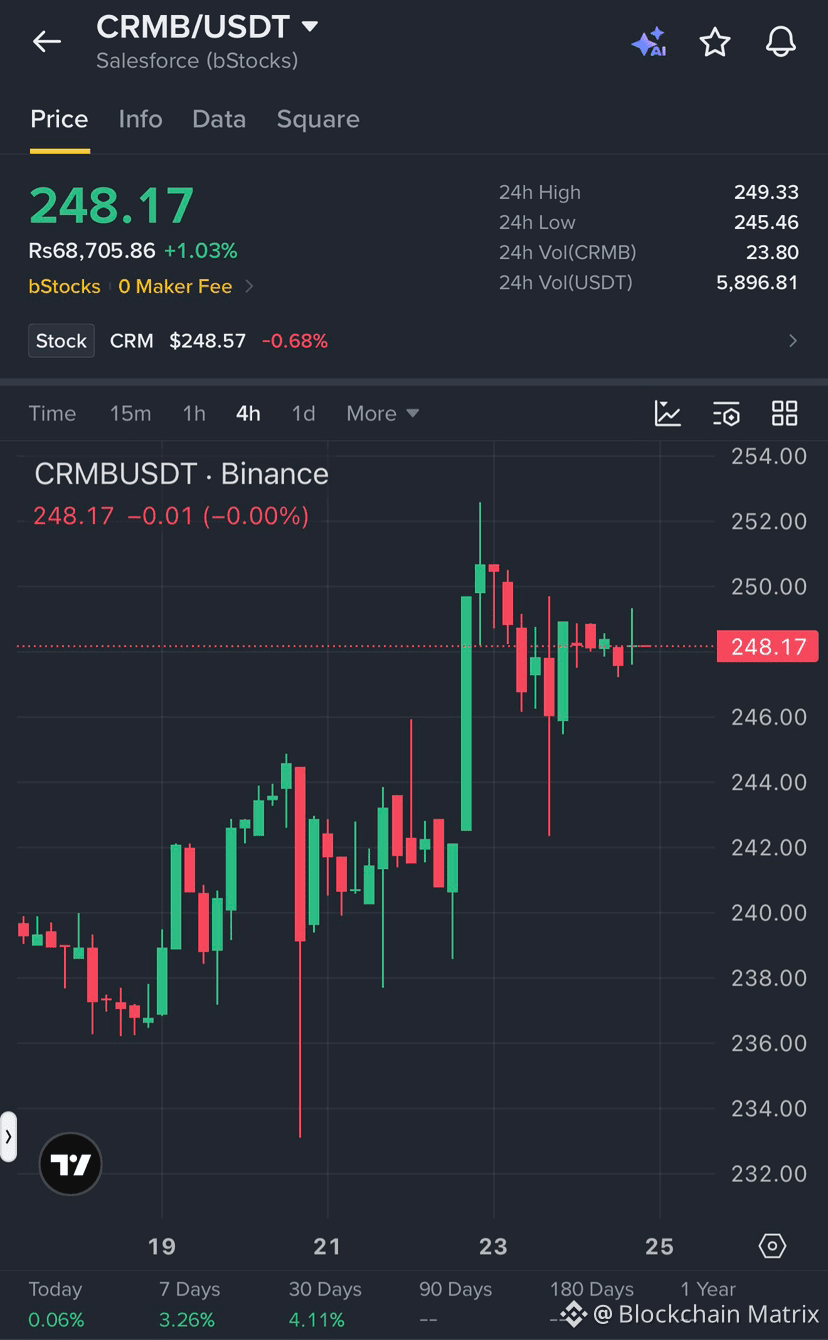
$CRMB SHORT TRADE SIGNAL💥🔥
Pair: $CRMB /USDT
Entry Zone: 248.00–248.80 Stop Loss (SL): 251.20
Take Profit Targets:
* TP1: 246.00
* TP2: 244.00
* TP3: 242.00
* TP4: 240.00
Market Analysis: CRMB faced rejection near the 250–252 resistance zone after a strong upward move. Price is consolidating around 248.17, suggesting weakening short-term momentum and potential downside pressure.
Market Outlook: Bearish below 250.00. A breakdown below 246.00 could accelerate selling toward lower support levels. A sustained move above resistance would weaken this short setup.
#CRMB #CRMBUSDT #CryptoSignals #ShortTrade #Binance
32
·
--
Bullish
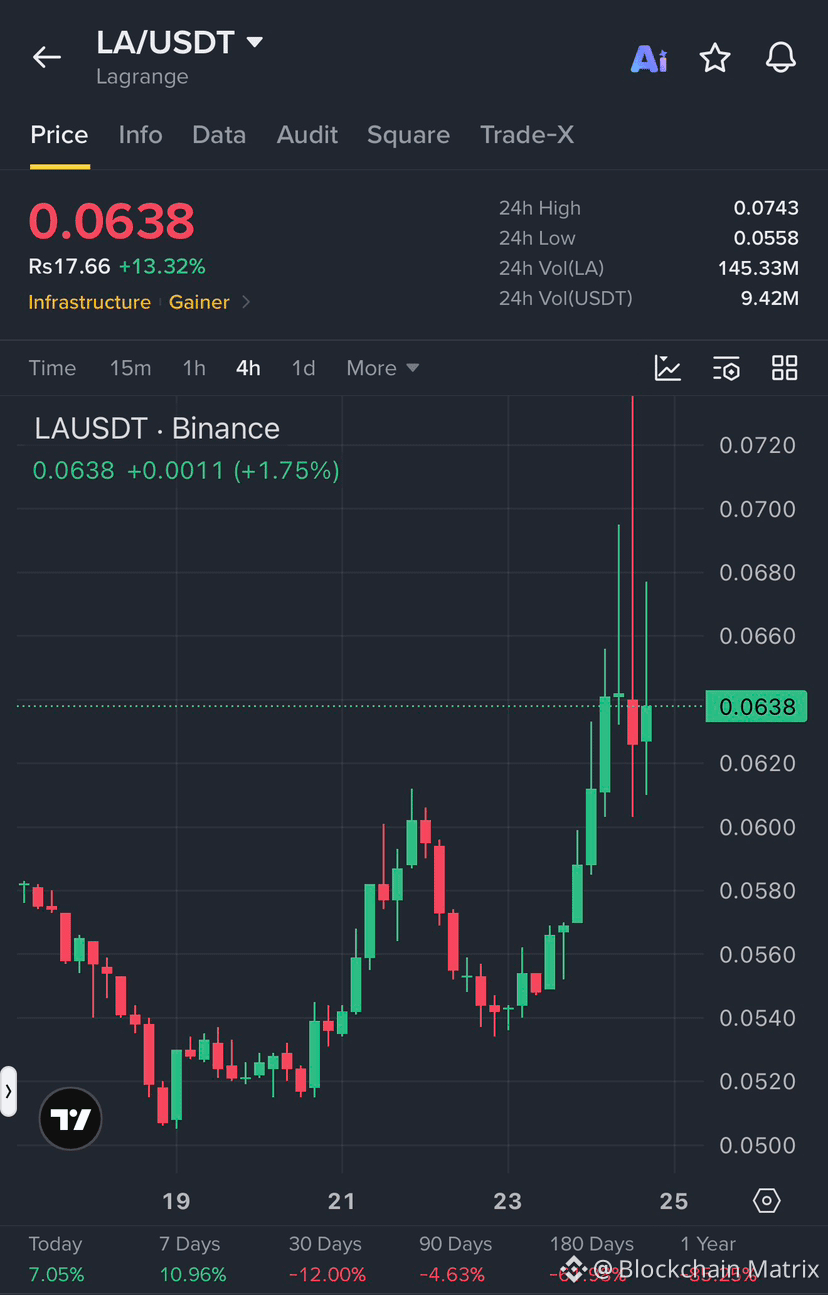
$LA /USDT — BULLISH SETUP🔥💥
Entry Range: 0.0625–0.0638 Stop Loss: 0.0600
Targets:
* TP1: 0.0660
* TP2: 0.0690
* TP3: 0.0730
$LA is showing strong bullish momentum after breaking above the 0.0600 resistance zone. However, the sharp upper wicks indicate selling pressure near 0.0700–0.0740. Holding above 0.0620 could support another move higher.
Invalidation: Below 0.0600.
{spot}(LAUSDT)
$LA /USDT — BULLISH SETUP🔥💥
Entry Range: 0.0625–0.0638 Stop Loss: 0.0600
Targets:
* TP1: 0.0660
* TP2: 0.0690
* TP3: 0.0730
$LA is showing strong bullish momentum after breaking above the 0.0600 resistance zone. However, the sharp upper wicks indicate selling pressure near 0.0700–0.0740. Holding above 0.0620 could support another move higher.
Invalidation: Below 0.0600.
180
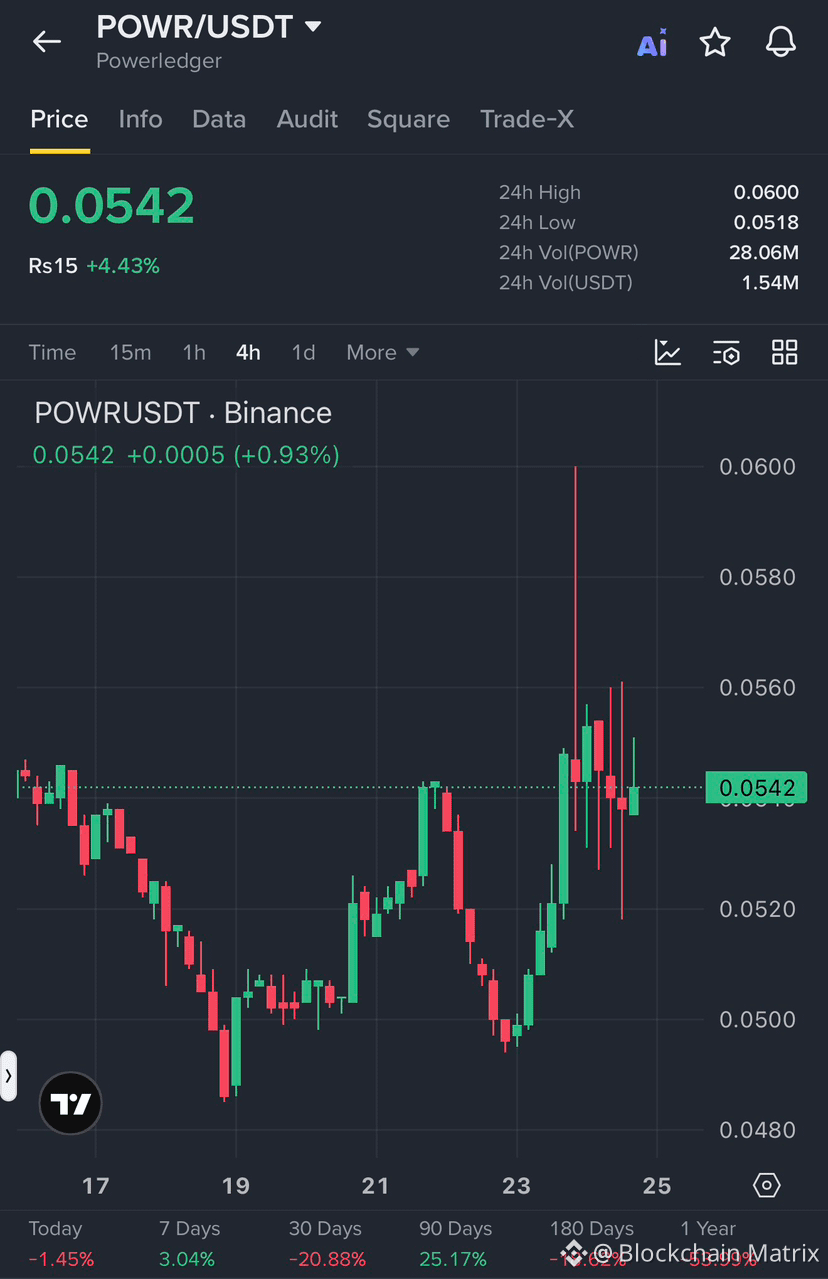
$POWR is waking up, but the candles are fighting for their lives.💥🔥
Bulls pushed it toward $0.0560, bears slapped it back, and now both sides are arguing over $0.0542.
Resistance: $0.0555–$0.0560
Support: $0.0520
A breakout could bring another leg up. A rejection? The bulls might need a vacation.
Crypto never sleeps. Neither does volatility.
#POWR #Crypto #Binance
Bulls pushed it toward $0.0560, bears slapped it back, and now both sides are arguing over $0.0542.
Resistance: $0.0555–$0.0560
Support: $0.0520
A breakout could bring another leg up. A rejection? The bulls might need a vacation.
Crypto never sleeps. Neither does volatility.
#POWR #Crypto #Binance
143
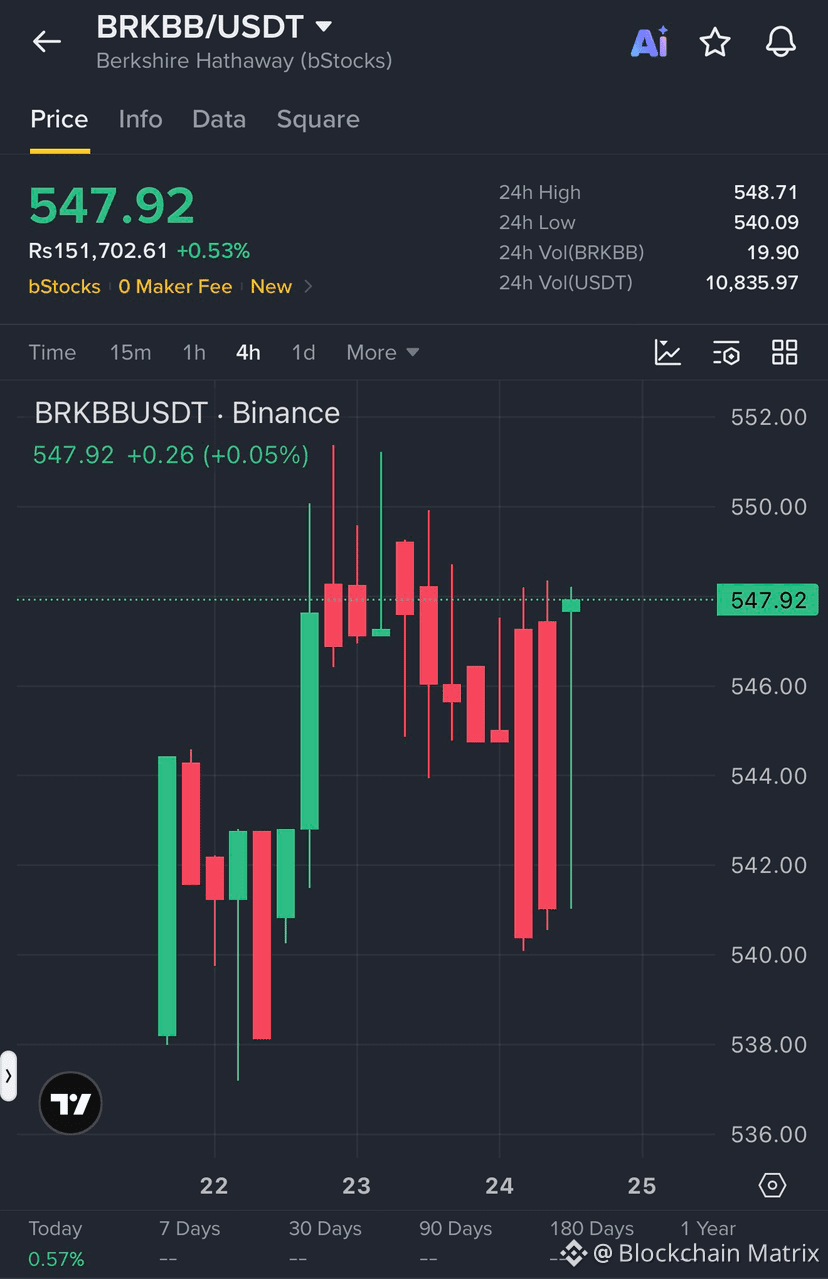
$BRKBB /USDT — BULLISH SETUP💥🔥
Entry Range: 546.50–548.00 Stop Loss: 543.80
Targets:
* TP1: 550.00
* TP2: 552.00
* TP3: 555.00
$BRKBB is showing a recovery after a sharp rejection near 540.00. Buyers have pushed price back toward 548.00 resistance. A confirmed breakout above this level could open the way toward 550.00–552.00, while rejection may trigger another pullback.
Invalidation: Below 543.80.
{spot}(BRKBBUSDT)
$BRKBB /USDT — BULLISH SETUP💥🔥
Entry Range: 546.50–548.00 Stop Loss: 543.80
Targets:
* TP1: 550.00
* TP2: 552.00
* TP3: 555.00
$BRKBB is showing a recovery after a sharp rejection near 540.00. Buyers have pushed price back toward 548.00 resistance. A confirmed breakout above this level could open the way toward 550.00–552.00, while rejection may trigger another pullback.
Invalidation: Below 543.80.
90
·
--
Bullish
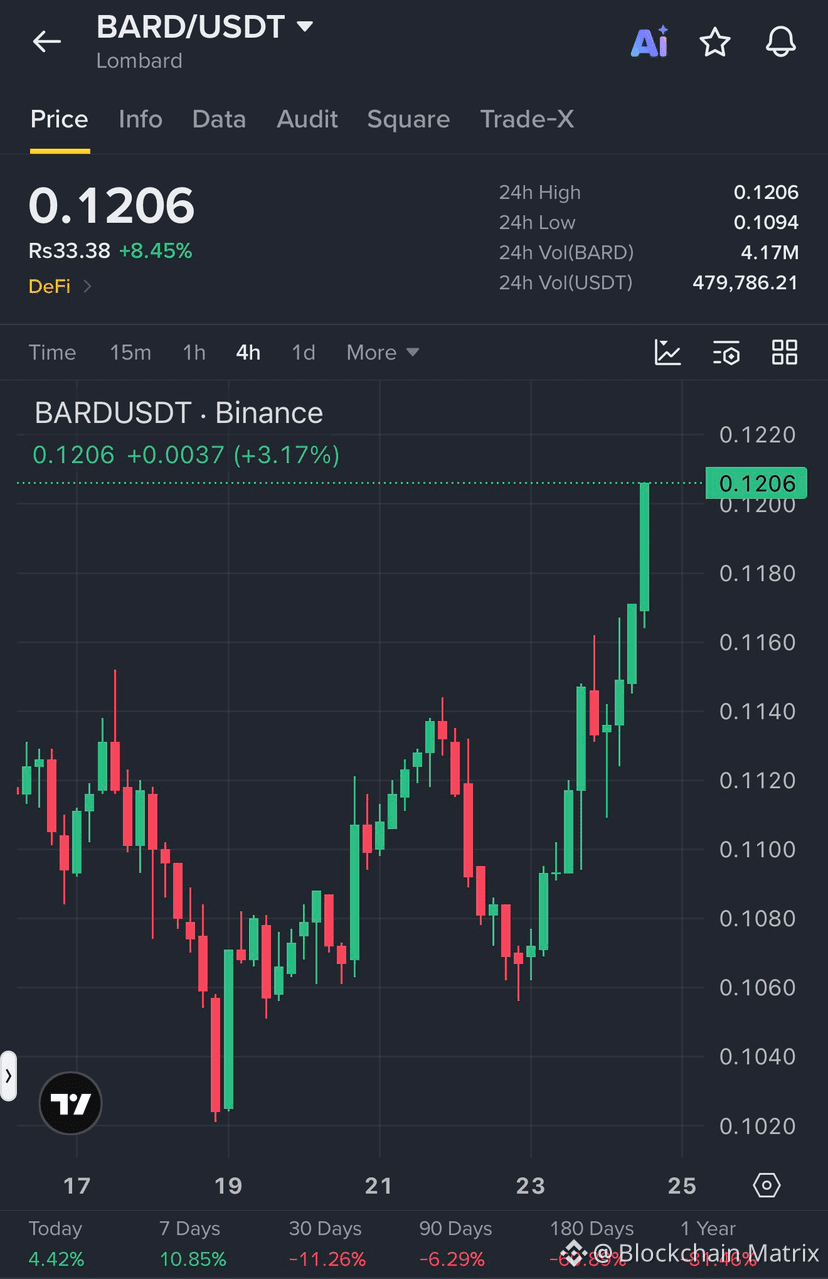
#MatrixFamily listen to me carefully… $BARD is showing strong bullish momentum on the 4H chart, but the next move is important.
$BARD Long Trade Setup
Entry Range: 0.1170 – 0.1190
Stop Loss: 0.1145
Targets:
TP1: 0.1220
TP2: 0.1250
TP3: 0.1290
$BARD is trading around 0.1206 after a strong upward move, breaking above previous resistance near 0.1170. Buyers are currently in control, and the recent green candles show increasing bullish momentum.
A pullback toward the entry zone could offer a better opportunity than chasing the current pump. If price holds above 0.1170 and maintains buying pressure, the next upside targets could come into play. However, rejection near the current high may trigger a short-term correction.
Invalidation: A 4H candle close below 0.1145 would weaken this bullish setup.
Always manage risk and wait for confirmation before entering.
{spot}(BARDUSDT)
#MatrixFamily listen to me carefully… $BARD is showing strong bullish momentum on the 4H chart, but the next move is important.
$BARD Long Trade Setup
Entry Range: 0.1170 – 0.1190
Stop Loss: 0.1145
Targets:
TP1: 0.1220
TP2: 0.1250
TP3: 0.1290
$BARD is trading around 0.1206 after a strong upward move, breaking above previous resistance near 0.1170. Buyers are currently in control, and the recent green candles show increasing bullish momentum.
A pullback toward the entry zone could offer a better opportunity than chasing the current pump. If price holds above 0.1170 and maintains buying pressure, the next upside targets could come into play. However, rejection near the current high may trigger a short-term correction.
Invalidation: A 4H candle close below 0.1145 would weaken this bullish setup.
Always manage risk and wait for confirmation before entering.
523
·
--
Bullish
#MatrixFamily listen to me carefully…..💥
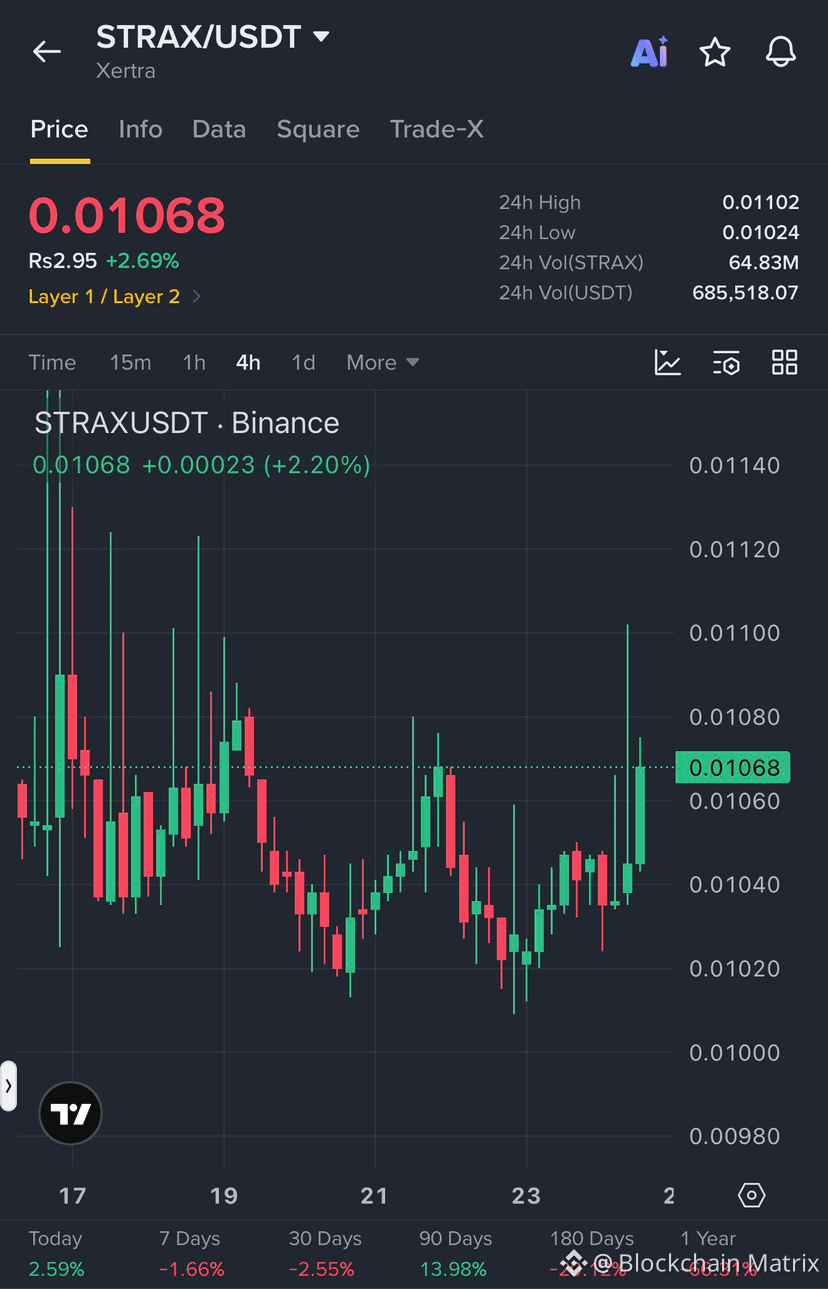
$STRAX is showing signs of a bullish recovery on the 4-hour chart after defending the $0.0102 support zone. Buyers are pushing the price back toward $0.0107, with a fresh green candle suggesting renewed buying interest.
$STRAX Bullish Trade Setup💥🔥
Entry Range: $0.01055–$0.01070
Stop Loss: $0.01020
TP1: $0.01080
TP2: $0.01100
TP3: $0.01120
The chart shows a recovery from recent lows, with price attempting to reclaim the $0.0106–$0.0107 area. However, the upper wicks indicate selling pressure near resistance, so confirmation is important before expecting another upward move.
If $STRAX holds above the entry zone and breaks through $0.01080 with strong buying volume, the next targets are $0.01100 and $0.01120. A rejection near resistance could send the price back toward $0.0104 support.
Invalidation Level: $0.01020
{spot}(STRAXUSDT)
#MatrixFamily listen to me carefully…..💥
$STRAX is showing signs of a bullish recovery on the 4-hour chart after defending the $0.0102 support zone. Buyers are pushing the price back toward $0.0107, with a fresh green candle suggesting renewed buying interest.
$STRAX Bullish Trade Setup💥🔥
Entry Range: $0.01055–$0.01070
Stop Loss: $0.01020
TP1: $0.01080
TP2: $0.01100
TP3: $0.01120
The chart shows a recovery from recent lows, with price attempting to reclaim the $0.0106–$0.0107 area. However, the upper wicks indicate selling pressure near resistance, so confirmation is important before expecting another upward move.
If $STRAX holds above the entry zone and breaks through $0.01080 with strong buying volume, the next targets are $0.01100 and $0.01120. A rejection near resistance could send the price back toward $0.0104 support.
Invalidation Level: $0.01020
236
#MatrixFamily listen to me carefully…
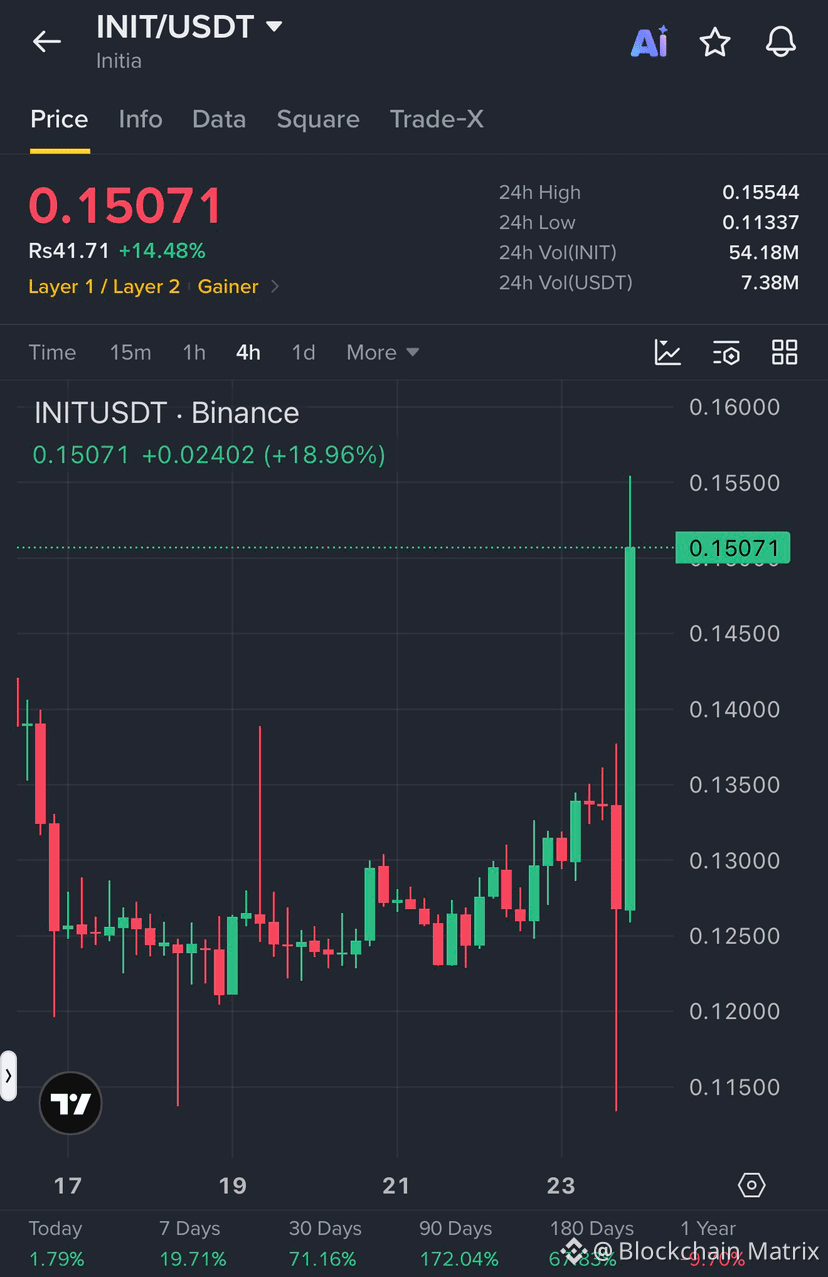
$INIT is showing strong bullish momentum after a powerful breakout on the 4-hour chart. Price has surged from the $0.127 area toward $0.155, supported by a massive green candle and increased trading activity.
$INIT Bullish Trade Setup
Entry Range: $0.1460–$0.1500
Stop Loss: $0.1410
TP1: $0.1550
TP2: $0.1600
TP3: $0.1680
The breakout shows strong buying pressure, but $INIT has already moved sharply, so chasing the current price carries higher risk. A pullback toward the entry zone followed by a strong bullish reaction could offer a better opportunity. If buyers maintain control and price breaks above $0.1555, the next resistance levels could come into focus.
If price loses the $0.1460 area, bullish momentum may weaken and a deeper correction could follow. Wait for confirmation before entering, as volatility remains elevated.
Invalidation Level: $0.1410
{spot}(INITUSDT)
#MatrixFamily listen to me carefully…
$INIT is showing strong bullish momentum after a powerful breakout on the 4-hour chart. Price has surged from the $0.127 area toward $0.155, supported by a massive green candle and increased trading activity.
$INIT Bullish Trade Setup
Entry Range: $0.1460–$0.1500
Stop Loss: $0.1410
TP1: $0.1550
TP2: $0.1600
TP3: $0.1680
The breakout shows strong buying pressure, but $INIT has already moved sharply, so chasing the current price carries higher risk. A pullback toward the entry zone followed by a strong bullish reaction could offer a better opportunity. If buyers maintain control and price breaks above $0.1555, the next resistance levels could come into focus.
If price loses the $0.1460 area, bullish momentum may weaken and a deeper correction could follow. Wait for confirmation before entering, as volatility remains elevated.
Invalidation Level: $0.1410
139
Log in to explore more content
Join global crypto users on Binance Square
⚡️ Get latest and useful information about crypto.
💬 Trusted by the world’s largest crypto exchange.
👍 Discover real insights from verified creators.
Email / Phone number