
Discover Crypto pro
4.8k Posts

Discover Crypto pro
Report
Block User
Up-to-date crypto news, market updates, and on-chain insights keeping you ahead in the evolving digital asset ecosystem. FOLLOW US! 🌍

TAO Holder
Frequent Trader
1.8 Years
3 Following
5.0K+ Followers
9.4K+ Liked
Posts
All
Quotes
Videos
·
--
Bullish
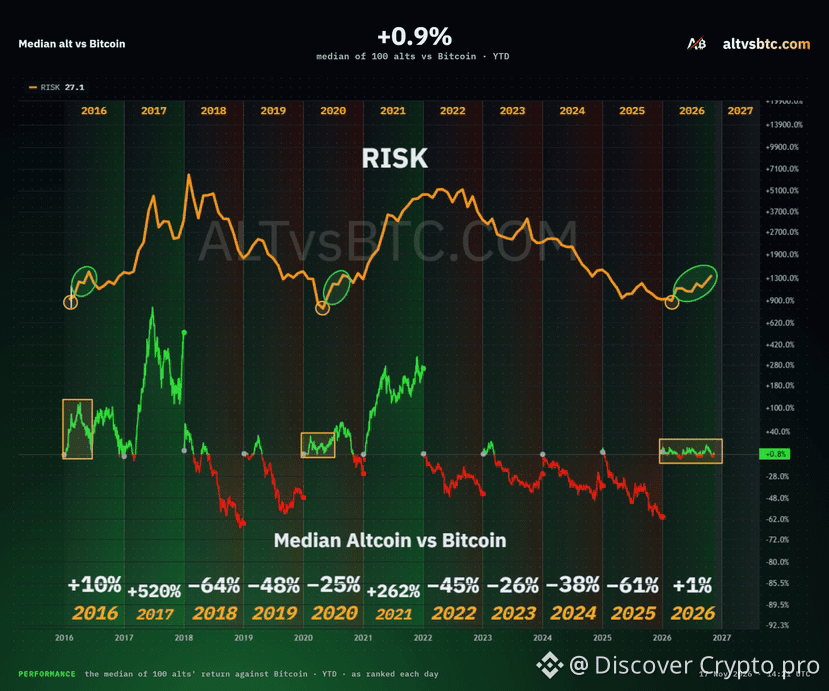
The reason why #Altcoins have held up against #BTC in 2026 is because 2026 is the year Risk has bottomed and has begun to reverse
The current price action against Bitcoin is most similar to the first half of both 2016 & 2020 and looks absolutely nothing like 2018 or 2022
The reason why #Altcoins have held up against #BTC in 2026 is because 2026 is the year Risk has bottomed and has begun to reverse
The current price action against Bitcoin is most similar to the first half of both 2016 & 2020 and looks absolutely nothing like 2018 or 2022
The current price action against Bitcoin is most similar to the first half of both 2016 & 2020 and looks absolutely nothing like 2018 or 2022
308
·
--
Bullish
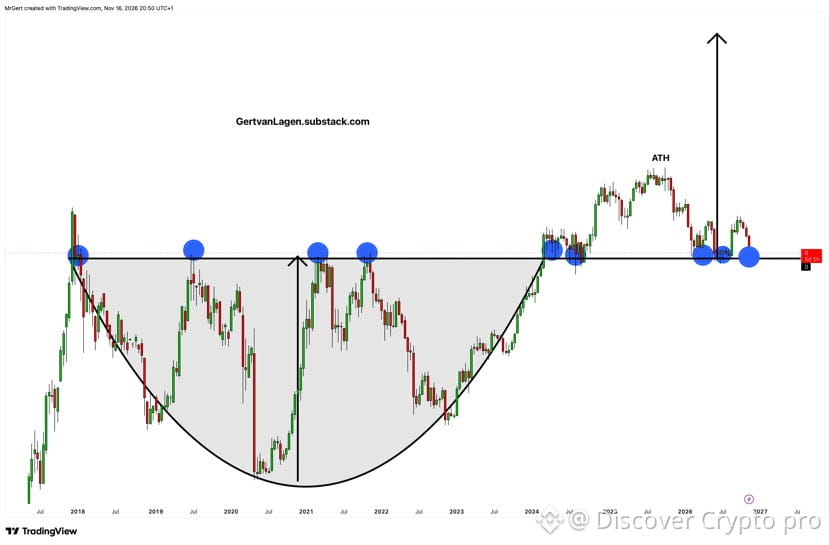
$BTC / M1 – Another retest of the key horizontal level since 2017. 🔵
BTC continues to hold its ground against monetary inflation.$BTC
{future}(BTCUSDT)
$BTC / M1 – Another retest of the key horizontal level since 2017. 🔵
BTC continues to hold its ground against monetary inflation.$BTC
BTC continues to hold its ground against monetary inflation.$BTC
94
·
--
Bullish
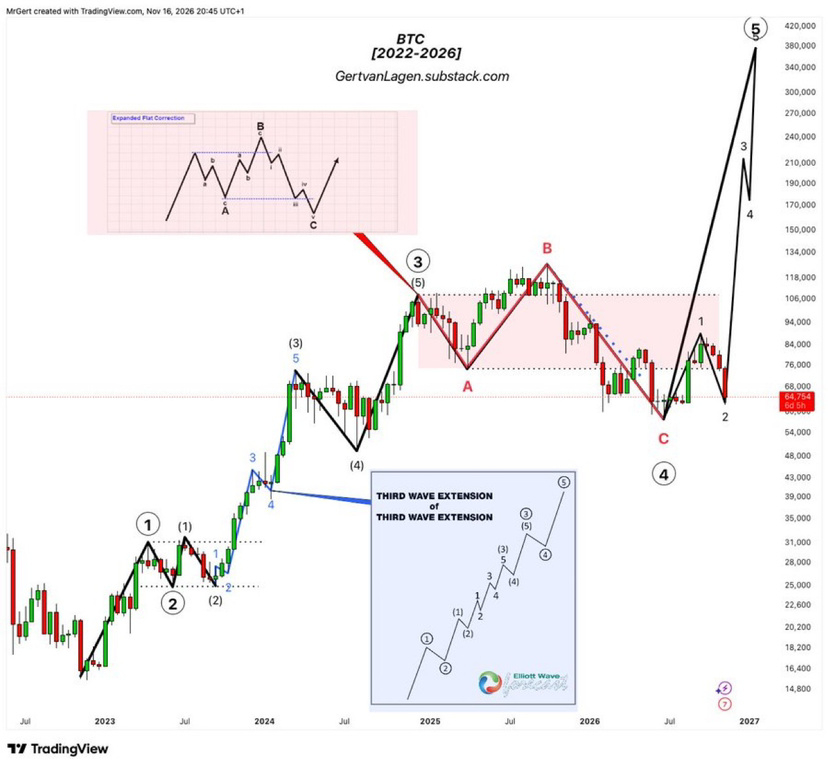
$BTC [2W] – As long as the $57.8K low holds, the bulls remain firmly in control.
The 1-year downtrend is broken, Q3 closed at a local higher high, now let's print the successive higher low to confirm trend reversal.
$BTC [2W] – As long as the $57.8K low holds, the bulls remain firmly in control.
The 1-year downtrend is broken, Q3 closed at a local higher high, now let's print the successive higher low to confirm trend reversal.
The 1-year downtrend is broken, Q3 closed at a local higher high, now let's print the successive higher low to confirm trend reversal.
100
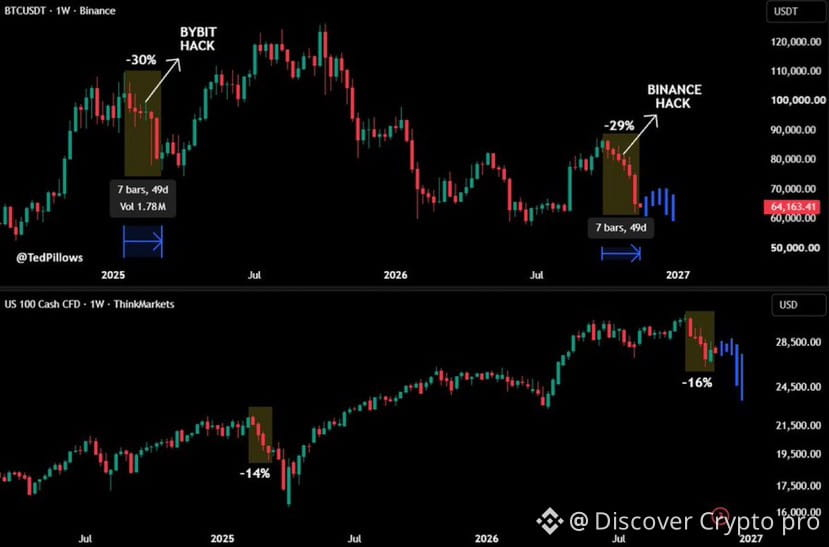
What a crazy coincidence! 🤯
Q1 2025
▫️ Bitcoin peaked in early Jan.
▫️ Dropped 30% in 7 weeks
▫️ Bybit got hacked.
▫️ Nasdaq dropped 14%.
Q4 2026
▫️ Bitcoin peaked in early October.
▫️ Dropped 29% in 7 weeks
▫️ Binance got hacked.
▫️ Nasdaq dropped 16%.
In Q1 2025, Bitcoin underperformed stocks during its first major dump, just like now.
Then, BTC had a recovery and final drop in April 2025, almost 4% below the March low.
Meanwhile, Nasdaq dropped another 15% from its March low and entered a bear market correction.
If this repeats, BTC will bottom around $59K-$60K, while Nasdaq will drop below 24,500.
What a crazy coincidence! 🤯
Q1 2025
▫️ Bitcoin peaked in early Jan.
▫️ Dropped 30% in 7 weeks
▫️ Bybit got hacked.
▫️ Nasdaq dropped 14%.
Q4 2026
▫️ Bitcoin peaked in early October.
▫️ Dropped 29% in 7 weeks
▫️ Binance got hacked.
▫️ Nasdaq dropped 16%.
In Q1 2025, Bitcoin underperformed stocks during its first major dump, just like now.
Then, BTC had a recovery and final drop in April 2025, almost 4% below the March low.
Meanwhile, Nasdaq dropped another 15% from its March low and entered a bear market correction.
If this repeats, BTC will bottom around $59K-$60K, while Nasdaq will drop below 24,500.
Q1 2025
▫️ Bitcoin peaked in early Jan.
▫️ Dropped 30% in 7 weeks
▫️ Bybit got hacked.
▫️ Nasdaq dropped 14%.
Q4 2026
▫️ Bitcoin peaked in early October.
▫️ Dropped 29% in 7 weeks
▫️ Binance got hacked.
▫️ Nasdaq dropped 16%.
In Q1 2025, Bitcoin underperformed stocks during its first major dump, just like now.
Then, BTC had a recovery and final drop in April 2025, almost 4% below the March low.
Meanwhile, Nasdaq dropped another 15% from its March low and entered a bear market correction.
If this repeats, BTC will bottom around $59K-$60K, while Nasdaq will drop below 24,500.
170
·
--
Bullish
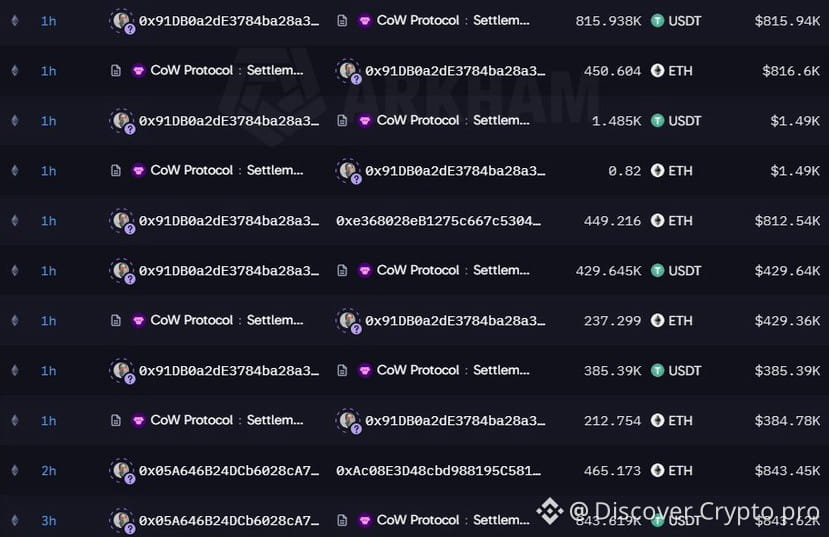
A whale has bought $140,000,000 in $ETH in the past 5 days.
Accumulation.
$ETH
{future}(ETHUSDT)
#ETH
A whale has bought $140,000,000 in $ETH in the past 5 days.
Accumulation.
$ETH
#ETH
Accumulation.
$ETH
#ETH
168
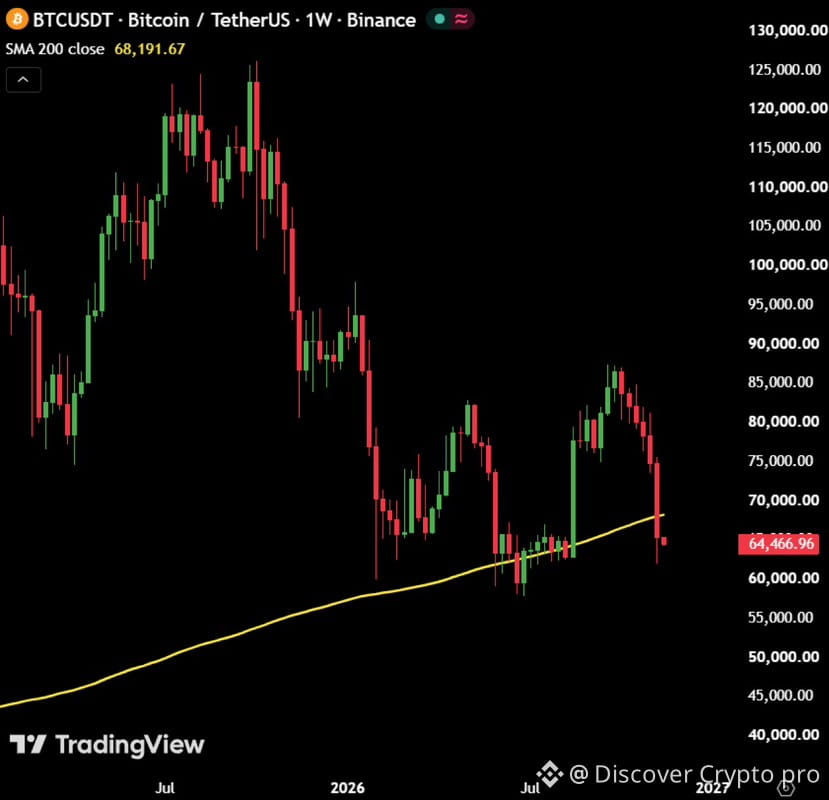
Bitcoin has lost its 200W MA for the first time in 3 months.
This isn't good.
Bitcoin has lost its 200W MA for the first time in 3 months.
This isn't good.
This isn't good.
140
·
--
Bullish
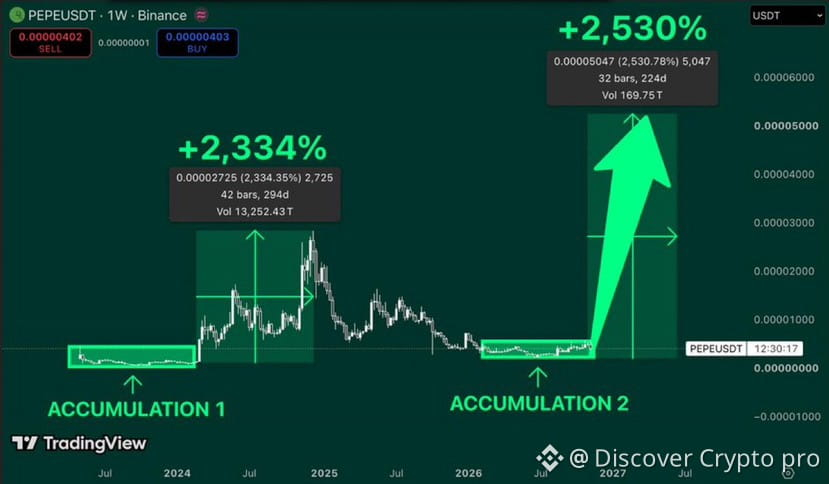
$PEPE is trading around $0.000004.
And something interesting is happening on the weekly chart.
Look at these two accumulation zones.
In 2023, $PEPE spent months consolidating near its lows before exploding 2,334% in 2024.
Now we're seeing a remarkably similar structure.
Price has returned to a major historical demand zone. Volatility has compressed, selling pressure has slowed, and another potential accumulation phase is developing.
Could history repeat itself?
Here's my roadmap:
$0.0000055 — First resistance.
$0.0000075 — Breakout confirmation.
$0.000010 — Psychological level.
$0.000016 — Major resistance.
$0.0000283 — Previous ATH.
$0.00005+ — Extreme bullish target.
The chart projects a potential 2,530% rally, but buyers still need to confirm the reversal.
A weekly breakout above $0.0000055 with strong volume would be the first encouraging signal.
Until then, the downside risk remains.
The last explosive rally started when looked completely forgotten.
Now we're approaching another potentially important moment.
I'm not saying a 25x move is guaranteed.
But if this second accumulation zone holds, things could get very interesting.
$PEPE
{alpha}(CT_195TMacq4TDUw5q8NFBwmbY4RLXvzvG5JTkvi)
$PEPE is trading around $0.000004.
And something interesting is happening on the weekly chart.
Look at these two accumulation zones.
In 2023, $PEPE spent months consolidating near its lows before exploding 2,334% in 2024.
Now we're seeing a remarkably similar structure.
Price has returned to a major historical demand zone. Volatility has compressed, selling pressure has slowed, and another potential accumulation phase is developing.
Could history repeat itself?
Here's my roadmap:
$0.0000055 — First resistance.
$0.0000075 — Breakout confirmation.
$0.000010 — Psychological level.
$0.000016 — Major resistance.
$0.0000283 — Previous ATH.
$0.00005+ — Extreme bullish target.
The chart projects a potential 2,530% rally, but buyers still need to confirm the reversal.
A weekly breakout above $0.0000055 with strong volume would be the first encouraging signal.
Until then, the downside risk remains.
The last explosive rally started when looked completely forgotten.
Now we're approaching another potentially important moment.
I'm not saying a 25x move is guaranteed.
But if this second accumulation zone holds, things could get very interesting.
$PEPE
And something interesting is happening on the weekly chart.
Look at these two accumulation zones.
In 2023, $PEPE spent months consolidating near its lows before exploding 2,334% in 2024.
Now we're seeing a remarkably similar structure.
Price has returned to a major historical demand zone. Volatility has compressed, selling pressure has slowed, and another potential accumulation phase is developing.
Could history repeat itself?
Here's my roadmap:
$0.0000055 — First resistance.
$0.0000075 — Breakout confirmation.
$0.000010 — Psychological level.
$0.000016 — Major resistance.
$0.0000283 — Previous ATH.
$0.00005+ — Extreme bullish target.
The chart projects a potential 2,530% rally, but buyers still need to confirm the reversal.
A weekly breakout above $0.0000055 with strong volume would be the first encouraging signal.
Until then, the downside risk remains.
The last explosive rally started when looked completely forgotten.
Now we're approaching another potentially important moment.
I'm not saying a 25x move is guaranteed.
But if this second accumulation zone holds, things could get very interesting.
$PEPE
149
·
--
Bullish
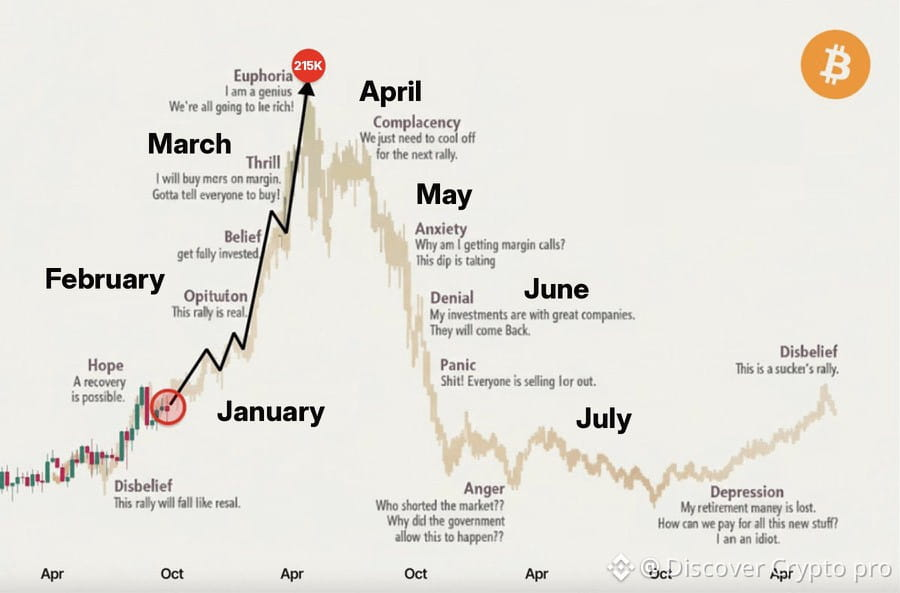
My 2027 Bull Run prediction:
January → Bear trap
February → Bitcoin breakout
March → Altcoin season
April → New ATH around $215K
May → Bull trap
June → Liquidation cascade
July → Bear market kicks in
Keep in mind: I’ve called every major market top and bottom for over 10 YEARS.
I was one of the only people who called the top in October, and I’ll do it again, that’s literally my job.
If you still haven’t followed me, you’ll regret it.
My 2027 Bull Run prediction:
January → Bear trap
February → Bitcoin breakout
March → Altcoin season
April → New ATH around $215K
May → Bull trap
June → Liquidation cascade
July → Bear market kicks in
Keep in mind: I’ve called every major market top and bottom for over 10 YEARS.
I was one of the only people who called the top in October, and I’ll do it again, that’s literally my job.
If you still haven’t followed me, you’ll regret it.
January → Bear trap
February → Bitcoin breakout
March → Altcoin season
April → New ATH around $215K
May → Bull trap
June → Liquidation cascade
July → Bear market kicks in
Keep in mind: I’ve called every major market top and bottom for over 10 YEARS.
I was one of the only people who called the top in October, and I’ll do it again, that’s literally my job.
If you still haven’t followed me, you’ll regret it.
1
303
·
--
Bullish
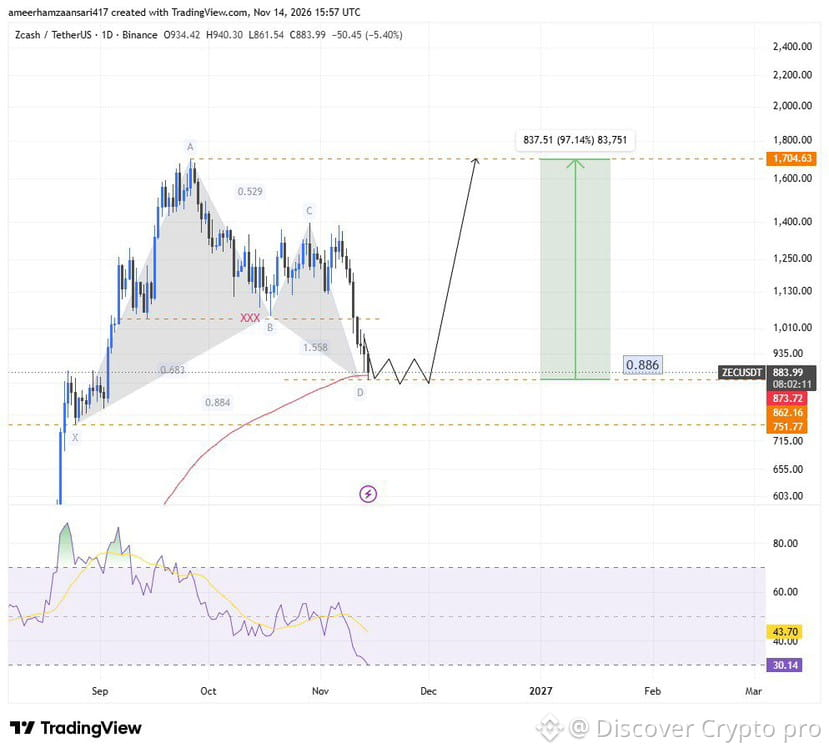
$ZEC respect our entry zone price come to 860$ and filled our order now we will hold it until range high 1700$ 🚀 🚀 🚀
{future}(ZECUSDT)
$ZEC respect our entry zone price come to 860$ and filled our order now we will hold it until range high 1700$ 🚀 🚀 🚀
2
494
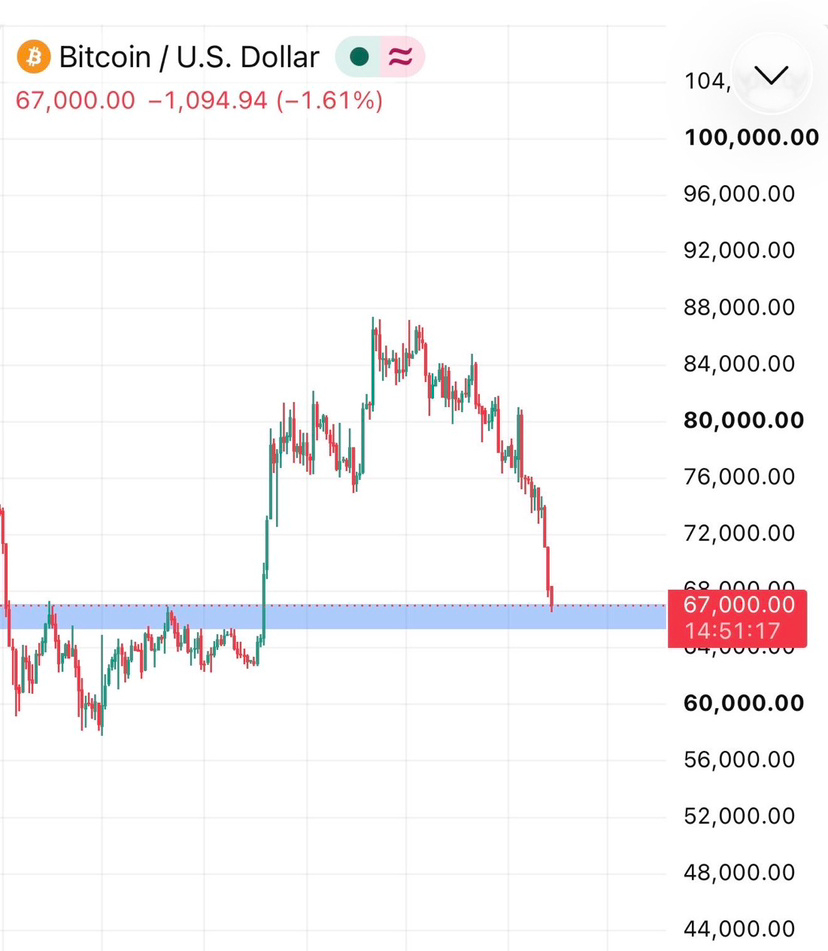
🚨 $BTC If u are not hold above $65k then we can see again $58k - $56k
Otherwise If $Bitcoin bounce from the box then we can see above $80k then $100k
🚨 $BTC If u are not hold above $65k then we can see again $58k - $56k
Otherwise If $Bitcoin bounce from the box then we can see above $80k then $100k
Otherwise If $Bitcoin bounce from the box then we can see above $80k then $100k
259
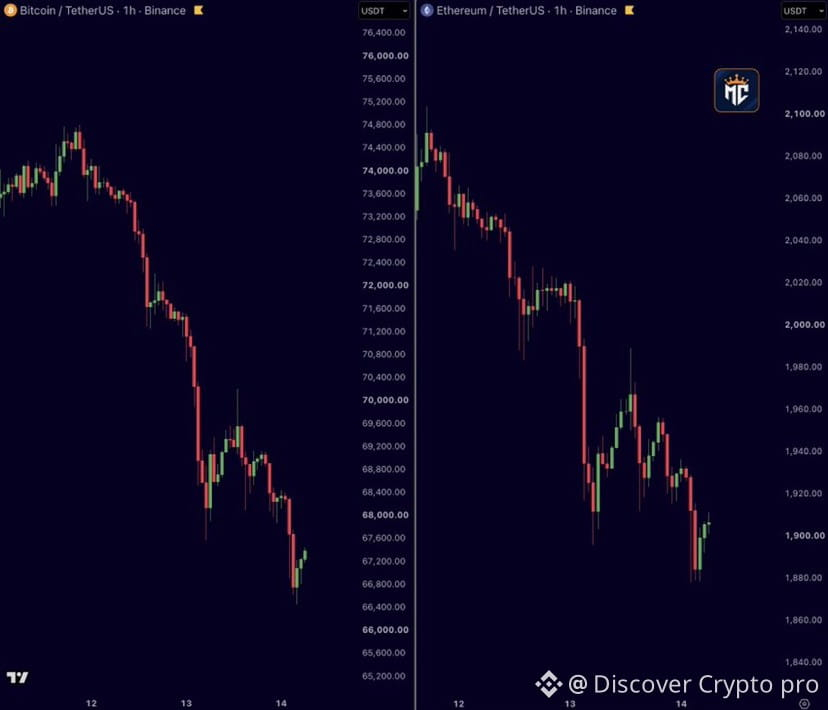
🚨 UPDATE: THE CRYPTO SELLOFF CONTINUES!
Roughly $26.5 BILLION wiped from crypto’s market cap in 24 hours.
$BTC dipped below $67,000 before recovering to around $67,400.
$ETH is near $1,904. Down 1.6% in 24 hours.
$667,750,000 liquidated over the same period including $532,030,000 in longs.
Weekend or not, the selling persists!
🚨 UPDATE: THE CRYPTO SELLOFF CONTINUES!
Roughly $26.5 BILLION wiped from crypto’s market cap in 24 hours.
$BTC dipped below $67,000 before recovering to around $67,400.
$ETH is near $1,904. Down 1.6% in 24 hours.
$667,750,000 liquidated over the same period including $532,030,000 in longs.
Weekend or not, the selling persists!
Roughly $26.5 BILLION wiped from crypto’s market cap in 24 hours.
$BTC dipped below $67,000 before recovering to around $67,400.
$ETH is near $1,904. Down 1.6% in 24 hours.
$667,750,000 liquidated over the same period including $532,030,000 in longs.
Weekend or not, the selling persists!
223
·
--
Bullish
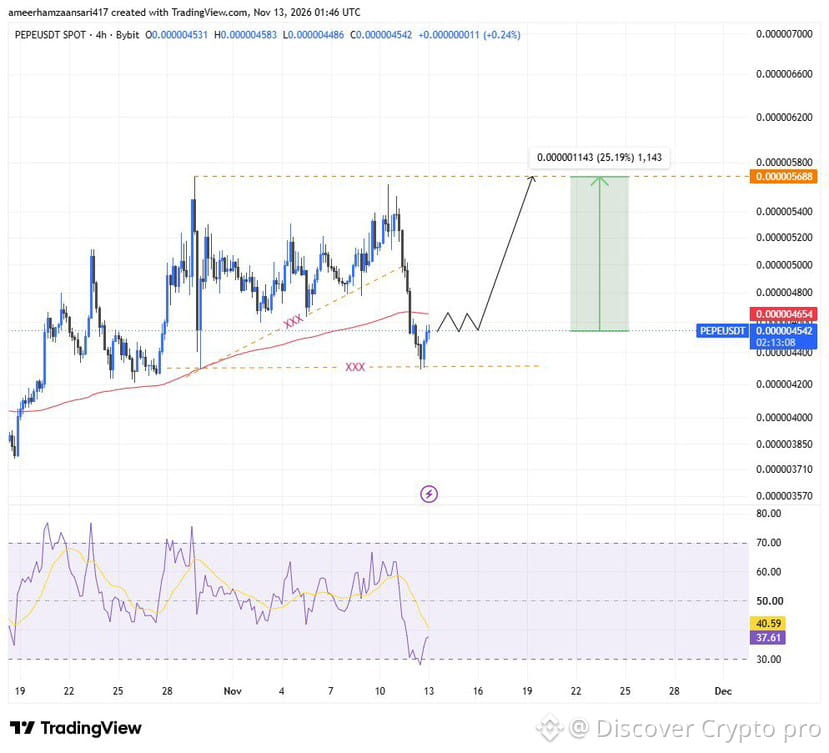
$PEPE price dropped just because there were lot of liquidity sitting at downside swept the lows and reclaimed the range now target will be range high 25% move from here in very short term 🚀 🚀 🚀
$PEPE
{spot}(PEPEUSDT)
$PEPE price dropped just because there were lot of liquidity sitting at downside swept the lows and reclaimed the range now target will be range high 25% move from here in very short term 🚀 🚀 🚀
$PEPE
$PEPE
196
·
--
Bullish
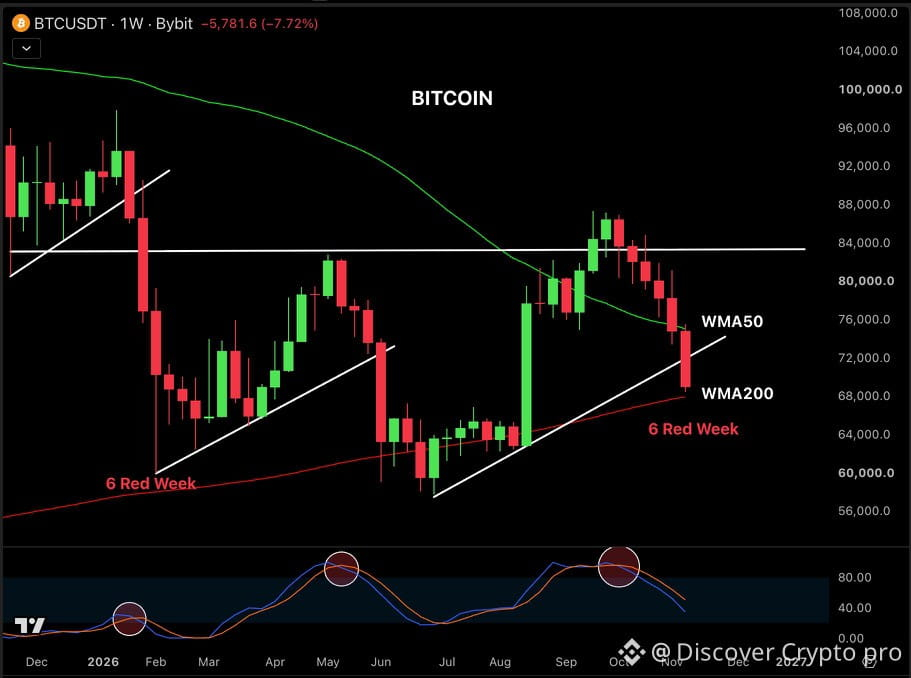
Bitcoin is testing its 200-week MA support near $68,000. Bulls need to defend this level and close the week above it.
We've seen BTC dump after midterm elections before, and such periods have also given some of the best long-term buying opportunities.
Nov 2014: $320 (Midterm)
Nov 2016: $750
Nov 2017: $11,000 (34x)
Nov 2018: $3,500 (Midterm)
Nov 2020: $19,000
Nov 2021: $69,000 (20x)
Nov 2022: $20,500 (Midterm)
Nov 2024: $99,000
Nov 2025: $111,000 (5.5x)
Nov 2026: $72,000 (Midterm)
Nov 2028: ?
Nov 2029: ? (3x would push Bitcoin above $200,000)
$BTC
{future}(BTCUSDT)
Bitcoin is testing its 200-week MA support near $68,000. Bulls need to defend this level and close the week above it.
We've seen BTC dump after midterm elections before, and such periods have also given some of the best long-term buying opportunities.
Nov 2014: $320 (Midterm)
Nov 2016: $750
Nov 2017: $11,000 (34x)
Nov 2018: $3,500 (Midterm)
Nov 2020: $19,000
Nov 2021: $69,000 (20x)
Nov 2022: $20,500 (Midterm)
Nov 2024: $99,000
Nov 2025: $111,000 (5.5x)
Nov 2026: $72,000 (Midterm)
Nov 2028: ?
Nov 2029: ? (3x would push Bitcoin above $200,000)
$BTC
We've seen BTC dump after midterm elections before, and such periods have also given some of the best long-term buying opportunities.
Nov 2014: $320 (Midterm)
Nov 2016: $750
Nov 2017: $11,000 (34x)
Nov 2018: $3,500 (Midterm)
Nov 2020: $19,000
Nov 2021: $69,000 (20x)
Nov 2022: $20,500 (Midterm)
Nov 2024: $99,000
Nov 2025: $111,000 (5.5x)
Nov 2026: $72,000 (Midterm)
Nov 2028: ?
Nov 2029: ? (3x would push Bitcoin above $200,000)
$BTC
138
·
--
Bullish
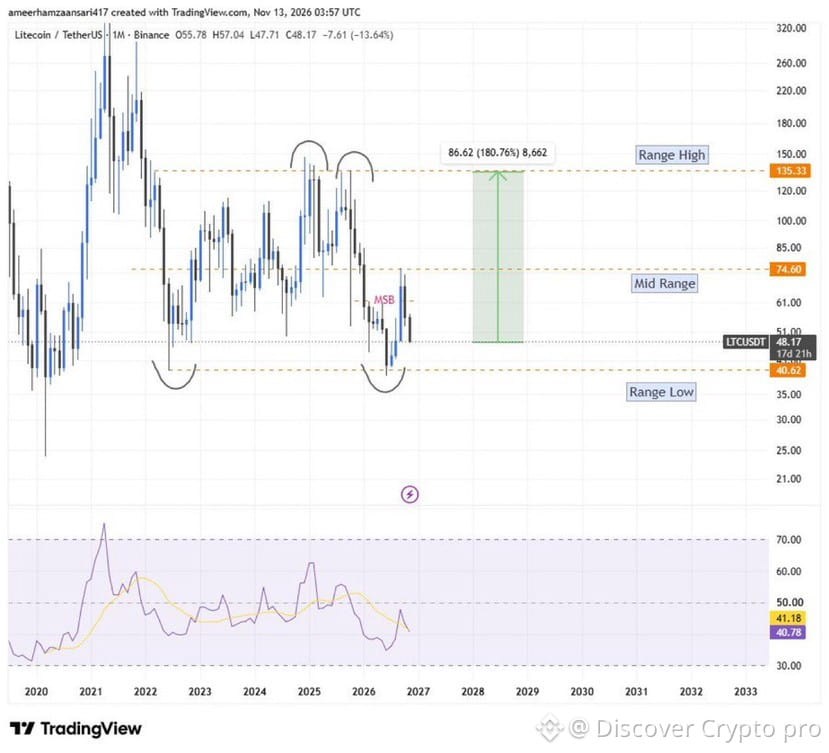
$LTC nothing change in our plan Dips are for buying opportunity target will be range high in mid term hold 🚀 🚀 🚀
$LTC
{future}(LTCUSDT)
$LTC nothing change in our plan Dips are for buying opportunity target will be range high in mid term hold 🚀 🚀 🚀
$LTC
$LTC
315
·
--
Bullish
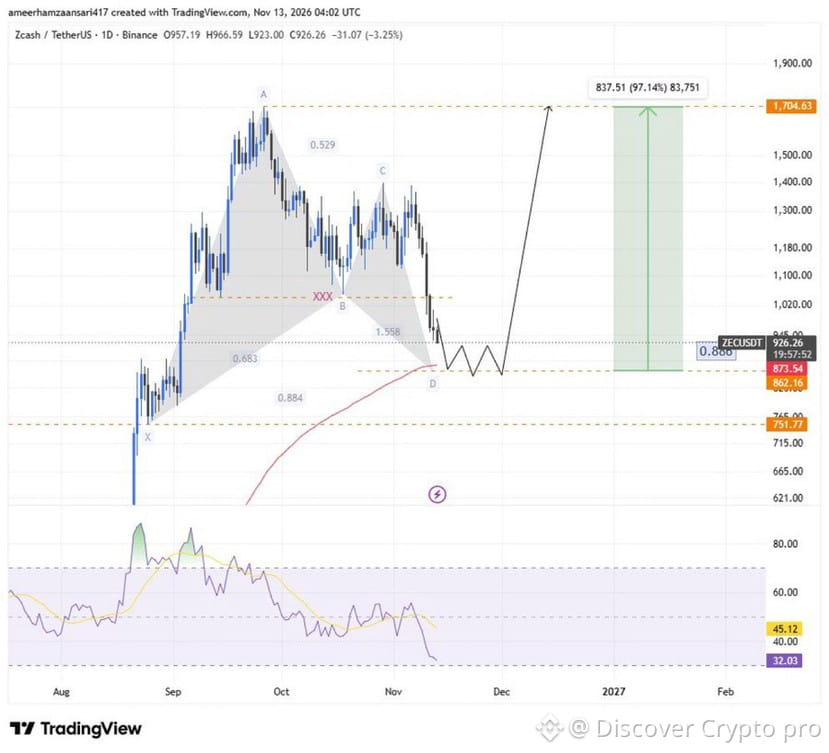
$ZEC told you about reversal points accumulate in between 850$ to 900$ and hold it for full target 1700$ 🚀 🚀 🚀
#ZECUSDT #ZCASH #ZEC
{future}(ZECUSDT)
$ZEC told you about reversal points accumulate in between 850$ to 900$ and hold it for full target 1700$ 🚀 🚀 🚀
#ZECUSDT #ZCASH #ZEC
#ZECUSDT #ZCASH #ZEC
1
271
·
--
Bullish
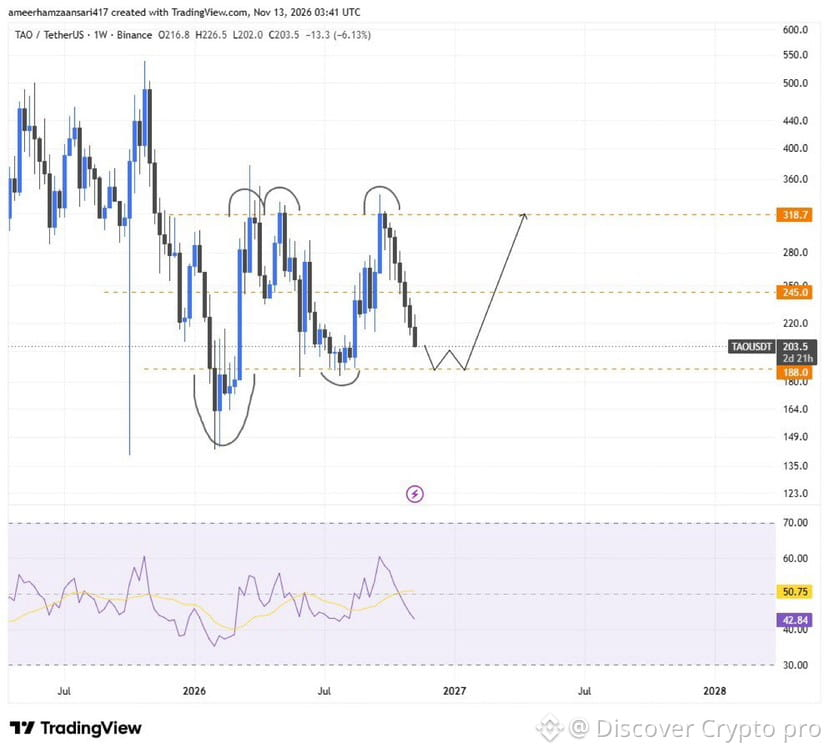
$TAO simple range play at weekly timeframe accumulate in between 180$ to 200$ levels and sell at 315$ 🚀 🚀 🚀
#TAOUSDT #TAO $TAO
{future}(TAOUSDT)
$TAO simple range play at weekly timeframe accumulate in between 180$ to 200$ levels and sell at 315$ 🚀 🚀 🚀
#TAOUSDT #TAO $TAO
#TAOUSDT #TAO $TAO
65
·
--
Bullish
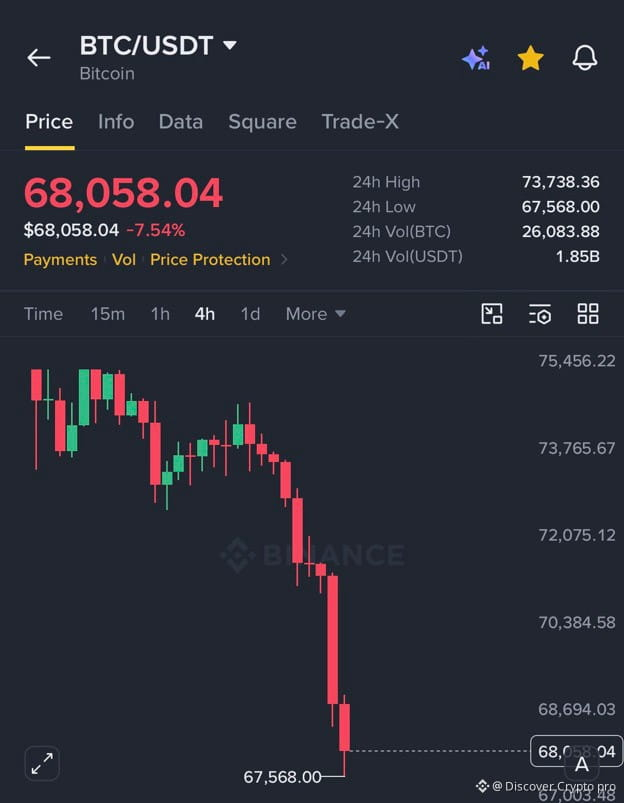
Bitcoin crashed -$12,500 in the last 9 days and hit a 3 month low of $67,500.
$1.45 Billion in longs were liquidated today.
The final capitulation has started.$BTC $NVDAB
Bitcoin crashed -$12,500 in the last 9 days and hit a 3 month low of $67,500.
$1.45 Billion in longs were liquidated today.
The final capitulation has started.$BTC $NVDAB
$1.45 Billion in longs were liquidated today.
The final capitulation has started.$BTC $NVDAB
43
·
--
Bullish
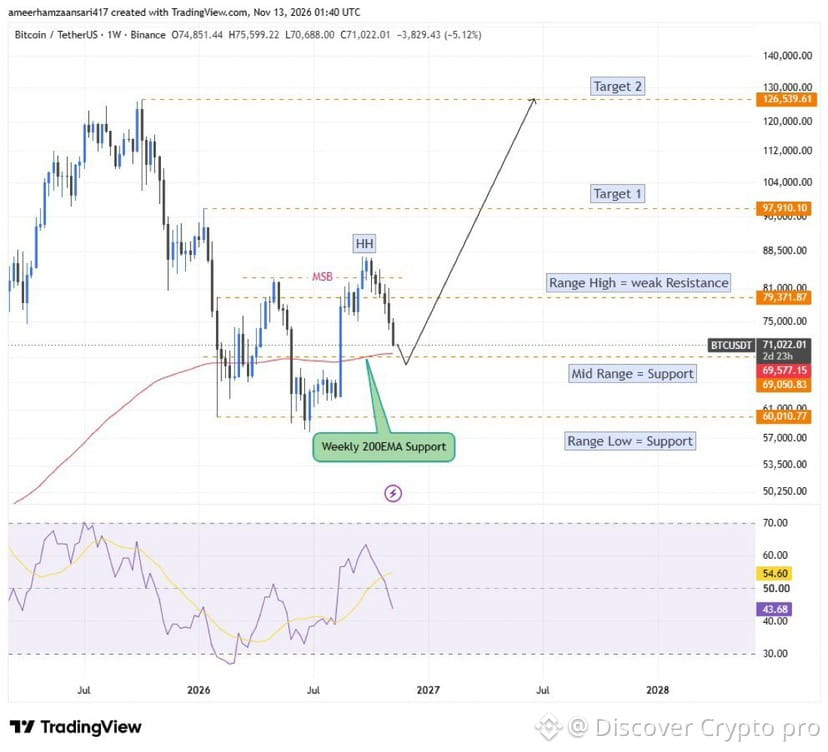
🚀 $BTC: THE NEXT BIG REVERSAL ZONE?
Bitcoin is approaching a crucial support area, and the weekly chart suggests a potential bullish reversal could be forming! 👀🔥
📊 Key BTC Levels:
🟢 Reversal Zone: $67,000–$70,000
🟢 Major Support: $60,010
🔴 First Resistance: $79,372
🎯 Target 1: $97,910
🚀 Target 2: $126,540
The weekly 200 EMA is sitting near the potential reversal zone, making this an important area for bulls to defend.
💥 Bullish Scenario: If Bitcoin holds $67K–$70K and confirms a higher low, a recovery toward $79K could open the door to $97K and potentially $126K.
⚠️ Bearish Scenario: A sustained breakdown below $67K would weaken the bullish setup and increase the risk of a move toward $60K.
The bull-market thesis isn’t dead yet. This could be a higher-low opportunity rather than the end of the cycle! 🐂
👀 Are you buying the dip or waiting for confirmation?
🚀 $BTC: THE NEXT BIG REVERSAL ZONE?
Bitcoin is approaching a crucial support area, and the weekly chart suggests a potential bullish reversal could be forming! 👀🔥
📊 Key BTC Levels:
🟢 Reversal Zone: $67,000–$70,000
🟢 Major Support: $60,010
🔴 First Resistance: $79,372
🎯 Target 1: $97,910
🚀 Target 2: $126,540
The weekly 200 EMA is sitting near the potential reversal zone, making this an important area for bulls to defend.
💥 Bullish Scenario: If Bitcoin holds $67K–$70K and confirms a higher low, a recovery toward $79K could open the door to $97K and potentially $126K.
⚠️ Bearish Scenario: A sustained breakdown below $67K would weaken the bullish setup and increase the risk of a move toward $60K.
The bull-market thesis isn’t dead yet. This could be a higher-low opportunity rather than the end of the cycle! 🐂
👀 Are you buying the dip or waiting for confirmation?
Bitcoin is approaching a crucial support area, and the weekly chart suggests a potential bullish reversal could be forming! 👀🔥
📊 Key BTC Levels:
🟢 Reversal Zone: $67,000–$70,000
🟢 Major Support: $60,010
🔴 First Resistance: $79,372
🎯 Target 1: $97,910
🚀 Target 2: $126,540
The weekly 200 EMA is sitting near the potential reversal zone, making this an important area for bulls to defend.
💥 Bullish Scenario: If Bitcoin holds $67K–$70K and confirms a higher low, a recovery toward $79K could open the door to $97K and potentially $126K.
⚠️ Bearish Scenario: A sustained breakdown below $67K would weaken the bullish setup and increase the risk of a move toward $60K.
The bull-market thesis isn’t dead yet. This could be a higher-low opportunity rather than the end of the cycle! 🐂
👀 Are you buying the dip or waiting for confirmation?
1
174
·
--
Bullish
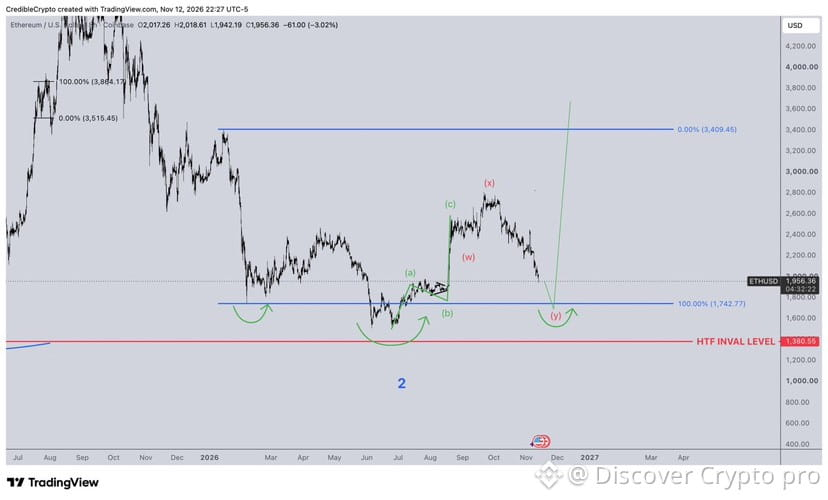
At this point the pullback on $ETH is deep enough that it invalidates the final missing 5th subwave I was looking for to confirm the move off the lows as impulsive.
Which means it was a corrective (3 legged) move up, we are still in the larger base building process, and HTF inval at $1380 remains the origin of the last completed 5 wave impulse.
At this stage I'm now looking for a little lower for a higher low into our range lows before the real move to the uspside begins.
$ETH
{future}(ETHUSDT)
At this point the pullback on $ETH is deep enough that it invalidates the final missing 5th subwave I was looking for to confirm the move off the lows as impulsive.
Which means it was a corrective (3 legged) move up, we are still in the larger base building process, and HTF inval at $1380 remains the origin of the last completed 5 wave impulse.
At this stage I'm now looking for a little lower for a higher low into our range lows before the real move to the uspside begins.
$ETH
Which means it was a corrective (3 legged) move up, we are still in the larger base building process, and HTF inval at $1380 remains the origin of the last completed 5 wave impulse.
At this stage I'm now looking for a little lower for a higher low into our range lows before the real move to the uspside begins.
$ETH
2.9k
·
--
Bullish
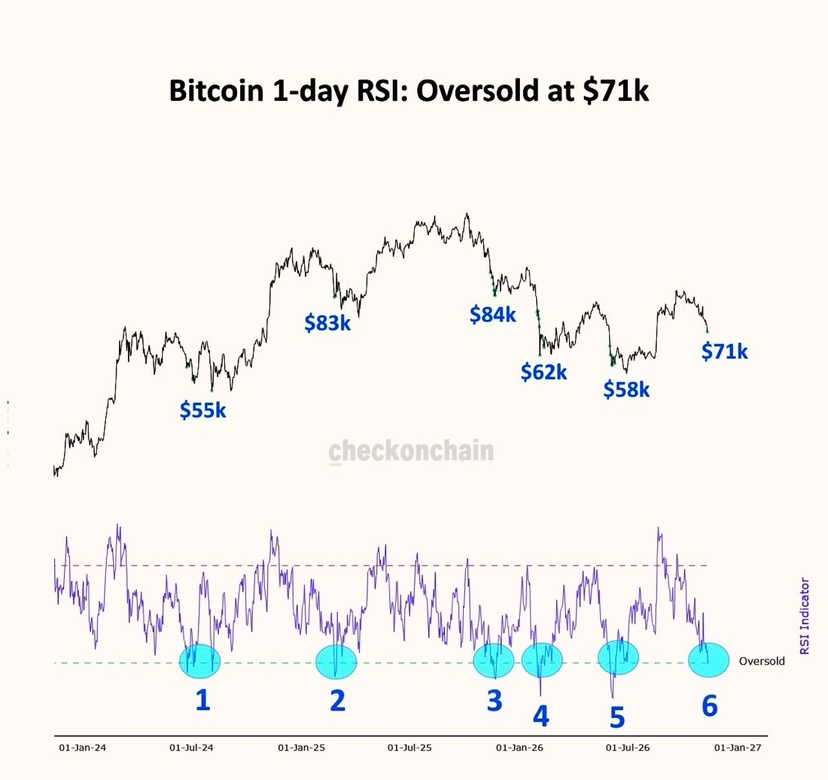
Max bearishness, max capitulation, max overselling.
You know what that means.
Max bearishness, max capitulation, max overselling.
You know what that means.
You know what that means.
173
Log in to explore more content
Join global crypto users on Binance Square
⚡️ Get latest and useful information about crypto.
💬 Trusted by the world’s largest crypto exchange.
👍 Discover real insights from verified creators.
Email / Phone number
Trending Topics
NvidiaBeatsEstimatesAICloudStocksRiseAfterHours
9,513 views
116 Discussing
Nvidia Beats With $115.8 Billion in Revenue, Guides to $130 Billion and Adds $150 Billion Buyback
Binance News
·12 Likes
·14.7k views
A Packed Week of Earnings and Data Tests Markets
156,593 views
672 Discussing
AnthropicIPOTestsInvestorAppetiteForAI
345,538 views
2,961 Discussing