
Lina Indicators
468 Posts
Lina Indicators
Report
Block User
Data-driven crypto research | Market structure • Momentum • Risk education | Personal views, not financial advice | X: @Lina_Indicator
236 Following
508 Followers
2.4K+ Liked
Posts
All
Quotes
Videos
PINNED
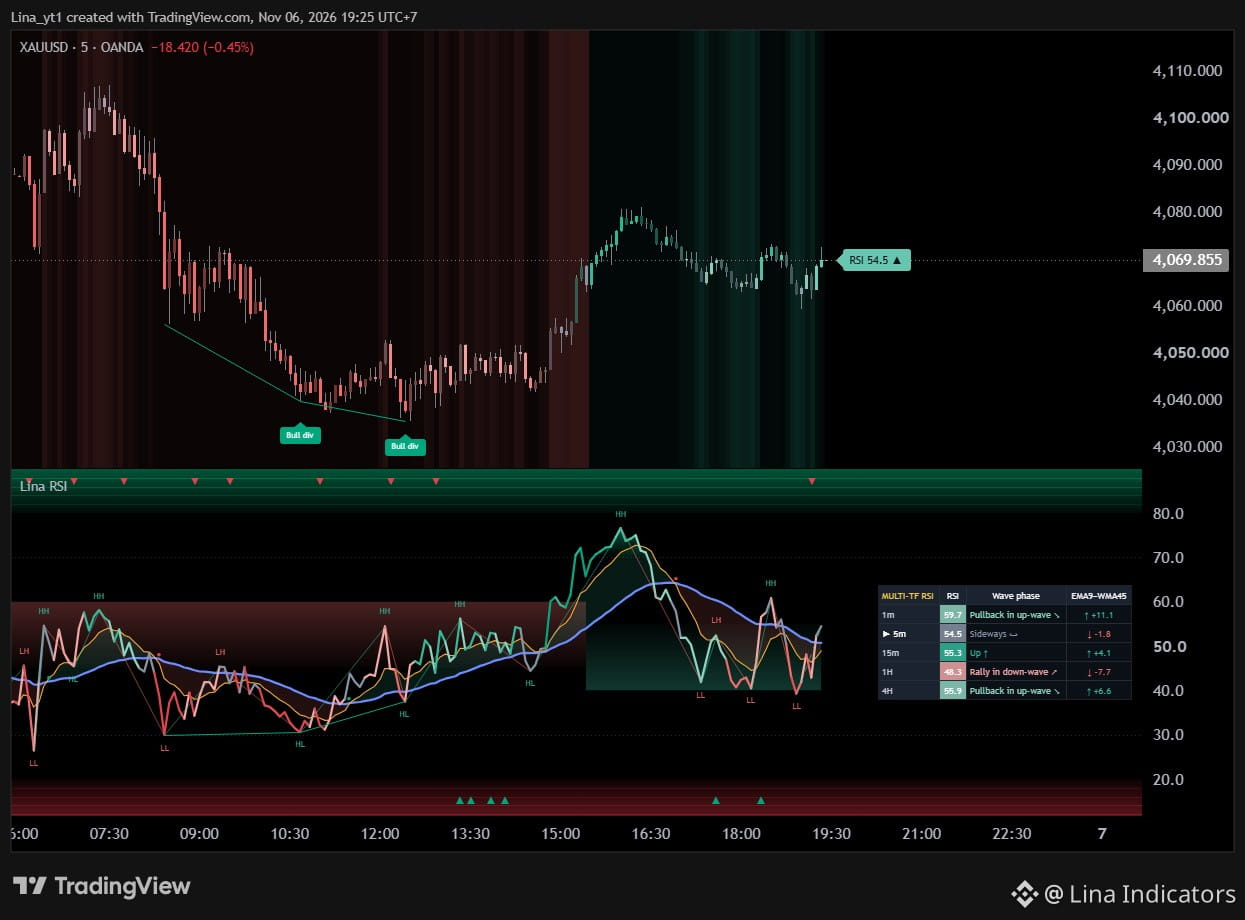
**Free indicator: Lina RSI is now on TradingView**
Most traders use RSI only for overbought / oversold. Lina RSI reads it as waves, so trend, pullbacks and exhaustion are visible at a glance.
What you get:
• 7-phase RSI line, from strong up to strong down
• Trend pullback band where with-trend entries usually form
• Smooth extreme-zone fill
• RSI zigzag with HH / HL / LH / LL labels
• Regular divergence on RSI and price
• Pullback completed / failed marks
• Candle colors and trend background on the price chart
• Auto 5-timeframe RSI table
• 6 alerts
How to use it: green candles = look for longs, red = look for shorts. Wait for RSI to pull back into the band and complete before joining the trend. Don't chase in the extreme zone.
100% free. No sign-up, no conditions.
→ tradingview.com/script/qFbYduhk-Lina-RSI-Wave-Phase-RSI-with-Trend-Pullback-Zones/
$BTC $ETH #Gold #TradingView #RSI #TechnicalAnalysis
Not financial advice. Always manage your risk.
**Free indicator: Lina RSI is now on TradingView**
Most traders use RSI only for overbought / oversold. Lina RSI reads it as waves, so trend, pullbacks and exhaustion are visible at a glance.
What you get:
• 7-phase RSI line, from strong up to strong down
• Trend pullback band where with-trend entries usually form
• Smooth extreme-zone fill
• RSI zigzag with HH / HL / LH / LL labels
• Regular divergence on RSI and price
• Pullback completed / failed marks
• Candle colors and trend background on the price chart
• Auto 5-timeframe RSI table
• 6 alerts
How to use it: green candles = look for longs, red = look for shorts. Wait for RSI to pull back into the band and complete before joining the trend. Don't chase in the extreme zone.
100% free. No sign-up, no conditions.
→ tradingview.com/script/qFbYduhk-Lina-RSI-Wave-Phase-RSI-with-Trend-Pullback-Zones/
$BTC $ETH #Gold #TradingView #RSI #TechnicalAnalysis
Not financial advice. Always manage your risk.
Most traders use RSI only for overbought / oversold. Lina RSI reads it as waves, so trend, pullbacks and exhaustion are visible at a glance.
What you get:
• 7-phase RSI line, from strong up to strong down
• Trend pullback band where with-trend entries usually form
• Smooth extreme-zone fill
• RSI zigzag with HH / HL / LH / LL labels
• Regular divergence on RSI and price
• Pullback completed / failed marks
• Candle colors and trend background on the price chart
• Auto 5-timeframe RSI table
• 6 alerts
How to use it: green candles = look for longs, red = look for shorts. Wait for RSI to pull back into the band and complete before joining the trend. Don't chase in the extreme zone.
100% free. No sign-up, no conditions.
→ tradingview.com/script/qFbYduhk-Lina-RSI-Wave-Phase-RSI-with-Trend-Pullback-Zones/
$BTC $ETH #Gold #TradingView #RSI #TechnicalAnalysis
Not financial advice. Always manage your risk.
3
1
3
387
PINNED
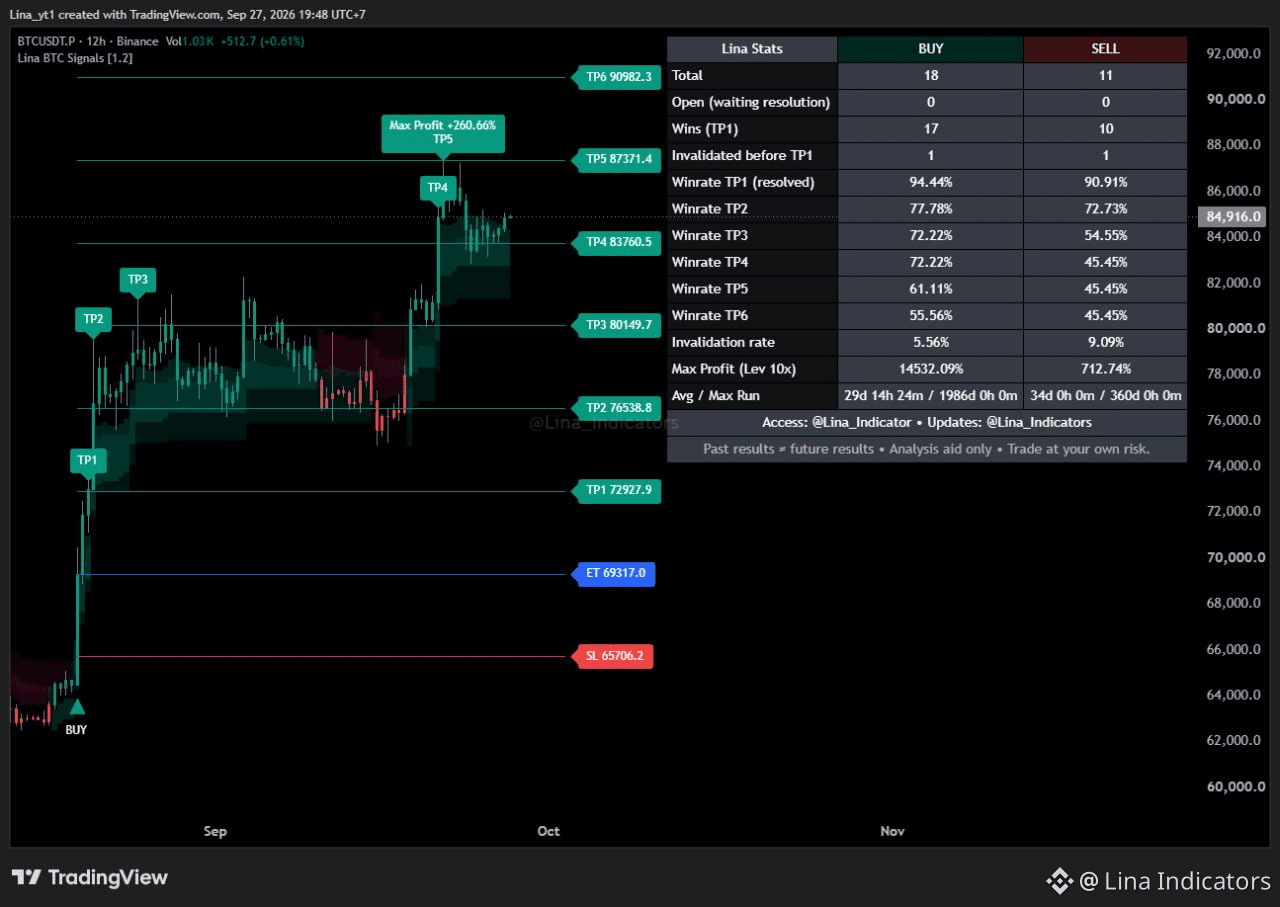
🔥 LINA BTC SIGNALS
A private TradingView indicator built specifically for $BTC.
• BUY / SELL
• Entry & Stop Loss
• TP1 → TP6
• Multi-timeframe structure
• Historical performance tracking
Each timeframe can have its own setup, allowing BTC market structure to be followed from multiple perspectives.
Private access:
1 Year • 3 Years • Lifetime
Lina BTC Signals
Built for BTC.
For analysis and educational purposes only. Past results do not guarantee future results.
$BTC #bitcoin #tradingview
🔥 LINA BTC SIGNALS
A private TradingView indicator built specifically for $BTC .
• BUY / SELL
• Entry & Stop Loss
• TP1 → TP6
• Multi-timeframe structure
• Historical performance tracking
Each timeframe can have its own setup, allowing BTC market structure to be followed from multiple perspectives.
Private access:
1 Year • 3 Years • Lifetime
Lina BTC Signals
Built for BTC.
For analysis and educational purposes only. Past results do not guarantee future results.
$BTC #bitcoin #tradingview
A private TradingView indicator built specifically for $BTC .
• BUY / SELL
• Entry & Stop Loss
• TP1 → TP6
• Multi-timeframe structure
• Historical performance tracking
Each timeframe can have its own setup, allowing BTC market structure to be followed from multiple perspectives.
Private access:
1 Year • 3 Years • Lifetime
Lina BTC Signals
Built for BTC.
For analysis and educational purposes only. Past results do not guarantee future results.
$BTC #bitcoin #tradingview
2
116
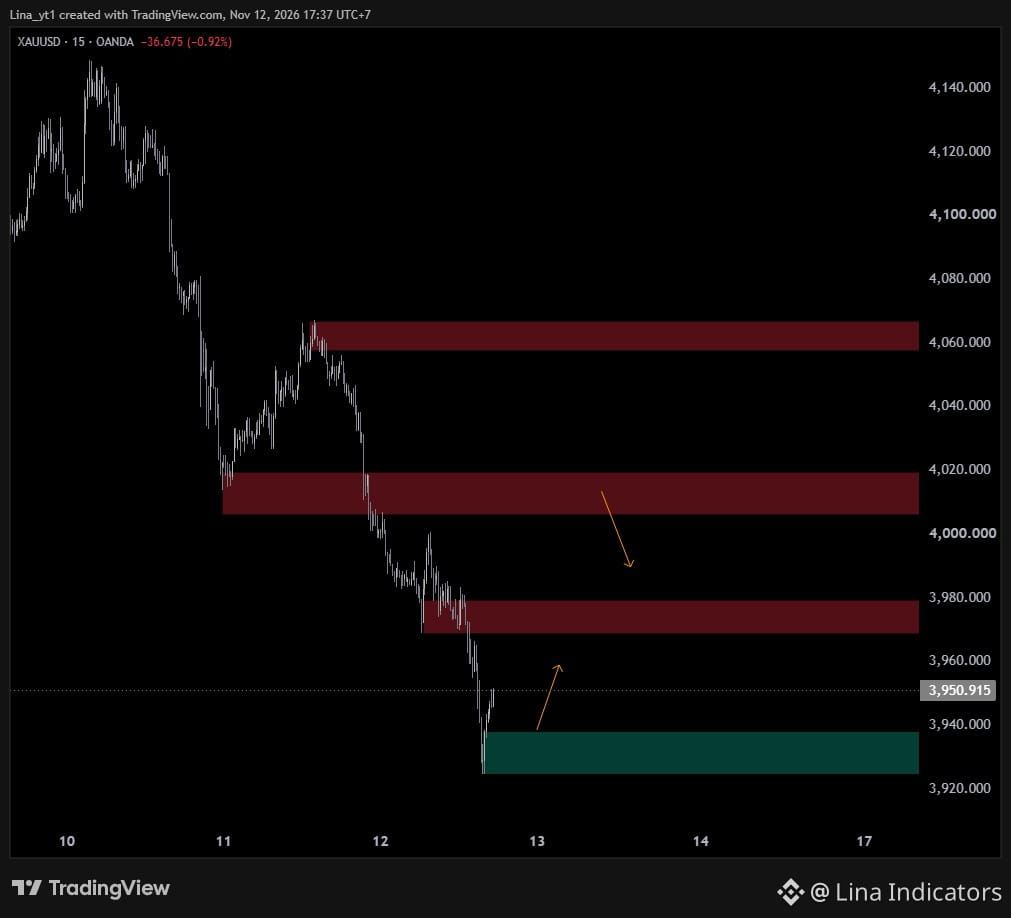
XAUUSD | M15 Update
Gold has broken below the previously highlighted 3,955 level and is now trading around 3,951.
Key areas to monitor:
• 3,925–3,938 — nearby support
• 3,970–3,980 — first resistance on a rebound
• 4,005–4,020 — stronger resistance
After an extended downside move, the reaction around the lower support area may be more important than chasing further weakness.
For market analysis and educational purposes only.
XAUUSD | M15 Update
Gold has broken below the previously highlighted 3,955 level and is now trading around 3,951.
Key areas to monitor:
• 3,925–3,938 — nearby support
• 3,970–3,980 — first resistance on a rebound
• 4,005–4,020 — stronger resistance
After an extended downside move, the reaction around the lower support area may be more important than chasing further weakness.
For market analysis and educational purposes only.
Gold has broken below the previously highlighted 3,955 level and is now trading around 3,951.
Key areas to monitor:
• 3,925–3,938 — nearby support
• 3,970–3,980 — first resistance on a rebound
• 4,005–4,020 — stronger resistance
After an extended downside move, the reaction around the lower support area may be more important than chasing further weakness.
For market analysis and educational purposes only.
1
1
175
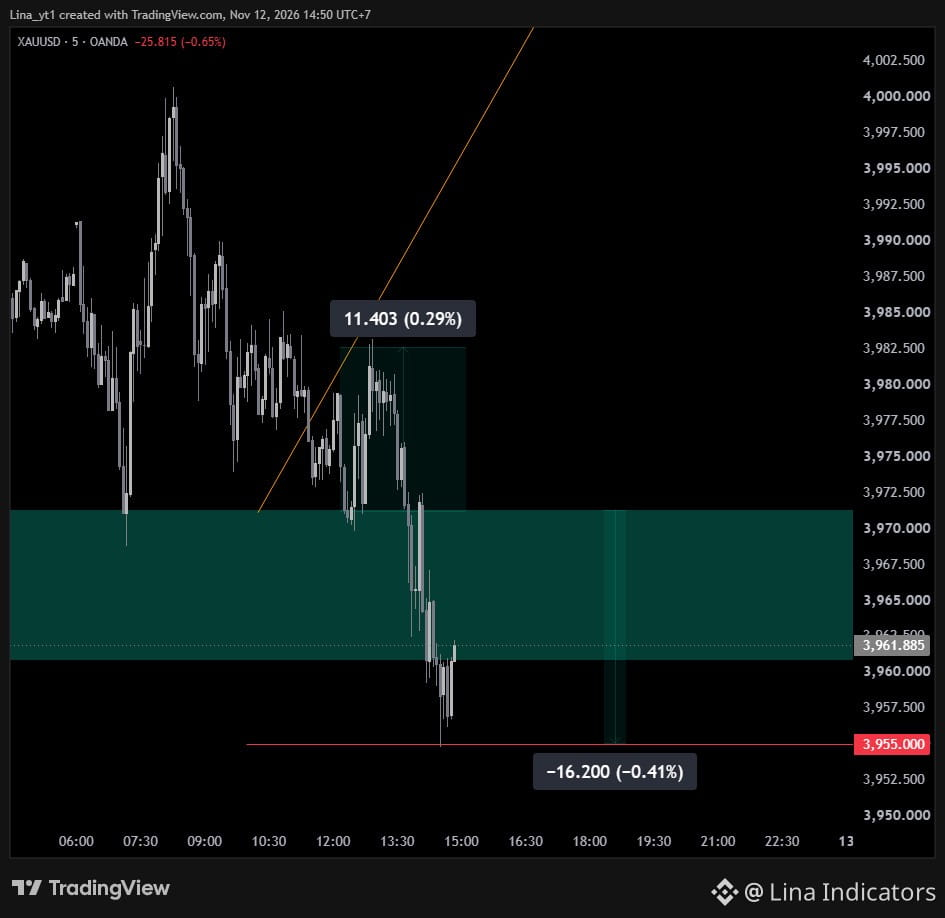
Gold broke below the 3,960–3,970 support zone and tested the key 3,955 area before rebounding toward 3,962.
3,955 is now the main level to watch.
Holding above it may support a technical rebound, while a clean breakdown would increase downside risk.
For market analysis and educational purposes only.
Gold broke below the 3,960–3,970 support zone and tested the key 3,955 area before rebounding toward 3,962.
3,955 is now the main level to watch.
Holding above it may support a technical rebound, while a clean breakdown would increase downside risk.
For market analysis and educational purposes only.
3,955 is now the main level to watch.
Holding above it may support a technical rebound, while a clean breakdown would increase downside risk.
For market analysis and educational purposes only.
Lina Indicators
·
--
XAUUSD | M15 Update
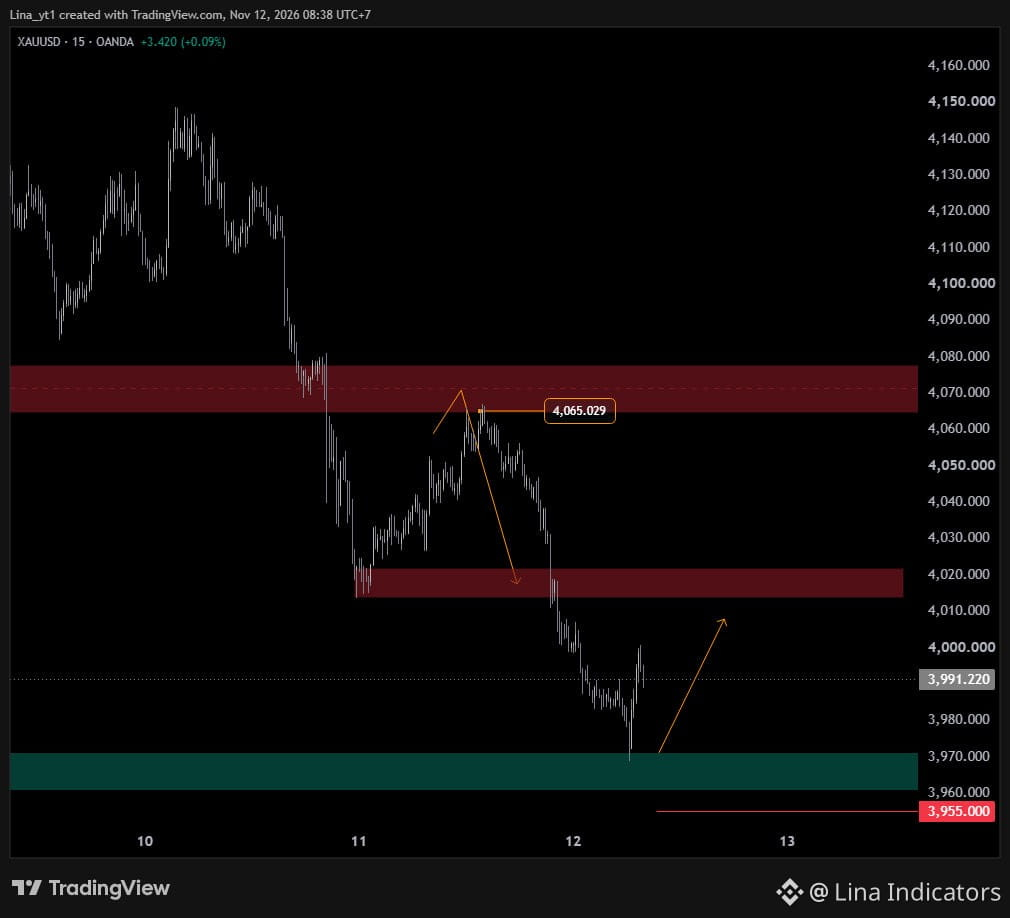
Gold is currently trading around 3,991 after extending the decline from the 4,065 area.
Key zones:
• 3,960–3,970 — nearby support
• 3,955 — key downside level
• 4,015–4,020 — near-term resistance
If support continues to hold, a technical rebound toward 4,010–4,020 may develop.
However, the short-term structure remains weak until price can reclaim the resistance zone.
A break below 3,955 would increase downside risk.
For market analysis and educational purposes only.
Gold is currently trading around 3,991 after extending the decline from the 4,065 area.
Key zones:
• 3,960–3,970 — nearby support
• 3,955 — key downside level
• 4,015–4,020 — near-term resistance
If support continues to hold, a technical rebound toward 4,010–4,020 may develop.
However, the short-term structure remains weak until price can reclaim the resistance zone.
A break below 3,955 would increase downside risk.
For market analysis and educational purposes only.
1
156
XAUUSD | M15 Update
Gold is currently trading around 3,991 after extending the decline from the 4,065 area.
Key zones:
• 3,960–3,970 — nearby support
• 3,955 — key downside level
• 4,015–4,020 — near-term resistance
If support continues to hold, a technical rebound toward 4,010–4,020 may develop.
However, the short-term structure remains weak until price can reclaim the resistance zone.
A break below 3,955 would increase downside risk.
For market analysis and educational purposes only.
XAUUSD | M15 Update
Gold is currently trading around 3,991 after extending the decline from the 4,065 area.
Key zones:
• 3,960–3,970 — nearby support
• 3,955 — key downside level
• 4,015–4,020 — near-term resistance
If support continues to hold, a technical rebound toward 4,010–4,020 may develop.
However, the short-term structure remains weak until price can reclaim the resistance zone.
A break below 3,955 would increase downside risk.
For market analysis and educational purposes only.
Gold is currently trading around 3,991 after extending the decline from the 4,065 area.
Key zones:
• 3,960–3,970 — nearby support
• 3,955 — key downside level
• 4,015–4,020 — near-term resistance
If support continues to hold, a technical rebound toward 4,010–4,020 may develop.
However, the short-term structure remains weak until price can reclaim the resistance zone.
A break below 3,955 would increase downside risk.
For market analysis and educational purposes only.
Lina Indicators
·
--
XAUUSD | H1 Outlook
Gold is trading around 4,034 after a sharp decline.
The key resistance area above is 4,065–4,081.
If price rebounds into this zone but fails to maintain acceptance above it, downside pressure could remain, with 4,000 and 3,960–3,970 as the next areas to monitor.
A sustained hold above 4,081 would weaken the short-term bearish scenario.
For market analysis and educational purposes only.
Gold is trading around 4,034 after a sharp decline.
The key resistance area above is 4,065–4,081.
If price rebounds into this zone but fails to maintain acceptance above it, downside pressure could remain, with 4,000 and 3,960–3,970 as the next areas to monitor.
A sustained hold above 4,081 would weaken the short-term bearish scenario.
For market analysis and educational purposes only.
1
1
1
322
XAUUSD | Follow-up
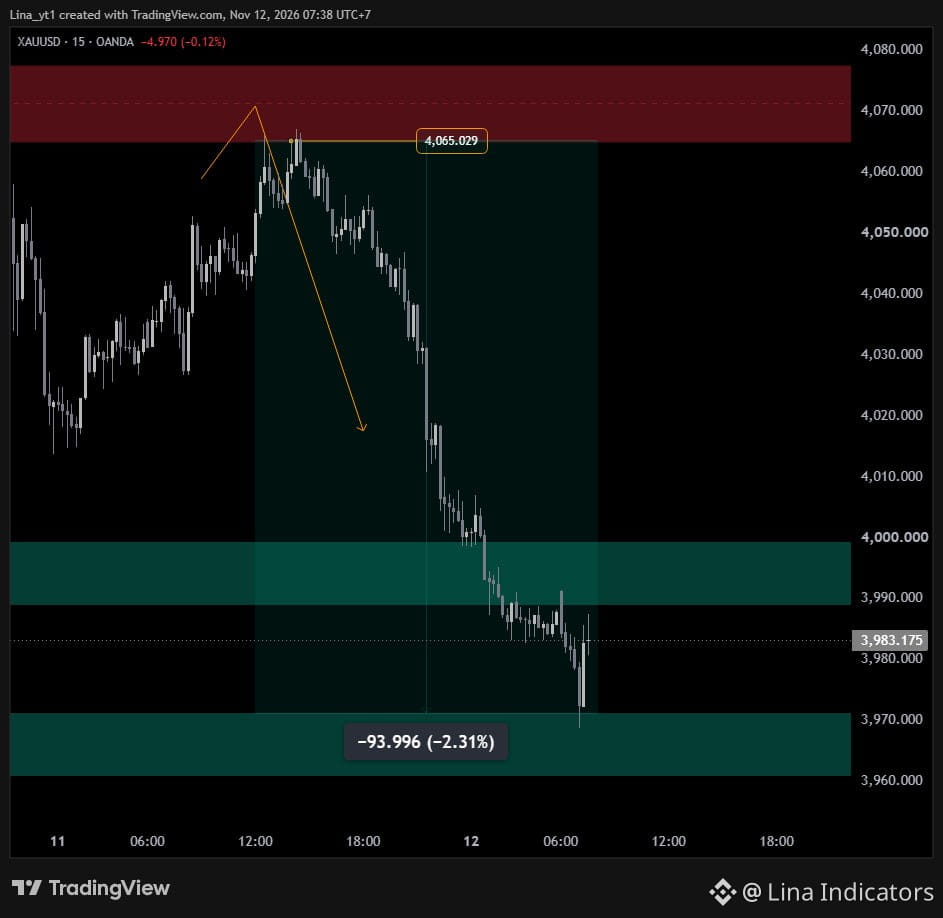
The previously highlighted 4,065–4,081 resistance zone produced a strong rejection.
Gold has since declined nearly 94 points (-2.31%), breaking through the 3,990–4,000 area and reaching the deeper 3,960–3,970 support zone.
After such an extended move, the next support reaction may be more important than chasing further downside.
For market analysis and educational purposes only.
XAUUSD | Follow-up
The previously highlighted 4,065–4,081 resistance zone produced a strong rejection.
Gold has since declined nearly 94 points (-2.31%), breaking through the 3,990–4,000 area and reaching the deeper 3,960–3,970 support zone.
After such an extended move, the next support reaction may be more important than chasing further downside.
For market analysis and educational purposes only.
The previously highlighted 4,065–4,081 resistance zone produced a strong rejection.
Gold has since declined nearly 94 points (-2.31%), breaking through the 3,990–4,000 area and reaching the deeper 3,960–3,970 support zone.
After such an extended move, the next support reaction may be more important than chasing further downside.
For market analysis and educational purposes only.
Lina Indicators
·
--
XAUUSD | H1 Outlook
Gold is trading around 4,034 after a sharp decline.
The key resistance area above is 4,065–4,081.
If price rebounds into this zone but fails to maintain acceptance above it, downside pressure could remain, with 4,000 and 3,960–3,970 as the next areas to monitor.
A sustained hold above 4,081 would weaken the short-term bearish scenario.
For market analysis and educational purposes only.
Gold is trading around 4,034 after a sharp decline.
The key resistance area above is 4,065–4,081.
If price rebounds into this zone but fails to maintain acceptance above it, downside pressure could remain, with 4,000 and 3,960–3,970 as the next areas to monitor.
A sustained hold above 4,081 would weaken the short-term bearish scenario.
For market analysis and educational purposes only.
113
XAUUSD | H1 Follow-up
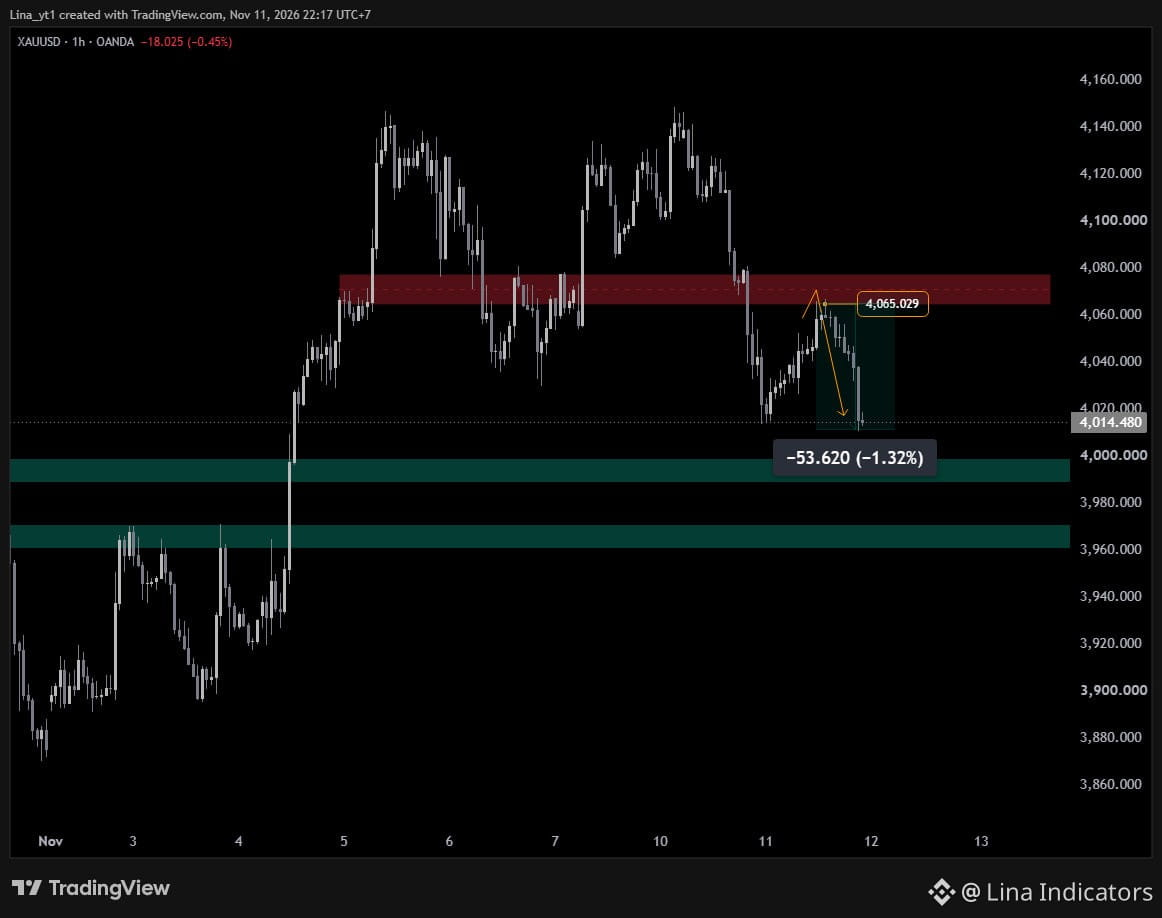
The 4,065–4,081 resistance zone highlighted previously produced a clear reaction.
Gold retested around 4,065 before declining approximately 53.6 points (-1.32%) toward 4,014.
The next important area is 3,990–4,000.
If this support holds, a technical rebound may develop. A breakdown would shift attention toward 3,960–3,970.
For market analysis and educational purposes only.
XAUUSD | H1 Follow-up
The 4,065–4,081 resistance zone highlighted previously produced a clear reaction.
Gold retested around 4,065 before declining approximately 53.6 points (-1.32%) toward 4,014.
The next important area is 3,990–4,000.
If this support holds, a technical rebound may develop. A breakdown would shift attention toward 3,960–3,970.
For market analysis and educational purposes only.
The 4,065–4,081 resistance zone highlighted previously produced a clear reaction.
Gold retested around 4,065 before declining approximately 53.6 points (-1.32%) toward 4,014.
The next important area is 3,990–4,000.
If this support holds, a technical rebound may develop. A breakdown would shift attention toward 3,960–3,970.
For market analysis and educational purposes only.
Lina Indicators
·
--
XAUUSD | H1 Outlook
Gold is trading around 4,034 after a sharp decline.
The key resistance area above is 4,065–4,081.
If price rebounds into this zone but fails to maintain acceptance above it, downside pressure could remain, with 4,000 and 3,960–3,970 as the next areas to monitor.
A sustained hold above 4,081 would weaken the short-term bearish scenario.
For market analysis and educational purposes only.
Gold is trading around 4,034 after a sharp decline.
The key resistance area above is 4,065–4,081.
If price rebounds into this zone but fails to maintain acceptance above it, downside pressure could remain, with 4,000 and 3,960–3,970 as the next areas to monitor.
A sustained hold above 4,081 would weaken the short-term bearish scenario.
For market analysis and educational purposes only.
1
1
323
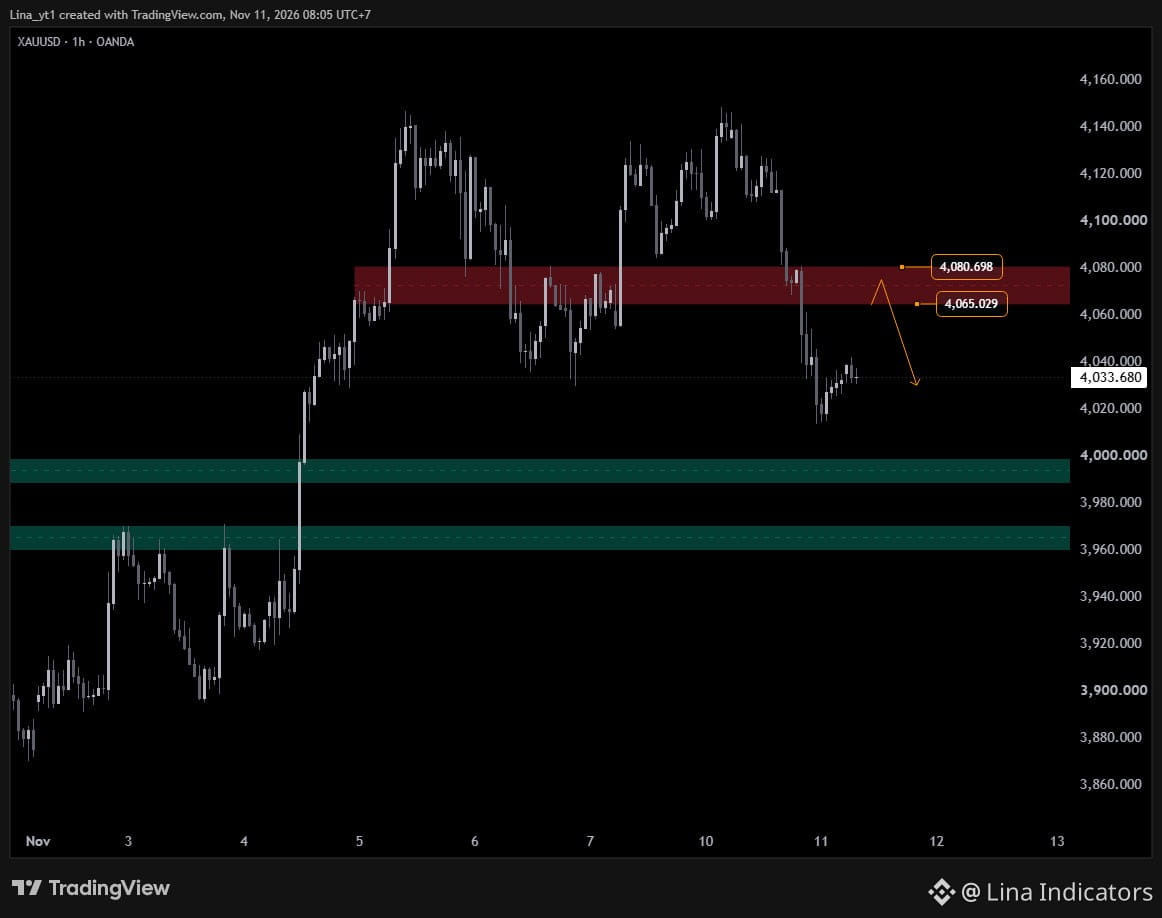
XAUUSD | H1 Outlook
Gold is trading around 4,034 after a sharp decline.
The key resistance area above is 4,065–4,081.
If price rebounds into this zone but fails to maintain acceptance above it, downside pressure could remain, with 4,000 and 3,960–3,970 as the next areas to monitor.
A sustained hold above 4,081 would weaken the short-term bearish scenario.
For market analysis and educational purposes only.
XAUUSD | H1 Outlook
Gold is trading around 4,034 after a sharp decline.
The key resistance area above is 4,065–4,081.
If price rebounds into this zone but fails to maintain acceptance above it, downside pressure could remain, with 4,000 and 3,960–3,970 as the next areas to monitor.
A sustained hold above 4,081 would weaken the short-term bearish scenario.
For market analysis and educational purposes only.
Gold is trading around 4,034 after a sharp decline.
The key resistance area above is 4,065–4,081.
If price rebounds into this zone but fails to maintain acceptance above it, downside pressure could remain, with 4,000 and 3,960–3,970 as the next areas to monitor.
A sustained hold above 4,081 would weaken the short-term bearish scenario.
For market analysis and educational purposes only.
1
3
2
381
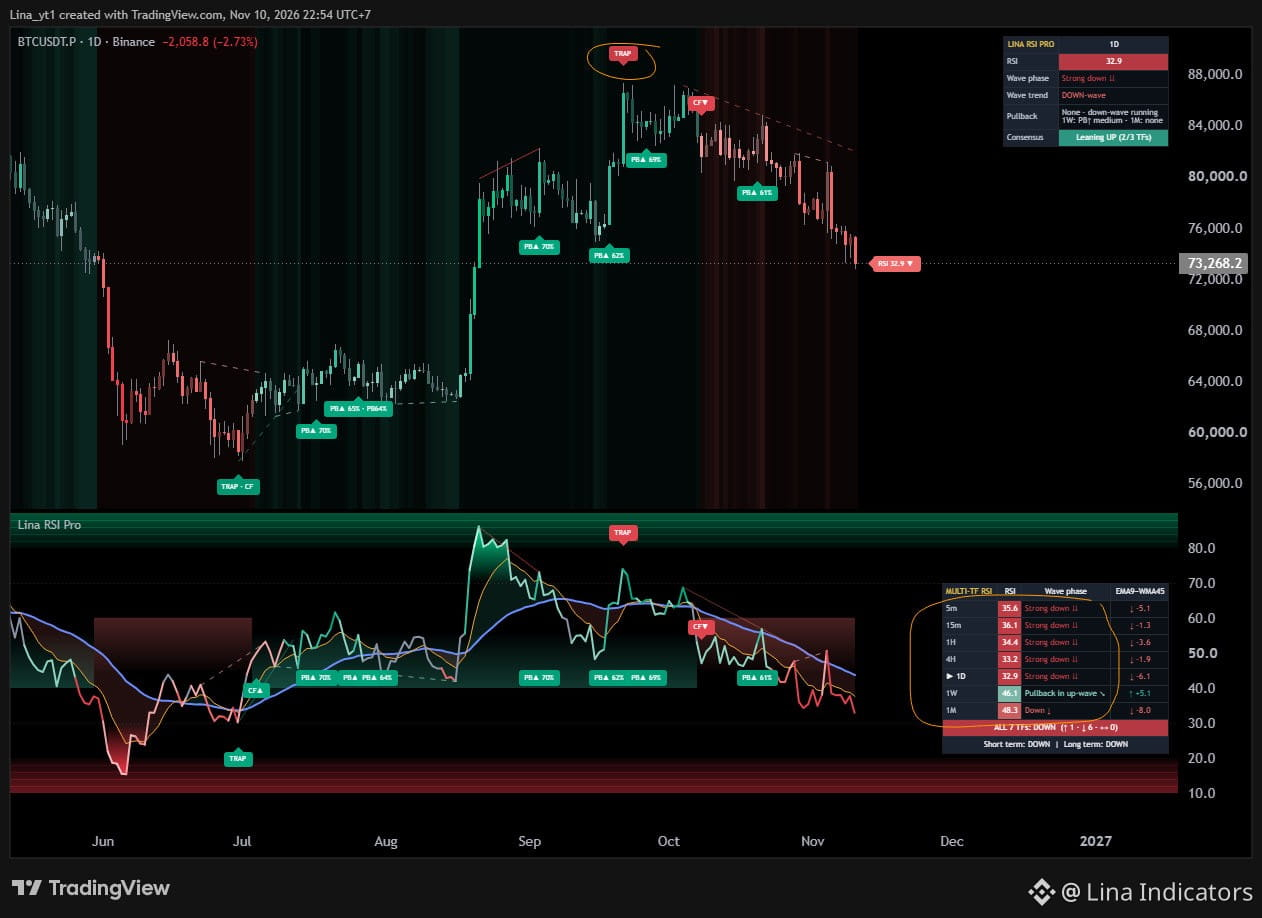
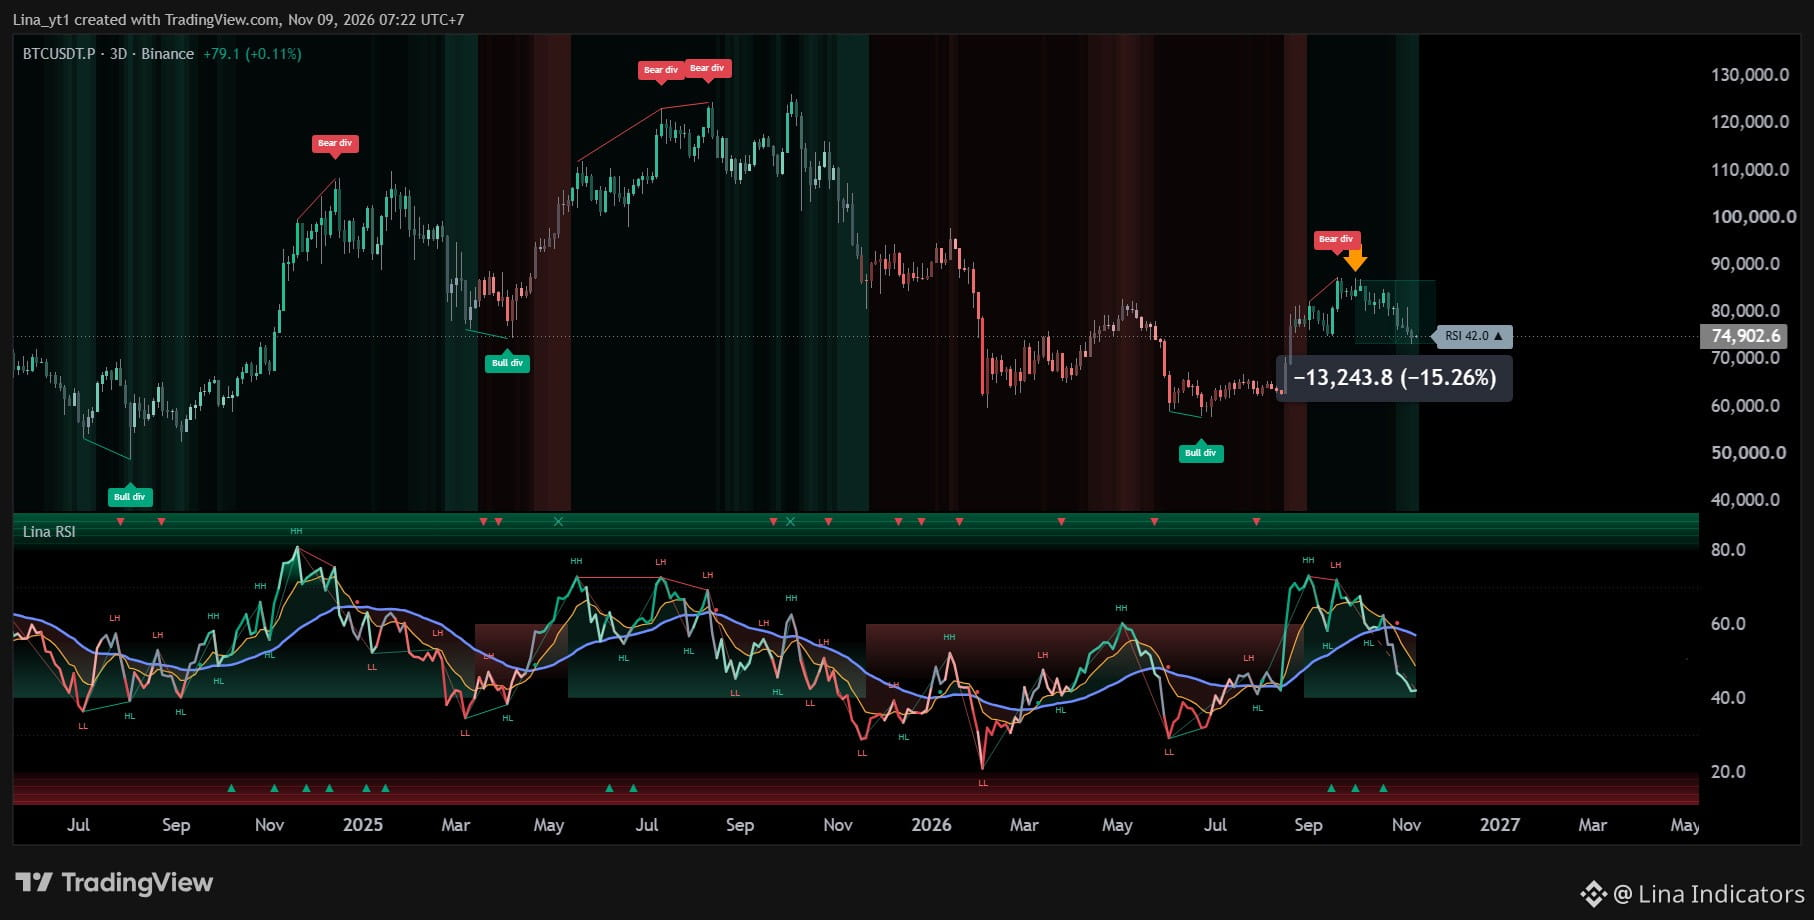
BTC | Multi-Timeframe RSI Update
BTC is trading around $73.3K.
Lina RSI Pro currently shows:
• 5M: Strong down
• 15M: Strong down
• 1H: Strong down
• 4H: Strong down
• 1D: Strong down | RSI 32.9
• 1W: Pullback in up-wave
The short- and medium-term RSI structure remains clearly bearish.
However, daily RSI is already approaching a stretched area, so the next reaction may become increasingly important.
For market analysis and educational purposes only.
BTC | Multi-Timeframe RSI Update
BTC is trading around $73.3K.
Lina RSI Pro currently shows:
• 5M: Strong down
• 15M: Strong down
• 1H: Strong down
• 4H: Strong down
• 1D: Strong down | RSI 32.9
• 1W: Pullback in up-wave
The short- and medium-term RSI structure remains clearly bearish.
However, daily RSI is already approaching a stretched area, so the next reaction may become increasingly important.
For market analysis and educational purposes only.
BTC is trading around $73.3K.
Lina RSI Pro currently shows:
• 5M: Strong down
• 15M: Strong down
• 1H: Strong down
• 4H: Strong down
• 1D: Strong down | RSI 32.9
• 1W: Pullback in up-wave
The short- and medium-term RSI structure remains clearly bearish.
However, daily RSI is already approaching a stretched area, so the next reaction may become increasingly important.
For market analysis and educational purposes only.
2
57
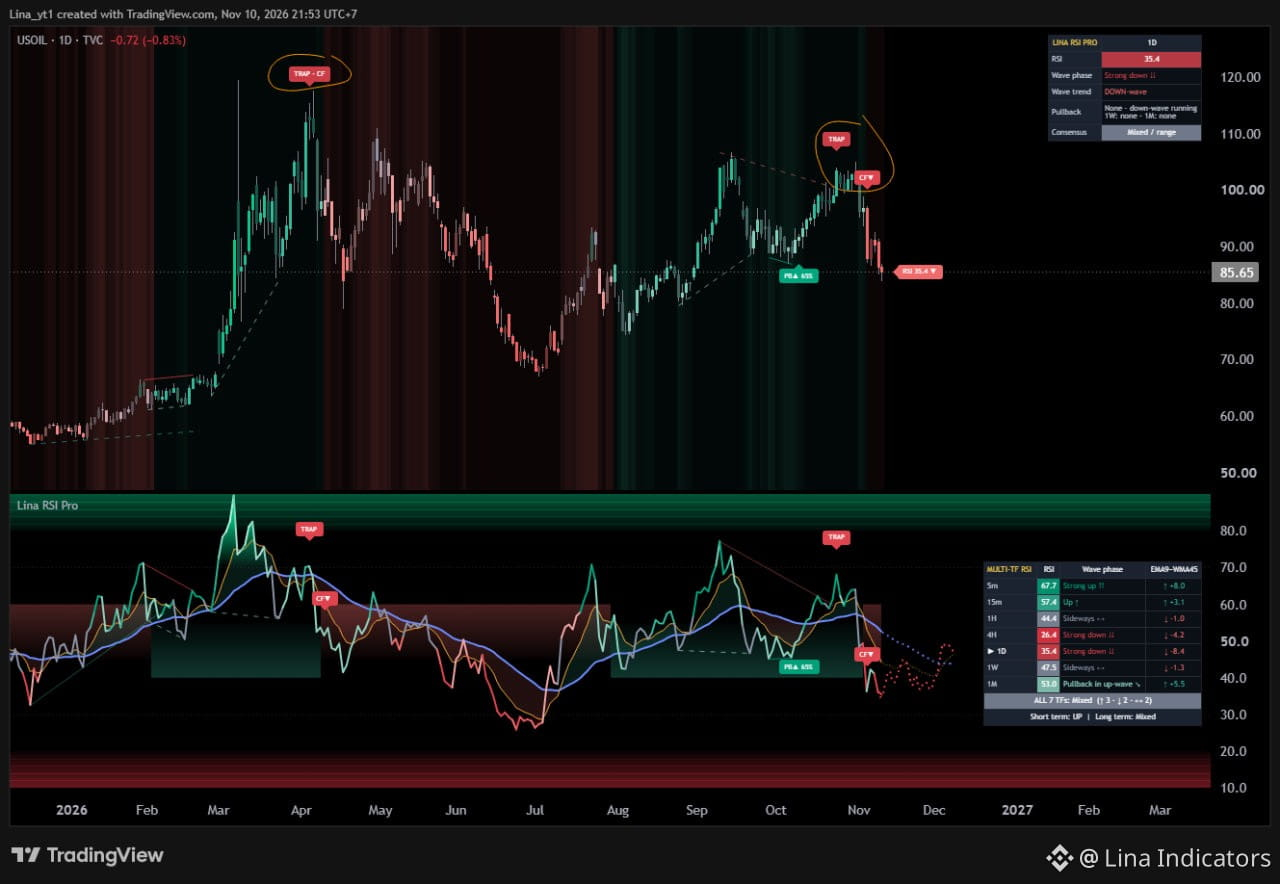
USOIL | Daily RSI Update
Lina RSI Pro displayed a TRAP + CFV near the recent high before Oil declined toward $85.65.
Current structure:
• 1D RSI: ~35.4 — Strong down
• 4H: Strong down
• 1H: Sideways
• 15M: Up
The higher-timeframe momentum remains bearish, while lower timeframes are beginning to show signs of a possible short-term reaction.
This may create a technical bounce, but the daily structure has not yet confirmed a reversal.
For market analysis and educational purposes only.
USOIL | Daily RSI Update
Lina RSI Pro displayed a TRAP + CFV near the recent high before Oil declined toward $85.65.
Current structure:
• 1D RSI: ~35.4 — Strong down
• 4H: Strong down
• 1H: Sideways
• 15M: Up
The higher-timeframe momentum remains bearish, while lower timeframes are beginning to show signs of a possible short-term reaction.
This may create a technical bounce, but the daily structure has not yet confirmed a reversal.
For market analysis and educational purposes only.
Lina RSI Pro displayed a TRAP + CFV near the recent high before Oil declined toward $85.65.
Current structure:
• 1D RSI: ~35.4 — Strong down
• 4H: Strong down
• 1H: Sideways
• 15M: Up
The higher-timeframe momentum remains bearish, while lower timeframes are beginning to show signs of a possible short-term reaction.
This may create a technical bounce, but the daily structure has not yet confirmed a reversal.
For market analysis and educational purposes only.
1
2
280
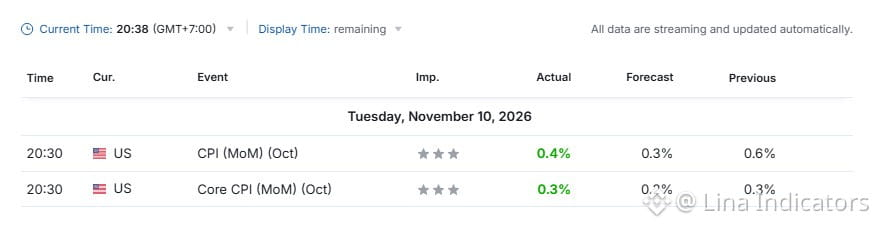
US CPI | October
CPI MoM:
Actual 0.4%
Forecast 0.3%
Previous 0.6%
Core CPI MoM:
Actual 0.3%
Forecast 0.2%
Previous 0.3%
Both readings came in above expectations.
Although headline inflation slowed from September, the hotter-than-expected data suggests inflation pressure remains persistent.
This could support USD/rates expectations and increase volatility across Gold and crypto markets.
For market analysis and educational purposes only.
US CPI | October
CPI MoM:
Actual 0.4%
Forecast 0.3%
Previous 0.6%
Core CPI MoM:
Actual 0.3%
Forecast 0.2%
Previous 0.3%
Both readings came in above expectations.
Although headline inflation slowed from September, the hotter-than-expected data suggests inflation pressure remains persistent.
This could support USD/rates expectations and increase volatility across Gold and crypto markets.
For market analysis and educational purposes only.
CPI MoM:
Actual 0.4%
Forecast 0.3%
Previous 0.6%
Core CPI MoM:
Actual 0.3%
Forecast 0.2%
Previous 0.3%
Both readings came in above expectations.
Although headline inflation slowed from September, the hotter-than-expected data suggests inflation pressure remains persistent.
This could support USD/rates expectations and increase volatility across Gold and crypto markets.
For market analysis and educational purposes only.
1
103
XAUUSD | M5 Update
Lina RSI Pro displayed a TRAP + CFV near the local high before Gold declined by more than 50 points, roughly 1.22%.
Current M5 RSI is around 21.9, showing very strong short-term downside momentum.
However, RSI is now deeply stretched, so the next reaction becomes more important than chasing the current move.
For market analysis and educational purposes only.
XAUUSD | M5 Update
Lina RSI Pro displayed a TRAP + CFV near the local high before Gold declined by more than 50 points, roughly 1.22%.
Current M5 RSI is around 21.9, showing very strong short-term downside momentum.
However, RSI is now deeply stretched, so the next reaction becomes more important than chasing the current move.
For market analysis and educational purposes only.
Lina RSI Pro displayed a TRAP + CFV near the local high before Gold declined by more than 50 points, roughly 1.22%.
Current M5 RSI is around 21.9, showing very strong short-term downside momentum.
However, RSI is now deeply stretched, so the next reaction becomes more important than chasing the current move.
For market analysis and educational purposes only.
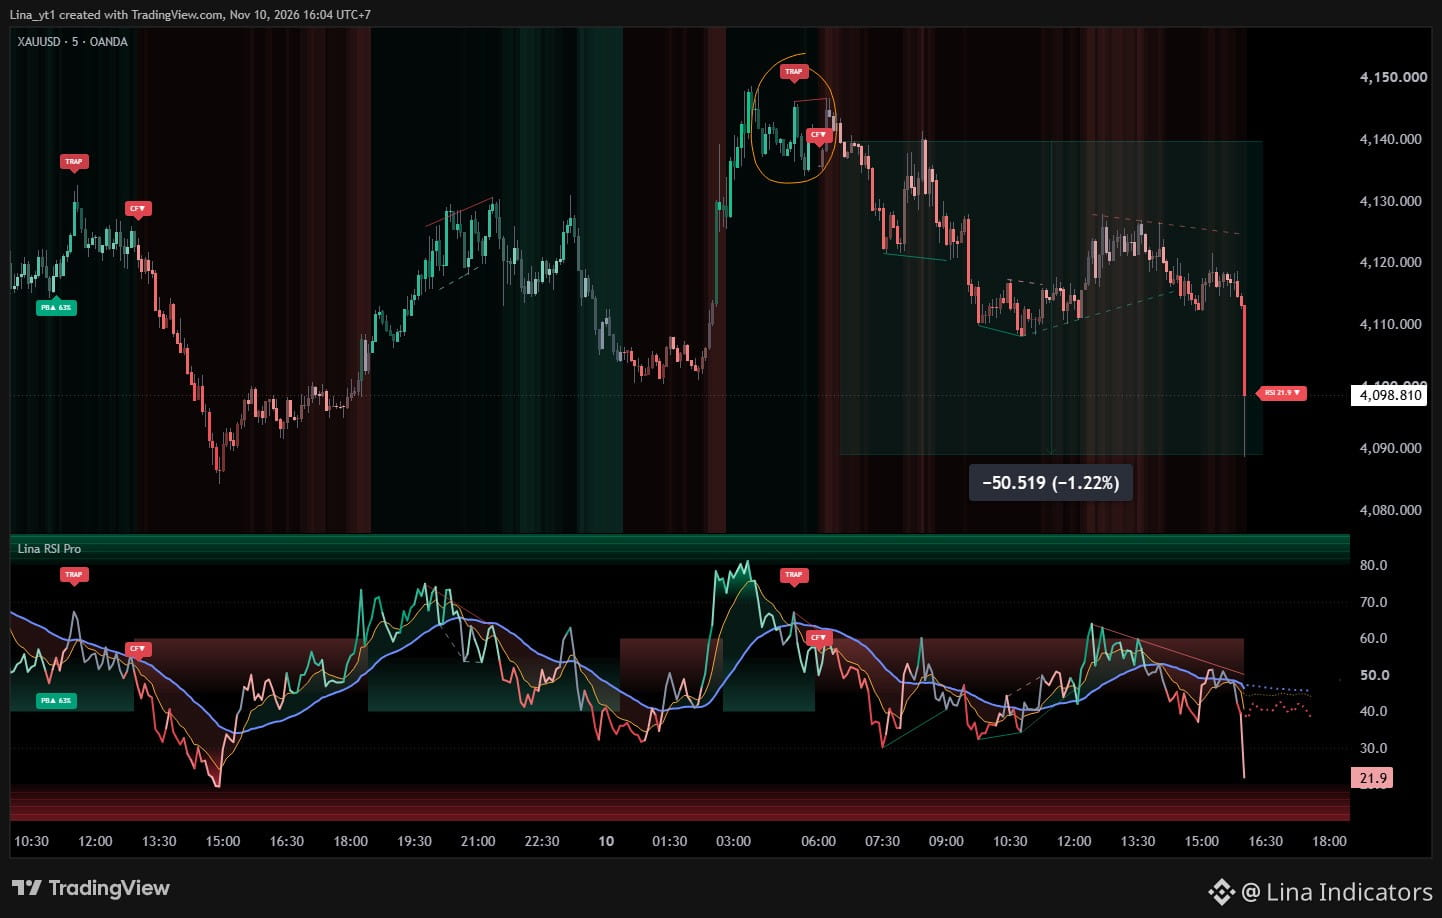
1
1
407
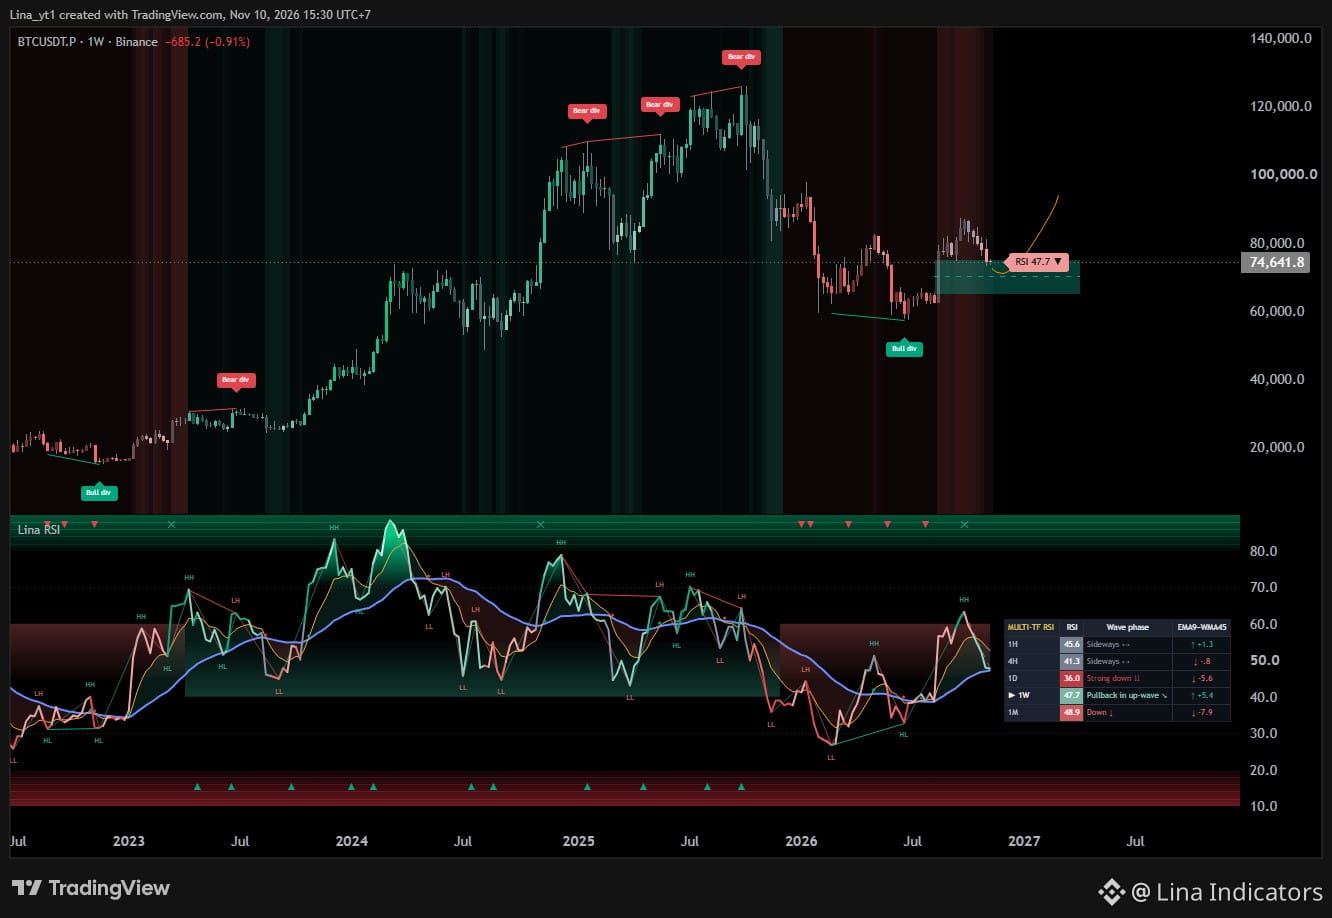
BTC | Weekly Structure Update
BTC is currently trading around $74.6K and remains inside an important weekly support area.
Multi-timeframe RSI:
• 1W: 47.7 — Pullback in up-wave
• 1D: 36.0 — Strong down
• 4H: 41.3 — Sideways
• 1H: 45.6 — Sideways
The weekly bullish divergence remains visible, suggesting that downside momentum may be weakening on the higher timeframe.
However, the daily structure is still weak, so a larger recovery has not yet been confirmed.
The key is whether BTC can hold this weekly support area while RSI structure continues to improve.
For market analysis and educational purposes only.
BTC | Weekly Structure Update
BTC is currently trading around $74.6K and remains inside an important weekly support area.
Multi-timeframe RSI:
• 1W: 47.7 — Pullback in up-wave
• 1D: 36.0 — Strong down
• 4H: 41.3 — Sideways
• 1H: 45.6 — Sideways
The weekly bullish divergence remains visible, suggesting that downside momentum may be weakening on the higher timeframe.
However, the daily structure is still weak, so a larger recovery has not yet been confirmed.
The key is whether BTC can hold this weekly support area while RSI structure continues to improve.
For market analysis and educational purposes only.
BTC is currently trading around $74.6K and remains inside an important weekly support area.
Multi-timeframe RSI:
• 1W: 47.7 — Pullback in up-wave
• 1D: 36.0 — Strong down
• 4H: 41.3 — Sideways
• 1H: 45.6 — Sideways
The weekly bullish divergence remains visible, suggesting that downside momentum may be weakening on the higher timeframe.
However, the daily structure is still weak, so a larger recovery has not yet been confirmed.
The key is whether BTC can hold this weekly support area while RSI structure continues to improve.
For market analysis and educational purposes only.
1
1
118
₿ BlackRock Bitcoin ETF sees $1.66B outflows in seven sessions
US spot Bitcoin ETFs experienced $201M in outflows Monday, with BlackRock's IBIT recording $1.66B in net withdrawals over seven consecutive trading days.
Impact on bitcoin: 🔴 Bearish · Large institutional outflows from major ETF products can signal weakening demand and potential price pressure from forced liquidations or rebalancing.
#BTC #BitcoinNews #BreakingNews
₿ BlackRock Bitcoin ETF sees $1.66B outflows in seven sessions
US spot Bitcoin ETFs experienced $201M in outflows Monday, with BlackRock's IBIT recording $1.66B in net withdrawals over seven consecutive trading days.
Impact on bitcoin: 🔴 Bearish · Large institutional outflows from major ETF products can signal weakening demand and potential price pressure from forced liquidations or rebalancing.
#BTC #BitcoinNews #BreakingNews
US spot Bitcoin ETFs experienced $201M in outflows Monday, with BlackRock's IBIT recording $1.66B in net withdrawals over seven consecutive trading days.
Impact on bitcoin: 🔴 Bearish · Large institutional outflows from major ETF products can signal weakening demand and potential price pressure from forced liquidations or rebalancing.
#BTC #BitcoinNews #BreakingNews
1
79
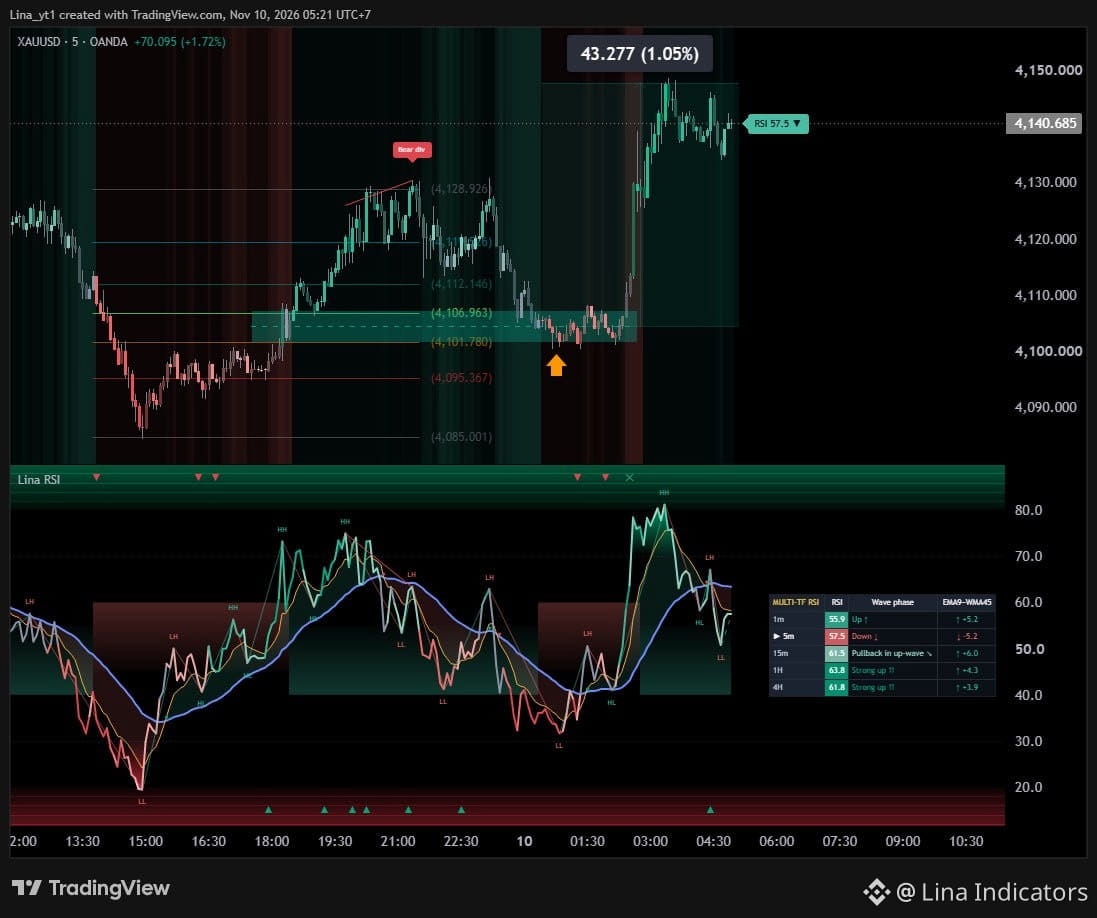
XAUUSD | M5 Follow-up
Yesterday, the focus was on waiting for a short-term pullback while the broader trend remained bullish.
Gold later retraced into the 4,101–4,107 area before rallying toward 4,141.
That represents roughly a +43 point (+1.05%) move from the pullback zone.
Current multi-timeframe RSI structure:
• H1: Strong Up
• H4: Strong Up
• M15: Pullback in up-wave
The higher-timeframe momentum remains constructive, while short-term RSI is beginning to cool again.
Rather than chasing price, the next pullback may provide more useful information about trend continuation.
For market analysis and educational purposes only.
XAUUSD | M5 Follow-up
Yesterday, the focus was on waiting for a short-term pullback while the broader trend remained bullish.
Gold later retraced into the 4,101–4,107 area before rallying toward 4,141.
That represents roughly a +43 point (+1.05%) move from the pullback zone.
Current multi-timeframe RSI structure:
• H1: Strong Up
• H4: Strong Up
• M15: Pullback in up-wave
The higher-timeframe momentum remains constructive, while short-term RSI is beginning to cool again.
Rather than chasing price, the next pullback may provide more useful information about trend continuation.
For market analysis and educational purposes only.
Yesterday, the focus was on waiting for a short-term pullback while the broader trend remained bullish.
Gold later retraced into the 4,101–4,107 area before rallying toward 4,141.
That represents roughly a +43 point (+1.05%) move from the pullback zone.
Current multi-timeframe RSI structure:
• H1: Strong Up
• H4: Strong Up
• M15: Pullback in up-wave
The higher-timeframe momentum remains constructive, while short-term RSI is beginning to cool again.
Rather than chasing price, the next pullback may provide more useful information about trend continuation.
For market analysis and educational purposes only.
Lina Indicators
·
--
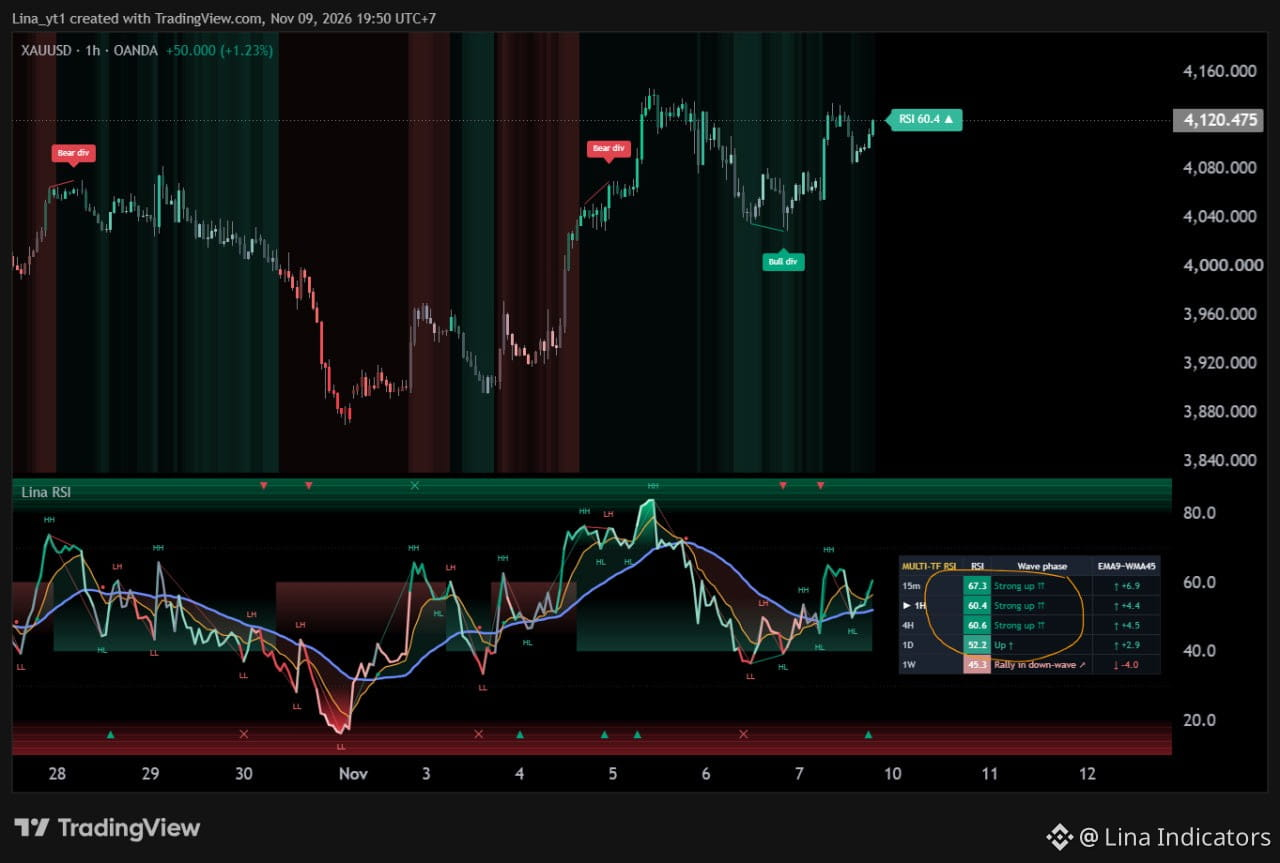
XAUUSD | Multi-Timeframe RSI Update
Gold is trading near 4,118.
RSI structure:
• 15M: 65.5 — Strong up
• 1H: 59.7 — Up
• 4H: 60.3 — Strong up
• 1D: 52.0 — Up
• 1W: 45.2 — Rally in down-wave
Short- and medium-term momentum is improving after the recent bullish divergence, while the weekly structure remains less convincing.
The key is whether H1 and H4 RSI can maintain strength above the neutral zone.
For market analysis and educational purposes only.
Gold is trading near 4,118.
RSI structure:
• 15M: 65.5 — Strong up
• 1H: 59.7 — Up
• 4H: 60.3 — Strong up
• 1D: 52.0 — Up
• 1W: 45.2 — Rally in down-wave
Short- and medium-term momentum is improving after the recent bullish divergence, while the weekly structure remains less convincing.
The key is whether H1 and H4 RSI can maintain strength above the neutral zone.
For market analysis and educational purposes only.
191
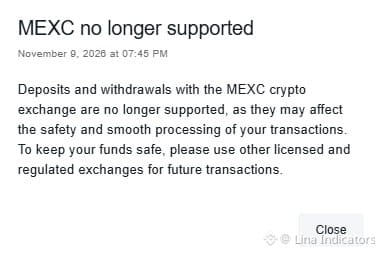
Some platforms have started restricting deposits and withdrawals involving MEXC.
Important distinction: this does not mean MEXC itself has suspended operations. MEXC currently states that its platform remains operational.
However, following recent U.S. regulatory action, additional transfer restrictions from third-party platforms may appear.
Users should verify supported deposit and withdrawal routes before transferring funds.
Some platforms have started restricting deposits and withdrawals involving MEXC.
Important distinction: this does not mean MEXC itself has suspended operations. MEXC currently states that its platform remains operational.
However, following recent U.S. regulatory action, additional transfer restrictions from third-party platforms may appear.
Users should verify supported deposit and withdrawal routes before transferring funds.
Important distinction: this does not mean MEXC itself has suspended operations. MEXC currently states that its platform remains operational.
However, following recent U.S. regulatory action, additional transfer restrictions from third-party platforms may appear.
Users should verify supported deposit and withdrawal routes before transferring funds.
1
1
917
XAUUSD | Multi-Timeframe RSI Update
Gold is trading near 4,118.
RSI structure:
• 15M: 65.5 — Strong up
• 1H: 59.7 — Up
• 4H: 60.3 — Strong up
• 1D: 52.0 — Up
• 1W: 45.2 — Rally in down-wave
Short- and medium-term momentum is improving after the recent bullish divergence, while the weekly structure remains less convincing.
The key is whether H1 and H4 RSI can maintain strength above the neutral zone.
For market analysis and educational purposes only.
XAUUSD | Multi-Timeframe RSI Update
Gold is trading near 4,118.
RSI structure:
• 15M: 65.5 — Strong up
• 1H: 59.7 — Up
• 4H: 60.3 — Strong up
• 1D: 52.0 — Up
• 1W: 45.2 — Rally in down-wave
Short- and medium-term momentum is improving after the recent bullish divergence, while the weekly structure remains less convincing.
The key is whether H1 and H4 RSI can maintain strength above the neutral zone.
For market analysis and educational purposes only.
Gold is trading near 4,118.
RSI structure:
• 15M: 65.5 — Strong up
• 1H: 59.7 — Up
• 4H: 60.3 — Strong up
• 1D: 52.0 — Up
• 1W: 45.2 — Rally in down-wave
Short- and medium-term momentum is improving after the recent bullish divergence, while the weekly structure remains less convincing.
The key is whether H1 and H4 RSI can maintain strength above the neutral zone.
For market analysis and educational purposes only.
1
1
1
271
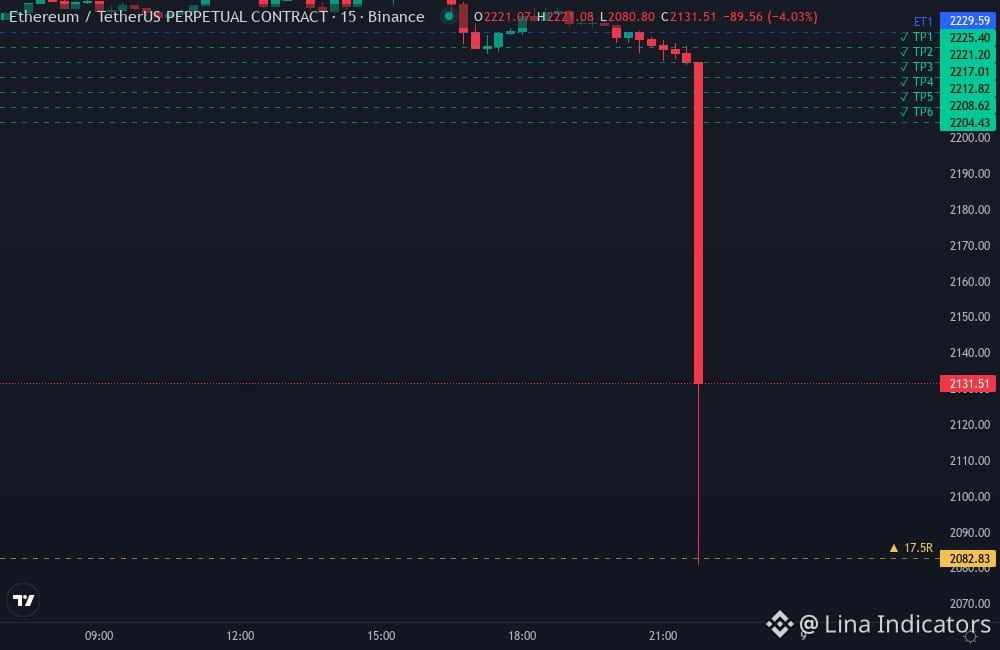
🚀 STILL RUNNING · +$147 · +17.5R
#ETH0014 · ETHUSDT.P · SELL · 15M
Entry 2229.59 → 2082.83
Duration: 4h 56m
Time 04:56 · 09/11/2026
🚀 STILL RUNNING · +$147 · +17.5R
#ETH0014 · ETHUSDT.P · SELL · 15M
Entry 2229.59 → 2082.83
Duration: 4h 56m
Time 04:56 · 09/11/2026
#ETH0014 · ETHUSDT.P · SELL · 15M
Entry 2229.59 → 2082.83
Duration: 4h 56m
Time 04:56 · 09/11/2026
3
284
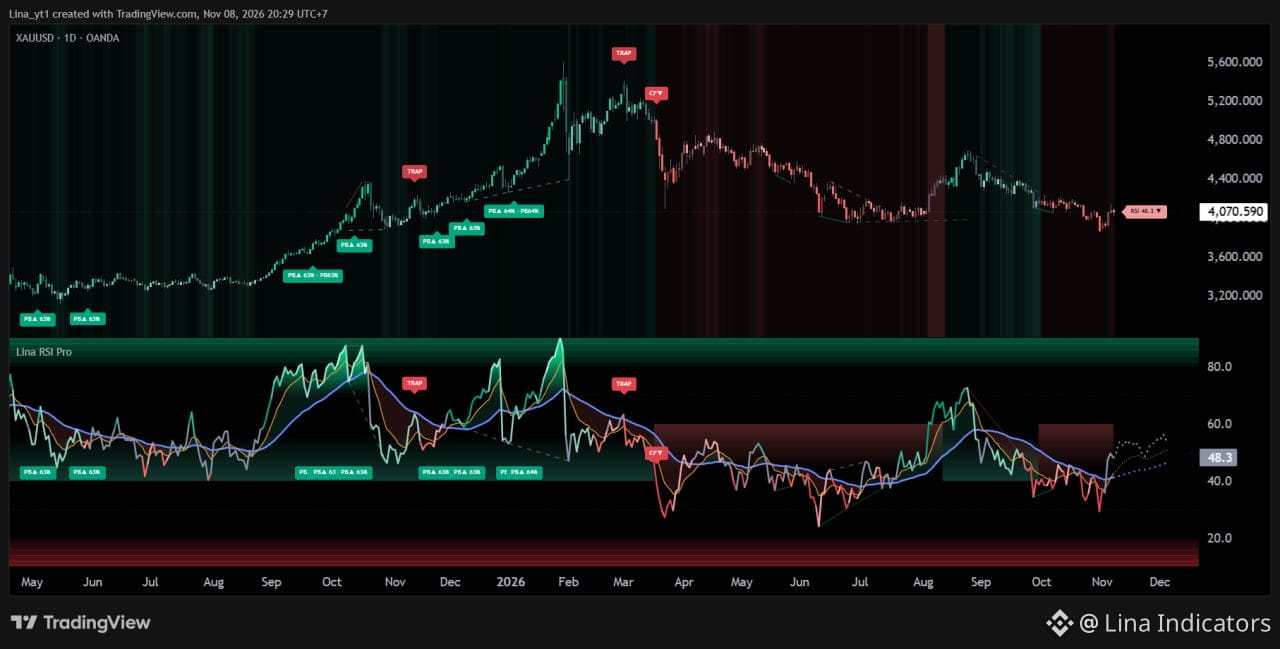
Lina RSI Pro — Wave Traps & Multi-Timeframe Signals 🚀
A new RSI tool focused on:
• RSI Wave structure
• Trap detection
• Multi-Timeframe analysis
• Pullback behavior
The goal is to read momentum structure more clearly instead of relying only on traditional overbought/oversold levels.
Which market should I show first: BTC or XAU?
For market analysis and educational purposes only.
Lina RSI Pro — Wave Traps & Multi-Timeframe Signals 🚀
A new RSI tool focused on:
• RSI Wave structure
• Trap detection
• Multi-Timeframe analysis
• Pullback behavior
The goal is to read momentum structure more clearly instead of relying only on traditional overbought/oversold levels.
Which market should I show first: BTC or XAU?
For market analysis and educational purposes only.
A new RSI tool focused on:
• RSI Wave structure
• Trap detection
• Multi-Timeframe analysis
• Pullback behavior
The goal is to read momentum structure more clearly instead of relying only on traditional overbought/oversold levels.
Which market should I show first: BTC or XAU?
For market analysis and educational purposes only.
1
1
291
Log in to explore more content
Join global crypto users on Binance Square
⚡️ Get latest and useful information about crypto.
💬 Trusted by the world’s largest crypto exchange.
👍 Discover real insights from verified creators.
Email / Phone number
Trending Topics
HuangExitNvidiaStrategyInFocus
40,061 views
669 Discussing
STOCKS | Nvidia’s Jensen Huang Resigns, Colette Kress Named as Interim CEO
Binance News
·16 Likes
·21k views
AnthropicRejectsIPODelayValuationinQuestion
614,917 views
4,994 Discussing
BitMineReports$6.3BNetLossForFiscal2026
4,851 views
84 Discussing