

Kai _Darko
19.4k Posts

Kai _Darko
Report
Block User
563 Following
24.7K+ Followers
18.4K+ Liked
Posts
All
Live
·
--
#EarningsSeason 🔥 BIG TECH EARNINGS ALERT: GOOGLE vs. MICROSOFT! 🚀📊
Two AI powerhouses. Two massive earnings reports. One question: Is the AI boom turning into real, profitable growth—or just record spending?
📅 Both Alphabet (Google’s parent; $GOOGL /GOOG) and Microsoft ($MSFT ) are scheduled to report results after the U.S. market closes on Wednesday, October 28. The figures below are Wall Street expectations, not released results.
🔎 GOOGLE / ALPHABET — Q3 2026
💰 Revenue: Around $127.9 billion, roughly 25% higher year over year.
📈 EPS: Estimates cluster around $3.00 per share.
☁️ Google Cloud: Analysts expect approximately $29.2 billion in revenue, approaching a doubling year over year, with forecast growth near 95%.
🔍 Search: Growth may cool to approximately 14.7%, making AI search competition a key pressure point.
Last quarter, Alphabet generated $119.8 billion in revenue; Google Cloud grew 82% to $24.8 billion, Search rose 17%, and YouTube ads grew 13%. But AI infrastructure investment is surging, and investors want proof that spending can pay off.
💻 MICROSOFT — FY2027 Q1
💰 Revenue: Around $90.6 billion, up roughly 17% year over year.
📈 EPS: Consensus near $4.72–$4.73.
☁️ Azure: Expected growth around 47.7%, with investors watching demand, AI capacity, Copilot adoption, and margins.
Microsoft’s latest reported quarter delivered $90.0 billion in revenue, up 18%, and $4.74 adjusted EPS (GAAP $4.81), demonstrating strong cloud and AI momentum.
⚡ THE REAL SHOWDOWN
Can Google defend Search while scaling Cloud? Can Microsoft turn Azure and Copilot demand into durable profits? Will management raise AI capital-spending plans—or reassure investors about cash flow and returns?
With hyperscaler infrastructure spending forecast at roughly $763 billion across 2026, these reports could shape sentiment across the entire AI trade.
📊 STAY TUNED for the actual results, guidance, and market reaction. The winners may not be those spending the most—but those proving AI can create #CanGoogleDefindItsCore


143
·
--
Bullish
🚨 BREAKING: 🇺🇸 Ripple’s $XRP just scored a major regulatory milestone with final OCC approval for Ripple National Trust Bank!
👀 Could a Federal Reserve master account be the next catalyst? That would be a major development to watch for Ripple’s institutional ambitions.
🚀 $XRP to $5? The excitement is building, but the next move depends on what comes next!
#XRP #Ripple #CryptoNews
{future}(XRPUSDT)
🚨 BREAKING: 🇺🇸 Ripple’s $XRP just scored a major regulatory milestone with final OCC approval for Ripple National Trust Bank!
👀 Could a Federal Reserve master account be the next catalyst? That would be a major development to watch for Ripple’s institutional ambitions.
🚀 $XRP to $5? The excitement is building, but the next move depends on what comes next!
#XRP #Ripple #CryptoNews
👀 Could a Federal Reserve master account be the next catalyst? That would be a major development to watch for Ripple’s institutional ambitions.
🚀 $XRP to $5? The excitement is building, but the next move depends on what comes next!
#XRP #Ripple #CryptoNews


143
·
--
Bullish
$BTC is showing a clear short-term bullish recovery and is currently retesting support. Price is holding around key support at $80,600–$80,900, while higher lows suggest potential upside and a possible sweep of buy-side liquidity above $81,300. A confirmed 15-minute close would strengthen continuation odds.
📈 Entry: $80,650–$80,850
🚀 Targets: $81,150 / $81,500 / $81,900
🛡️ Stop Loss: $80,250
#CanMicrosoftDeliverOnAI #CanGoogleDefindItsCore
📈 Entry: $80,650–$80,850
🚀 Targets: $81,150 / $81,500 / $81,900
🛡️ Stop Loss: $80,250
#CanMicrosoftDeliverOnAI #CanGoogleDefindItsCore
115
·
--
$XAUT (15m bounce is approaching the $4,018–$4,026 resistance zone)
XAUT bounced nicely from $3,994.10, but the recovery still has something to prove. Price is approaching resistance after a sharp drop, so I’m watching for a rejection before considering a short. CoinGlass reports roughly $58.9K in XAUT futures liquidations over the past 24 hours, but that alone doesn’t confirm the next move.
Strategy: Pullback Rejection Short
Sell Zone: $4,024 – $4,027
TG1: $4,017.70
TG2: $4,009.80
TG3: $4,002.00
Stop Loss: $4,032.50
Notes: I wouldn’t rush into this trade at the current price. Let XAUT test the resistance zone and look for a clear rejection on the 15m chart first. If buyers push through $4,030.60 and hold above it, the short setup loses its appeal. Keep leverage sensible and manage risk carefully.
60
·
--
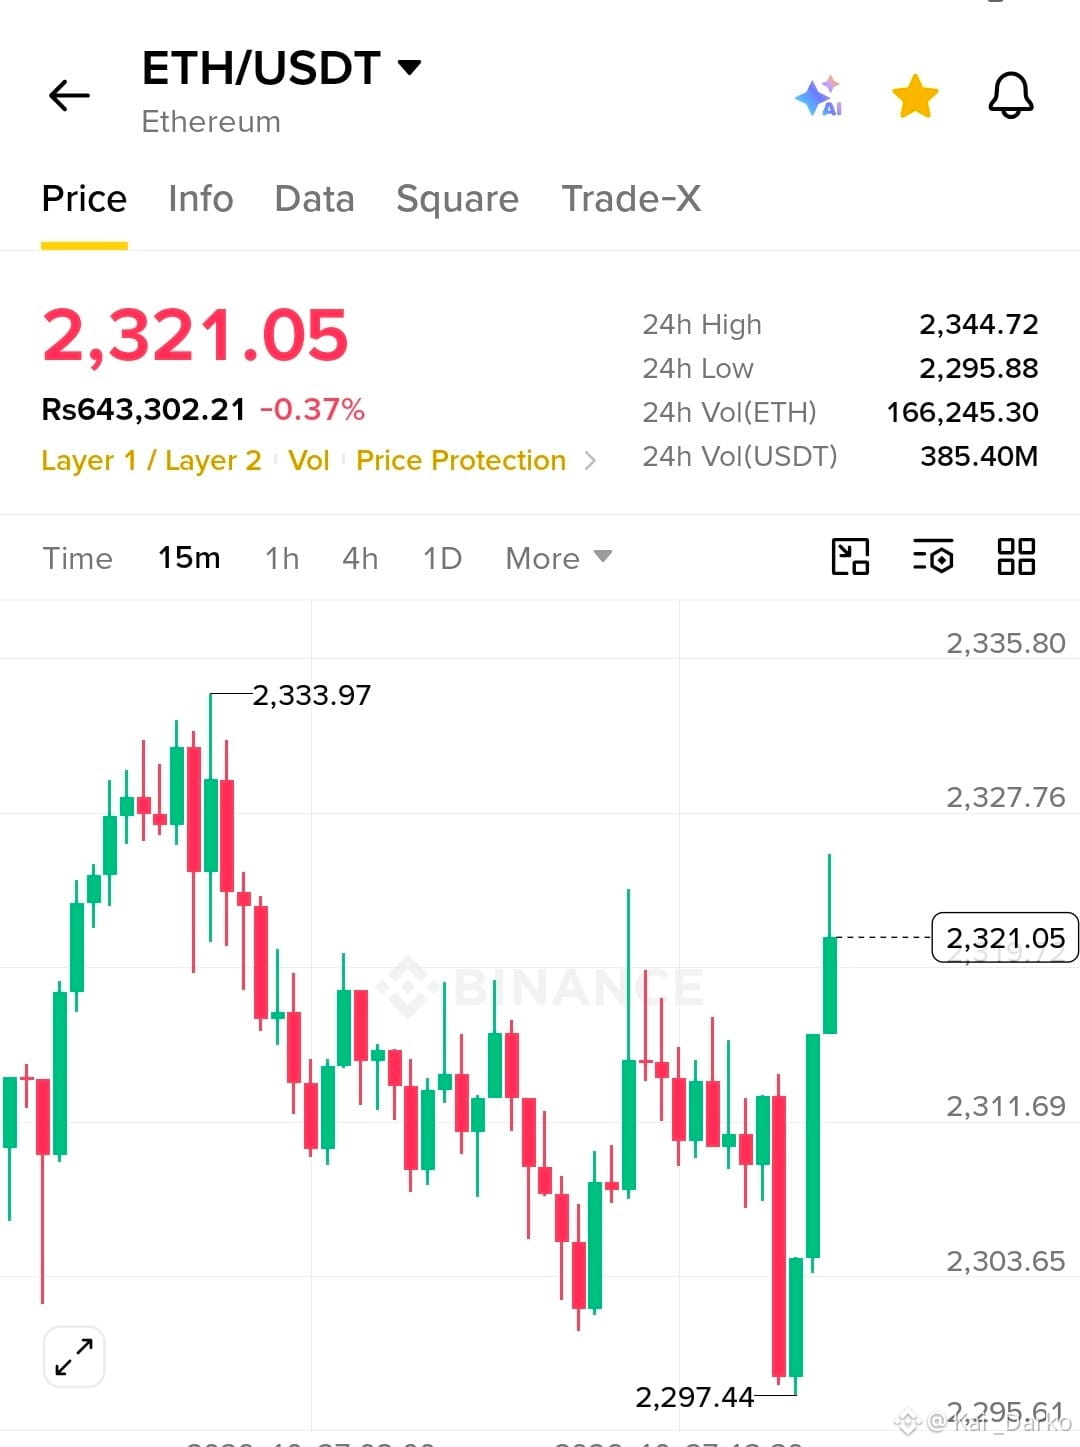
$ETH (Sharp bounce from $2,296, but sellers still have a level to defend)
ETH bounced hard from the $2,296 area, but the 15m structure hasn’t fully turned bullish yet. CoinGlass shows ETH around $2,302 with roughly $30.1B in open interest, so volatility could stay elevated. I’m watching for a failed push into resistance before considering a short.
Strategy: Pullback Rejection Short
Sell Zone: $2,316–$2,322
TG1: $2,305
TG2: $2,297
TG3: $2,288
Stop Loss: $2,334
Notes: I wouldn’t chase ETH after the recent drop. Let price retest the sell zone and look for clear rejection on the 15m chart first. If buyers push through resistance, skip the setup and protect your capital.
#ThailandLaunchesWORPTStablecoinToQRPaymentApp #BitmineAdds10452ETH #SouthKoreaConsidersEducationTaxOnCryptoExchanges
{future}(ETHUSDT)
$ETH (Sharp bounce from $2,296, but sellers still have a level to defend)
ETH bounced hard from the $2,296 area, but the 15m structure hasn’t fully turned bullish yet. CoinGlass shows ETH around $2,302 with roughly $30.1B in open interest, so volatility could stay elevated. I’m watching for a failed push into resistance before considering a short.
Strategy: Pullback Rejection Short
Sell Zone: $2,316–$2,322
TG1: $2,305
TG2: $2,297
TG3: $2,288
Stop Loss: $2,334
Notes: I wouldn’t chase ETH after the recent drop. Let price retest the sell zone and look for clear rejection on the 15m chart first. If buyers push through resistance, skip the setup and protect your capital.
#ThailandLaunchesWORPTStablecoinToQRPaymentApp #BitmineAdds10452ETH #SouthKoreaConsidersEducationTaxOnCryptoExchanges
30
·
--
Bullish
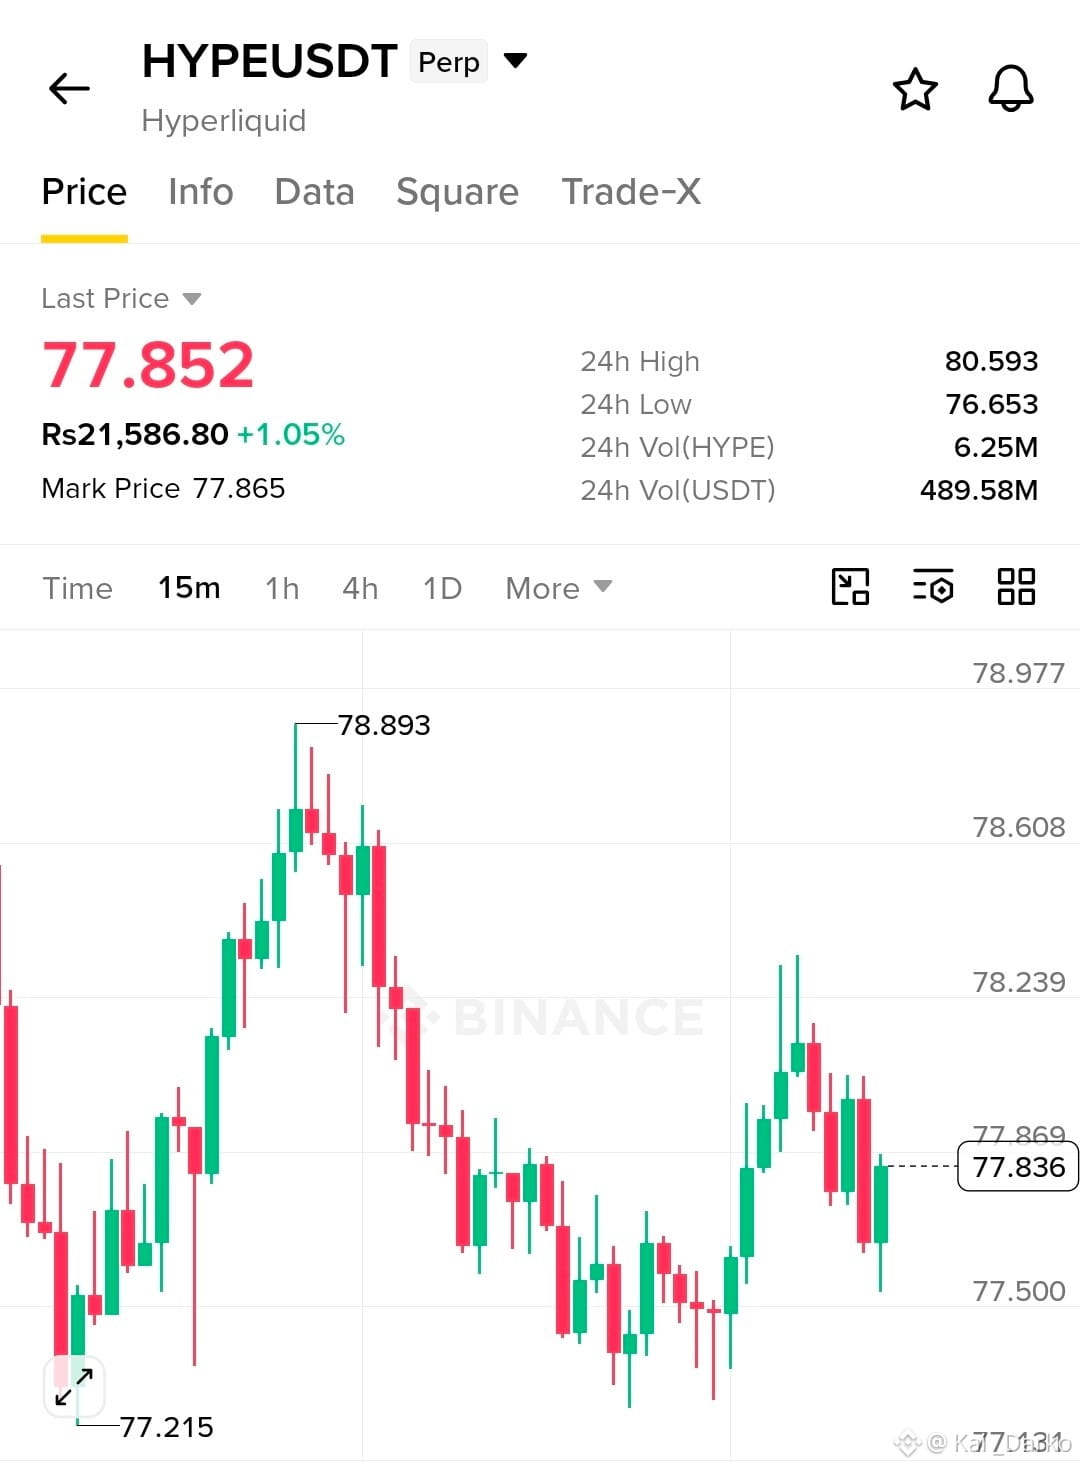
$HYPE (15m bounce is still facing rejection near $78.2)
HYPE is struggling to hold its latest rebound, with lower highs showing up on the 15m chart. CoinGlass reports around $3.12B in open interest and $1.90B in 24h futures volume, so I’d wait for a clean rejection before taking a short.
Strategy: Pullback Rejection Short
Sell Zone: $77.95–$78.25
TG1: $77.55
TG2: $77.30
TG3: $76.85
Stop Loss: $78.60
Notes: Let price retest resistance and confirm the rejection before entering. $77.30 is the key nearby support; if buyers reclaim $78.25 with strength, avoid forcing the short. Keep risk controlled.
111
·
--
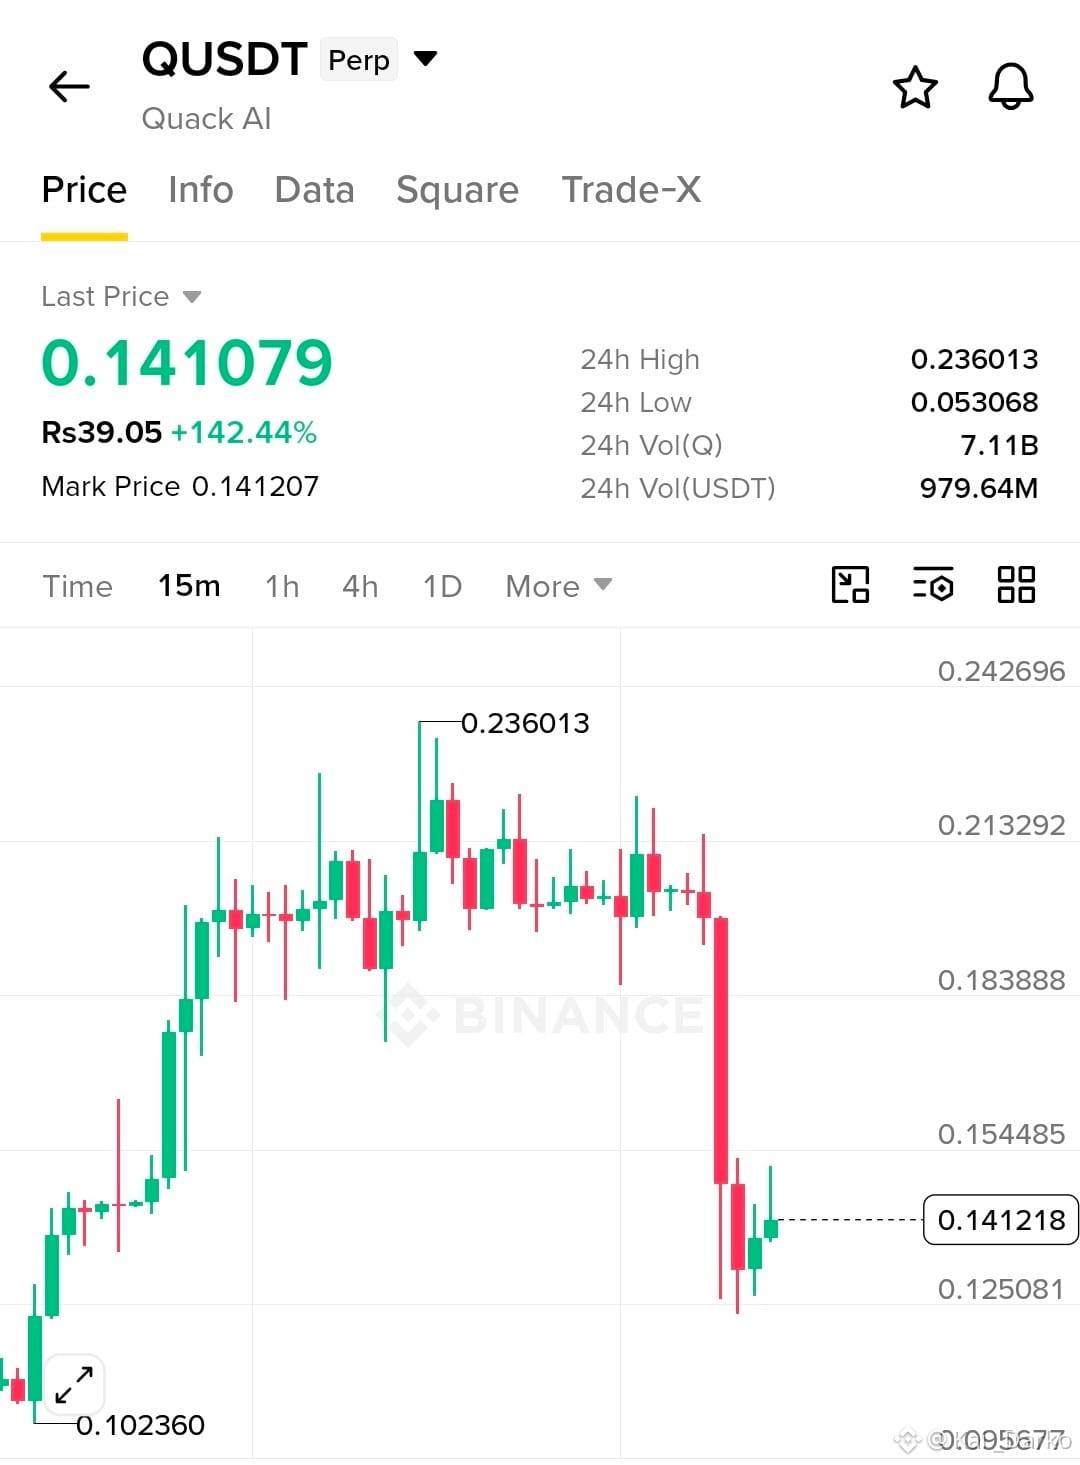
$Q USDT (Q futures liquidations ~$9.6M in 24h; sharp rejection from $0.236)
Q has seen a massive rally, but sellers have stepped in hard after the spike. The rebound looks vulnerable beneath the $0.148–$0.155 resistance zone, so I’d wait for a confirmed rejection rather than chase the move.
Strategy: Breakdown Retest Short
Sell Zone: $0.1480 – $0.1550
TG1: $0.1350
TG2: $0.1260
TG3: $0.1150
Stop Loss: $0.1630
Notes: Let price retest the sell zone and confirm weakness on the 15m chart before entering. Q is extremely volatile, so keep leverage low and manage risk carefully. If price reclaims resistance, skip the setup.
339
·
--
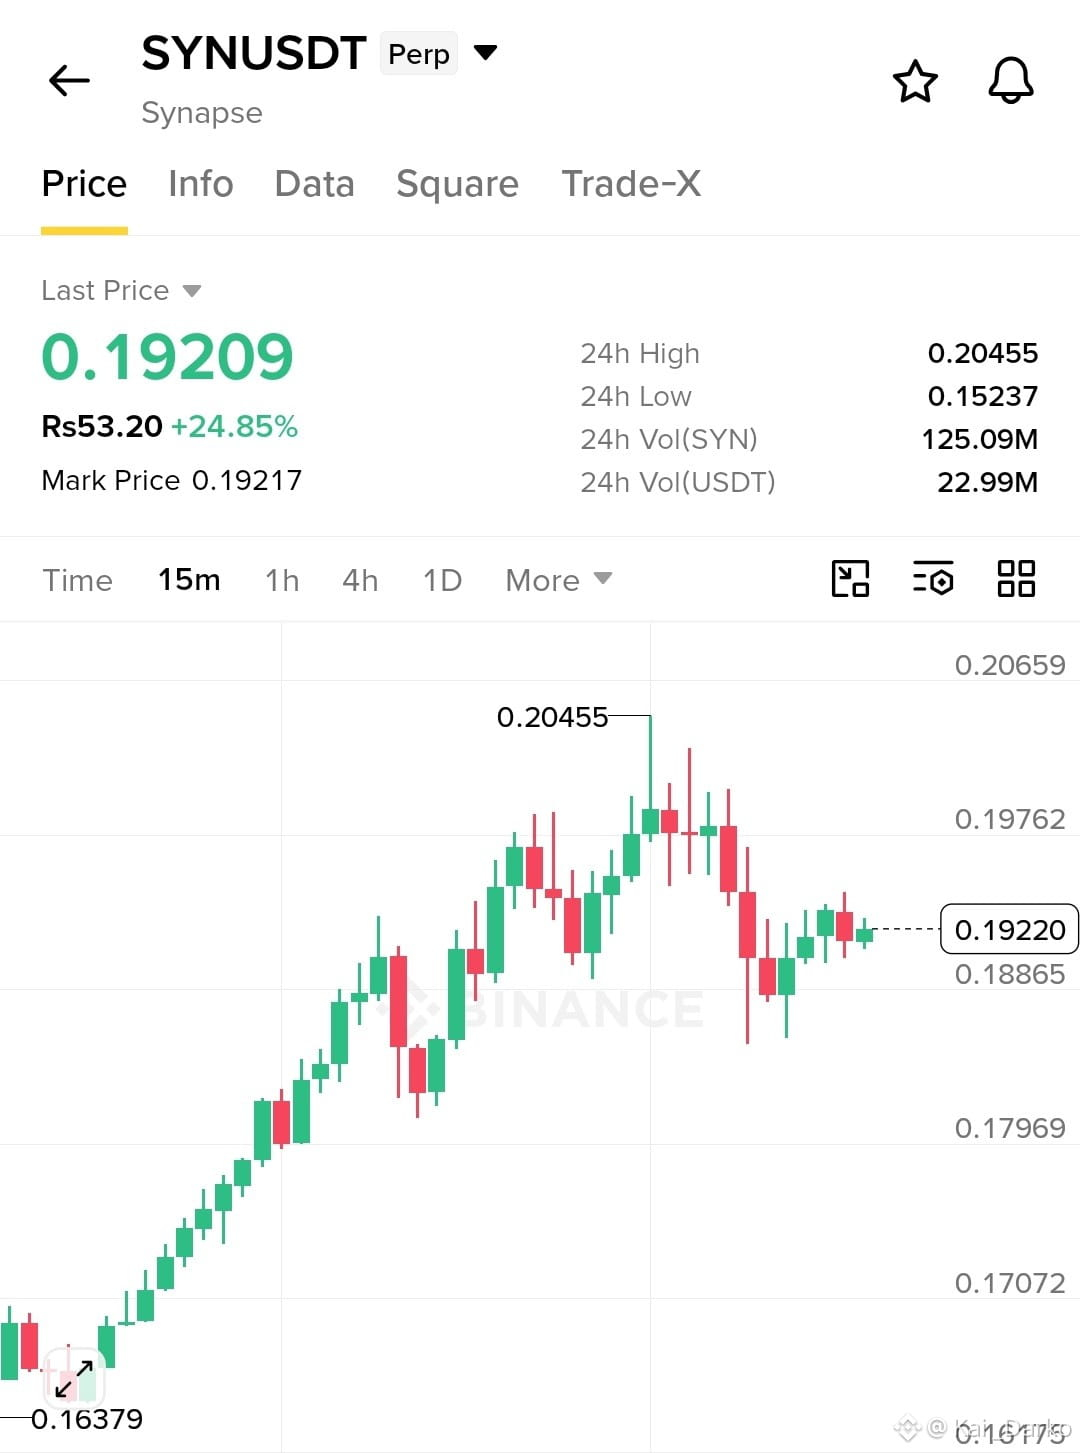
$SYN LONG SETUP ... Buyers Are Trying to Push Higher Again
Entry: 0.1900 – 0.1920
TP1: 0.1950
TP2: 0.1980
Final Target: 0.2045
SL: 0.1860
SYN has made a strong move up, climbing from around 0.1638 to a high of 0.2045 before facing some selling pressure. Price pulled back, but buyers stepped in near the 0.1850–0.1880 area and are now trying to build momentum again.
As long as 0.1880 holds, a recovery towards 0.1980–0.2045 is possible.
The price is still facing resistance after the recent rally, so another rejection could lead to more sideways movement. A clean break above 0.1975 would be a positive sign and could give buyers more confidence to push towards the recent high.
Use stop loss. Don't chase the bounce.
Trade on $SYN
{future}(SYNUSDT)
$SYN LONG SETUP ... Buyers Are Trying to Push Higher Again
Entry: 0.1900 – 0.1920
TP1: 0.1950
TP2: 0.1980
Final Target: 0.2045
SL: 0.1860
SYN has made a strong move up, climbing from around 0.1638 to a high of 0.2045 before facing some selling pressure. Price pulled back, but buyers stepped in near the 0.1850–0.1880 area and are now trying to build momentum again.
As long as 0.1880 holds, a recovery towards 0.1980–0.2045 is possible.
The price is still facing resistance after the recent rally, so another rejection could lead to more sideways movement. A clean break above 0.1975 would be a positive sign and could give buyers more confidence to push towards the recent high.
Use stop loss. Don't chase the bounce.
Trade on $SYN
103
·
--
Bullish
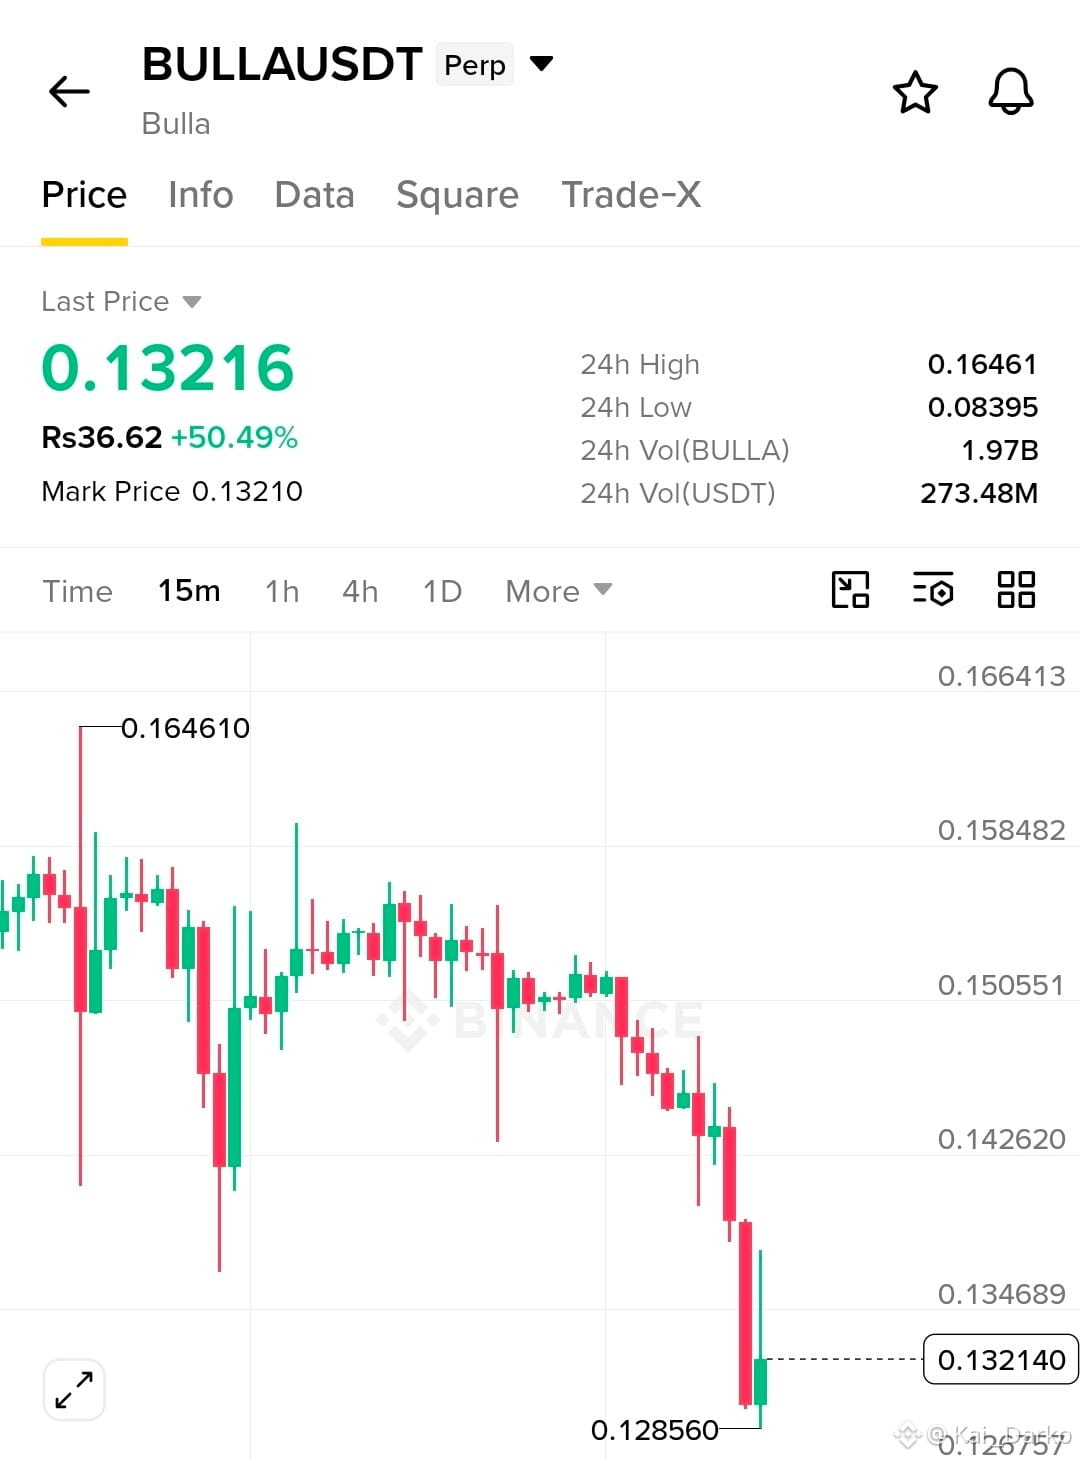
$BULLA LONG SETUP — Can Buyers Turn This Sell-Off Into a Recovery?
Entry: Needs live chart confirmation TP1: Pending confirmation TP2: Pending confirmation Final Target: Pending confirmation SL: Pending confirmation
BULLA recently saw a long liquidation of $5.5162K around $0.13167, showing that long-position traders faced selling pressure near this level. The key question now is whether buyers can step in and build a recovery or if the price will continue lower. A liquidation alone does not confirm a bullish reversal, so watch how price reacts around nearby support.
If buyers reclaim resistance with strong volume, BULLA could attempt an upward move. However, if support breaks and selling pressure increases, further downside remains possible. The direction is not confirmed yet.
Pro tip: Wait for a clear breakout or support retest before entering. Avoid chasing sudden candles, and always manage your risk.
Trade on $BULLA
{future}(BULLAUSDT)
#SouthKoreaConsidersEducationTaxOnCryptoExchanges #OCCUrgesCommunityBanksToEnterStablecoinPayments #RippleWinsFullApprovalAsNationalTrustBank
$BULLA LONG SETUP — Can Buyers Turn This Sell-Off Into a Recovery?
Entry: Needs live chart confirmation TP1: Pending confirmation TP2: Pending confirmation Final Target: Pending confirmation SL: Pending confirmation
BULLA recently saw a long liquidation of $5.5162K around $0.13167, showing that long-position traders faced selling pressure near this level. The key question now is whether buyers can step in and build a recovery or if the price will continue lower. A liquidation alone does not confirm a bullish reversal, so watch how price reacts around nearby support.
If buyers reclaim resistance with strong volume, BULLA could attempt an upward move. However, if support breaks and selling pressure increases, further downside remains possible. The direction is not confirmed yet.
Pro tip: Wait for a clear breakout or support retest before entering. Avoid chasing sudden candles, and always manage your risk.
Trade on $BULLA
#SouthKoreaConsidersEducationTaxOnCryptoExchanges #OCCUrgesCommunityBanksToEnterStablecoinPayments #RippleWinsFullApprovalAsNationalTrustBank
184
·
--
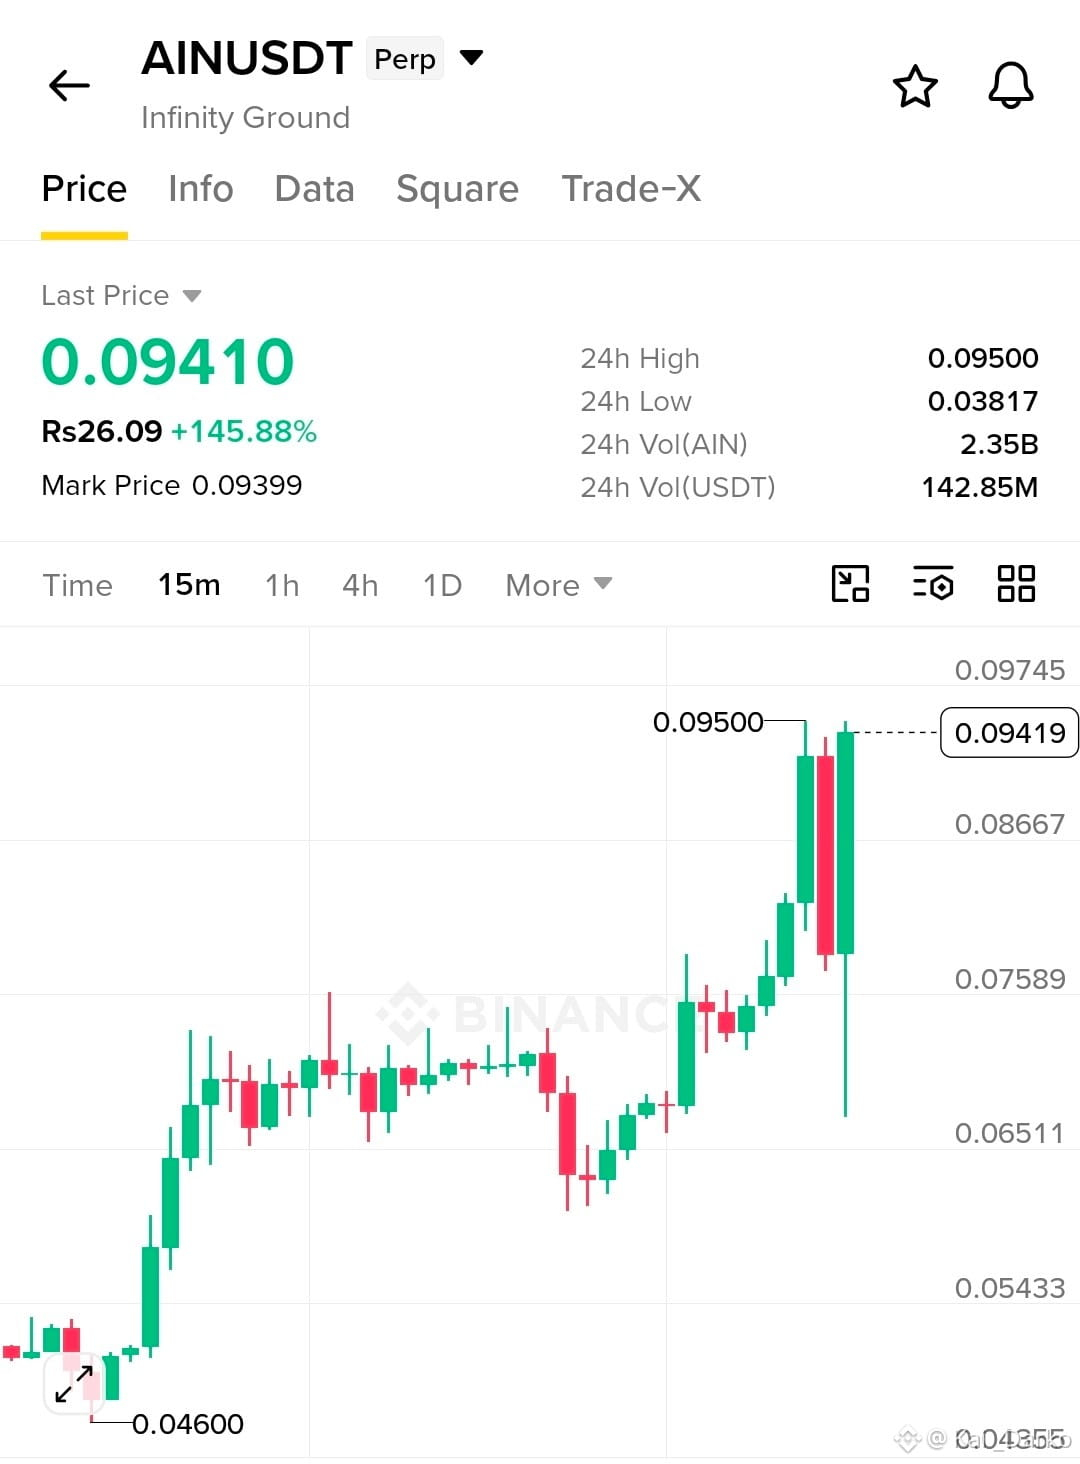
$AIN SHORT SETUP ... Sellers Are Pressuring the Price, But Watch for a Bounce
Entry: Need current market price TP1: To be confirmed TP2: To be confirmed Final Target: To be confirmed SL: To be confirmed
$AIN is showing short-liquidation activity around $0.09123, with approximately $9.37K in liquidated short positions. This alone doesn't confirm the next move, so watch how price reacts around nearby support and resistance before entering a trade.
If sellers keep control and price breaks below confirmed support, further downside may follow. A break above nearby resistance, however, could trigger a recovery and put short sellers under pressure.
Pro tip: Wait for a confirmed breakdown before taking a short position. Don't chase the move, and always use a stop loss.
Trade on $AIN
{future}(AINUSDT)
#BinancePick #EarningsSeason #BitmineAdds10452ETH
$AIN SHORT SETUP ... Sellers Are Pressuring the Price, But Watch for a Bounce
Entry: Need current market price TP1: To be confirmed TP2: To be confirmed Final Target: To be confirmed SL: To be confirmed
$AIN is showing short-liquidation activity around $0.09123, with approximately $9.37K in liquidated short positions. This alone doesn't confirm the next move, so watch how price reacts around nearby support and resistance before entering a trade.
If sellers keep control and price breaks below confirmed support, further downside may follow. A break above nearby resistance, however, could trigger a recovery and put short sellers under pressure.
Pro tip: Wait for a confirmed breakdown before taking a short position. Don't chase the move, and always use a stop loss.
Trade on $AIN
#BinancePick #EarningsSeason #BitmineAdds10452ETH
210
·
--
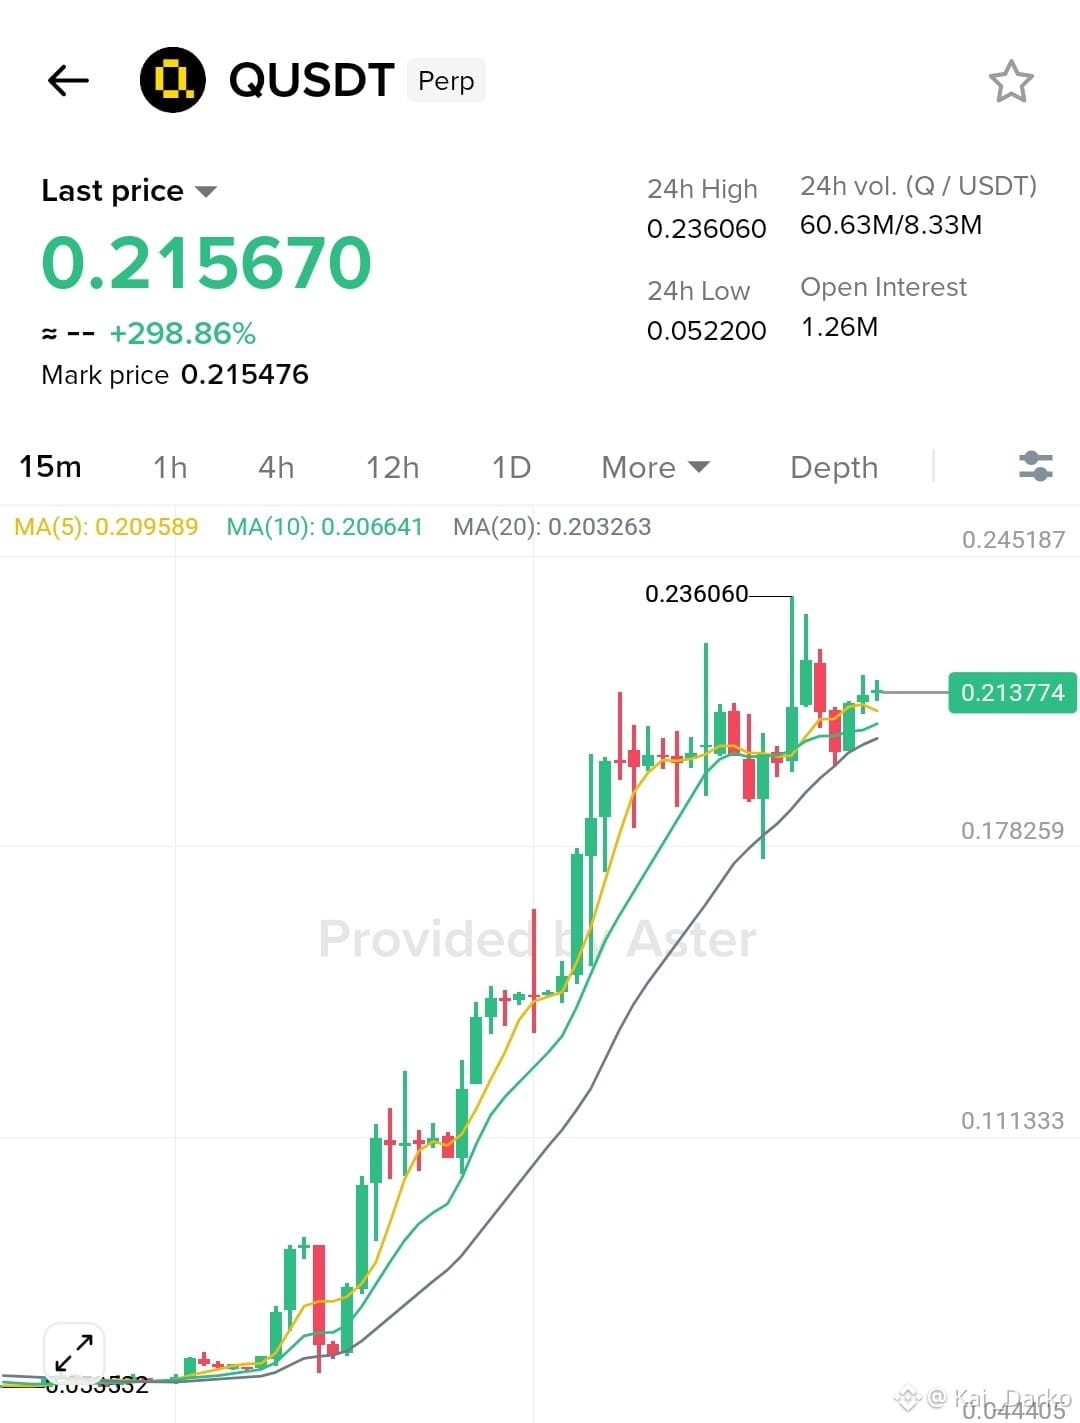
$Q LONG SETUP ... Buyers Eye a Recovery After Short Liquidations
Entry: Await confirmation TP1: To be confirmed TP2: To be confirmed Final Target: To be confirmed SL: To be confirmed
$Q is showing signs of a possible bounce after $6.81K in short liquidations near $0.21666. Buyers may try to take control, but the next move needs confirmation.
A strong hold above support could open the door to recovery. A breakout above resistance would strengthen the bullish case, while rejection could bring fresh selling pressure.
Use stop loss. Don't chase the bounce.
Trade on $Q
{future}(QUSDT)
#BinancePick #EarningsSeason #BitmineAdds10452ETH
$Q LONG SETUP ... Buyers Eye a Recovery After Short Liquidations
Entry: Await confirmation TP1: To be confirmed TP2: To be confirmed Final Target: To be confirmed SL: To be confirmed
$Q is showing signs of a possible bounce after $6.81K in short liquidations near $0.21666. Buyers may try to take control, but the next move needs confirmation.
A strong hold above support could open the door to recovery. A breakout above resistance would strengthen the bullish case, while rejection could bring fresh selling pressure.
Use stop loss. Don't chase the bounce.
Trade on $Q
#BinancePick #EarningsSeason #BitmineAdds10452ETH
276
·
--
Bullish
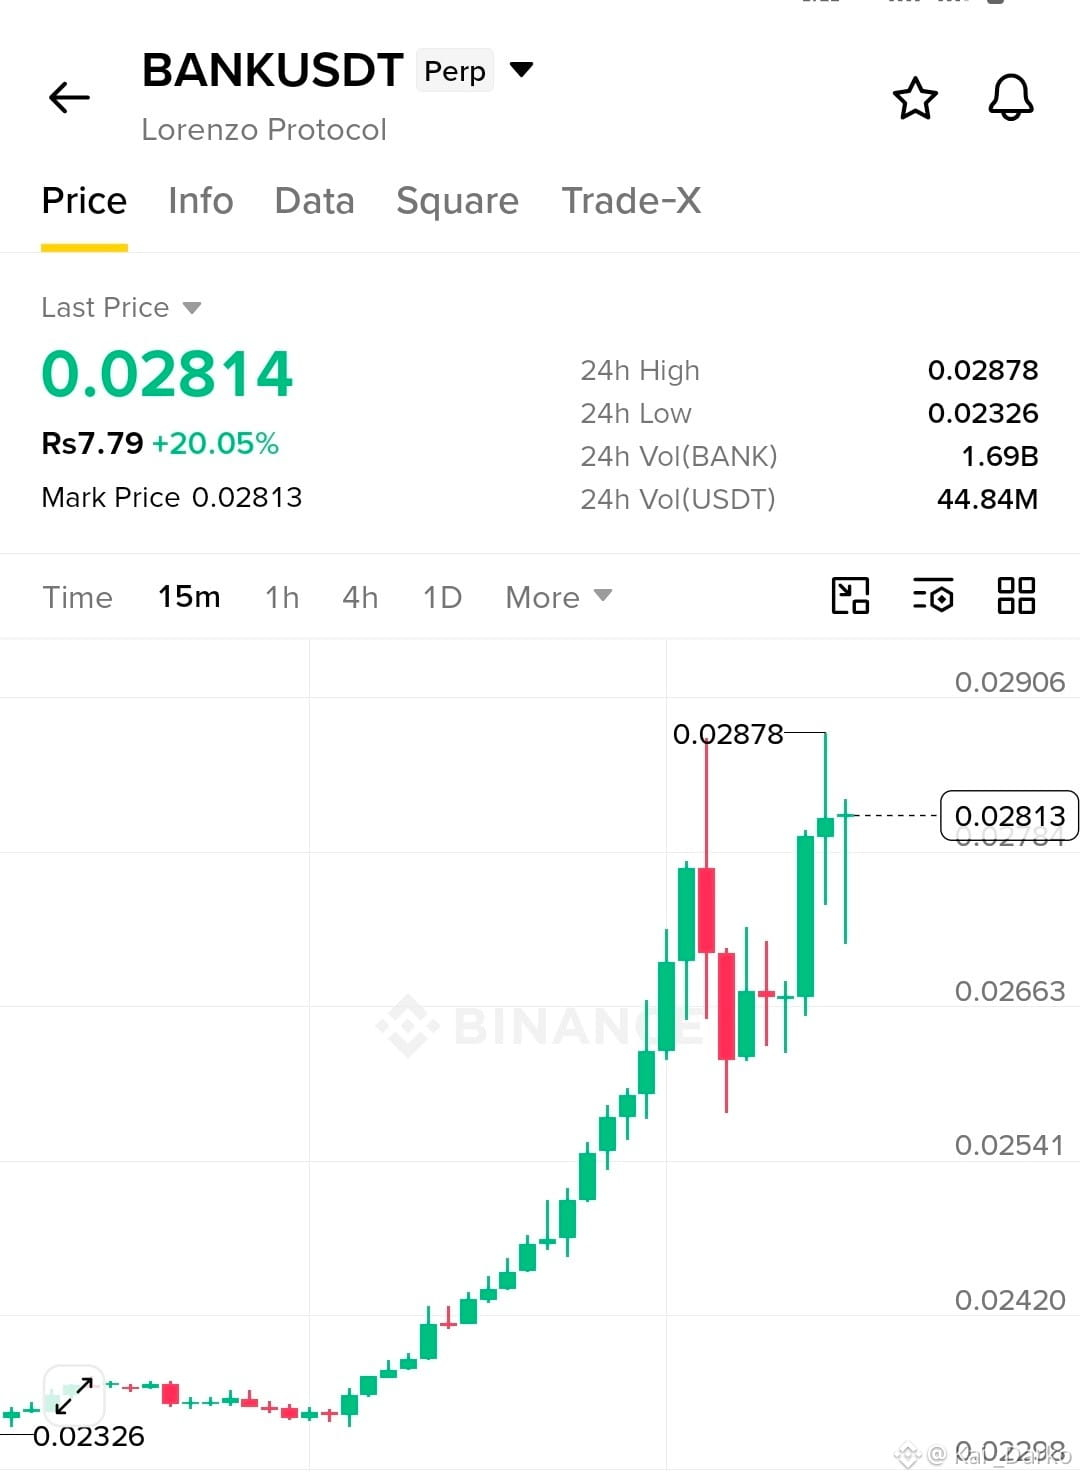
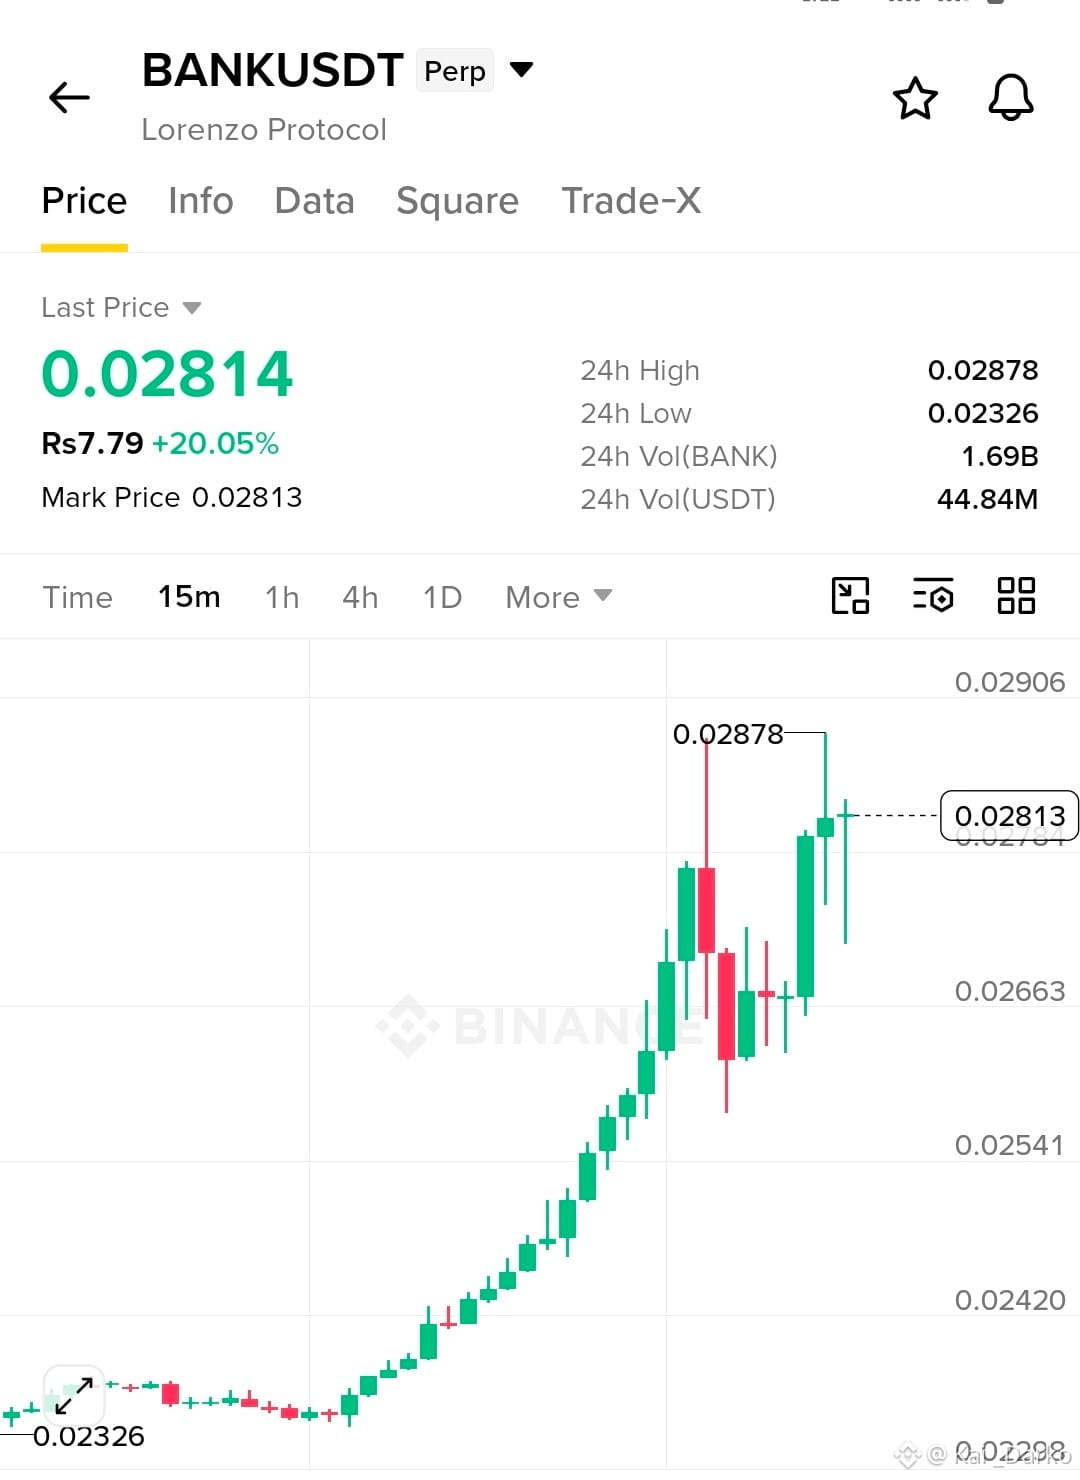
$BANK LONG SETUP — Buyers Are Fighting Back, But The Breakout Still Matters
Entry: $0.0260 – $0.0268 TP1: $0.0278 TP2: $0.0288 Final Target: $0.0300 SL: $0.0230
BANK is showing signs of recovery after bouncing from the $0.0233 support zone. Buyers have stepped in, and the price is pushing toward nearby resistance. The short liquidations around $0.02799 show that the market is testing higher levels, but buyers still need to prove their strength.
As long as $0.0233 holds, a recovery toward $0.0278–$0.0300 remains possible. The key level to watch is $0.0288. A clean breakout above this resistance could give the recovery more strength, while rejection may bring fresh selling pressure.
Use stop loss. Don't chase the bounce.
Trade on $BANK
{future}(BANKUSDT)
#BinancePick #EarningsSeason
$BANK LONG SETUP — Buyers Are Fighting Back, But The Breakout Still Matters
Entry: $0.0260 – $0.0268 TP1: $0.0278 TP2: $0.0288 Final Target: $0.0300 SL: $0.0230
BANK is showing signs of recovery after bouncing from the $0.0233 support zone. Buyers have stepped in, and the price is pushing toward nearby resistance. The short liquidations around $0.02799 show that the market is testing higher levels, but buyers still need to prove their strength.
As long as $0.0233 holds, a recovery toward $0.0278–$0.0300 remains possible. The key level to watch is $0.0288. A clean breakout above this resistance could give the recovery more strength, while rejection may bring fresh selling pressure.
Use stop loss. Don't chase the bounce.
Trade on $BANK
#BinancePick #EarningsSeason
1
352
·
--
Bullish
$BANK LONG SETUP — Buyers Are Fighting Back, But The Breakout Still Matters
Entry: $0.0260 – $0.0268 TP1: $0.0278 TP2: $0.0288 Final Target: $0.0300 SL: $0.0230
BANK is showing signs of recovery after bouncing from the $0.0233 support zone. Buyers have stepped in, and the price is pushing toward nearby resistance. The short liquidations around $0.02799 show that the market is testing higher levels, but buyers still need to prove their strength.
As long as $0.0233 holds, a recovery toward $0.0278–$0.0300 remains possible. The key level to watch is $0.0288. A clean breakout above this resistance could give the recovery more strength, while rejection may bring fresh selling pressure.
Use stop loss. Don't chase the bounce.
Trade on $BANK
{future}(BANKUSDT)
#BinancePick #EarningsSeason
$BANK LONG SETUP — Buyers Are Fighting Back, But The Breakout Still Matters
Entry: $0.0260 – $0.0268 TP1: $0.0278 TP2: $0.0288 Final Target: $0.0300 SL: $0.0230
BANK is showing signs of recovery after bouncing from the $0.0233 support zone. Buyers have stepped in, and the price is pushing toward nearby resistance. The short liquidations around $0.02799 show that the market is testing higher levels, but buyers still need to prove their strength.
As long as $0.0233 holds, a recovery toward $0.0278–$0.0300 remains possible. The key level to watch is $0.0288. A clean breakout above this resistance could give the recovery more strength, while rejection may bring fresh selling pressure.
Use stop loss. Don't chase the bounce.
Trade on $BANK
#BinancePick #EarningsSeason
Entry: $0.0260 – $0.0268 TP1: $0.0278 TP2: $0.0288 Final Target: $0.0300 SL: $0.0230
BANK is showing signs of recovery after bouncing from the $0.0233 support zone. Buyers have stepped in, and the price is pushing toward nearby resistance. The short liquidations around $0.02799 show that the market is testing higher levels, but buyers still need to prove their strength.
As long as $0.0233 holds, a recovery toward $0.0278–$0.0300 remains possible. The key level to watch is $0.0288. A clean breakout above this resistance could give the recovery more strength, while rejection may bring fresh selling pressure.
Use stop loss. Don't chase the bounce.
Trade on $BANK
#BinancePick #EarningsSeason
1
250
·
--
Bullish
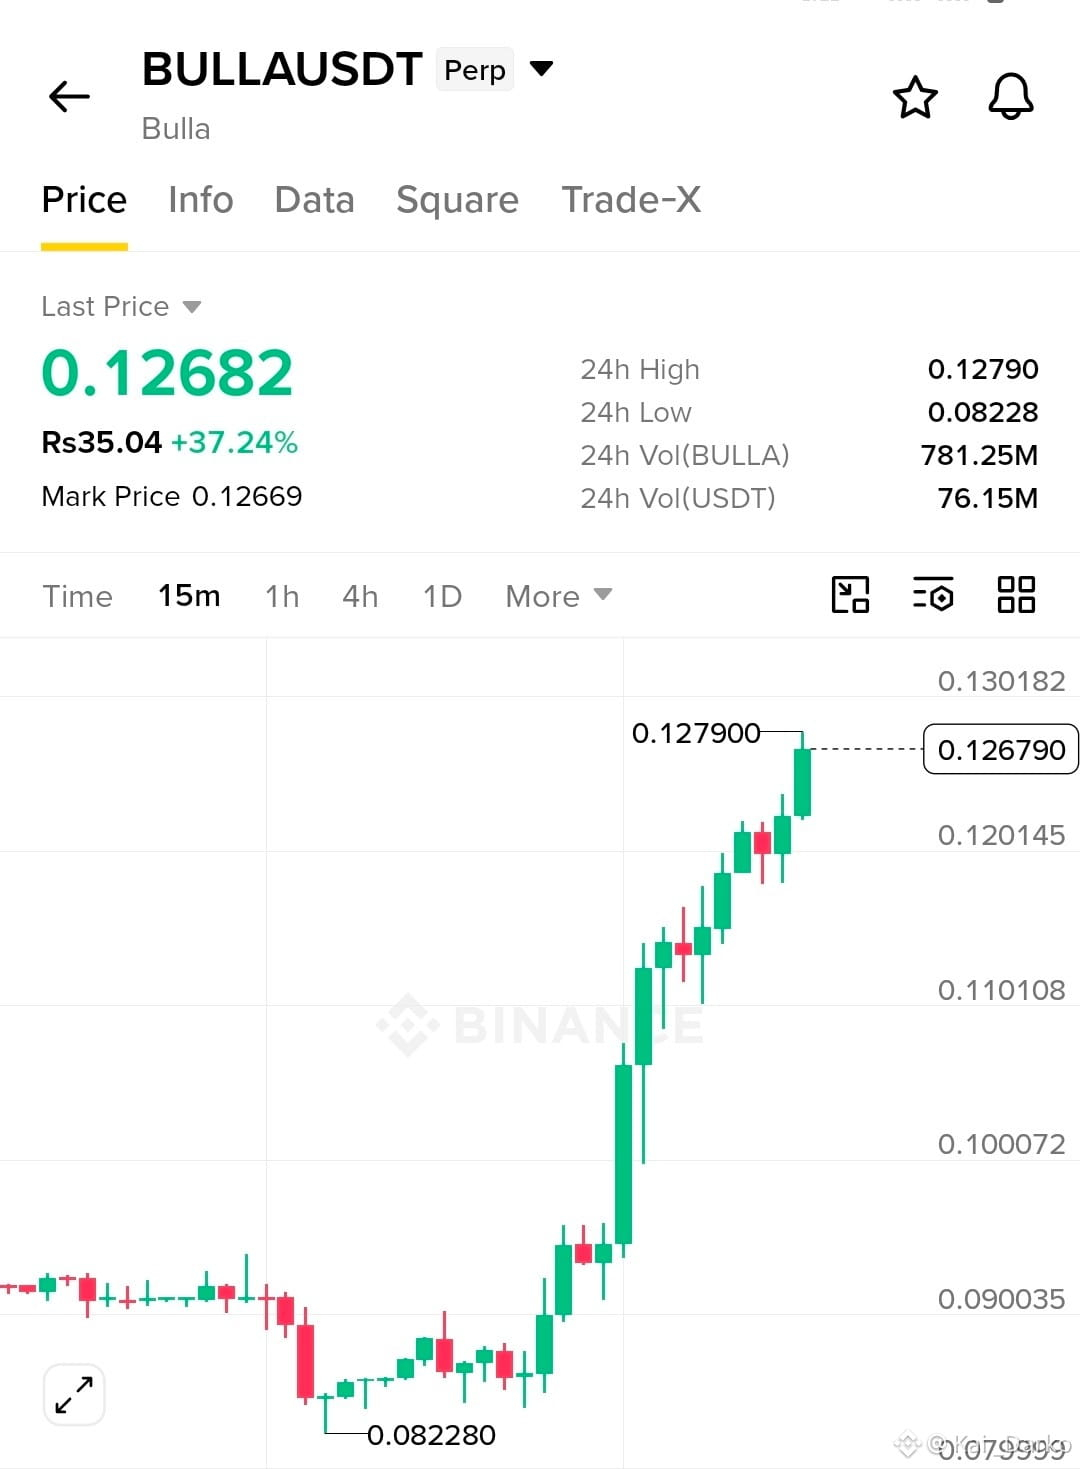
$BULLA LONG SETUP — Bulls Are Back, But Can They Hold This Move?
Entry: 0.1200 – 0.1230
TP1: 0.1280
TP2: 0.1350
Final Target: 0.1450
SL: 0.1160
BULLA has made a strong move after bouncing from the 0.08228 low. Buyers have stepped in aggressively, pushing the price toward 0.12790. Momentum is clearly bullish for now, but after such a sharp pump, some pullback would be normal.
As long as 0.1200 holds, a recovery toward 0.1350–0.1450 is possible.
The main thing to watch now is the 0.12790 resistance. A clean breakout above this level could give buyers more confidence and open the door for another leg up. If price gets rejected here, don't rush into a trade.
Use stop loss. Don't chase the bounce.
Trade on $BULLA
{future}(BULLAUSDT)
#BinancePick #EarningsSeason #FranklinTempletonFilesForTwoDividendToBitcoinETFs
$BULLA LONG SETUP — Bulls Are Back, But Can They Hold This Move?
Entry: 0.1200 – 0.1230
TP1: 0.1280
TP2: 0.1350
Final Target: 0.1450
SL: 0.1160
BULLA has made a strong move after bouncing from the 0.08228 low. Buyers have stepped in aggressively, pushing the price toward 0.12790. Momentum is clearly bullish for now, but after such a sharp pump, some pullback would be normal.
As long as 0.1200 holds, a recovery toward 0.1350–0.1450 is possible.
The main thing to watch now is the 0.12790 resistance. A clean breakout above this level could give buyers more confidence and open the door for another leg up. If price gets rejected here, don't rush into a trade.
Use stop loss. Don't chase the bounce.
Trade on $BULLA
#BinancePick #EarningsSeason #FranklinTempletonFilesForTwoDividendToBitcoinETFs
88
·
--
Bullish
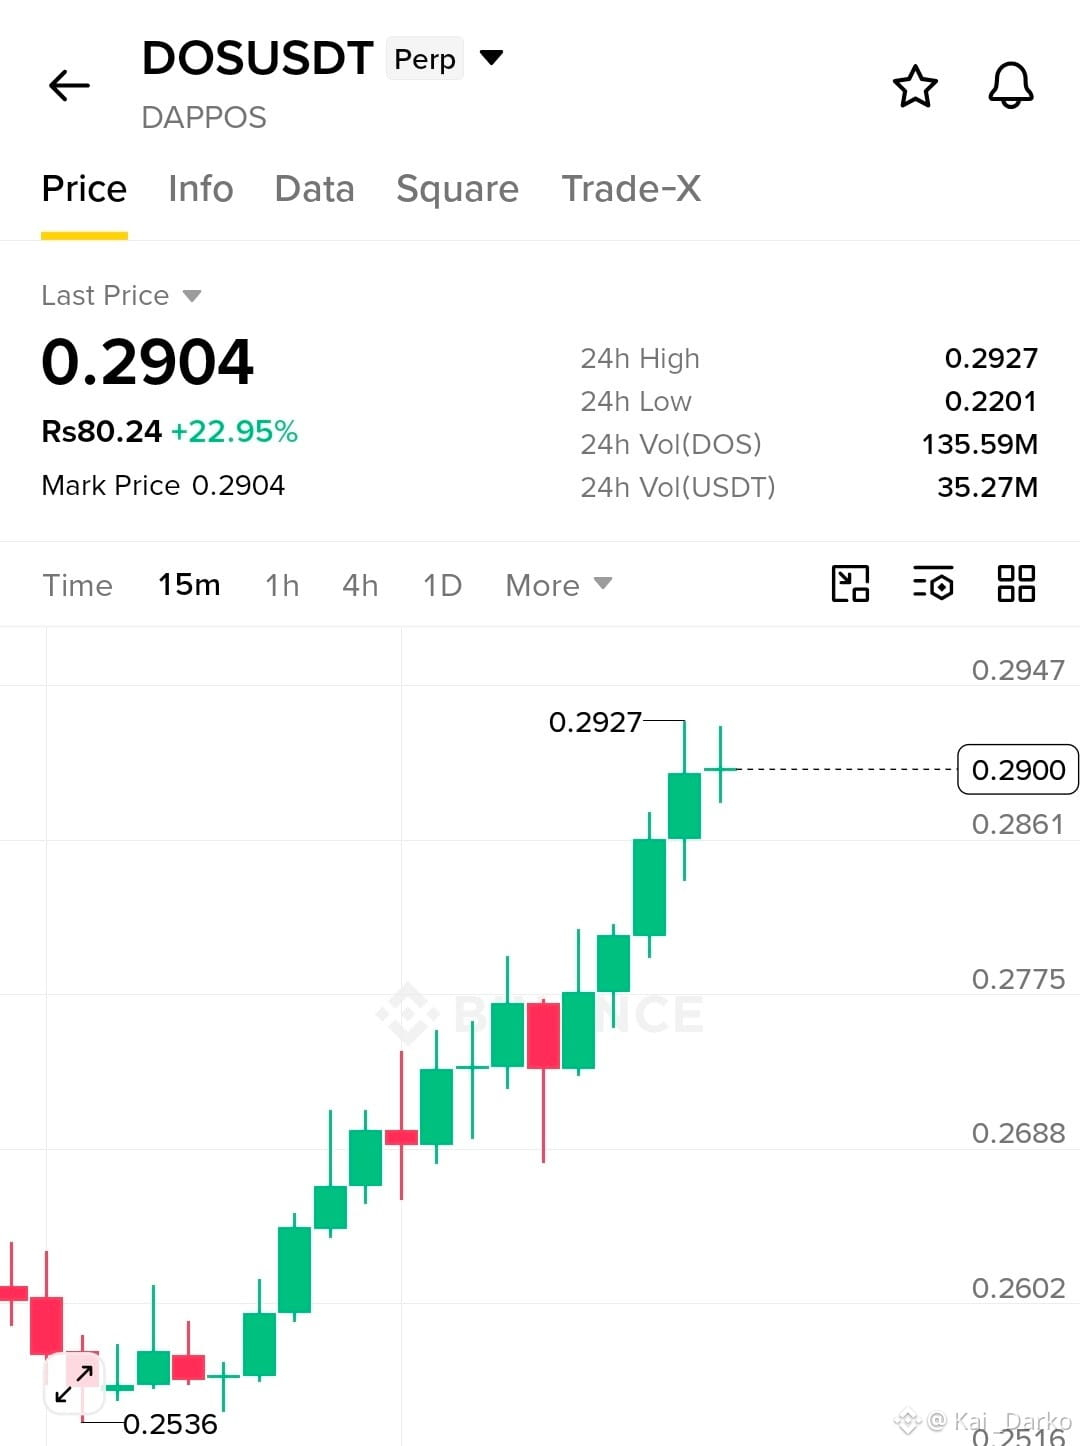
$DOS LONG SETUP ... Bulls Are Pushing for a Breakout!
Entry: $0.2840 – $0.2890
TP1: $0.2930
TP2: $0.3000
Final Target: $0.3100
SL: $0.2780
DOS is showing serious bullish momentum after a strong climb from the $0.2536 low. Buyers have stepped in aggressively, pushing price close to $0.2927. The bulls are in control for now, but price is approaching a key resistance zone where sellers could fight back.
As long as $0.2800 holds, another push toward $0.3000–$0.3100 remains possible. A clean breakout above $0.2927 could give buyers the confidence to push higher, while rejection here may trigger a short pullback.
The momentum is exciting, but don't let FOMO make the decision for you. Wait for confirmation and manage your risk.
Use stop loss. Don't chase the bounce.
Trade on $DOS #BinancePick #EarningsSeason
243
·
--
Bullish
🚨 TRUMP’S WARNING TO IRAN PUTS GLOBAL MARKETS ON ALERT! 🇺🇸🌍
President Donald Trump has raised serious questions about the future of U.S.–Iran relations with a stark statement about whether to pursue a deal or take extreme action.
⚠️ Diplomacy or Escalation? The world is watching closely as tensions could have major implications for global markets, oil prices, and crypto sentiment.
📉 Crypto traders, stay alert! Geopolitical headlines can trigger sudden volatility. Watch key support and resistance levels, manage risk carefully, and avoid emotional trades.
💬 Your Take: Is a diplomatic deal still possible, or could tensions escalate further? Share your thoughts below! 👇
#Trump #Iran #CryptoNews #Bitcoin #TRUMP
$TRUMP
{future}(TRUMPUSDT)
$T
{future}(TUSDT)
$ENA
{future}(ENAUSDT)
🚨 TRUMP’S WARNING TO IRAN PUTS GLOBAL MARKETS ON ALERT! 🇺🇸🌍
President Donald Trump has raised serious questions about the future of U.S.–Iran relations with a stark statement about whether to pursue a deal or take extreme action.
⚠️ Diplomacy or Escalation? The world is watching closely as tensions could have major implications for global markets, oil prices, and crypto sentiment.
📉 Crypto traders, stay alert! Geopolitical headlines can trigger sudden volatility. Watch key support and resistance levels, manage risk carefully, and avoid emotional trades.
💬 Your Take: Is a diplomatic deal still possible, or could tensions escalate further? Share your thoughts below! 👇
#Trump #Iran #CryptoNews #Bitcoin #TRUMP
$TRUMP
$T
$ENA


138
·
--
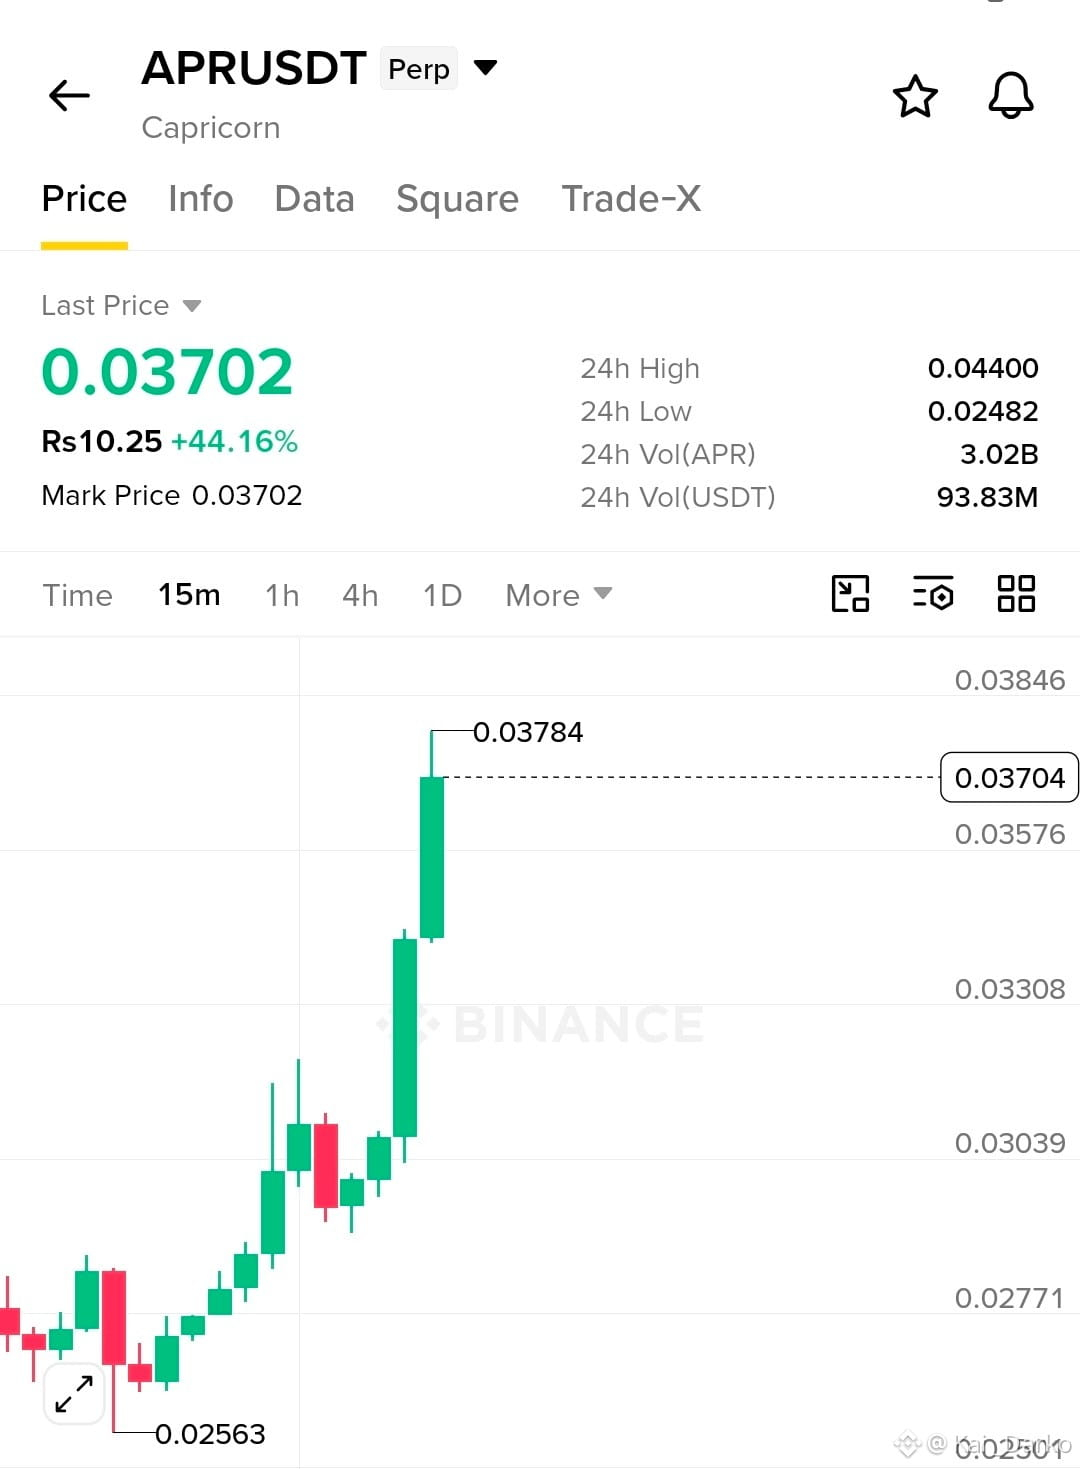
$APR LONG SETUP — Bulls Are Pushing Higher After a Strong Breakout
Entry: 0.03550 – 0.03650
TP1: 0.03850
TP2: 0.04000
Final Target: 0.04400
SL: 0.03300
APR has made a strong move up, jumping over 44% and breaking above the 0.0300 area. After bouncing from the 0.02563 low, buyers have stepped in with real momentum and are now trying to keep control.
As long as 0.03300 holds, a move towards 0.04000–0.04400 remains possible.
The price has already moved sharply, so some pullback or profit-taking would be normal. A clean break above 0.03800–0.03850 could give buyers more confidence and support another push higher.
Use stop loss. Don't chase the bounce.
Trade on $APR
{future}(APRUSDT)
$APR LONG SETUP — Bulls Are Pushing Higher After a Strong Breakout
Entry: 0.03550 – 0.03650
TP1: 0.03850
TP2: 0.04000
Final Target: 0.04400
SL: 0.03300
APR has made a strong move up, jumping over 44% and breaking above the 0.0300 area. After bouncing from the 0.02563 low, buyers have stepped in with real momentum and are now trying to keep control.
As long as 0.03300 holds, a move towards 0.04000–0.04400 remains possible.
The price has already moved sharply, so some pullback or profit-taking would be normal. A clean break above 0.03800–0.03850 could give buyers more confidence and support another push higher.
Use stop loss. Don't chase the bounce.
Trade on $APR
91
·
--
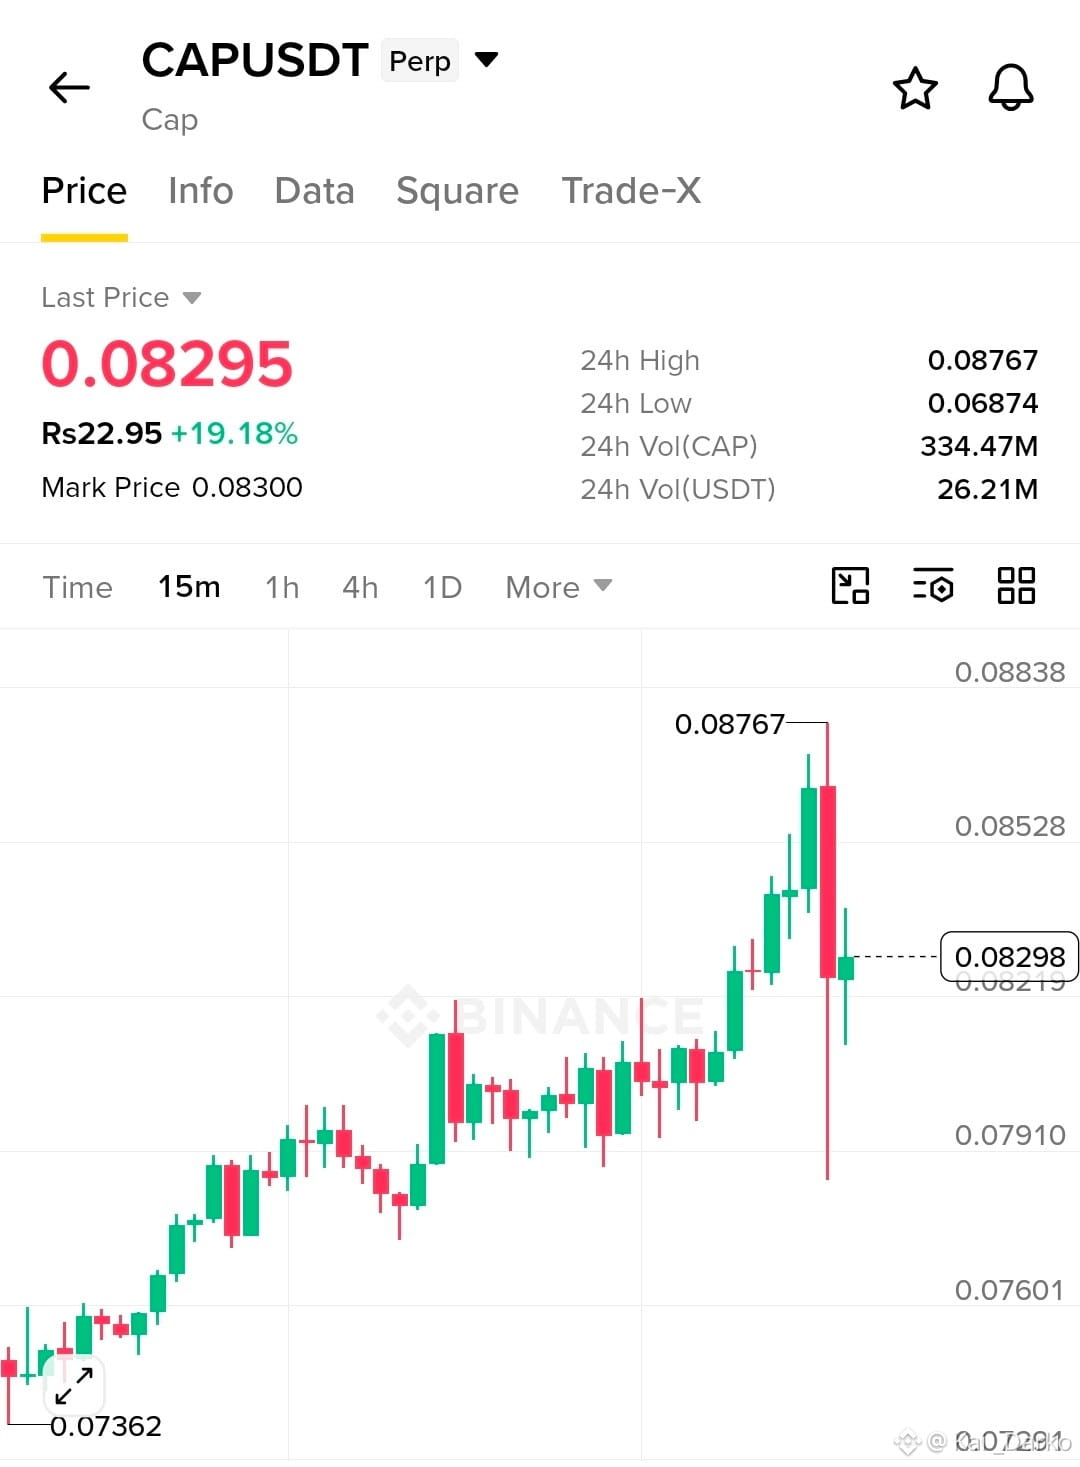
$CAP LONG SETUP ... Buyers Are Fighting Back After a Sharp Rejection
Entry: 0.08180 – 0.08250
TP1: 0.08400
TP2: 0.08530
Final Target: 0.08700 – 0.08760
SL: 0.08080
CAP has made a strong move up, gaining over 19% in the last 24 hours. Price pushed to 0.08767 before sellers stepped in and triggered a sharp pullback. The long lower wick shows that buyers reacted near the lows, but they still need to prove they can hold the recovery.
As long as 0.08180 support holds, CAP could attempt another move toward 0.08400–0.08530. Selling pressure is still present after the rejection near the daily high, so a clean break above 0.08400 would be an early sign that buyers are gaining strength again. A move above 0.08530 could open the door for a retest of 0.08700–0.08760.
Use a stop loss. Don't chase the bounce.
Trade on $CAP
{future}(CAPUSDT)
#BinancePick #EarningsSeason
$CAP LONG SETUP ... Buyers Are Fighting Back After a Sharp Rejection
Entry: 0.08180 – 0.08250
TP1: 0.08400
TP2: 0.08530
Final Target: 0.08700 – 0.08760
SL: 0.08080
CAP has made a strong move up, gaining over 19% in the last 24 hours. Price pushed to 0.08767 before sellers stepped in and triggered a sharp pullback. The long lower wick shows that buyers reacted near the lows, but they still need to prove they can hold the recovery.
As long as 0.08180 support holds, CAP could attempt another move toward 0.08400–0.08530. Selling pressure is still present after the rejection near the daily high, so a clean break above 0.08400 would be an early sign that buyers are gaining strength again. A move above 0.08530 could open the door for a retest of 0.08700–0.08760.
Use a stop loss. Don't chase the bounce.
Trade on $CAP
#BinancePick #EarningsSeason
241

·
--
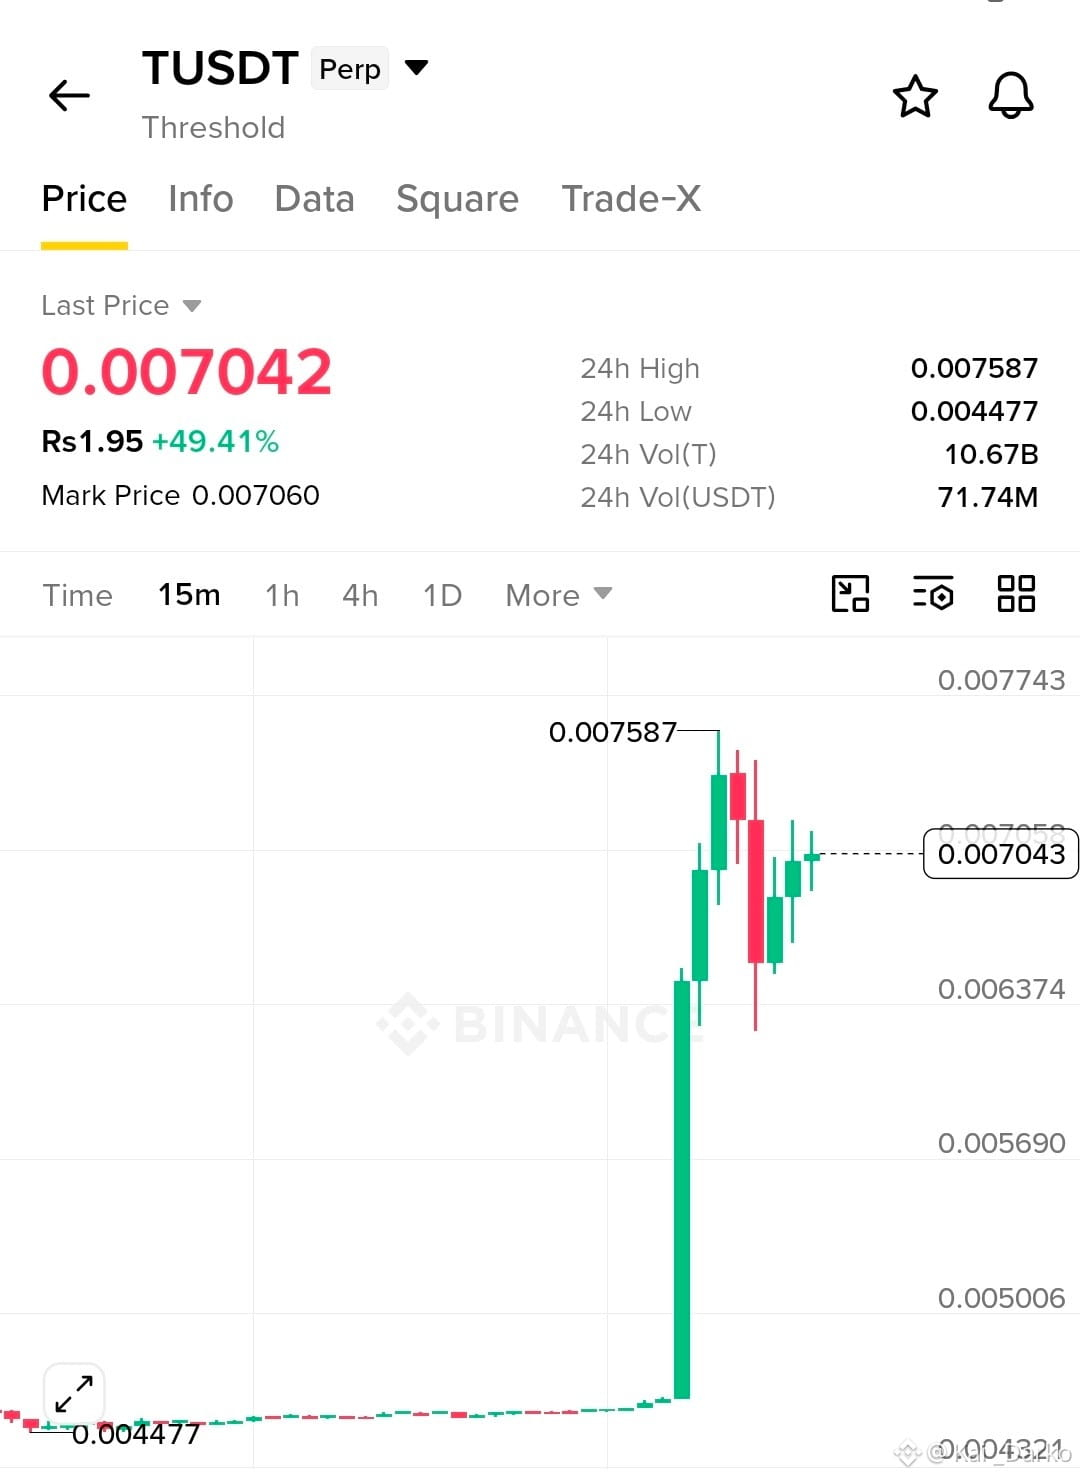
$TUSD LONG SETUP ... Bulls Are Fighting Back After a Massive Breakout!
Entry: 0.006850 – 0.007000
TP1: 0.007200
TP2: 0.007400
Final Target: 0.007587
SL: 0.006350
TUSDT has made a powerful move, jumping from the 0.004477 area to a high of 0.007587. After this explosive rally, price faced some selling pressure and pulled back before buyers stepped in again.
Now, bulls are trying to regain control around 0.0070. The bounce looks promising, but the market still needs to prove that it has enough strength for another push higher.
As long as 0.006700 holds, a recovery towards 0.007200–0.007587 is possible.
The key level to watch is 0.007200. A clean breakout above this zone could bring fresh buying pressure and open the door for another move toward the recent high. However, losing support could trigger another pullback, so don't get caught chasing the pump.
Use stop loss. Don't chase the bounce.
Trade on $TUSD
175
Log in to explore more content
Join global crypto users on Binance Square
⚡️ Get latest and useful information about crypto.
💬 Trusted by the world’s largest crypto exchange.
👍 Discover real insights from verified creators.
Email / Phone number