
Crypto Journey1
22.4k Posts

Crypto Journey1
 Square Verified+
Report
Block User
🚀 Passionate Crypto Enthusiast | Blockchain Advocate 🌐
📰 Delivering the Latest Crypto News & Insights 💡
🔍 Exploring the Depths of Decentralized Finance
Open Trade
Occasional Trader
4.5 Years
24 Following
68.6K+ Followers
90.9K+ Liked
Posts
Portfolio
All
Quotes
Videos
Live
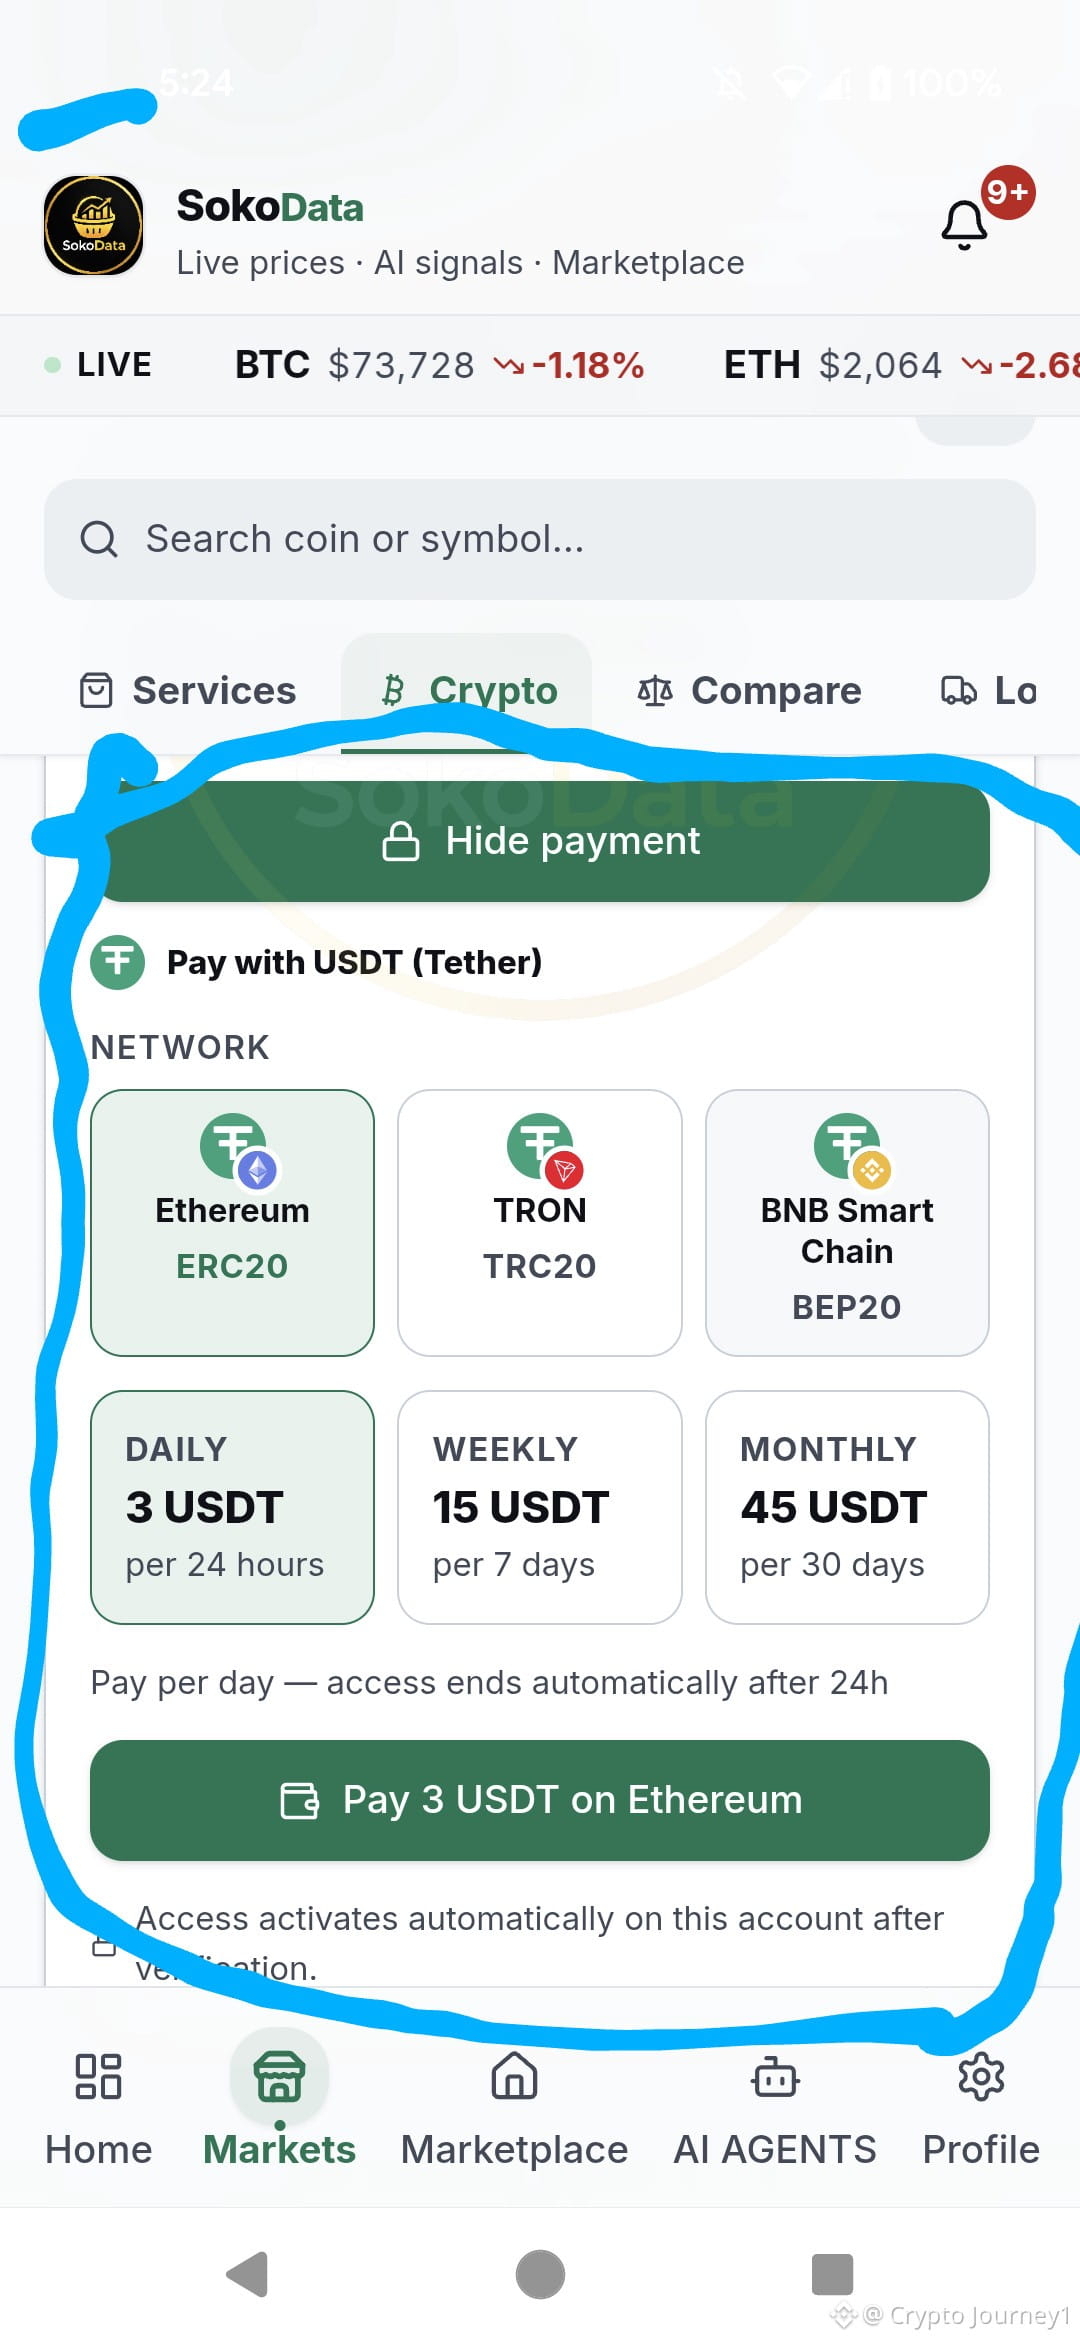
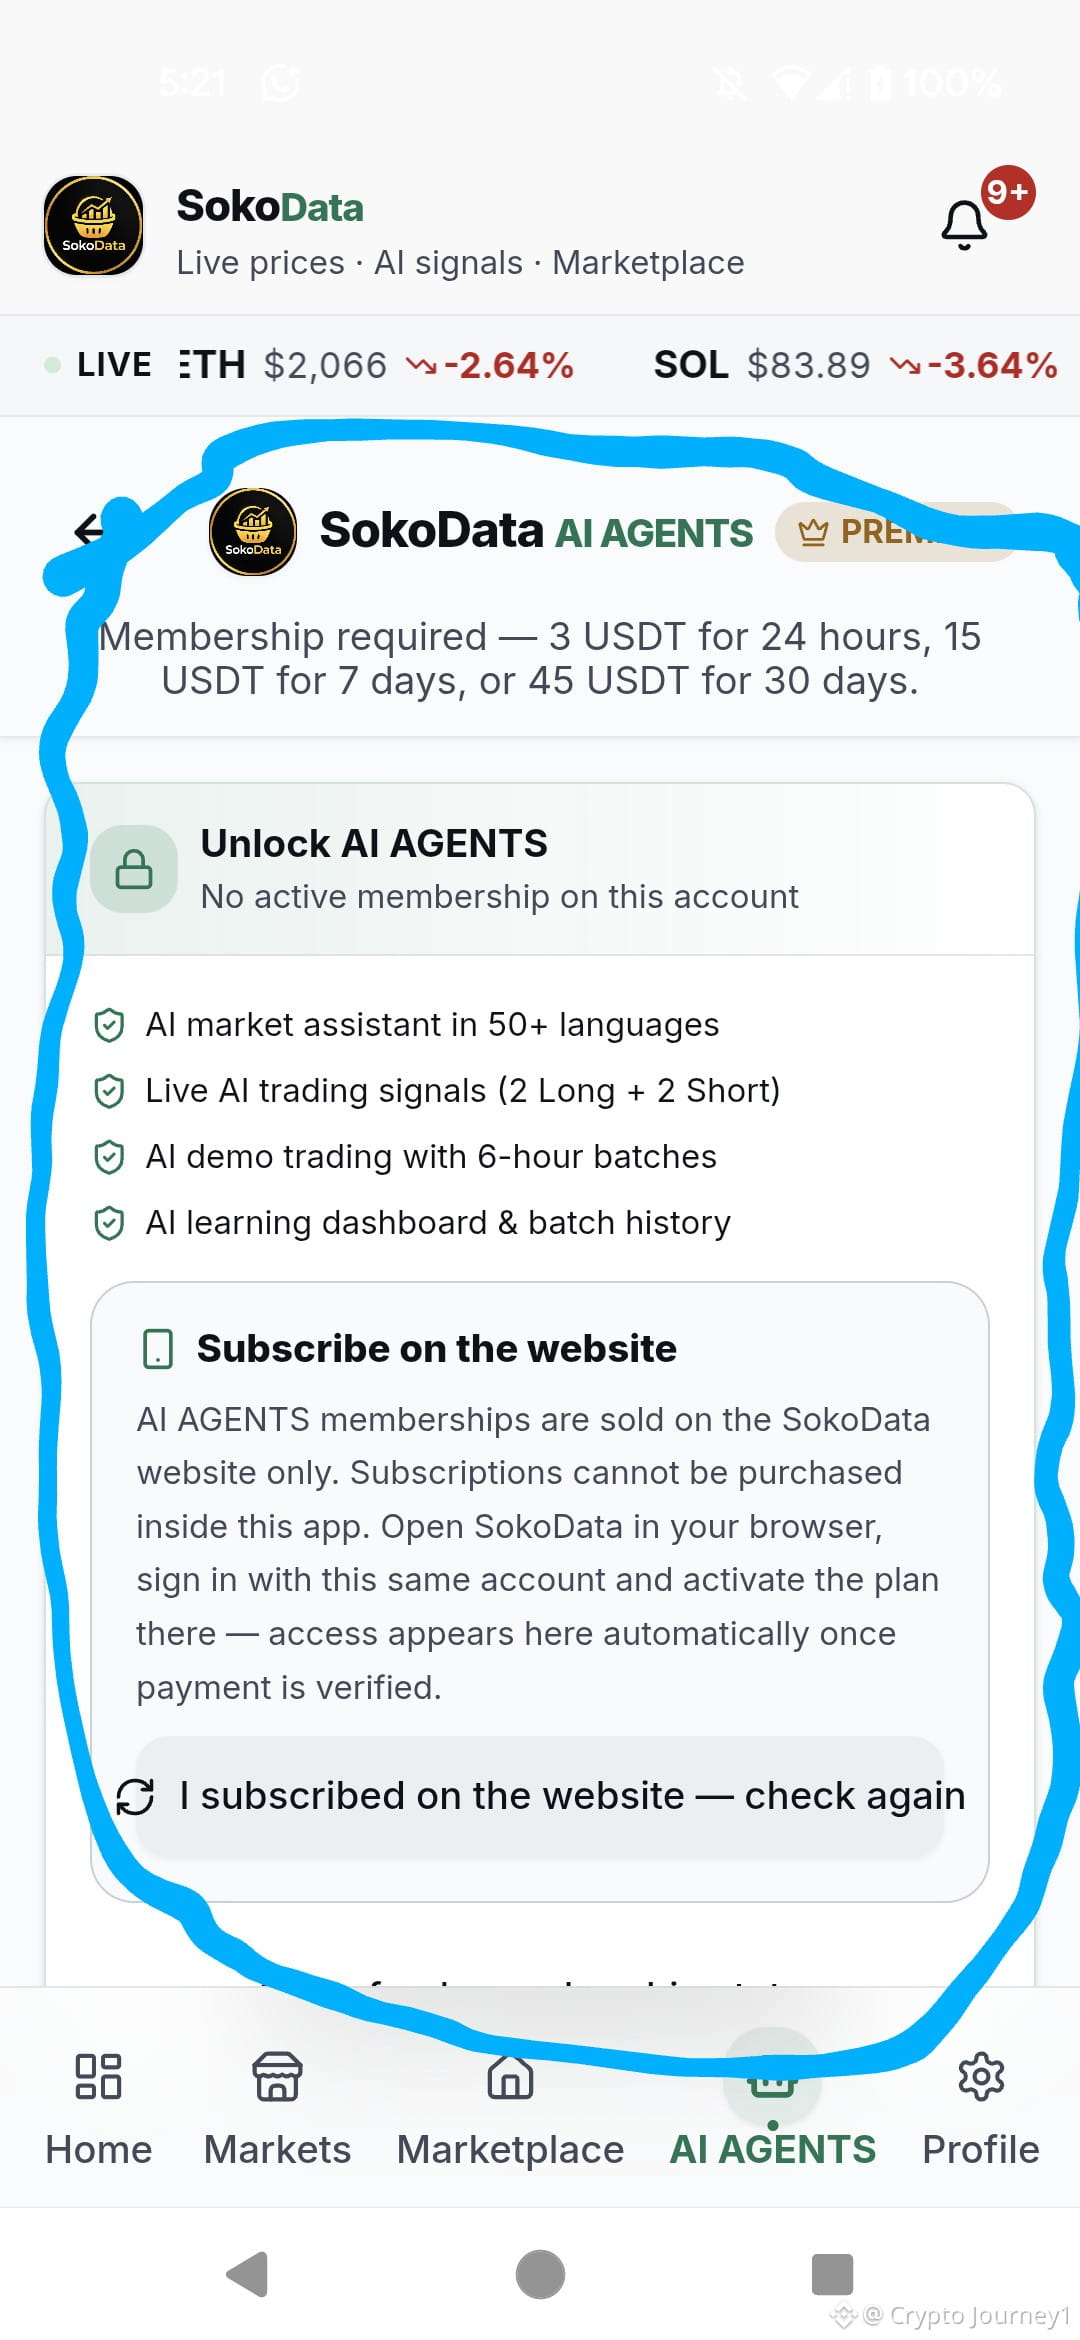
See these locked screens? That is what trading blind looks like.
Yesterday, I spent 3 USDT just to test the daily plan and see if the data was real. It was. So right now, I am upgrading to the 45 USDT full monthly plan.
$BNB
{future}(BNBUSDT)
The payment screen makes it easy. You can pay with USDT on Ethereum, TRON, or BNB. Once you subscribe on the site, the app unlocks automatically.
What you get inside:
· Live trading signals (2 Long + 2 Short)
· Demo batches every 6 hours
· The full market dashboard
Stop guessing and donating your money to the market. Pay the small fee, unlock the system, and trade with actual data.
#CryptoTrading #TradingTools #MarketUpdate
See these locked screens? That is what trading blind looks like.
Yesterday, I spent 3 USDT just to test the daily plan and see if the data was real. It was. So right now, I am upgrading to the 45 USDT full monthly plan.
$BNB
The payment screen makes it easy. You can pay with USDT on Ethereum, TRON, or BNB. Once you subscribe on the site, the app unlocks automatically.
What you get inside:
· Live trading signals (2 Long + 2 Short)
· Demo batches every 6 hours
· The full market dashboard
Stop guessing and donating your money to the market. Pay the small fee, unlock the system, and trade with actual data.
#CryptoTrading #TradingTools #MarketUpdate
Yesterday, I spent 3 USDT just to test the daily plan and see if the data was real. It was. So right now, I am upgrading to the 45 USDT full monthly plan.
$BNB
The payment screen makes it easy. You can pay with USDT on Ethereum, TRON, or BNB. Once you subscribe on the site, the app unlocks automatically.
What you get inside:
· Live trading signals (2 Long + 2 Short)
· Demo batches every 6 hours
· The full market dashboard
Stop guessing and donating your money to the market. Pay the small fee, unlock the system, and trade with actual data.
#CryptoTrading #TradingTools #MarketUpdate
293
LESSON OF THE DAY: HOW TO SPOT A POST-PUMP TRAP ON INITIA (INIT).
If you want to survive in crypto, you need to learn how to read the data, not just chase green candles. Let's use Initia ($INIT
{future}(INITUSDT)
) right now as a perfect textbook example of a dangerous setup. I want you to look at this and understand why patience is your best weapon.
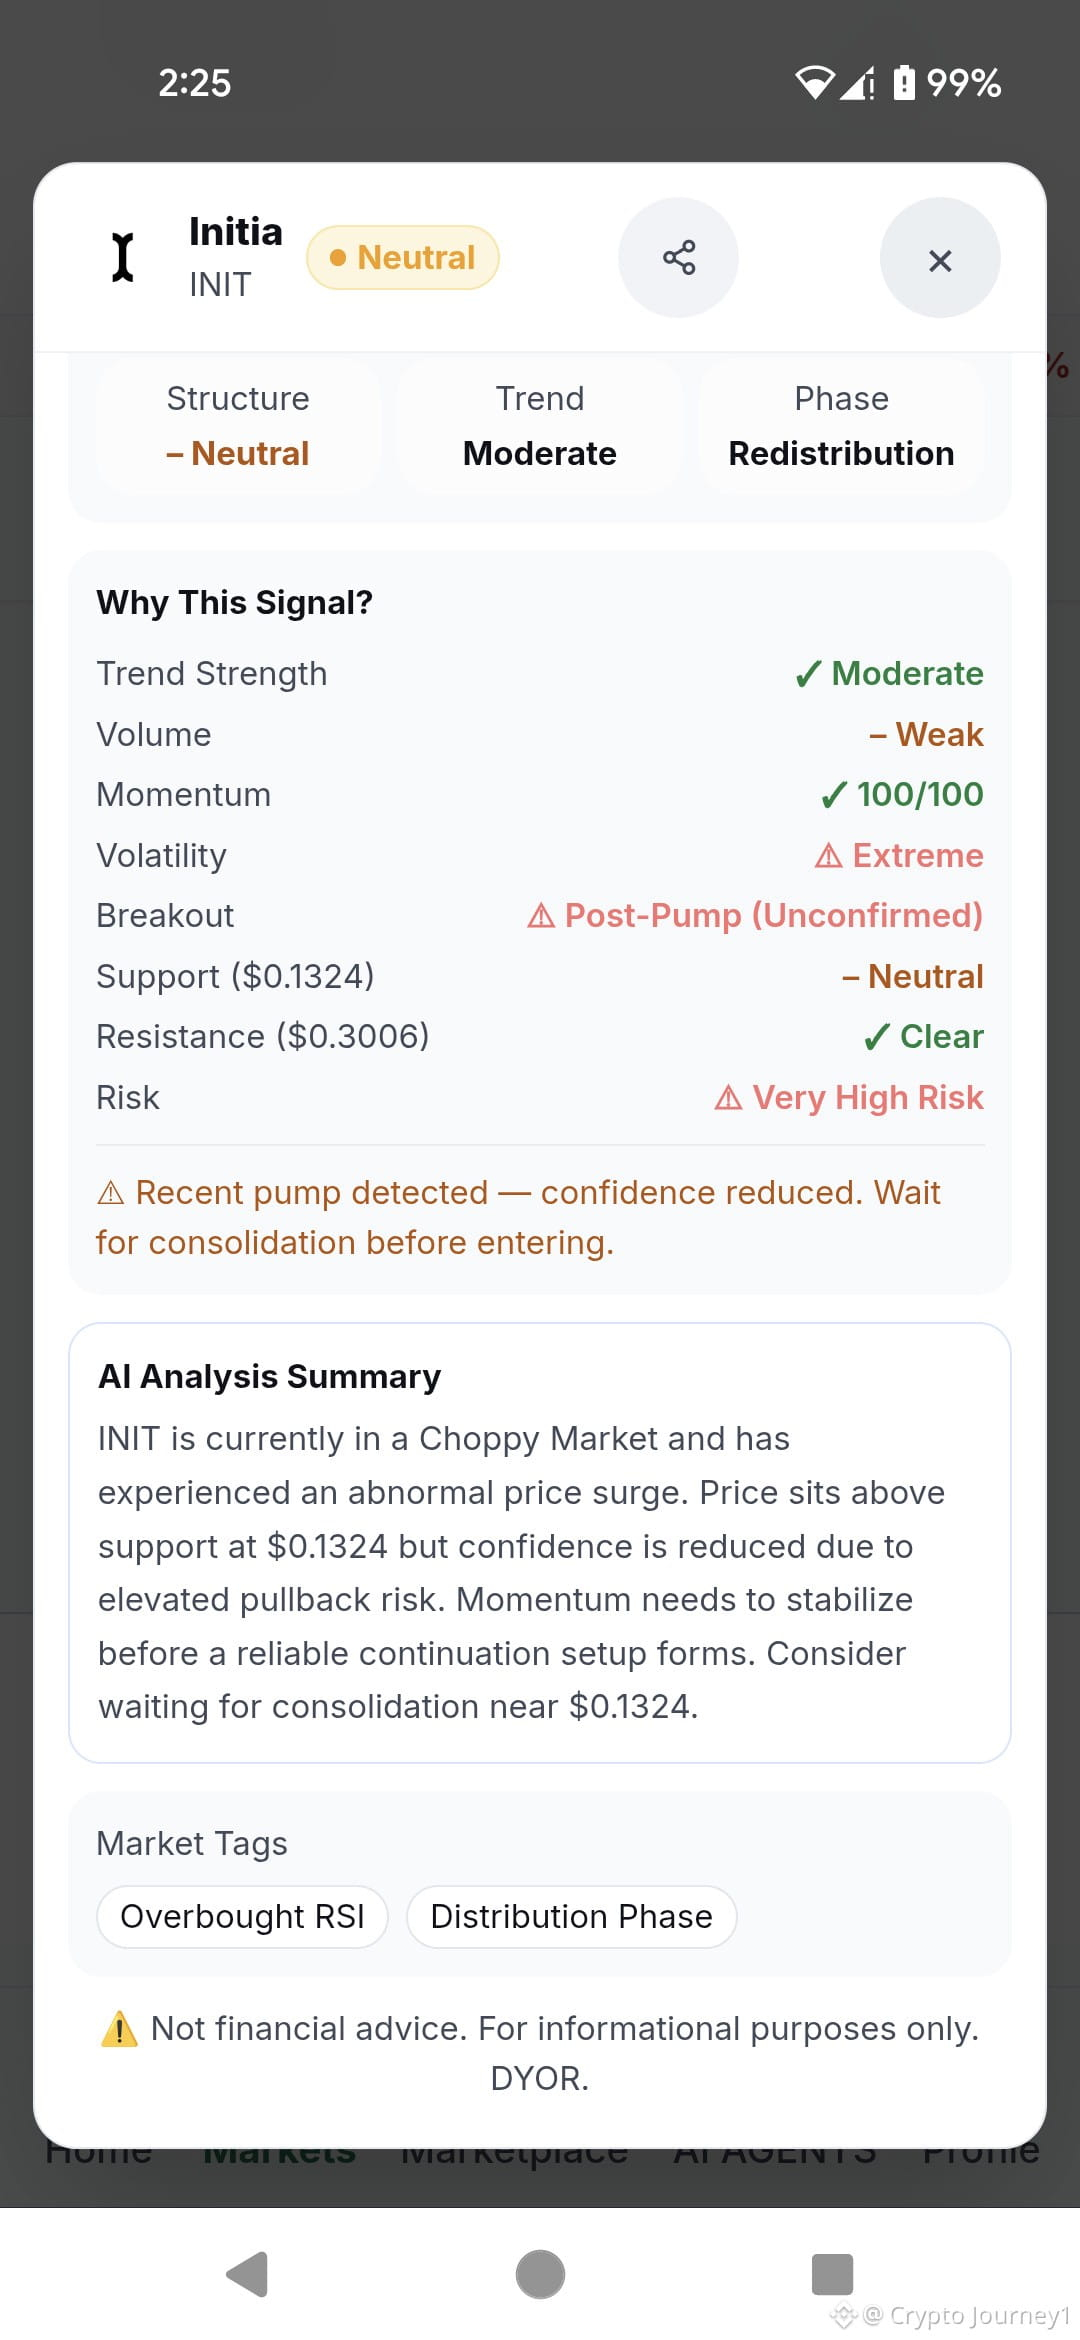
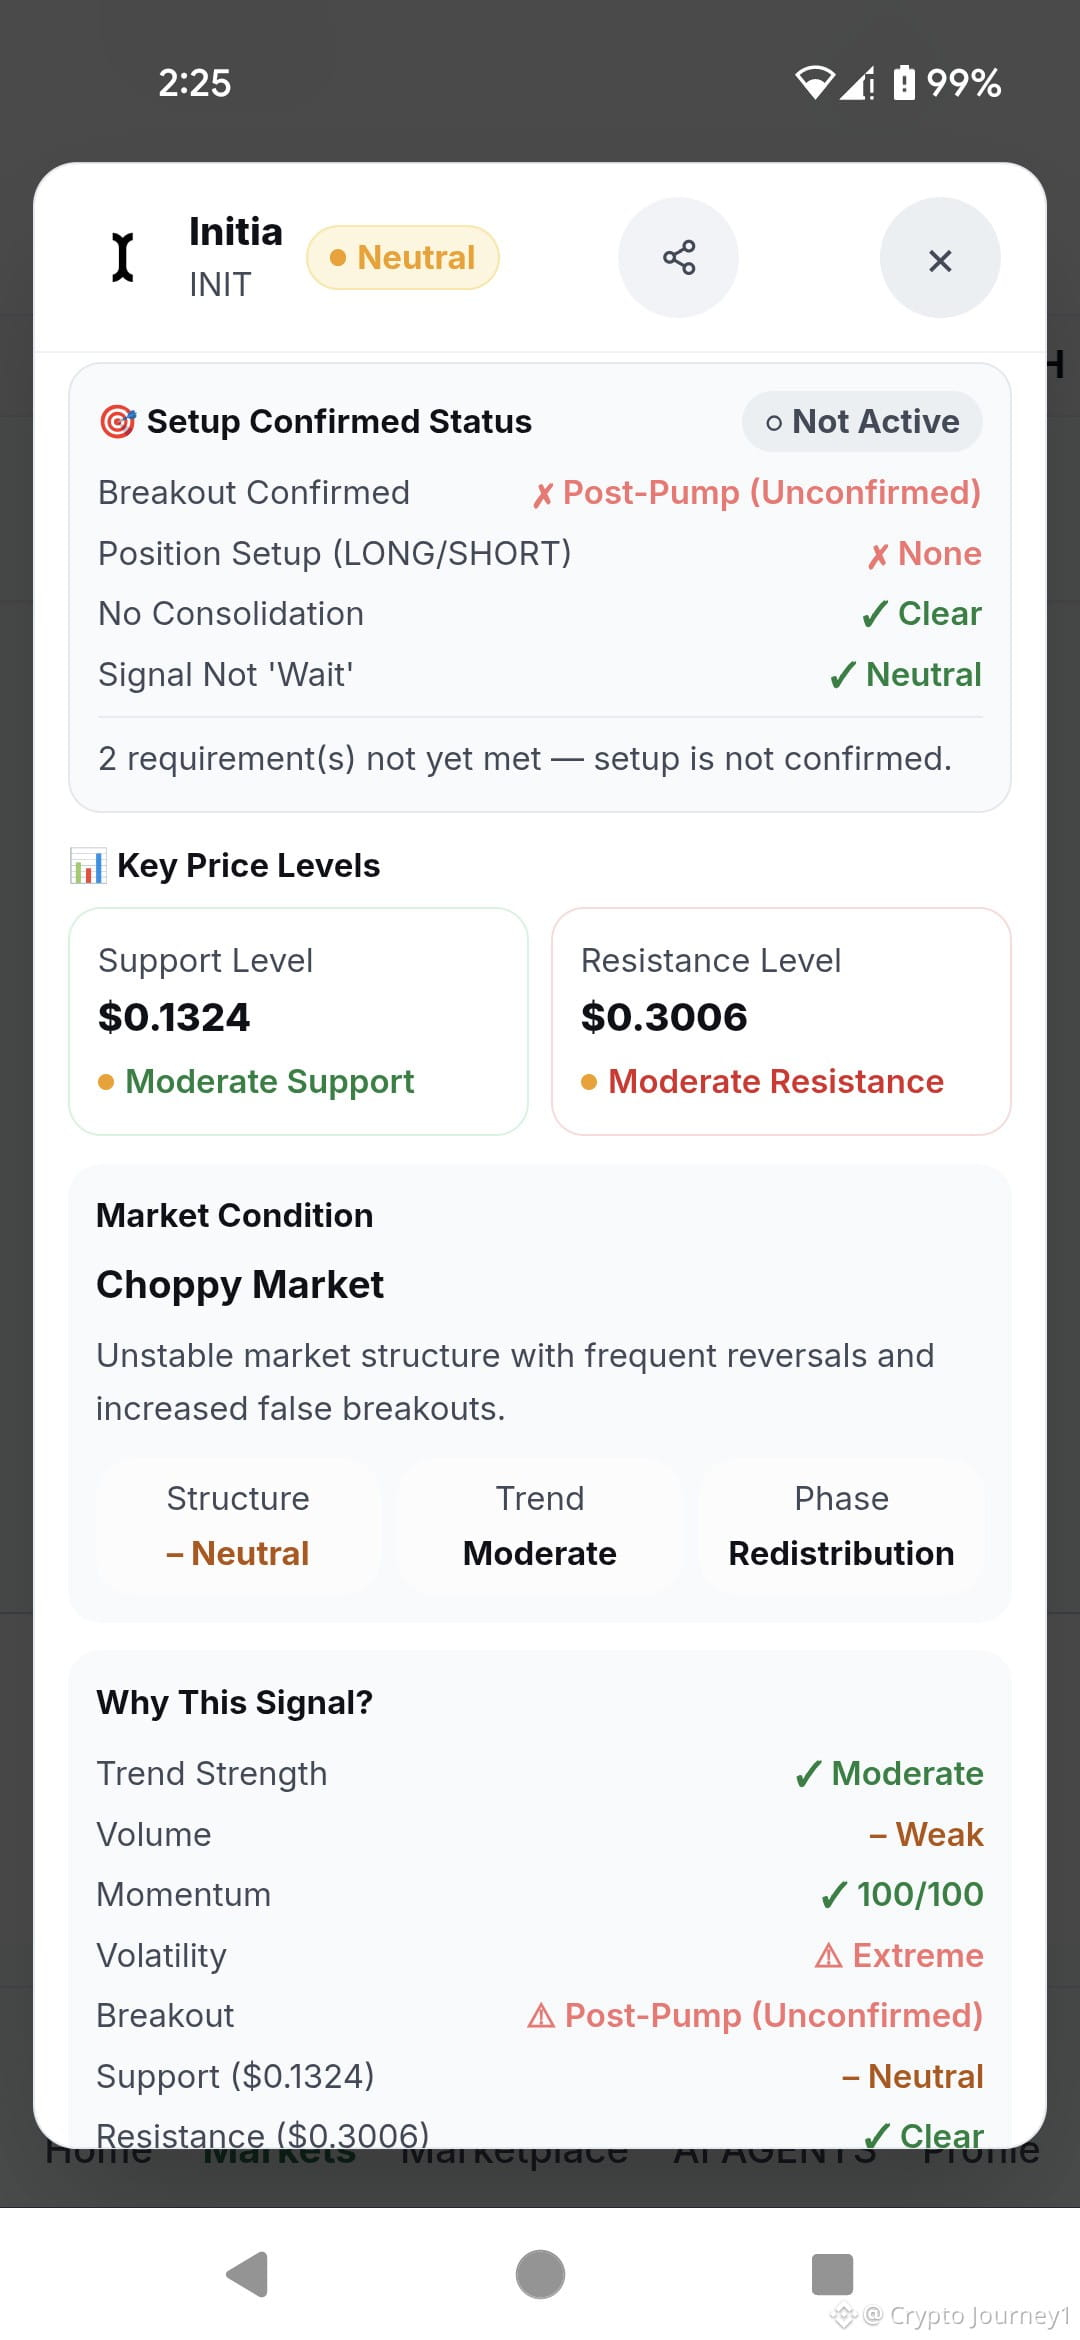
The system has flagged INIT as a Choppy Market with a Neutral structure and a Redistribution phase. This means the market is unstable, prone to fakeouts, and the smart money is preparing to exit.
Here are the exact numbers you need to pay attention to:
The Red Flags:
· Momentum: 100/100 (It is completely maxed out. You cannot get any higher).
· Volatility: Extreme.
· Risk Level: Very High Risk.
· Breakout: Post-Pump (Unconfirmed).
· Market Tags: Overbought RSI, Distribution Phase.
· Warning: Recent pump detected - confidence reduced.
The Setup Status:
The system is currently showing Not Active (Position Setup: None). Why? Because 2 requirements have not yet been met.
Key Levels to Watch:
· Moderate Support: $0.1324
· Moderate Resistance: $0.3006
My Educational Take and Trade Setup:
When you see momentum at 100/100 with an Extreme volatility score in a Distribution phase, you do not buy. You are buying the top of someone else's profit. The summary clearly advises: "Momentum needs to stabilize before a reliable continuation setup forms. Consider waiting for consolidation near $0.1324."
Since the system says "Wait," we wait. But here is how I am preparing to trade the inevitable pullback (SHORT Setup):
· Entry Zone: $0.2500 - $0.2800 (Only enter if we see a clear rejection and loss of momentum near resistance).
· Take Profit 1 (TP1): $0.1800
· Take Profit 2 (TP2): $0.1350 (Just above the major support level).
· Stop Loss (SL): $0.3150 (Safely above the $0.3006 resistance).
· Risk/Reward: Roughly 1:2.
The golden rule here is simple:
Are you learning to spot these post-pump traps, or do you still chase the green candles? Let me know below. 👇
LESSON OF THE DAY: HOW TO SPOT A POST-PUMP TRAP ON INITIA (INIT).
If you want to survive in crypto, you need to learn how to read the data, not just chase green candles. Let's use Initia ($INIT
) right now as a perfect textbook example of a dangerous setup. I want you to look at this and understand why patience is your best weapon.
The system has flagged INIT as a Choppy Market with a Neutral structure and a Redistribution phase. This means the market is unstable, prone to fakeouts, and the smart money is preparing to exit.
Here are the exact numbers you need to pay attention to:
The Red Flags:
· Momentum: 100/100 (It is completely maxed out. You cannot get any higher).
· Volatility: Extreme.
· Risk Level: Very High Risk.
· Breakout: Post-Pump (Unconfirmed).
· Market Tags: Overbought RSI, Distribution Phase.
· Warning: Recent pump detected - confidence reduced.
The Setup Status:
The system is currently showing Not Active (Position Setup: None). Why? Because 2 requirements have not yet been met.
Key Levels to Watch:
· Moderate Support: $0.1324
· Moderate Resistance: $0.3006
My Educational Take and Trade Setup:
When you see momentum at 100/100 with an Extreme volatility score in a Distribution phase, you do not buy. You are buying the top of someone else's profit. The summary clearly advises: "Momentum needs to stabilize before a reliable continuation setup forms. Consider waiting for consolidation near $0.1324."
Since the system says "Wait," we wait. But here is how I am preparing to trade the inevitable pullback (SHORT Setup):
· Entry Zone: $0.2500 - $0.2800 (Only enter if we see a clear rejection and loss of momentum near resistance).
· Take Profit 1 (TP1): $0.1800
· Take Profit 2 (TP2): $0.1350 (Just above the major support level).
· Stop Loss (SL): $0.3150 (Safely above the $0.3006 resistance).
· Risk/Reward: Roughly 1:2.
The golden rule here is simple:
Are you learning to spot these post-pump traps, or do you still chase the green candles? Let me know below. 👇
If you want to survive in crypto, you need to learn how to read the data, not just chase green candles. Let's use Initia ($INIT
) right now as a perfect textbook example of a dangerous setup. I want you to look at this and understand why patience is your best weapon.
The system has flagged INIT as a Choppy Market with a Neutral structure and a Redistribution phase. This means the market is unstable, prone to fakeouts, and the smart money is preparing to exit.
Here are the exact numbers you need to pay attention to:
The Red Flags:
· Momentum: 100/100 (It is completely maxed out. You cannot get any higher).
· Volatility: Extreme.
· Risk Level: Very High Risk.
· Breakout: Post-Pump (Unconfirmed).
· Market Tags: Overbought RSI, Distribution Phase.
· Warning: Recent pump detected - confidence reduced.
The Setup Status:
The system is currently showing Not Active (Position Setup: None). Why? Because 2 requirements have not yet been met.
Key Levels to Watch:
· Moderate Support: $0.1324
· Moderate Resistance: $0.3006
My Educational Take and Trade Setup:
When you see momentum at 100/100 with an Extreme volatility score in a Distribution phase, you do not buy. You are buying the top of someone else's profit. The summary clearly advises: "Momentum needs to stabilize before a reliable continuation setup forms. Consider waiting for consolidation near $0.1324."
Since the system says "Wait," we wait. But here is how I am preparing to trade the inevitable pullback (SHORT Setup):
· Entry Zone: $0.2500 - $0.2800 (Only enter if we see a clear rejection and loss of momentum near resistance).
· Take Profit 1 (TP1): $0.1800
· Take Profit 2 (TP2): $0.1350 (Just above the major support level).
· Stop Loss (SL): $0.3150 (Safely above the $0.3006 resistance).
· Risk/Reward: Roughly 1:2.
The golden rule here is simple:
Are you learning to spot these post-pump traps, or do you still chase the green candles? Let me know below. 👇
2
471
Article
BTW WARNING: HEAVY WHALE DUMPING DETECTED AMIDST A NEUTRAL STRUCTURE! 📉WARNING: HEAVY WHALE DUMPING DETECTED AMIDST A NEUTRAL STRUCTURE! 📉
$BTW
Do not let the "Neutral" market structure tag fool you into thinking this is a safe zone. Bitway (BTW) is currently sitting at $0.9977, down a heavy -10.47%, and the underlying data is screaming danger. The big players are aggressively exiting their positions.
Here is the exact breakdown of the current market conditions:
📊 Market Overview:
· Market Cap: $1.50B
· Volume Change: 0% of Mkt Cap
· Open Interest (OI) Change: -6.4%
· Funding Rate: -1.0000% (Long/Short ratio is a heavily skewed 0.49x)
· Volatility Score: 53/100
· Liquidity Score: 53/100
· Market Structure: Neutral
🐋 Whale Activity & Manipulation:
· Whale Status: Distribution
· Whale Buy Pressure: 13%
· Whale Sell Pressure: 84%
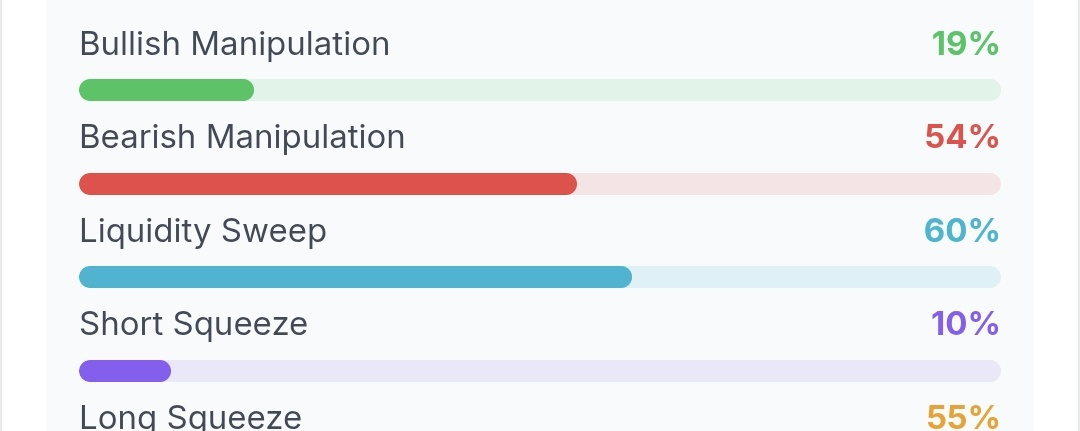
· Market Maker Model: Liquidity Sweep (60%), Long Squeeze (55%), Bearish Manipulation (54%), Bullish Manipulation (19%), Short Squeeze (10%).
⚠️ The Trap Detector:
The Stop-Loss Hunt Detector is flashing DETECTED at a 64% probability. It notes that buy-side liquidity is targeted, pointing to a liquidation cluster and breakout failure.
🎯 My Trade Setup (SHORT Position):
Even though the structure says neutral, 84% whale selling and a 55% long squeeze probability mean the path of least resistance is down. I am looking to short the minor bounces.
· Entry Zone: $1.00 - $1.02 (Wait for a slight relief bounce).
· Take Profit 1 (TP1): $0.90
· Take Profit 2 (TP2): $0.85
· Stop Loss (SL): $1.10 (Above the recent local resistance to protect capital).
· Risk/Reward: Roughly 1:2.
💡 The Reality Check:
The system summary confirms the bearish thesis: "BTW is trading at $0.9977 showing distribution signals. Large holders appear to be offloading positions. Exchange inflows are elevated. Long squeeze probability at 55%. Watch for further downside."
Trying to catch a falling knife with 84% whale selling is a recipe for disaster. Play the trend and protect your portfolio.
Are you shorting this BTW distribution phase, or waiting on the sidelines? Let me know below. 👇
BTW WARNING: HEAVY WHALE DUMPING DETECTED AMIDST A NEUTRAL STRUCTURE! 📉
WARNING: HEAVY WHALE DUMPING DETECTED AMIDST A NEUTRAL STRUCTURE! 📉
$BTW
Do not let the "Neutral" market structure tag fool you into thinking this is a safe zone. Bitway (BTW) is currently sitting at $0.9977, down a heavy -10.47%, and the underlying data is screaming danger. The big players are aggressively exiting their positions.
Here is the exact breakdown of the current market conditions:
📊 Market Overview:
· Market Cap: $1.50B
· Volume Change: 0% of Mkt Cap
· Open Interest (OI) Change: -6.4%
· Funding Rate: -1.0000% (Long/Short ratio is a heavily skewed 0.49x)
· Volatility Score: 53/100
· Liquidity Score: 53/100
· Market Structure: Neutral
🐋 Whale Activity & Manipulation:
· Whale Status: Distribution
· Whale Buy Pressure: 13%
· Whale Sell Pressure: 84%
· Market Maker Model: Liquidity Sweep (60%), Long Squeeze (55%), Bearish Manipulation (54%), Bullish Manipulation (19%), Short Squeeze (10%).
⚠️ The Trap Detector:
The Stop-Loss Hunt Detector is flashing DETECTED at a 64% probability. It notes that buy-side liquidity is targeted, pointing to a liquidation cluster and breakout failure.
🎯 My Trade Setup (SHORT Position):
Even though the structure says neutral, 84% whale selling and a 55% long squeeze probability mean the path of least resistance is down. I am looking to short the minor bounces.
· Entry Zone: $1.00 - $1.02 (Wait for a slight relief bounce).
· Take Profit 1 (TP1): $0.90
· Take Profit 2 (TP2): $0.85
· Stop Loss (SL): $1.10 (Above the recent local resistance to protect capital).
· Risk/Reward: Roughly 1:2.
💡 The Reality Check:
The system summary confirms the bearish thesis: "BTW is trading at $0.9977 showing distribution signals. Large holders appear to be offloading positions. Exchange inflows are elevated. Long squeeze probability at 55%. Watch for further downside."
Trying to catch a falling knife with 84% whale selling is a recipe for disaster. Play the trend and protect your portfolio.
Are you shorting this BTW distribution phase, or waiting on the sidelines? Let me know below. 👇
$BTW
Do not let the "Neutral" market structure tag fool you into thinking this is a safe zone. Bitway (BTW) is currently sitting at $0.9977, down a heavy -10.47%, and the underlying data is screaming danger. The big players are aggressively exiting their positions.
Here is the exact breakdown of the current market conditions:
📊 Market Overview:
· Market Cap: $1.50B
· Volume Change: 0% of Mkt Cap
· Open Interest (OI) Change: -6.4%
· Funding Rate: -1.0000% (Long/Short ratio is a heavily skewed 0.49x)
· Volatility Score: 53/100
· Liquidity Score: 53/100
· Market Structure: Neutral
🐋 Whale Activity & Manipulation:
· Whale Status: Distribution
· Whale Buy Pressure: 13%
· Whale Sell Pressure: 84%
· Market Maker Model: Liquidity Sweep (60%), Long Squeeze (55%), Bearish Manipulation (54%), Bullish Manipulation (19%), Short Squeeze (10%).
⚠️ The Trap Detector:
The Stop-Loss Hunt Detector is flashing DETECTED at a 64% probability. It notes that buy-side liquidity is targeted, pointing to a liquidation cluster and breakout failure.
🎯 My Trade Setup (SHORT Position):
Even though the structure says neutral, 84% whale selling and a 55% long squeeze probability mean the path of least resistance is down. I am looking to short the minor bounces.
· Entry Zone: $1.00 - $1.02 (Wait for a slight relief bounce).
· Take Profit 1 (TP1): $0.90
· Take Profit 2 (TP2): $0.85
· Stop Loss (SL): $1.10 (Above the recent local resistance to protect capital).
· Risk/Reward: Roughly 1:2.
💡 The Reality Check:
The system summary confirms the bearish thesis: "BTW is trading at $0.9977 showing distribution signals. Large holders appear to be offloading positions. Exchange inflows are elevated. Long squeeze probability at 55%. Watch for further downside."
Trying to catch a falling knife with 84% whale selling is a recipe for disaster. Play the trend and protect your portfolio.
Are you shorting this BTW distribution phase, or waiting on the sidelines? Let me know below. 👇
557
MASSIVE WHALE ALERT: 100% BUY PRESSURE DETECTED ON PIEVERSE!
$PIEVERSE
{future}(PIEVERSEUSDT)
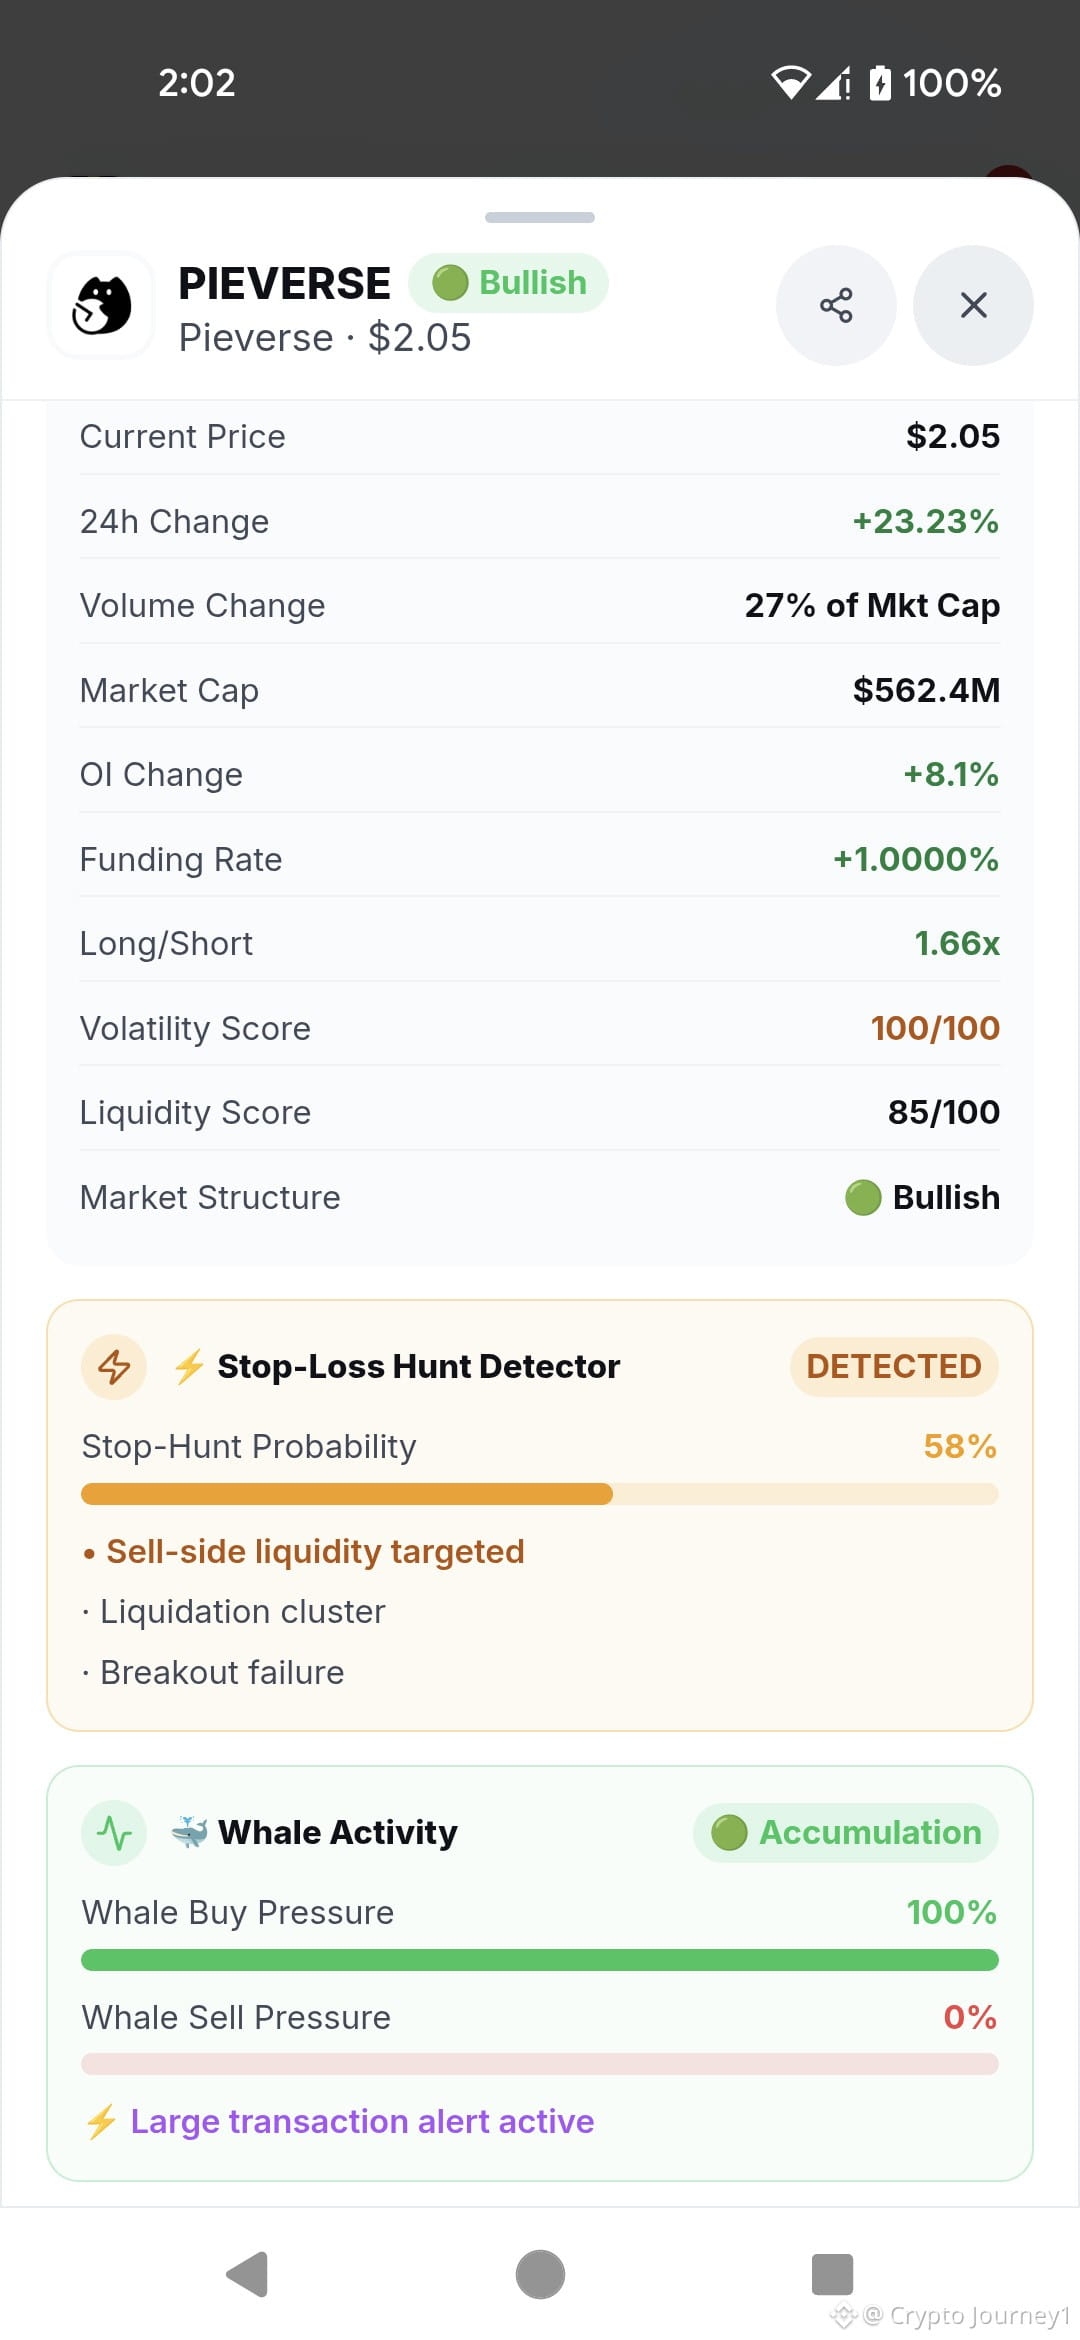
Do not sleep on this one. PIEVERSE is absolutely exploding right now, up a massive +23.23% to $2.05. The overall Market Structure is firmly Bullish, but the data beneath the surface is what really caught my eye.
Let's break down the exact numbers because this setup is wild:
Market Overview:
· Market Cap: $562.4M
· Volume Change: 27% of Mkt Cap
· Open Interest (OI) Change: +8.1%
· Funding Rate: +1.0000% (Long/Short ratio is 1.66x)
· Volatility Score: A massive 100/100
· Liquidity Score: 85/100
The Whale Activity:
· Phase: Accumulation
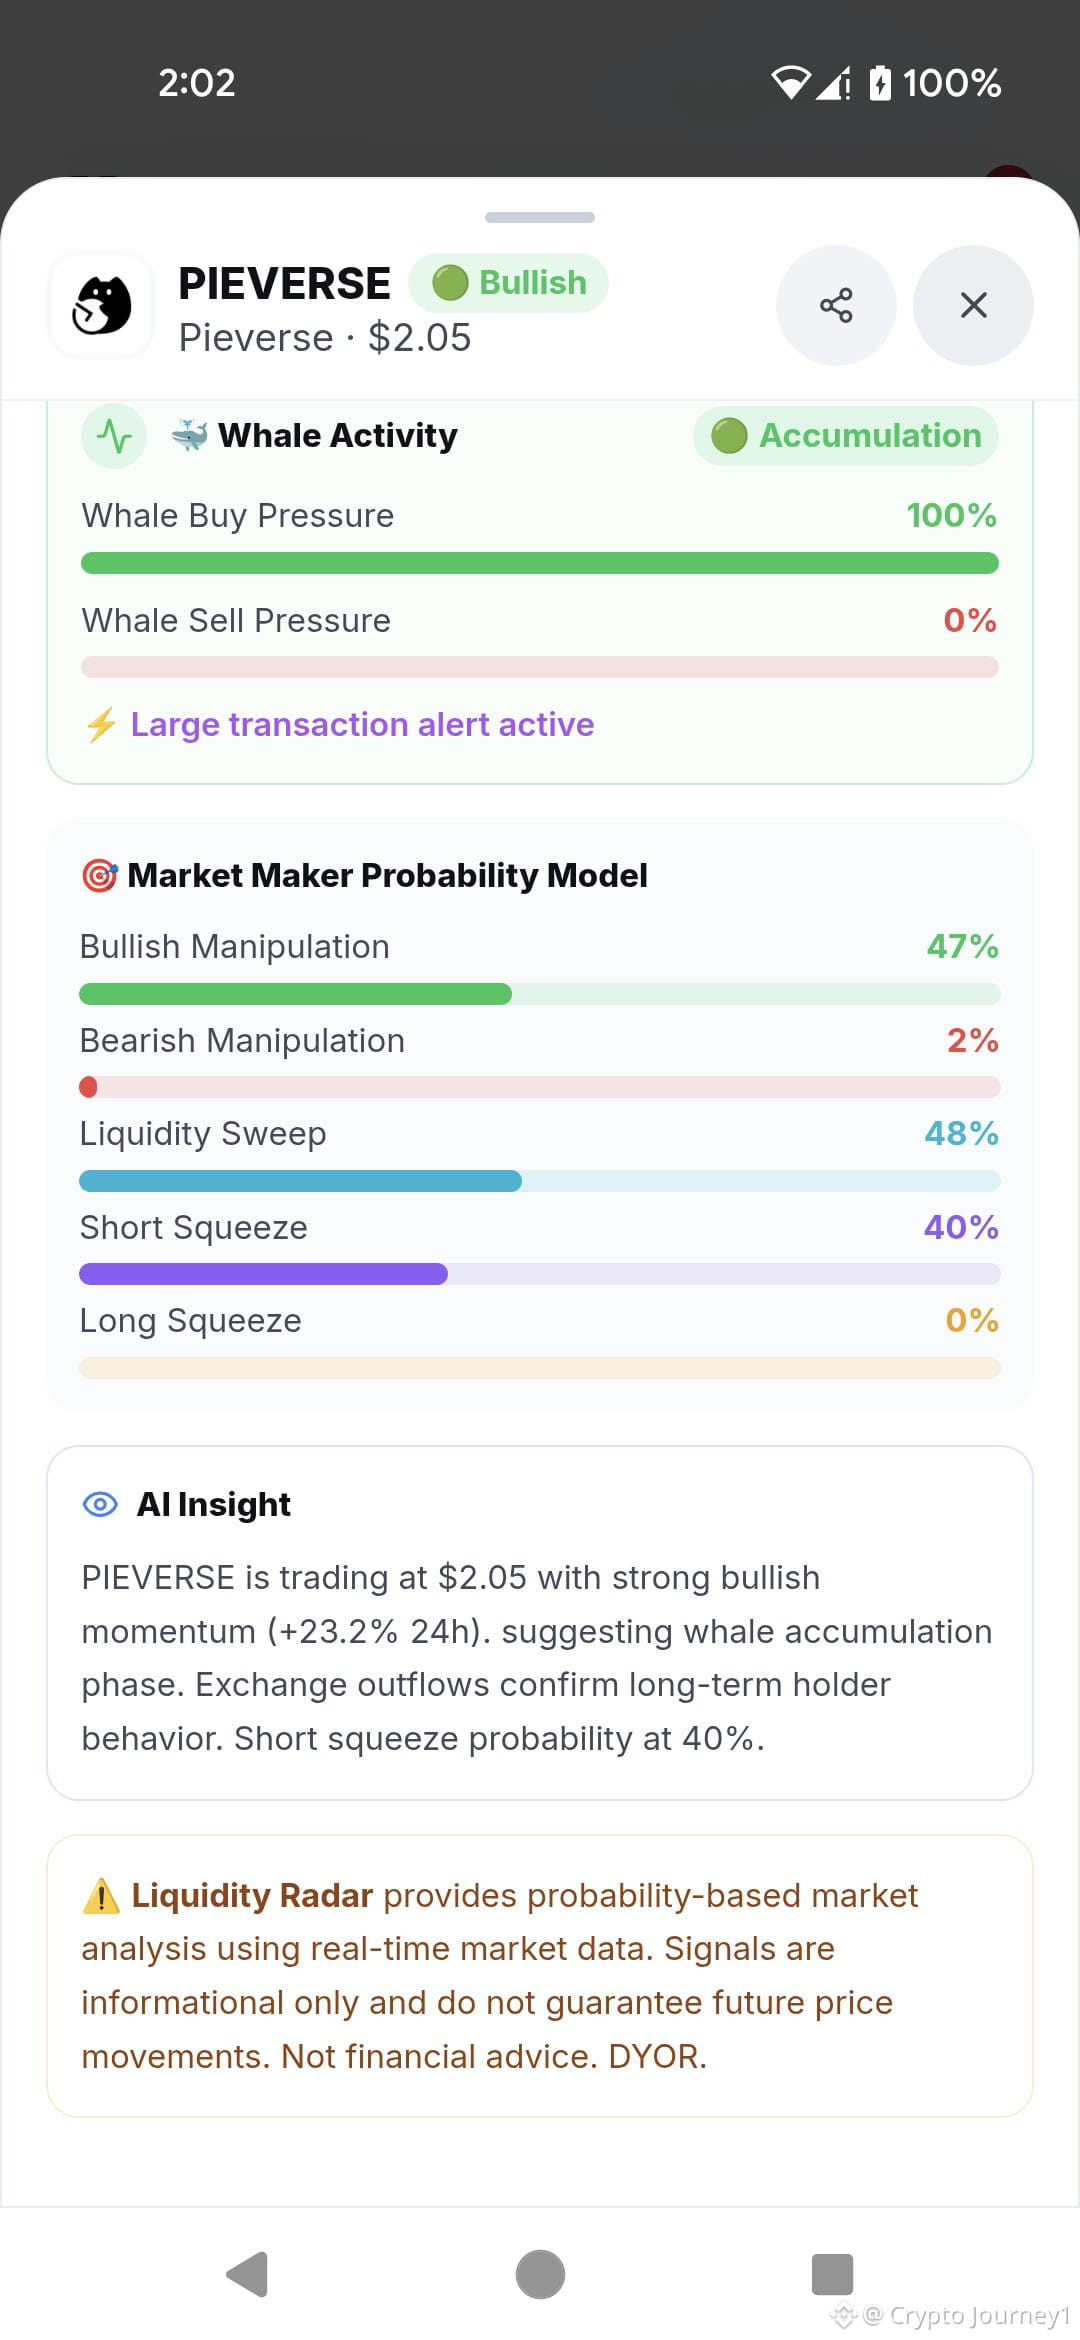
· Whale Buy Pressure: 100%
· Whale Sell Pressure: 0%
· Alert: Large transaction alert is active. Exchange outflows confirm long-term holder behavior.
Probability Model & Hidden Dangers:
· Liquidity Sweep: 48%
· Bullish Manipulation: 47%
· Short Squeeze: 40%
· Bearish Manipulation: 2%
· Long Squeeze: 0%
Stop-Loss Hunt Detector:
The system has DETECTED a 58% probability stop-hunt. It warns that sell-side liquidity is being targeted, pointing to a liquidation cluster and a breakout failure.
My Trade Setup (LONG Position):
With absolutely zero whale selling and massive momentum, the play is to catch the dips. Just be careful of that stop-hunt warning.
· Entry Zone: $1.95 - $2.05 (Current levels or slight pullback)
· Take Profit 1 (TP1): $2.50
· Take Profit 2 (TP2): $2.85
· Stop Loss (SL): $1.75 (Below the recent local support to survive the volatility)
The Reality Check:
The dashboard summary states: "Strong bullish momentum suggesting whale accumulation phase. Exchange outflows confirm long-term holder behavior. Short squeeze probability at 40%."
Are you riding this PIEVERSE pump, or waiting for the stop-hunt to clear? Let me know below.
MASSIVE WHALE ALERT: 100% BUY PRESSURE DETECTED ON PIEVERSE!
$PIEVERSE
Do not sleep on this one. PIEVERSE is absolutely exploding right now, up a massive +23.23% to $2.05. The overall Market Structure is firmly Bullish, but the data beneath the surface is what really caught my eye.
Let's break down the exact numbers because this setup is wild:
Market Overview:
· Market Cap: $562.4M
· Volume Change: 27% of Mkt Cap
· Open Interest (OI) Change: +8.1%
· Funding Rate: +1.0000% (Long/Short ratio is 1.66x)
· Volatility Score: A massive 100/100
· Liquidity Score: 85/100
The Whale Activity:
· Phase: Accumulation
· Whale Buy Pressure: 100%
· Whale Sell Pressure: 0%
· Alert: Large transaction alert is active. Exchange outflows confirm long-term holder behavior.
Probability Model & Hidden Dangers:
· Liquidity Sweep: 48%
· Bullish Manipulation: 47%
· Short Squeeze: 40%
· Bearish Manipulation: 2%
· Long Squeeze: 0%
Stop-Loss Hunt Detector:
The system has DETECTED a 58% probability stop-hunt. It warns that sell-side liquidity is being targeted, pointing to a liquidation cluster and a breakout failure.
My Trade Setup (LONG Position):
With absolutely zero whale selling and massive momentum, the play is to catch the dips. Just be careful of that stop-hunt warning.
· Entry Zone: $1.95 - $2.05 (Current levels or slight pullback)
· Take Profit 1 (TP1): $2.50
· Take Profit 2 (TP2): $2.85
· Stop Loss (SL): $1.75 (Below the recent local support to survive the volatility)
The Reality Check:
The dashboard summary states: "Strong bullish momentum suggesting whale accumulation phase. Exchange outflows confirm long-term holder behavior. Short squeeze probability at 40%."
Are you riding this PIEVERSE pump, or waiting for the stop-hunt to clear? Let me know below.
$PIEVERSE
Do not sleep on this one. PIEVERSE is absolutely exploding right now, up a massive +23.23% to $2.05. The overall Market Structure is firmly Bullish, but the data beneath the surface is what really caught my eye.
Let's break down the exact numbers because this setup is wild:
Market Overview:
· Market Cap: $562.4M
· Volume Change: 27% of Mkt Cap
· Open Interest (OI) Change: +8.1%
· Funding Rate: +1.0000% (Long/Short ratio is 1.66x)
· Volatility Score: A massive 100/100
· Liquidity Score: 85/100
The Whale Activity:
· Phase: Accumulation
· Whale Buy Pressure: 100%
· Whale Sell Pressure: 0%
· Alert: Large transaction alert is active. Exchange outflows confirm long-term holder behavior.
Probability Model & Hidden Dangers:
· Liquidity Sweep: 48%
· Bullish Manipulation: 47%
· Short Squeeze: 40%
· Bearish Manipulation: 2%
· Long Squeeze: 0%
Stop-Loss Hunt Detector:
The system has DETECTED a 58% probability stop-hunt. It warns that sell-side liquidity is being targeted, pointing to a liquidation cluster and a breakout failure.
My Trade Setup (LONG Position):
With absolutely zero whale selling and massive momentum, the play is to catch the dips. Just be careful of that stop-hunt warning.
· Entry Zone: $1.95 - $2.05 (Current levels or slight pullback)
· Take Profit 1 (TP1): $2.50
· Take Profit 2 (TP2): $2.85
· Stop Loss (SL): $1.75 (Below the recent local support to survive the volatility)
The Reality Check:
The dashboard summary states: "Strong bullish momentum suggesting whale accumulation phase. Exchange outflows confirm long-term holder behavior. Short squeeze probability at 40%."
Are you riding this PIEVERSE pump, or waiting for the stop-hunt to clear? Let me know below.
1.5k
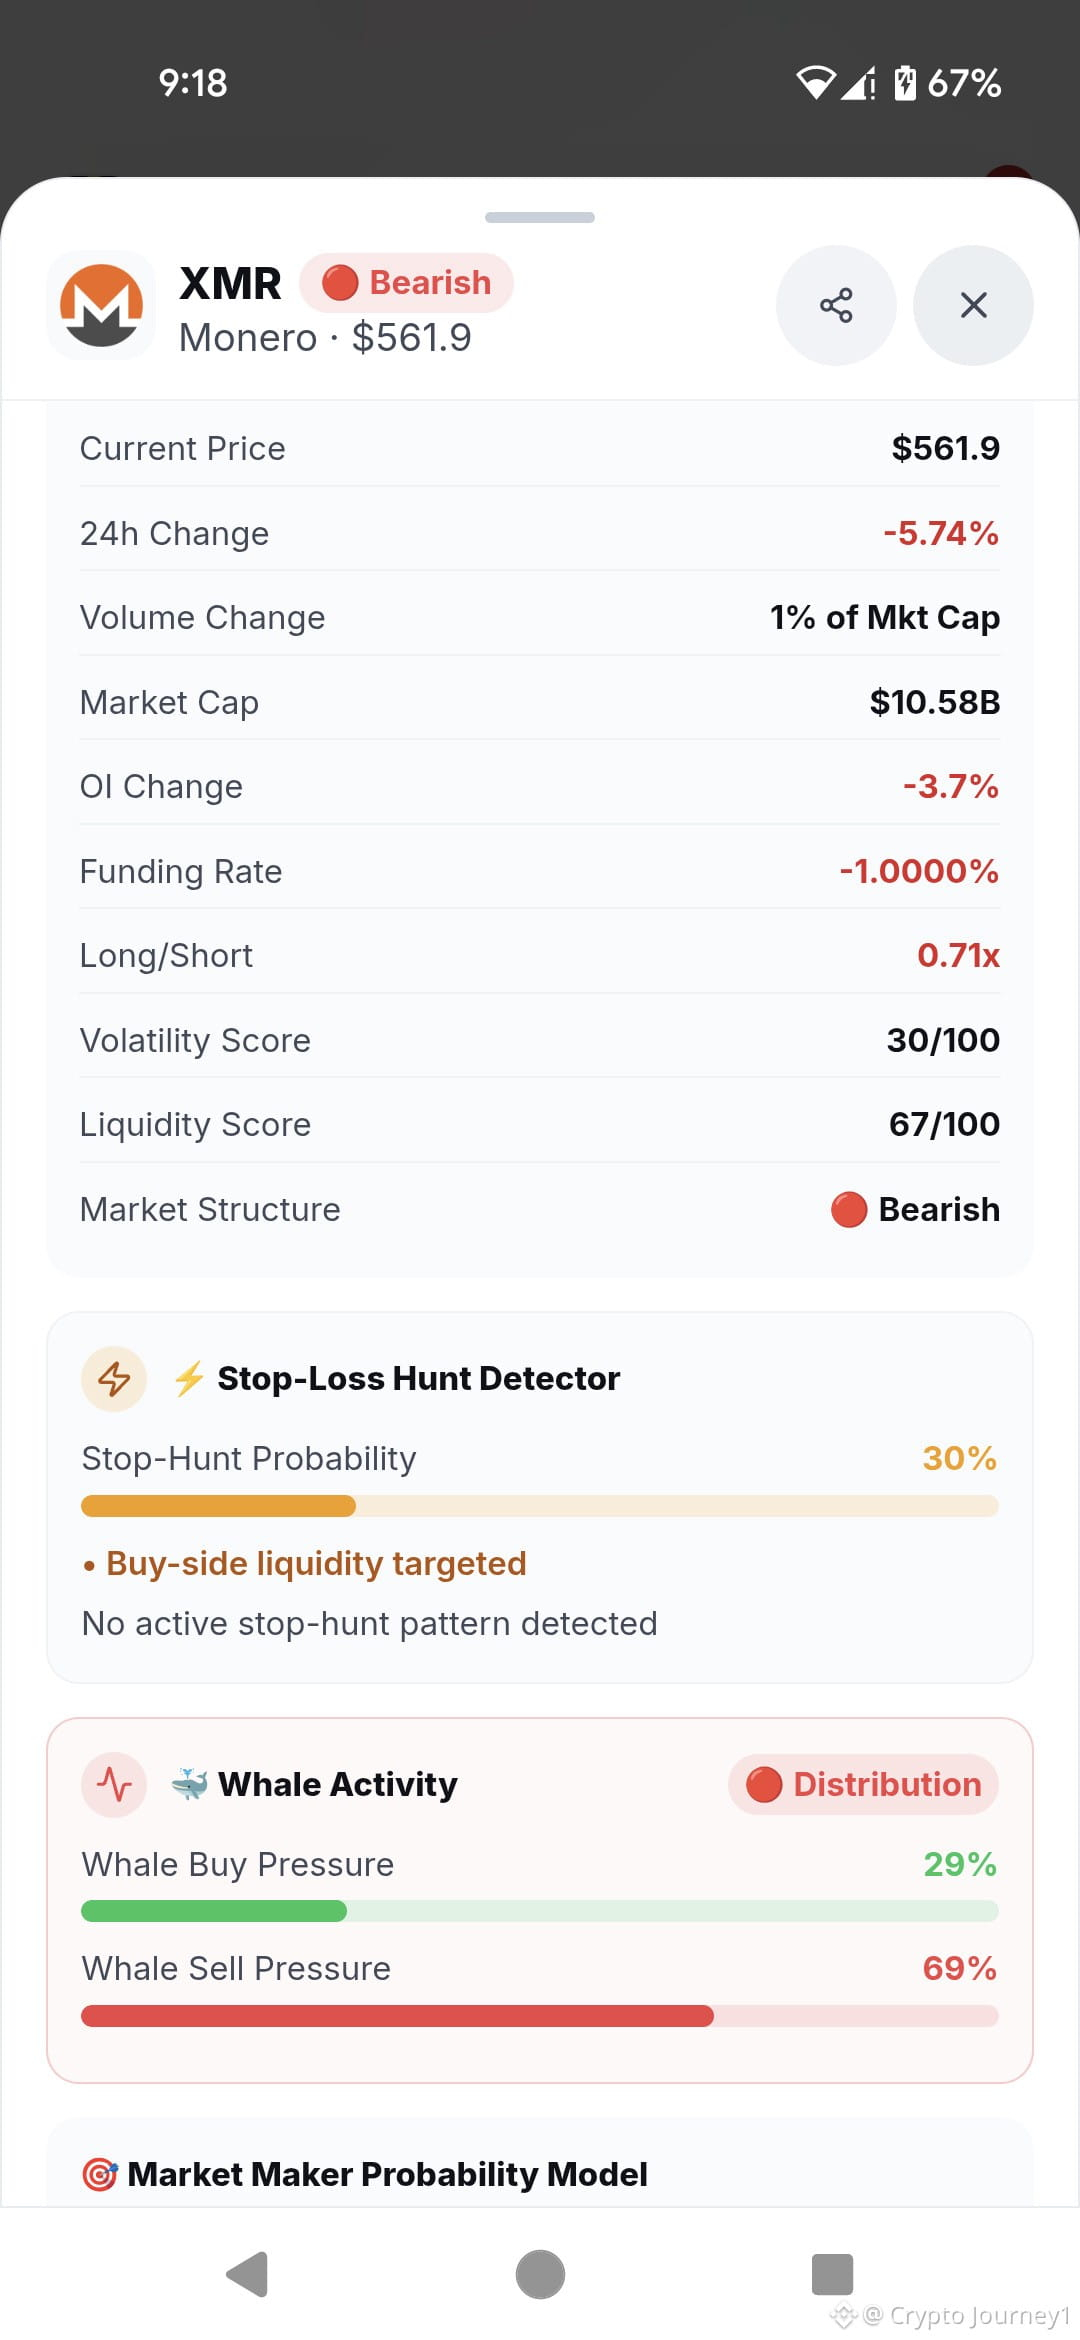
XMR UNDER PRESSURE: HEAVY DISTRIBUTION SIGNALS A FURTHER DROP. 🩸
$XMR
{future}(XMRUSDT)
Do not ignore the red flags on Monero right now. The asset is bleeding at $561.9 after a sharp -5.74% drop, and the overall Market Structure has firmly flipped to Bearish. The big players are exiting their positions fast.
Here is the exact breakdown of the current situation:
📊 The Market Overview:
· Market Cap: $10.58B
· Volume Change: 1% of Mkt Cap
· Open Interest (OI) Change: -3.7%
· Funding Rate: -1.0000% (Long/Short ratio is 0.71x)
· Volatility Score: 30/100
· Liquidity Score: 67/100
🐋 Whale & Maker Activity:
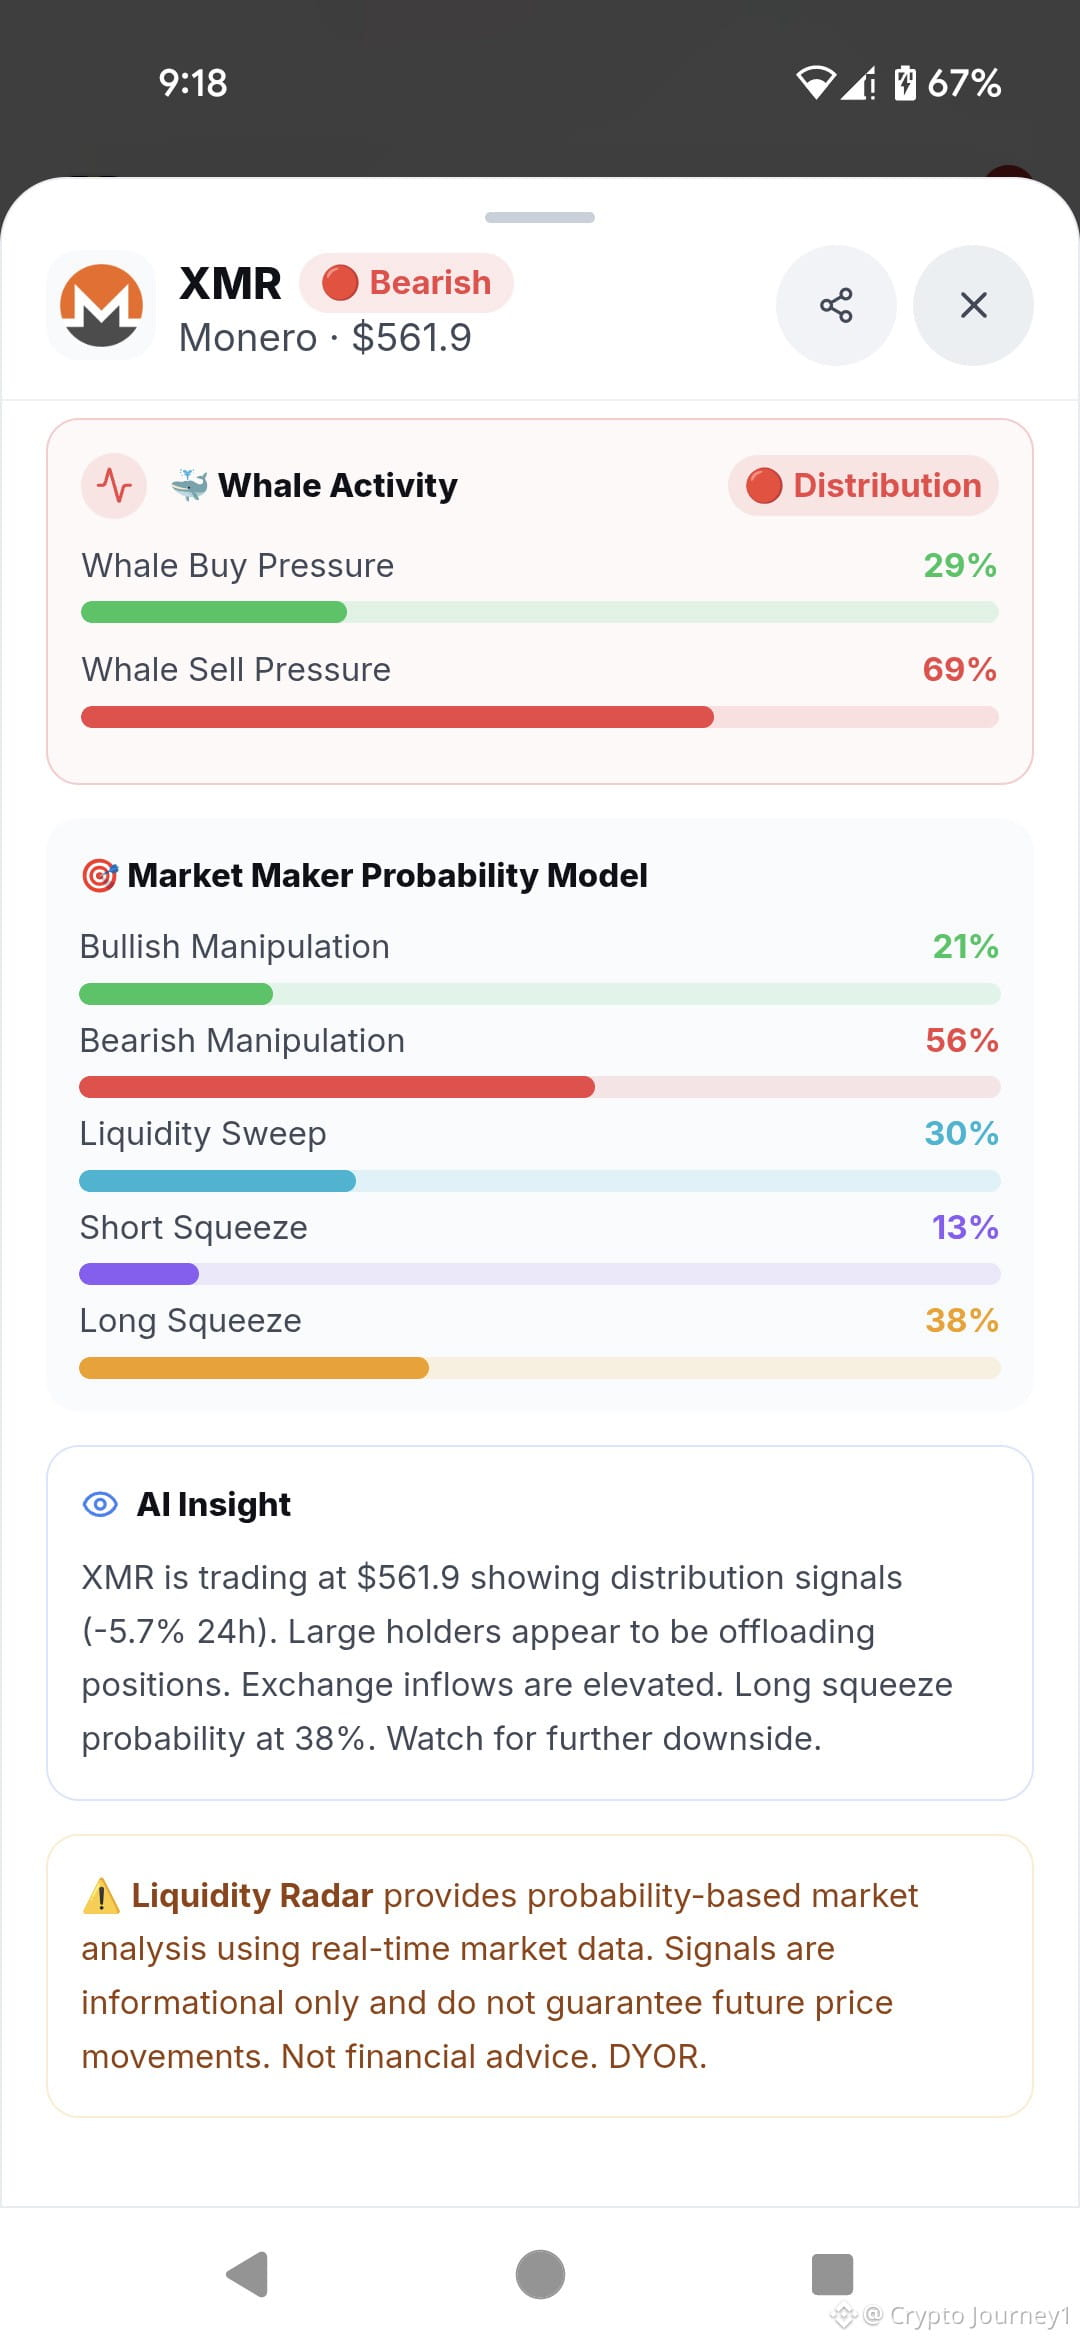
· Whale Activity: Official status is Distribution. Buy Pressure is weak at 29%, while Sell Pressure dominates at 69%.
· Manipulation Models: Bearish Manipulation (56%), Long Squeeze (38%), Liquidity Sweep (30%), Bullish Manipulation (21%), Short Squeeze (13%).
· Trap Detector: Stop-Loss Hunt probability is at 30%. It notes that buy-side liquidity is targeted, but no active stop-hunt pattern is detected at this moment.
🎯 My Trade Setup (SHORT Position):
With heavy whale selling and a high probability of a long squeeze, the trend is pointing down. I am looking to short any minor relief bounces.
· Entry Zone: $570.00 - $580.00 (Wait for a slight pullback).
· Take Profit 1 (TP1): $530.00
· Take Profit 2 (TP2): $495.00
· Stop Loss (SL): $610.00 (Above the recent breakdown level to protect against a fakeout).
· Risk/Reward: Roughly 1:2.
💡 The Reality Check:
The dashboard summary confirms the bearish thesis: "XMR is trading at $561.9 showing distribution signals. Large holders appear to be offloading positions. Exchange inflows are elevated. Long squeeze probability at 38%. Watch for further downside."
If you are holding a long position, you need to be extremely careful here. The data clearly shows the smart money is leaving.
Are you shorting this XMR downtrend, or waiting for a bottom to form? 👇
XMR UNDER PRESSURE: HEAVY DISTRIBUTION SIGNALS A FURTHER DROP. 🩸
$XMR
Do not ignore the red flags on Monero right now. The asset is bleeding at $561.9 after a sharp -5.74% drop, and the overall Market Structure has firmly flipped to Bearish. The big players are exiting their positions fast.
Here is the exact breakdown of the current situation:
📊 The Market Overview:
· Market Cap: $10.58B
· Volume Change: 1% of Mkt Cap
· Open Interest (OI) Change: -3.7%
· Funding Rate: -1.0000% (Long/Short ratio is 0.71x)
· Volatility Score: 30/100
· Liquidity Score: 67/100
🐋 Whale & Maker Activity:
· Whale Activity: Official status is Distribution. Buy Pressure is weak at 29%, while Sell Pressure dominates at 69%.
· Manipulation Models: Bearish Manipulation (56%), Long Squeeze (38%), Liquidity Sweep (30%), Bullish Manipulation (21%), Short Squeeze (13%).
· Trap Detector: Stop-Loss Hunt probability is at 30%. It notes that buy-side liquidity is targeted, but no active stop-hunt pattern is detected at this moment.
🎯 My Trade Setup (SHORT Position):
With heavy whale selling and a high probability of a long squeeze, the trend is pointing down. I am looking to short any minor relief bounces.
· Entry Zone: $570.00 - $580.00 (Wait for a slight pullback).
· Take Profit 1 (TP1): $530.00
· Take Profit 2 (TP2): $495.00
· Stop Loss (SL): $610.00 (Above the recent breakdown level to protect against a fakeout).
· Risk/Reward: Roughly 1:2.
💡 The Reality Check:
The dashboard summary confirms the bearish thesis: "XMR is trading at $561.9 showing distribution signals. Large holders appear to be offloading positions. Exchange inflows are elevated. Long squeeze probability at 38%. Watch for further downside."
If you are holding a long position, you need to be extremely careful here. The data clearly shows the smart money is leaving.
Are you shorting this XMR downtrend, or waiting for a bottom to form? 👇
$XMR
Do not ignore the red flags on Monero right now. The asset is bleeding at $561.9 after a sharp -5.74% drop, and the overall Market Structure has firmly flipped to Bearish. The big players are exiting their positions fast.
Here is the exact breakdown of the current situation:
📊 The Market Overview:
· Market Cap: $10.58B
· Volume Change: 1% of Mkt Cap
· Open Interest (OI) Change: -3.7%
· Funding Rate: -1.0000% (Long/Short ratio is 0.71x)
· Volatility Score: 30/100
· Liquidity Score: 67/100
🐋 Whale & Maker Activity:
· Whale Activity: Official status is Distribution. Buy Pressure is weak at 29%, while Sell Pressure dominates at 69%.
· Manipulation Models: Bearish Manipulation (56%), Long Squeeze (38%), Liquidity Sweep (30%), Bullish Manipulation (21%), Short Squeeze (13%).
· Trap Detector: Stop-Loss Hunt probability is at 30%. It notes that buy-side liquidity is targeted, but no active stop-hunt pattern is detected at this moment.
🎯 My Trade Setup (SHORT Position):
With heavy whale selling and a high probability of a long squeeze, the trend is pointing down. I am looking to short any minor relief bounces.
· Entry Zone: $570.00 - $580.00 (Wait for a slight pullback).
· Take Profit 1 (TP1): $530.00
· Take Profit 2 (TP2): $495.00
· Stop Loss (SL): $610.00 (Above the recent breakdown level to protect against a fakeout).
· Risk/Reward: Roughly 1:2.
💡 The Reality Check:
The dashboard summary confirms the bearish thesis: "XMR is trading at $561.9 showing distribution signals. Large holders appear to be offloading positions. Exchange inflows are elevated. Long squeeze probability at 38%. Watch for further downside."
If you are holding a long position, you need to be extremely careful here. The data clearly shows the smart money is leaving.
Are you shorting this XMR downtrend, or waiting for a bottom to form? 👇
763
$HYPE
{future}(HYPEUSDT)
ALERT: A BEARISH TRAP HIDING BEHIND A GREEN CANDLE? ⚠️
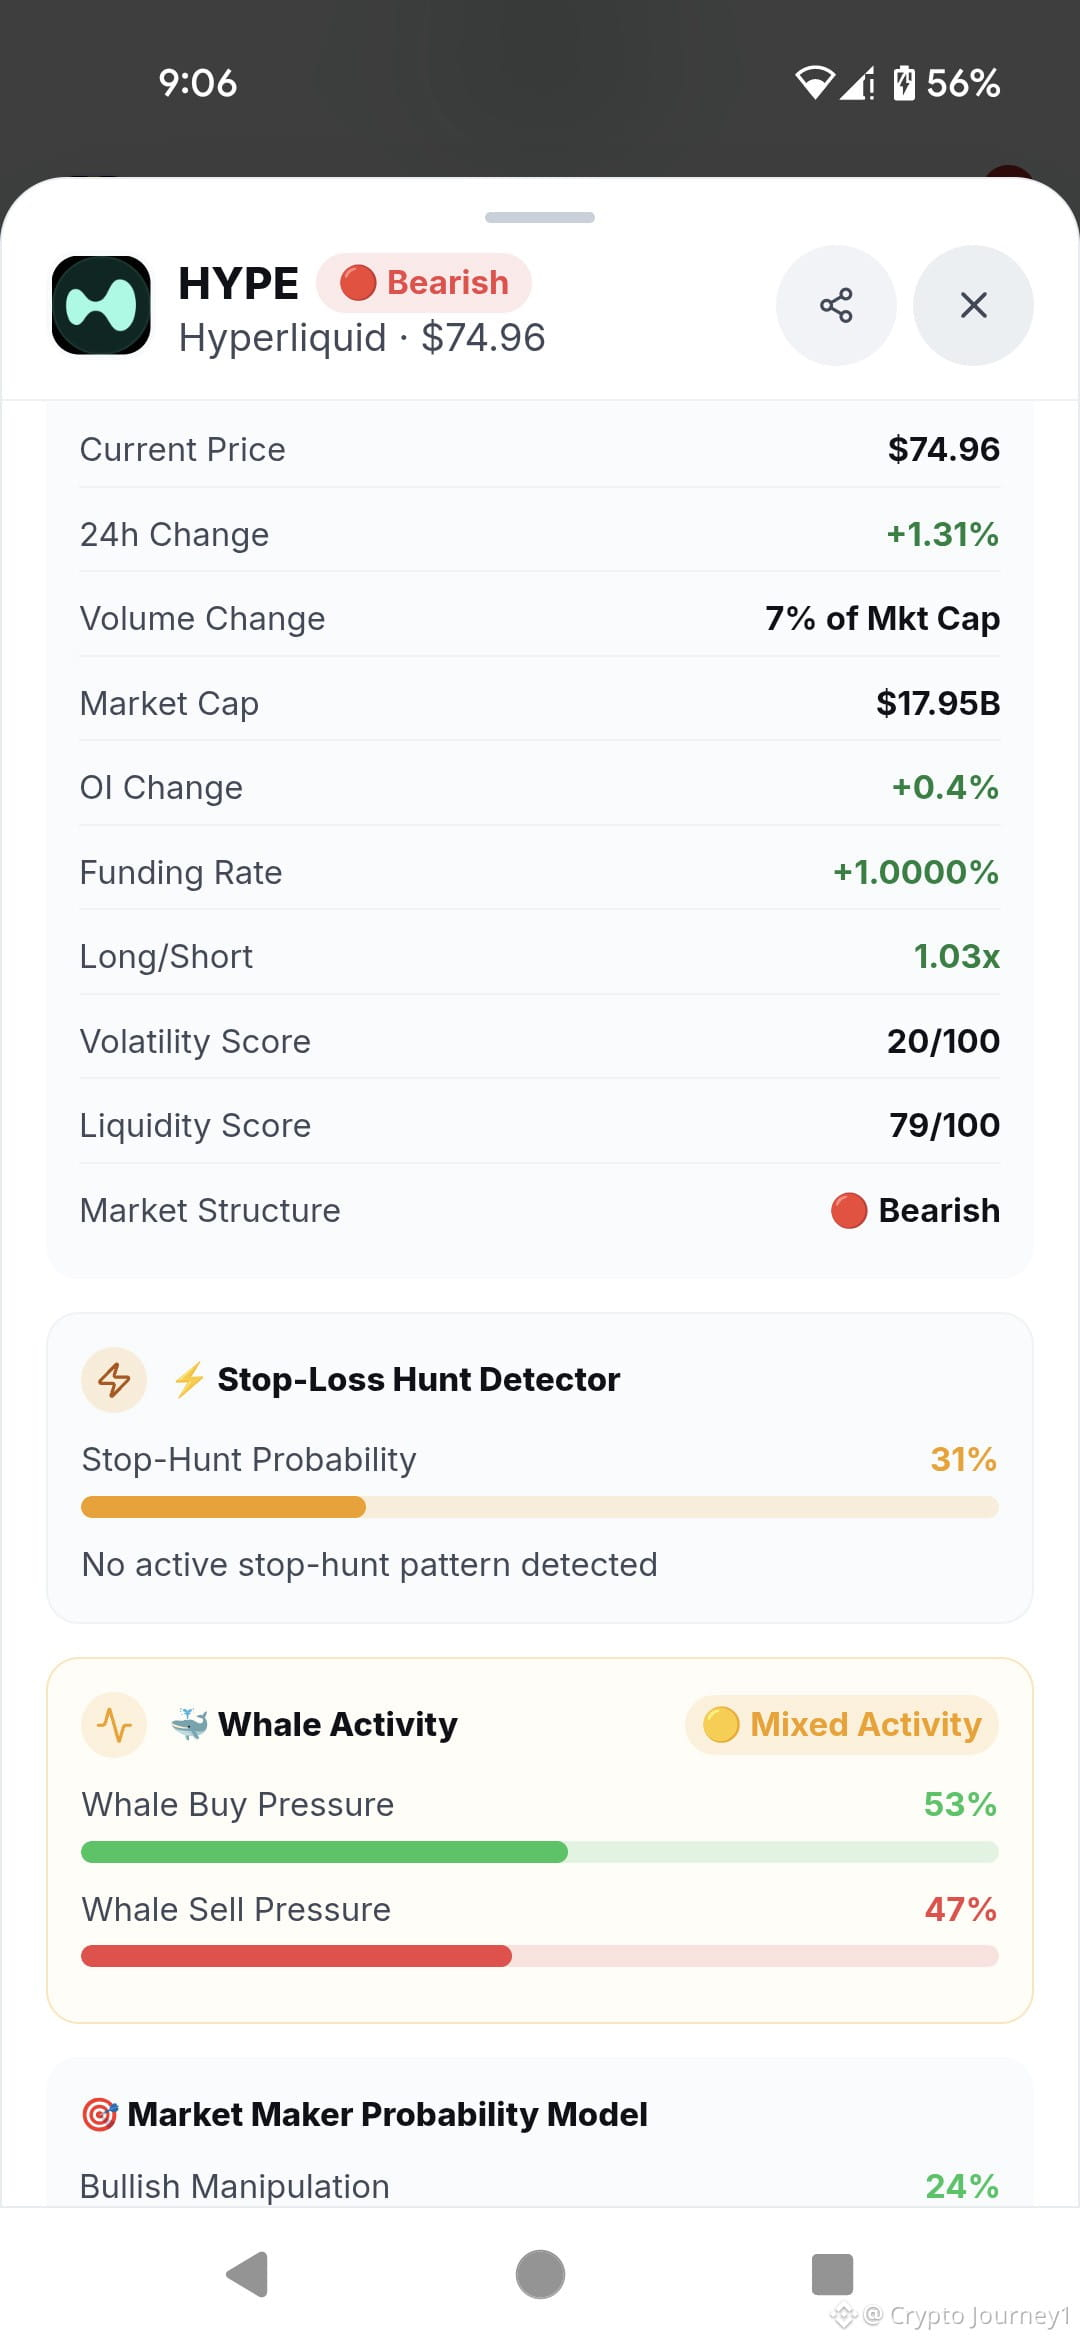
Do not let the +1.31% 24-hour change fool you. Hyperliquid ($HYPE) is currently printing a Bearish market structure, and the underlying data shows a market that is completely stuck in the mud.
Here is the exact breakdown of what is happening right now:
📊 The Market Overview:
· Current Price: $74.96
· **Market Cap:** $17.95B
· Volume Change: 7% of Mkt Cap
· Open Interest (OI) Change: +0.4%
· Funding Rate: +1.0000% (Long/Short ratio is 1.03x).
· Volatility Score: A dead 20/100.
· Liquidity Score: 79/100.
🐋 Whale & Maker Activity:
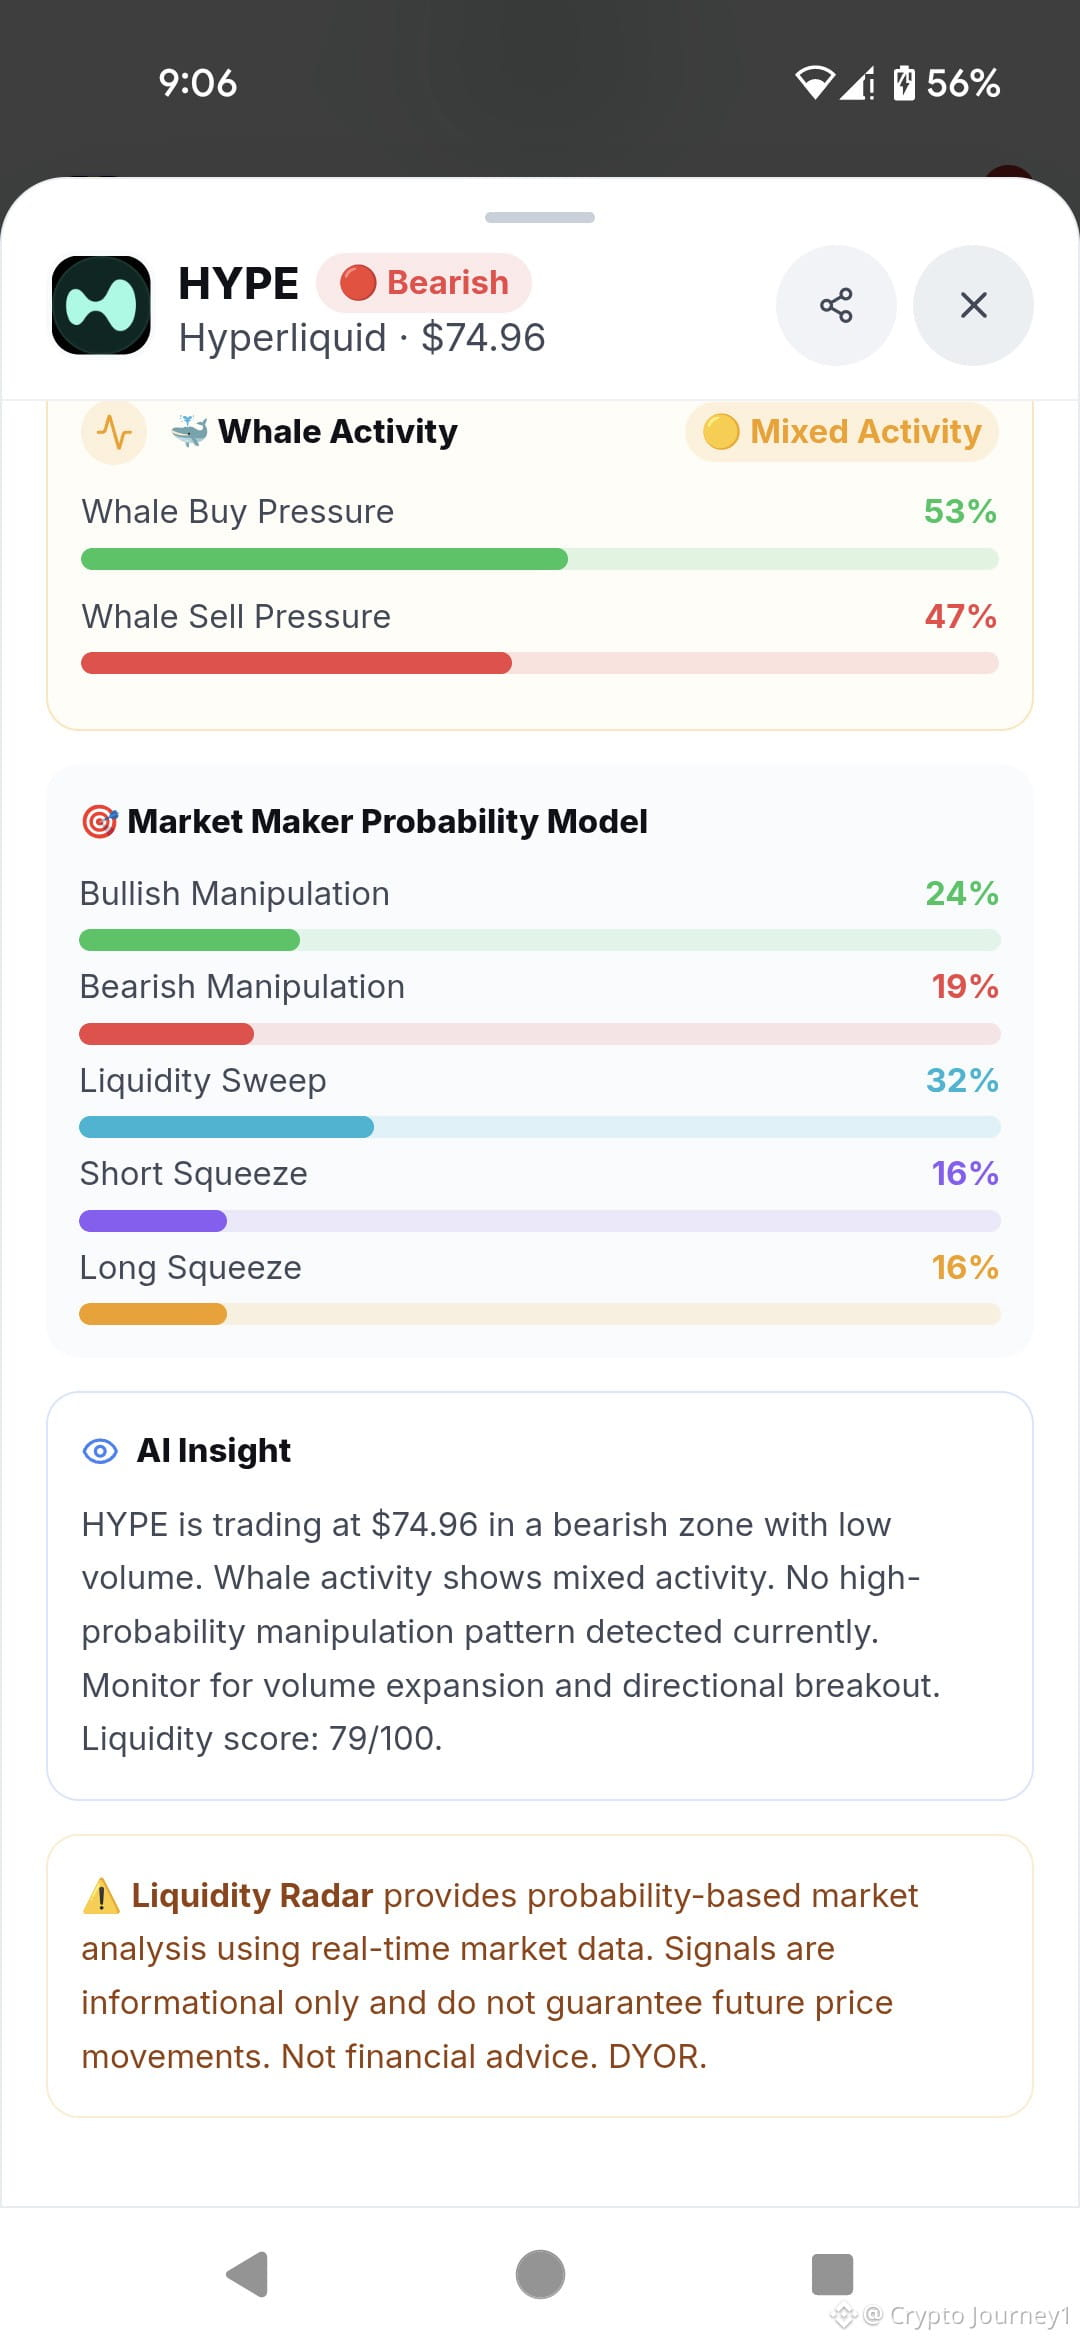
· Whale Activity: Mixed. Buy Pressure is slightly ahead at 53%, with Sell Pressure at 47%.
· Market Maker Model: Liquidity Sweep (32%), Bullish Manipulation (24%), Bearish Manipulation (19%), Short Squeeze (16%), Long Squeeze (16%).
· Trap Detector: Stop-Hunt Probability is sitting at 31% with no active patterns detected.
🎯 My Trade Setup (SHORT Position):
Because the overarching structure is bearish, I am looking to short any fake breakouts or pumps into resistance.
· Entry Zone: $75.50 - $76.50 (Wait for a push up).
· Take Profit 1 (TP1): $72.00
· **Take Profit 2 (TP2):** $69.50
· Stop Loss (SL): $78.00 (Above the recent local highs).
· Risk/Reward: Roughly 1:2.
💡 The Reality Check:
The system readout explains it clearly: "HYPE is trading in a bearish zone with low volume. Whale activity shows mixed activity. No high-probability manipulation pattern detected currently. Monitor for volume expansion and directional breakout."
With volatility this low and the structure pointing down, buying the green candle is risky. Play the trend and protect your capital.
Are you shorting this HYPE setup, or waiting for a volume breakout? 👇
$HYPE
ALERT: A BEARISH TRAP HIDING BEHIND A GREEN CANDLE? ⚠️
Do not let the +1.31% 24-hour change fool you. Hyperliquid ($HYPE ) is currently printing a Bearish market structure, and the underlying data shows a market that is completely stuck in the mud.
Here is the exact breakdown of what is happening right now:
📊 The Market Overview:
· Current Price: $74.96
· **Market Cap:** $17.95B
· Volume Change: 7% of Mkt Cap
· Open Interest (OI) Change: +0.4%
· Funding Rate: +1.0000% (Long/Short ratio is 1.03x).
· Volatility Score: A dead 20/100.
· Liquidity Score: 79/100.
🐋 Whale & Maker Activity:
· Whale Activity: Mixed. Buy Pressure is slightly ahead at 53%, with Sell Pressure at 47%.
· Market Maker Model: Liquidity Sweep (32%), Bullish Manipulation (24%), Bearish Manipulation (19%), Short Squeeze (16%), Long Squeeze (16%).
· Trap Detector: Stop-Hunt Probability is sitting at 31% with no active patterns detected.
🎯 My Trade Setup (SHORT Position):
Because the overarching structure is bearish, I am looking to short any fake breakouts or pumps into resistance.
· Entry Zone: $75.50 - $76.50 (Wait for a push up).
· Take Profit 1 (TP1): $72.00
· **Take Profit 2 (TP2):** $69.50
· Stop Loss (SL): $78.00 (Above the recent local highs).
· Risk/Reward: Roughly 1:2.
💡 The Reality Check:
The system readout explains it clearly: "HYPE is trading in a bearish zone with low volume. Whale activity shows mixed activity. No high-probability manipulation pattern detected currently. Monitor for volume expansion and directional breakout."
With volatility this low and the structure pointing down, buying the green candle is risky. Play the trend and protect your capital.
Are you shorting this HYPE setup, or waiting for a volume breakout? 👇
ALERT: A BEARISH TRAP HIDING BEHIND A GREEN CANDLE? ⚠️
Do not let the +1.31% 24-hour change fool you. Hyperliquid ($HYPE ) is currently printing a Bearish market structure, and the underlying data shows a market that is completely stuck in the mud.
Here is the exact breakdown of what is happening right now:
📊 The Market Overview:
· Current Price: $74.96
· **Market Cap:** $17.95B
· Volume Change: 7% of Mkt Cap
· Open Interest (OI) Change: +0.4%
· Funding Rate: +1.0000% (Long/Short ratio is 1.03x).
· Volatility Score: A dead 20/100.
· Liquidity Score: 79/100.
🐋 Whale & Maker Activity:
· Whale Activity: Mixed. Buy Pressure is slightly ahead at 53%, with Sell Pressure at 47%.
· Market Maker Model: Liquidity Sweep (32%), Bullish Manipulation (24%), Bearish Manipulation (19%), Short Squeeze (16%), Long Squeeze (16%).
· Trap Detector: Stop-Hunt Probability is sitting at 31% with no active patterns detected.
🎯 My Trade Setup (SHORT Position):
Because the overarching structure is bearish, I am looking to short any fake breakouts or pumps into resistance.
· Entry Zone: $75.50 - $76.50 (Wait for a push up).
· Take Profit 1 (TP1): $72.00
· **Take Profit 2 (TP2):** $69.50
· Stop Loss (SL): $78.00 (Above the recent local highs).
· Risk/Reward: Roughly 1:2.
💡 The Reality Check:
The system readout explains it clearly: "HYPE is trading in a bearish zone with low volume. Whale activity shows mixed activity. No high-probability manipulation pattern detected currently. Monitor for volume expansion and directional breakout."
With volatility this low and the structure pointing down, buying the green candle is risky. Play the trend and protect your capital.
Are you shorting this HYPE setup, or waiting for a volume breakout? 👇
2
820
XRP IS SLEEPING IN A BEARISH ZONE! DON'T GET FOOLED BY THE GREEN CANDLE. 🐢
$XRP
{future}(XRPUSDT)
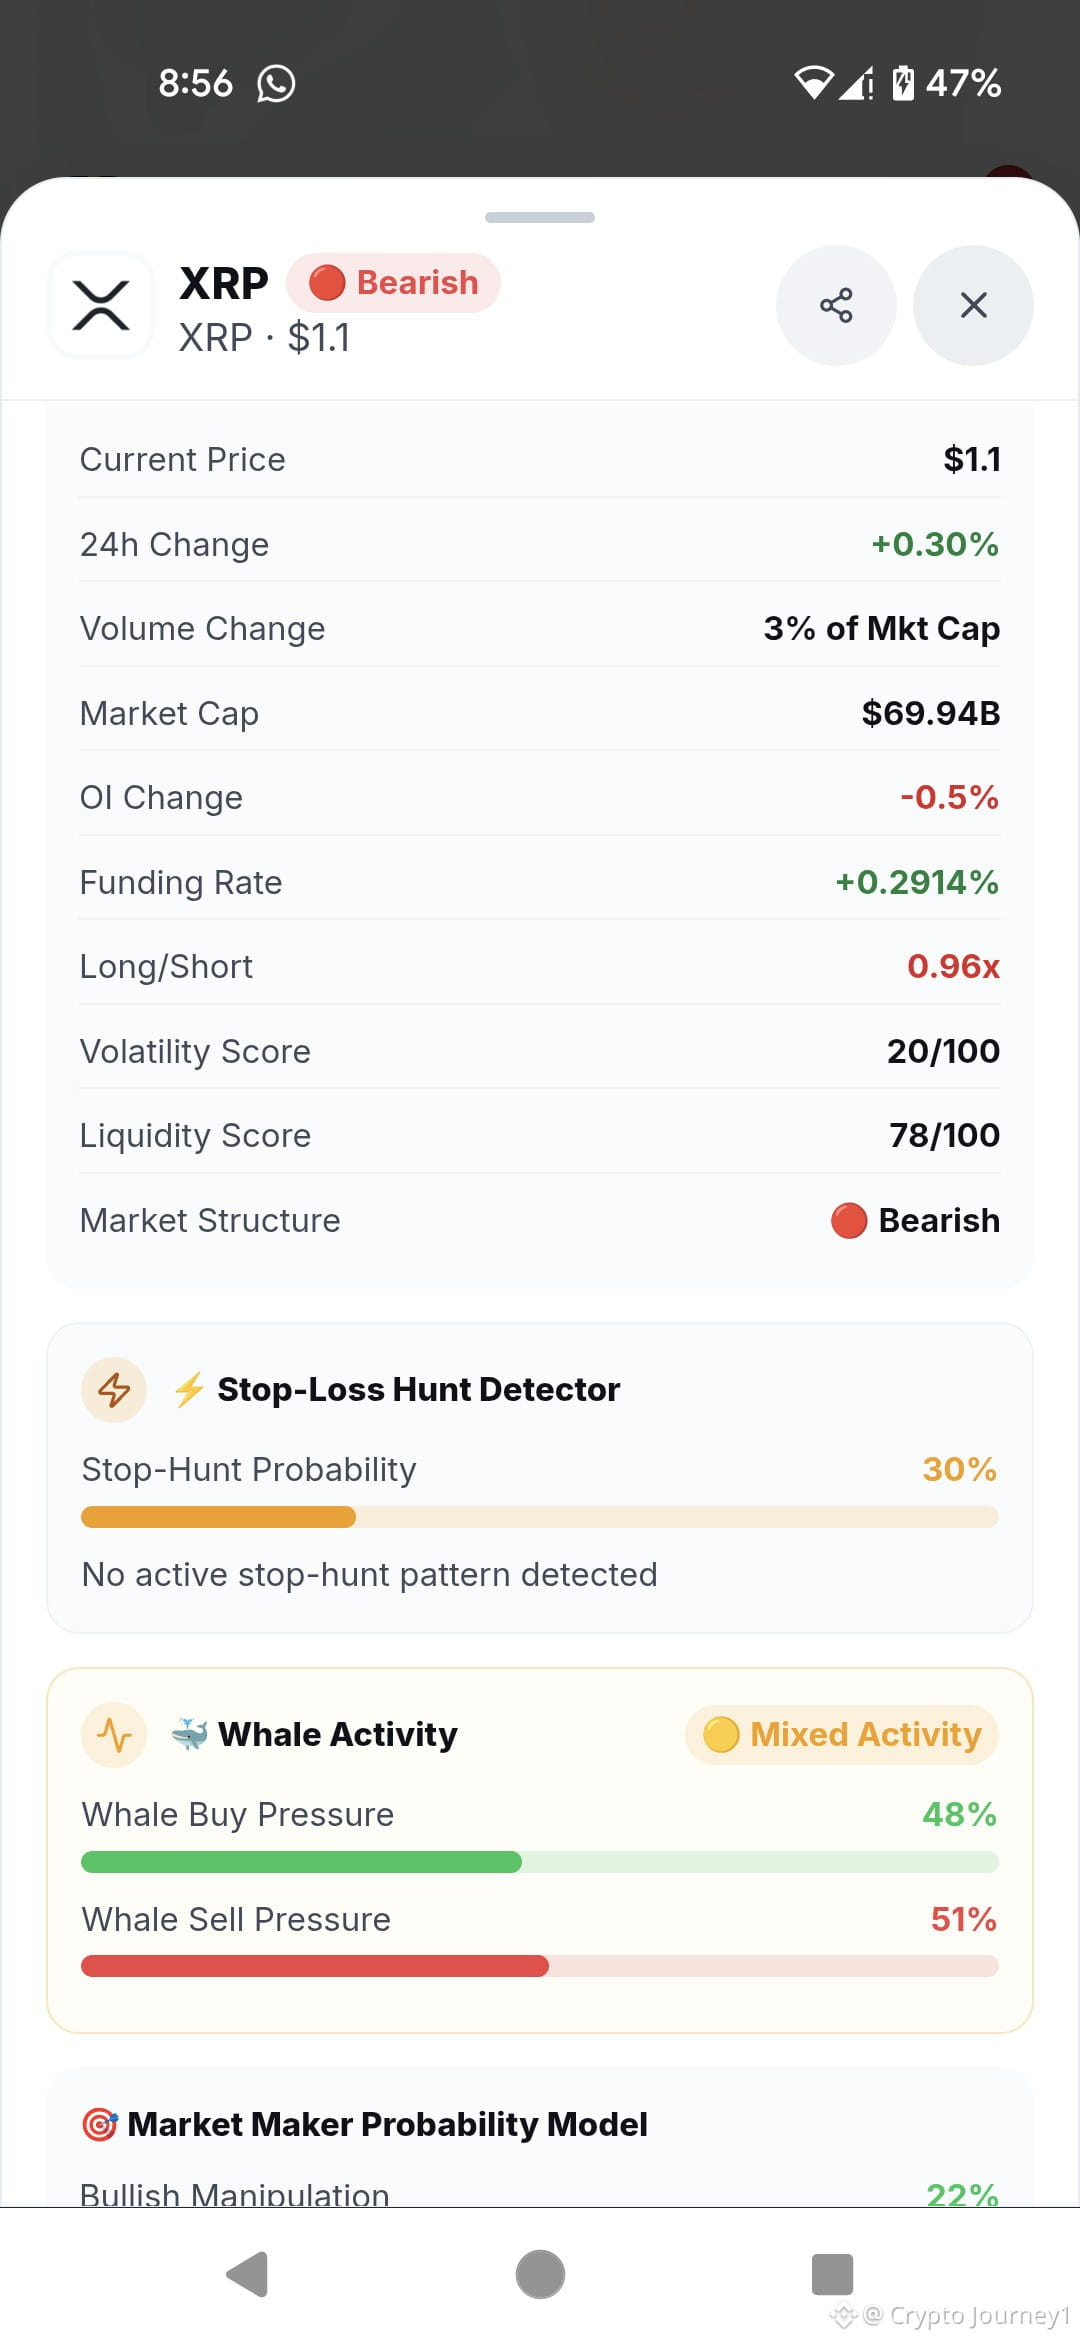
You know that feeling when you look at the charts and the market is just completely dead? That is exactly where XRP is right now.
Yes, it’s showing +0.30% on the 24-hour change, but don’t let that tiny green number trick you. The overall Market Structure is firmly Bearish.
Let's cut through the noise and look at the raw data:
· Current Price: $1.1
· **Market Cap:** $69.94B
· Volume Change: Only 3% of Mkt Cap (The market is asleep).
· OI Change: -0.5%
· Funding Rate: +0.2914% (Long/Short ratio is 0.96x).
· Volatility Score: 20/100 (Extremely low).
· Liquidity Score: 78/100.
🐋 Whales and Manipulation Models:
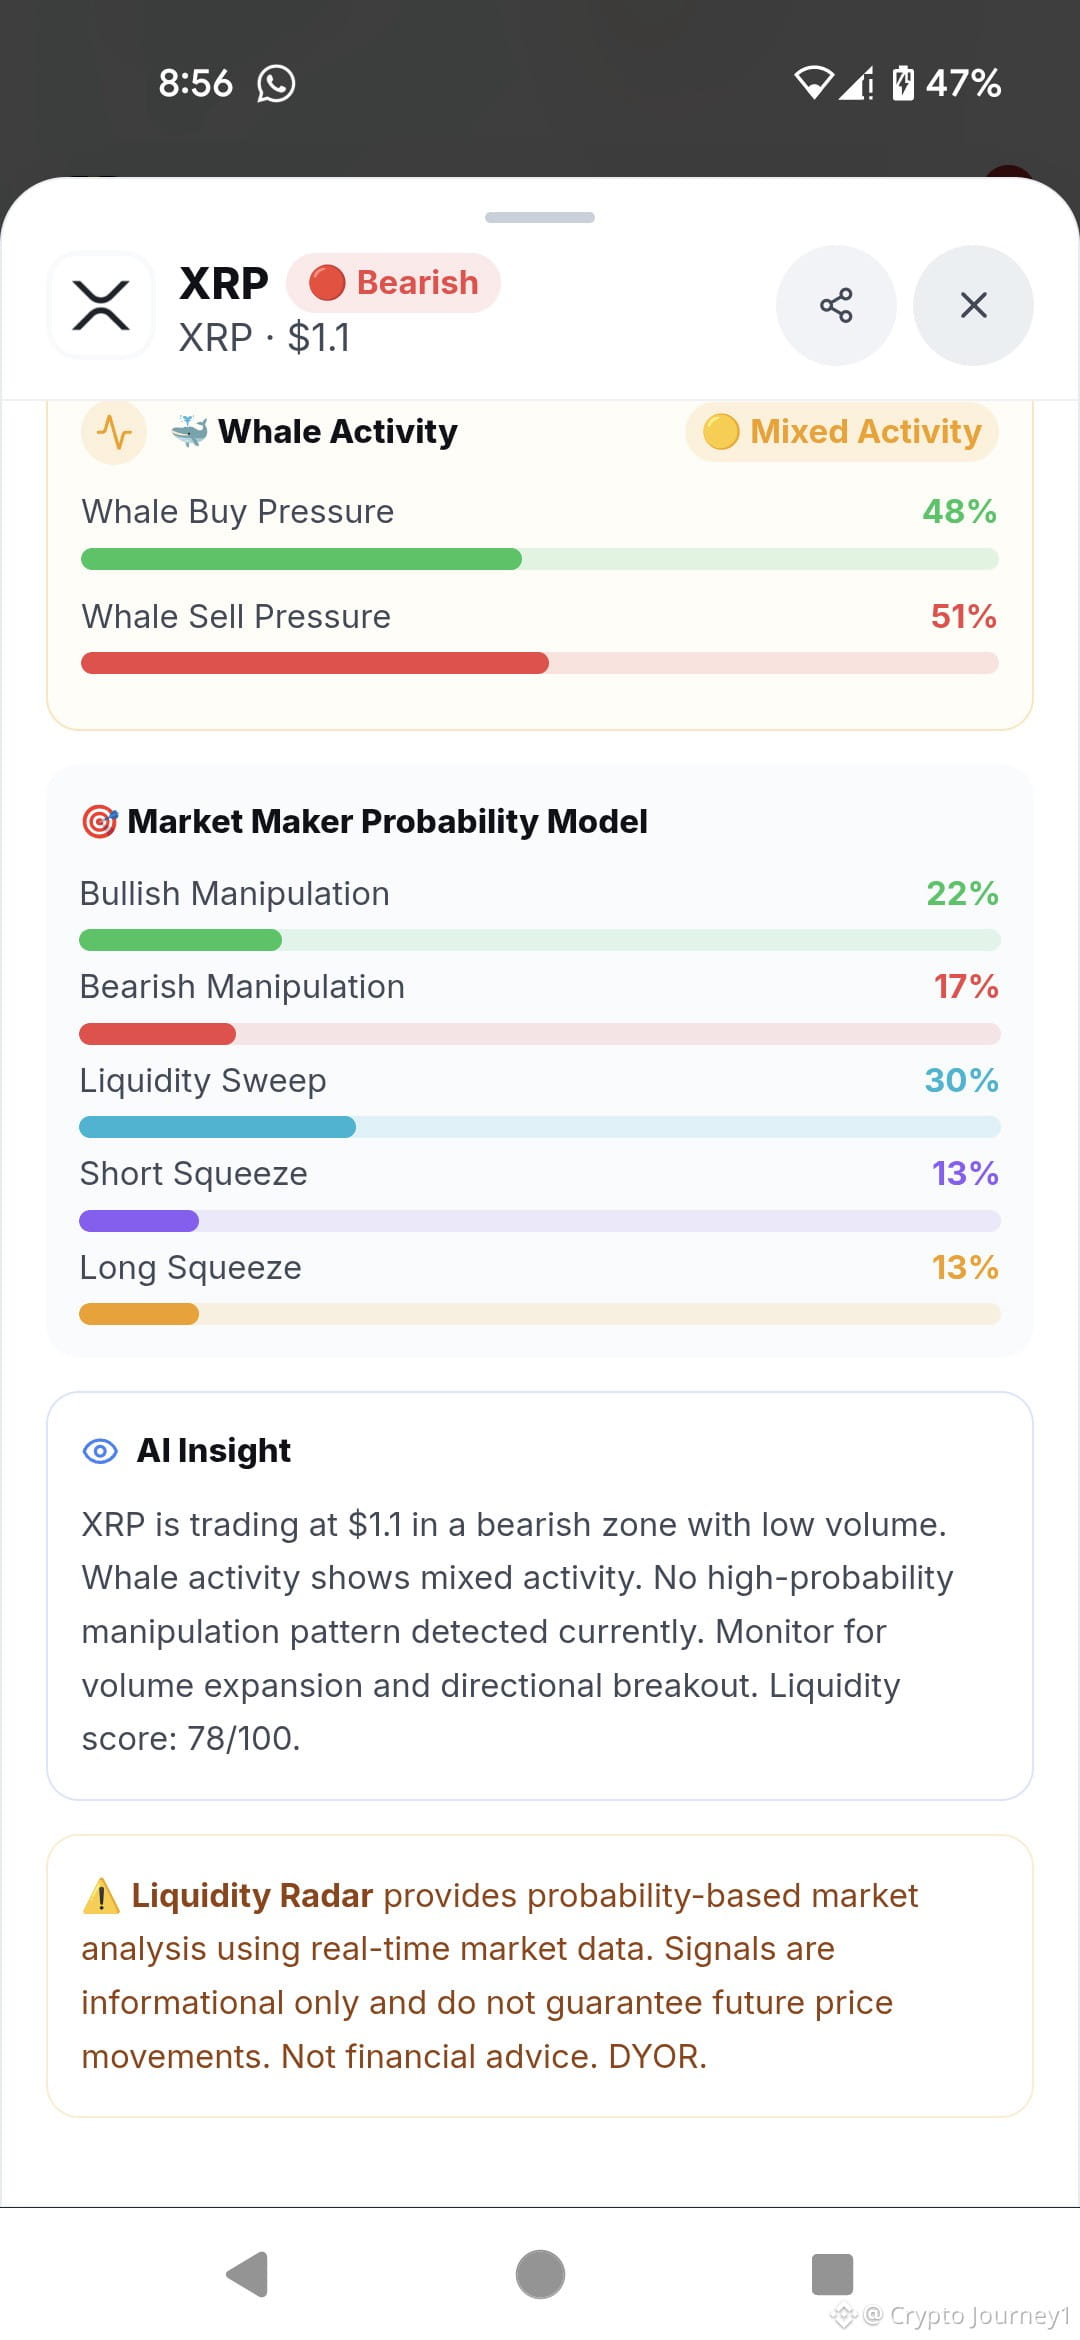
Whales are literally sitting on their hands. Buy Pressure is 48% and Sell Pressure is 51%.
Looking at the Market Maker Probability Model:
· Liquidity Sweep: 30%
· Bullish Manipulation: 22%
· Bearish Manipulation: 17%
· Short Squeeze: 13%
· Long Squeeze: 13%
The Stop-Loss Hunt Detector is at 30% and confirms: "No active stop-hunt pattern detected."
🎯 My Trade Setup (SHORT Position):
Because the structure is bearish and the market is quiet, I am looking to catch a short on any fake pump.
· Entry Zone: $1.12 - $1.15 (Wait for a small bounce to trap the bulls).
· Take Profit 1 (TP1): $1.05
· **Take Profit 2 (TP2):** $1.00
· Stop Loss (SL): $1.18 (Just above the recent local resistance).
· Risk/Reward: Roughly 1:2.
💡 The Reality Check:
The system summary nails it: "XRP is trading at $1.1 in a bearish zone with low volume... No high-probability manipulation pattern detected currently. Monitor for volume expansion and directional breakout."
Do not force a trade in the middle of nowhere. Wait for the price to push up into our entry zone, or wait for a volume breakout.
Are you playing the short side on XRP today, or just waiting for the market to wake up? 👇
XRP IS SLEEPING IN A BEARISH ZONE! DON'T GET FOOLED BY THE GREEN CANDLE. 🐢
$XRP
You know that feeling when you look at the charts and the market is just completely dead? That is exactly where XRP is right now.
Yes, it’s showing +0.30% on the 24-hour change, but don’t let that tiny green number trick you. The overall Market Structure is firmly Bearish.
Let's cut through the noise and look at the raw data:
· Current Price: $1.1
· **Market Cap:** $69.94B
· Volume Change: Only 3% of Mkt Cap (The market is asleep).
· OI Change: -0.5%
· Funding Rate: +0.2914% (Long/Short ratio is 0.96x).
· Volatility Score: 20/100 (Extremely low).
· Liquidity Score: 78/100.
🐋 Whales and Manipulation Models:
Whales are literally sitting on their hands. Buy Pressure is 48% and Sell Pressure is 51%.
Looking at the Market Maker Probability Model:
· Liquidity Sweep: 30%
· Bullish Manipulation: 22%
· Bearish Manipulation: 17%
· Short Squeeze: 13%
· Long Squeeze: 13%
The Stop-Loss Hunt Detector is at 30% and confirms: "No active stop-hunt pattern detected."
🎯 My Trade Setup (SHORT Position):
Because the structure is bearish and the market is quiet, I am looking to catch a short on any fake pump.
· Entry Zone: $1.12 - $1.15 (Wait for a small bounce to trap the bulls).
· Take Profit 1 (TP1): $1.05
· **Take Profit 2 (TP2):** $1.00
· Stop Loss (SL): $1.18 (Just above the recent local resistance).
· Risk/Reward: Roughly 1:2.
💡 The Reality Check:
The system summary nails it: "XRP is trading at $1.1 in a bearish zone with low volume... No high-probability manipulation pattern detected currently. Monitor for volume expansion and directional breakout."
Do not force a trade in the middle of nowhere. Wait for the price to push up into our entry zone, or wait for a volume breakout.
Are you playing the short side on XRP today, or just waiting for the market to wake up? 👇
$XRP
You know that feeling when you look at the charts and the market is just completely dead? That is exactly where XRP is right now.
Yes, it’s showing +0.30% on the 24-hour change, but don’t let that tiny green number trick you. The overall Market Structure is firmly Bearish.
Let's cut through the noise and look at the raw data:
· Current Price: $1.1
· **Market Cap:** $69.94B
· Volume Change: Only 3% of Mkt Cap (The market is asleep).
· OI Change: -0.5%
· Funding Rate: +0.2914% (Long/Short ratio is 0.96x).
· Volatility Score: 20/100 (Extremely low).
· Liquidity Score: 78/100.
🐋 Whales and Manipulation Models:
Whales are literally sitting on their hands. Buy Pressure is 48% and Sell Pressure is 51%.
Looking at the Market Maker Probability Model:
· Liquidity Sweep: 30%
· Bullish Manipulation: 22%
· Bearish Manipulation: 17%
· Short Squeeze: 13%
· Long Squeeze: 13%
The Stop-Loss Hunt Detector is at 30% and confirms: "No active stop-hunt pattern detected."
🎯 My Trade Setup (SHORT Position):
Because the structure is bearish and the market is quiet, I am looking to catch a short on any fake pump.
· Entry Zone: $1.12 - $1.15 (Wait for a small bounce to trap the bulls).
· Take Profit 1 (TP1): $1.05
· **Take Profit 2 (TP2):** $1.00
· Stop Loss (SL): $1.18 (Just above the recent local resistance).
· Risk/Reward: Roughly 1:2.
💡 The Reality Check:
The system summary nails it: "XRP is trading at $1.1 in a bearish zone with low volume... No high-probability manipulation pattern detected currently. Monitor for volume expansion and directional breakout."
Do not force a trade in the middle of nowhere. Wait for the price to push up into our entry zone, or wait for a volume breakout.
Are you playing the short side on XRP today, or just waiting for the market to wake up? 👇
2
2k
BONK SIGNAL: THE CHART SAYS BUY, BUT THE DATA SAYS WAIT. ⚠️
$BONK
{spot}(BONKUSDT)
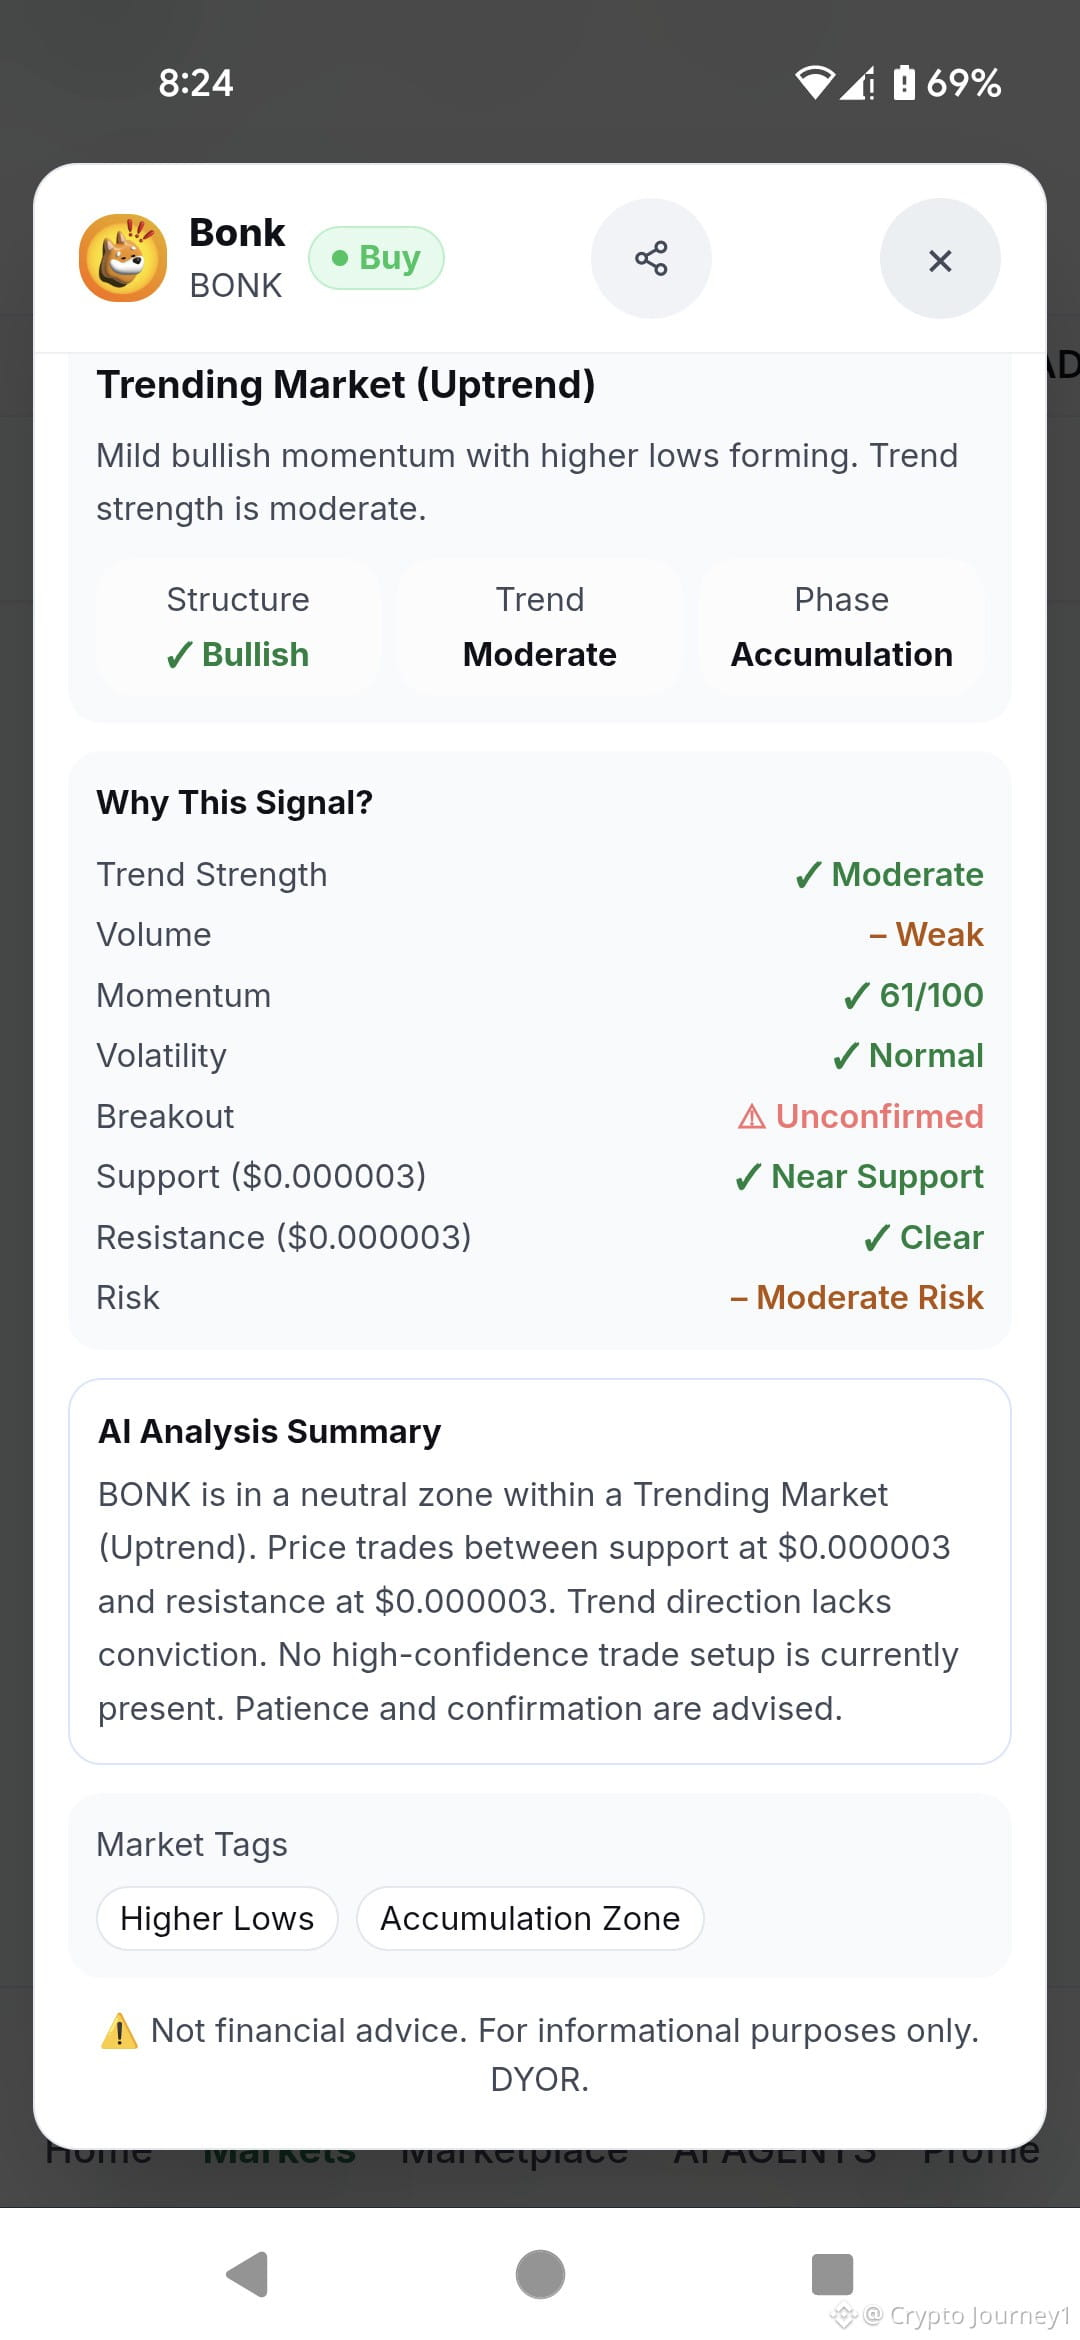
Don't let the green "Buy" tag fool you into rushing your entry. I was looking at the charts today and pulled up Bonk (BONK). While it’s sitting in a Trending Market (Uptrend) with a Bullish structure, the system is waving a big yellow caution flag.
Here is the exact breakdown of what is happening under the hood:
📊 Market Condition & Stats:
· Phase: Accumulation
· Trend Strength: Moderate
· Volume: Weak
· Momentum: 61/100
· Volatility: Normal
· Risk: Moderate Risk
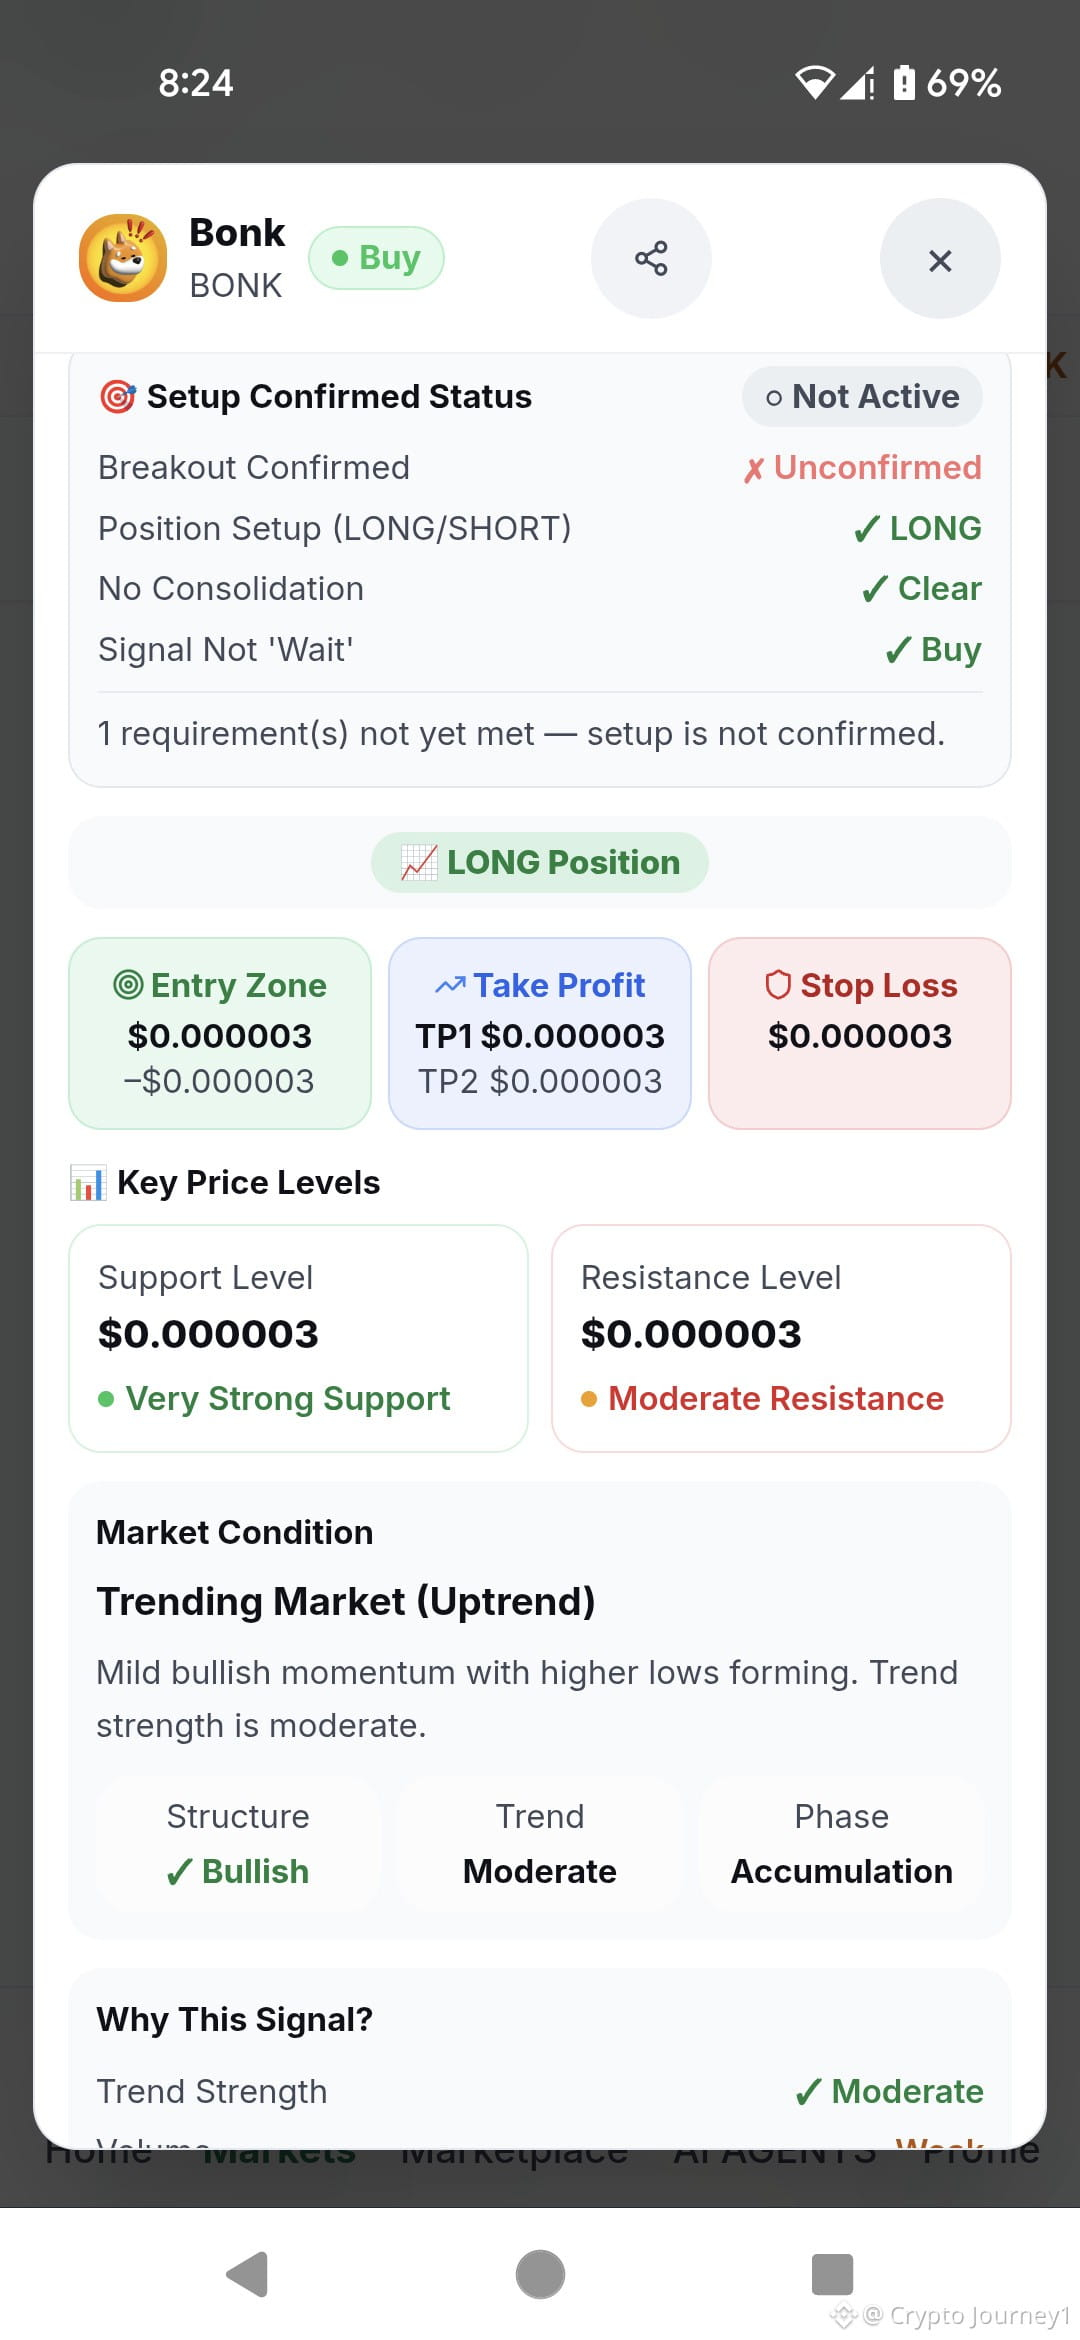
🛑 Setup Status:
· Status: Not Active
· Position Setup: LONG
· Breakout: Unconfirmed
· Note: The system explicitly states that 1 requirement is not yet met before this setup is confirmed.
🎯 The Trade Setup (LONG Position):
I always plan my trades before I enter, so here are the exact levels the system is showing. Note that the app is currently rounding the micro-cap numbers, showing identical figures for entry, targets, and stops:
· Entry Zone: $0.000003 - $0.000003
· Take Profit 1 (TP1): $0.000003
· **Take Profit 2 (TP2):** $0.000003
· Stop Loss (SL): $0.000003
· **Key Levels:** Very Strong Support at $0.000003 and Moderate Resistance at $0.000003.
💡 My Take:
The dashboard summary is clear: "BONK is in a neutral zone... Trend direction lacks conviction. No high-confidence trade setup is currently present. Patience and confirmation are advised."
Even though we are seeing Higher Lows in an Accumulation Zone, the weak volume means there is no fuel to push a real breakout yet. Do not force a trade in the middle of this tight range.
Are you waiting for the breakout on BONK, or skipping this setup entirely? 👇
BONK SIGNAL: THE CHART SAYS BUY, BUT THE DATA SAYS WAIT. ⚠️
$BONK
Don't let the green "Buy" tag fool you into rushing your entry. I was looking at the charts today and pulled up Bonk (BONK). While it’s sitting in a Trending Market (Uptrend) with a Bullish structure, the system is waving a big yellow caution flag.
Here is the exact breakdown of what is happening under the hood:
📊 Market Condition & Stats:
· Phase: Accumulation
· Trend Strength: Moderate
· Volume: Weak
· Momentum: 61/100
· Volatility: Normal
· Risk: Moderate Risk
🛑 Setup Status:
· Status: Not Active
· Position Setup: LONG
· Breakout: Unconfirmed
· Note: The system explicitly states that 1 requirement is not yet met before this setup is confirmed.
🎯 The Trade Setup (LONG Position):
I always plan my trades before I enter, so here are the exact levels the system is showing. Note that the app is currently rounding the micro-cap numbers, showing identical figures for entry, targets, and stops:
· Entry Zone: $0.000003 - $0.000003
· Take Profit 1 (TP1): $0.000003
· **Take Profit 2 (TP2):** $0.000003
· Stop Loss (SL): $0.000003
· **Key Levels:** Very Strong Support at $0.000003 and Moderate Resistance at $0.000003.
💡 My Take:
The dashboard summary is clear: "BONK is in a neutral zone... Trend direction lacks conviction. No high-confidence trade setup is currently present. Patience and confirmation are advised."
Even though we are seeing Higher Lows in an Accumulation Zone, the weak volume means there is no fuel to push a real breakout yet. Do not force a trade in the middle of this tight range.
Are you waiting for the breakout on BONK, or skipping this setup entirely? 👇
$BONK
Don't let the green "Buy" tag fool you into rushing your entry. I was looking at the charts today and pulled up Bonk (BONK). While it’s sitting in a Trending Market (Uptrend) with a Bullish structure, the system is waving a big yellow caution flag.
Here is the exact breakdown of what is happening under the hood:
📊 Market Condition & Stats:
· Phase: Accumulation
· Trend Strength: Moderate
· Volume: Weak
· Momentum: 61/100
· Volatility: Normal
· Risk: Moderate Risk
🛑 Setup Status:
· Status: Not Active
· Position Setup: LONG
· Breakout: Unconfirmed
· Note: The system explicitly states that 1 requirement is not yet met before this setup is confirmed.
🎯 The Trade Setup (LONG Position):
I always plan my trades before I enter, so here are the exact levels the system is showing. Note that the app is currently rounding the micro-cap numbers, showing identical figures for entry, targets, and stops:
· Entry Zone: $0.000003 - $0.000003
· Take Profit 1 (TP1): $0.000003
· **Take Profit 2 (TP2):** $0.000003
· Stop Loss (SL): $0.000003
· **Key Levels:** Very Strong Support at $0.000003 and Moderate Resistance at $0.000003.
💡 My Take:
The dashboard summary is clear: "BONK is in a neutral zone... Trend direction lacks conviction. No high-confidence trade setup is currently present. Patience and confirmation are advised."
Even though we are seeing Higher Lows in an Accumulation Zone, the weak volume means there is no fuel to push a real breakout yet. Do not force a trade in the middle of this tight range.
Are you waiting for the breakout on BONK, or skipping this setup entirely? 👇
3
788
NO HIDING THE LOSSES: A RAW LOOK INSIDE MY RECENT TRADE BATCH. 📊
$PEPE
{spot}(PEPEUSDT)
$BTC
{future}(BTCUSDT)
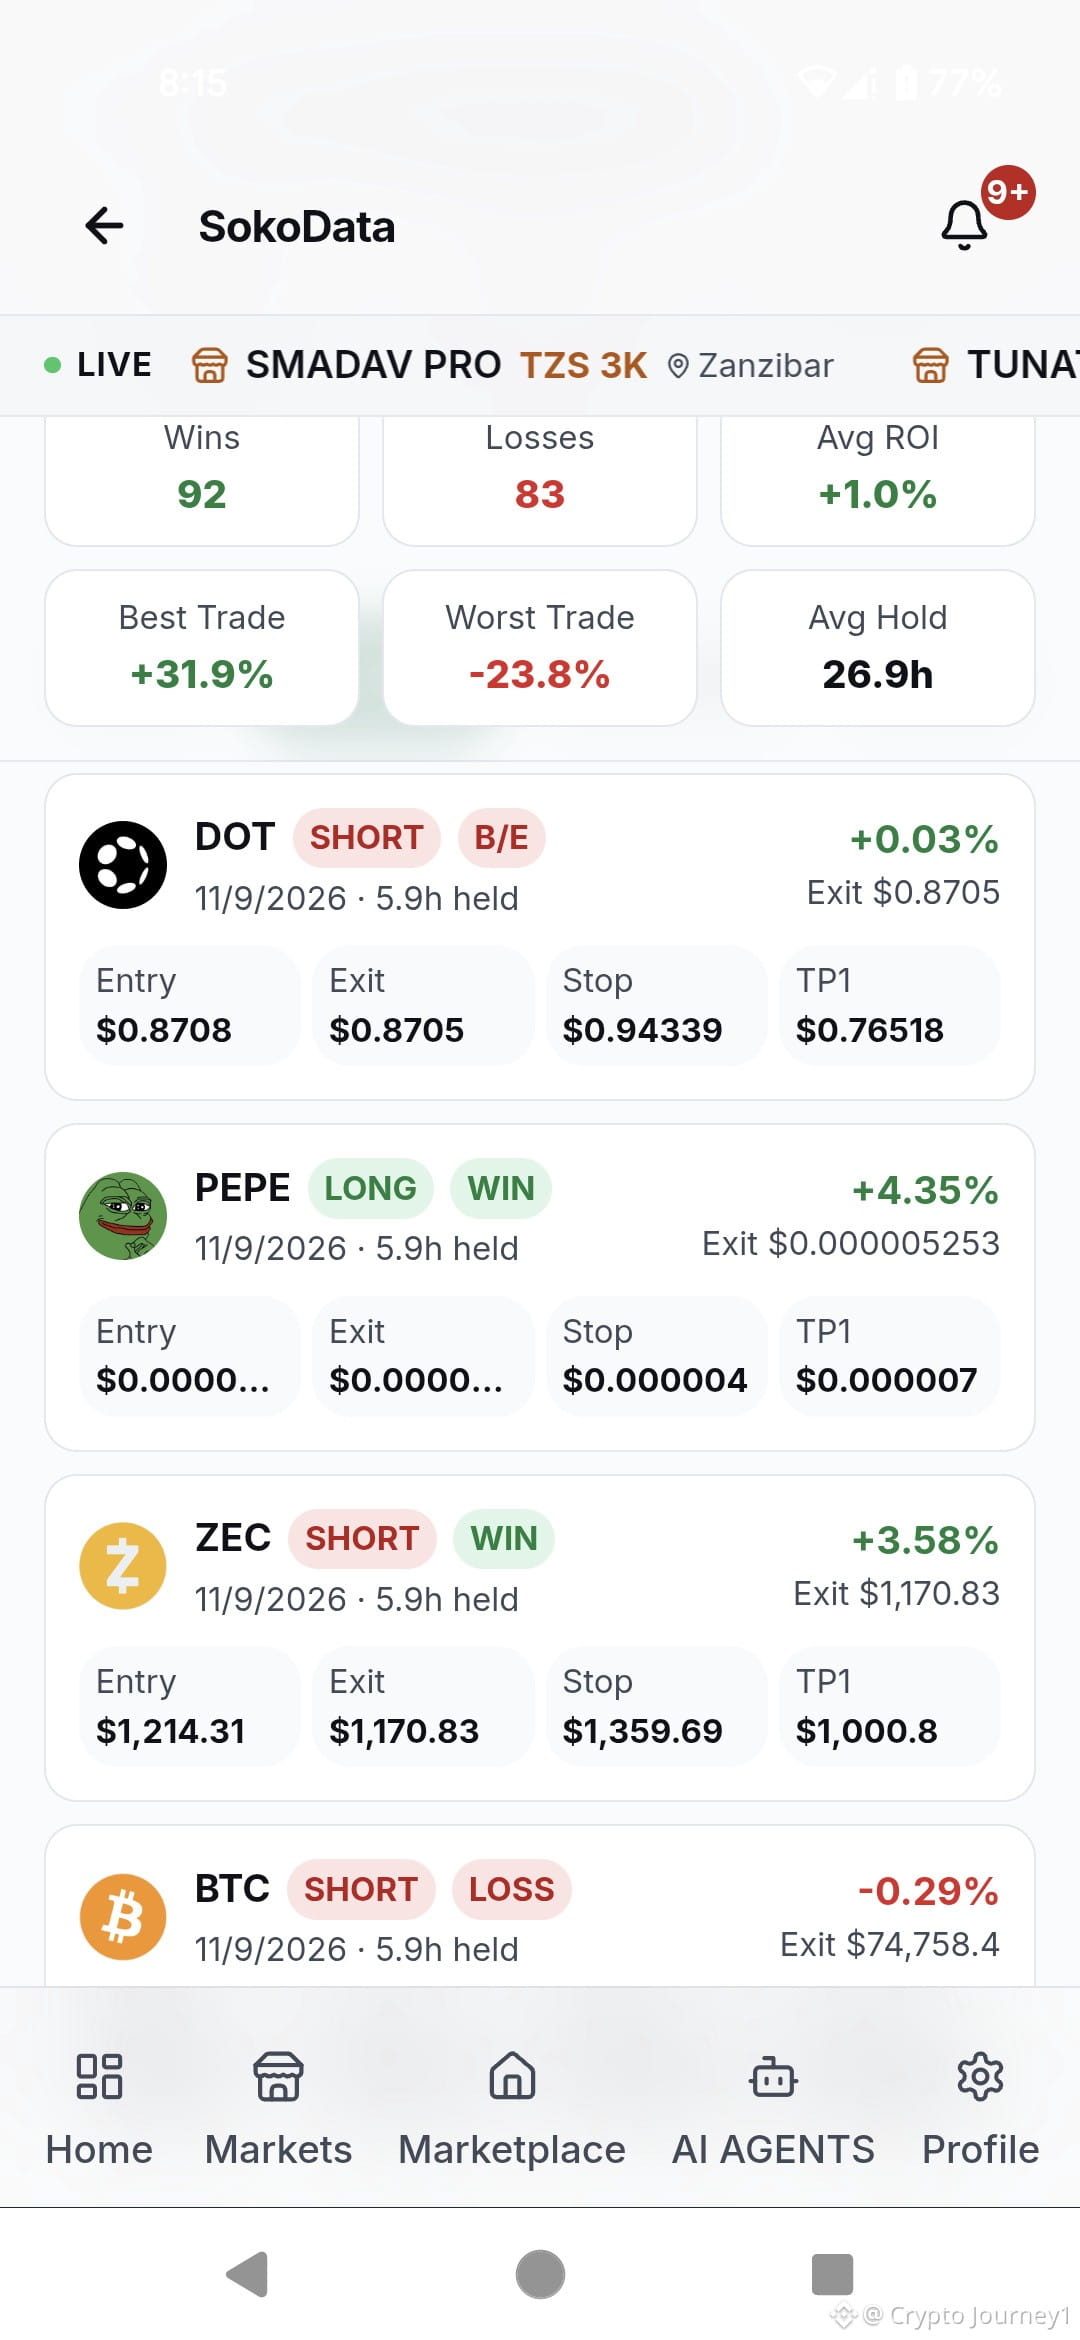
Let’s be real for a second. Trading isn't about winning 100% of the time; it’s about managing risk and letting the math play out over time. I’m pulling back the curtain to show you my actual recent stats on SokoData so you can see exactly how this works.
Here is the overall performance breakdown:
· Wins: 92
· Losses: 83
· Avg ROI: +1.0%
· Best Trade: +31.9%
· Worst Trade: -23.8%
· Avg Hold: 26.9h
This is what actual trading looks like. You take hits, but you manage them. Now, let's break down the recent batch of trades executed on 11/9/2026 (all held for 5.9 hours):
🟢 PEPE (LONG) - WIN:
· Result: +4.35%
· Entry: $0.0000...
· Exit: $0.000005253
· Stop: $0.000004
· TP1: $0.000007
🟢 ZEC (SHORT) - WIN:
· Result: +3.58%
· Entry: $1,214.31
· Exit: $1,170.83
· Stop: $1,359.69
· TP1: $1,000.8
⚪ DOT (SHORT) - BREAK EVEN:
· Result: +0.03%
· Entry: $0.8708
· Exit: $0.8705
· Stop: $0.94339
· TP1: $0.76518
🔴 BTC (SHORT) - LOSS:
· Result: -0.29%
· Exit: $74,758.4
💡 The Reality Check:
Notice the BTC trade? It was a loss, but it was only -0.29%. That is the power of a tight stop loss. The two wins on PEPE and ZEC completely covered that tiny loss and kept the equity curve moving up.
Stop chasing 100% win rates and start focusing on execution, risk management, and following your levels.
Are you managing your losses as strictly as your wins? 👇
NO HIDING THE LOSSES: A RAW LOOK INSIDE MY RECENT TRADE BATCH. 📊
$PEPE
$BTC
Let’s be real for a second. Trading isn't about winning 100% of the time; it’s about managing risk and letting the math play out over time. I’m pulling back the curtain to show you my actual recent stats on SokoData so you can see exactly how this works.
Here is the overall performance breakdown:
· Wins: 92
· Losses: 83
· Avg ROI: +1.0%
· Best Trade: +31.9%
· Worst Trade: -23.8%
· Avg Hold: 26.9h
This is what actual trading looks like. You take hits, but you manage them. Now, let's break down the recent batch of trades executed on 11/9/2026 (all held for 5.9 hours):
🟢 PEPE (LONG) - WIN:
· Result: +4.35%
· Entry: $0.0000...
· Exit: $0.000005253
· Stop: $0.000004
· TP1: $0.000007
🟢 ZEC (SHORT) - WIN:
· Result: +3.58%
· Entry: $1,214.31
· Exit: $1,170.83
· Stop: $1,359.69
· TP1: $1,000.8
⚪ DOT (SHORT) - BREAK EVEN:
· Result: +0.03%
· Entry: $0.8708
· Exit: $0.8705
· Stop: $0.94339
· TP1: $0.76518
🔴 BTC (SHORT) - LOSS:
· Result: -0.29%
· Exit: $74,758.4
💡 The Reality Check:
Notice the BTC trade? It was a loss, but it was only -0.29%. That is the power of a tight stop loss. The two wins on PEPE and ZEC completely covered that tiny loss and kept the equity curve moving up.
Stop chasing 100% win rates and start focusing on execution, risk management, and following your levels.
Are you managing your losses as strictly as your wins? 👇
$PEPE
$BTC
Let’s be real for a second. Trading isn't about winning 100% of the time; it’s about managing risk and letting the math play out over time. I’m pulling back the curtain to show you my actual recent stats on SokoData so you can see exactly how this works.
Here is the overall performance breakdown:
· Wins: 92
· Losses: 83
· Avg ROI: +1.0%
· Best Trade: +31.9%
· Worst Trade: -23.8%
· Avg Hold: 26.9h
This is what actual trading looks like. You take hits, but you manage them. Now, let's break down the recent batch of trades executed on 11/9/2026 (all held for 5.9 hours):
🟢 PEPE (LONG) - WIN:
· Result: +4.35%
· Entry: $0.0000...
· Exit: $0.000005253
· Stop: $0.000004
· TP1: $0.000007
🟢 ZEC (SHORT) - WIN:
· Result: +3.58%
· Entry: $1,214.31
· Exit: $1,170.83
· Stop: $1,359.69
· TP1: $1,000.8
⚪ DOT (SHORT) - BREAK EVEN:
· Result: +0.03%
· Entry: $0.8708
· Exit: $0.8705
· Stop: $0.94339
· TP1: $0.76518
🔴 BTC (SHORT) - LOSS:
· Result: -0.29%
· Exit: $74,758.4
💡 The Reality Check:
Notice the BTC trade? It was a loss, but it was only -0.29%. That is the power of a tight stop loss. The two wins on PEPE and ZEC completely covered that tiny loss and kept the equity curve moving up.
Stop chasing 100% win rates and start focusing on execution, risk management, and following your levels.
Are you managing your losses as strictly as your wins? 👇
1
788
CHAINLINK STUCK IN THE MUD: BEARISH STRUCTURE CONFIRMED! 📉
$LINK
{future}(LINKUSDT)
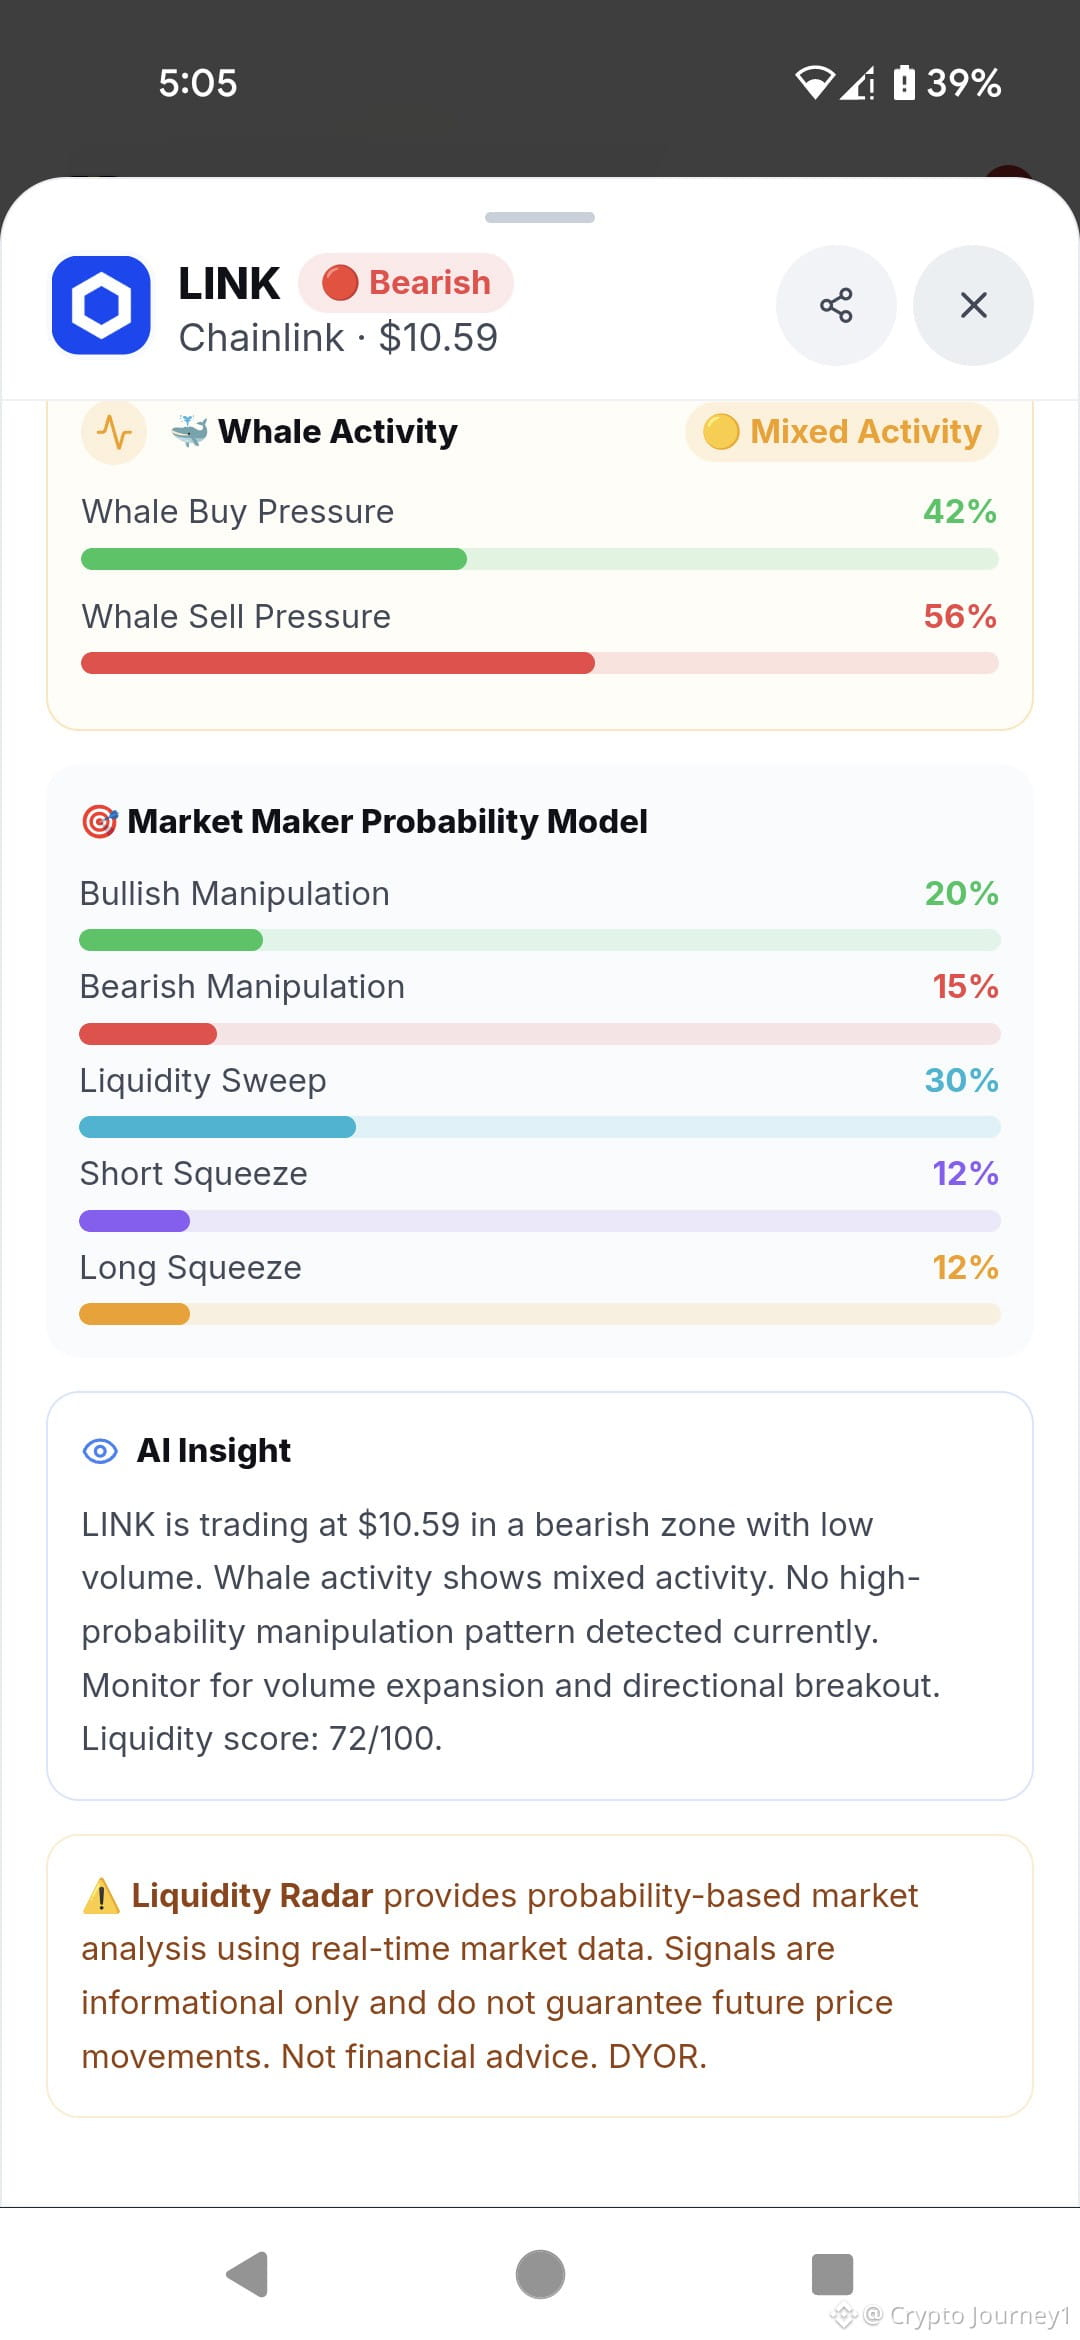
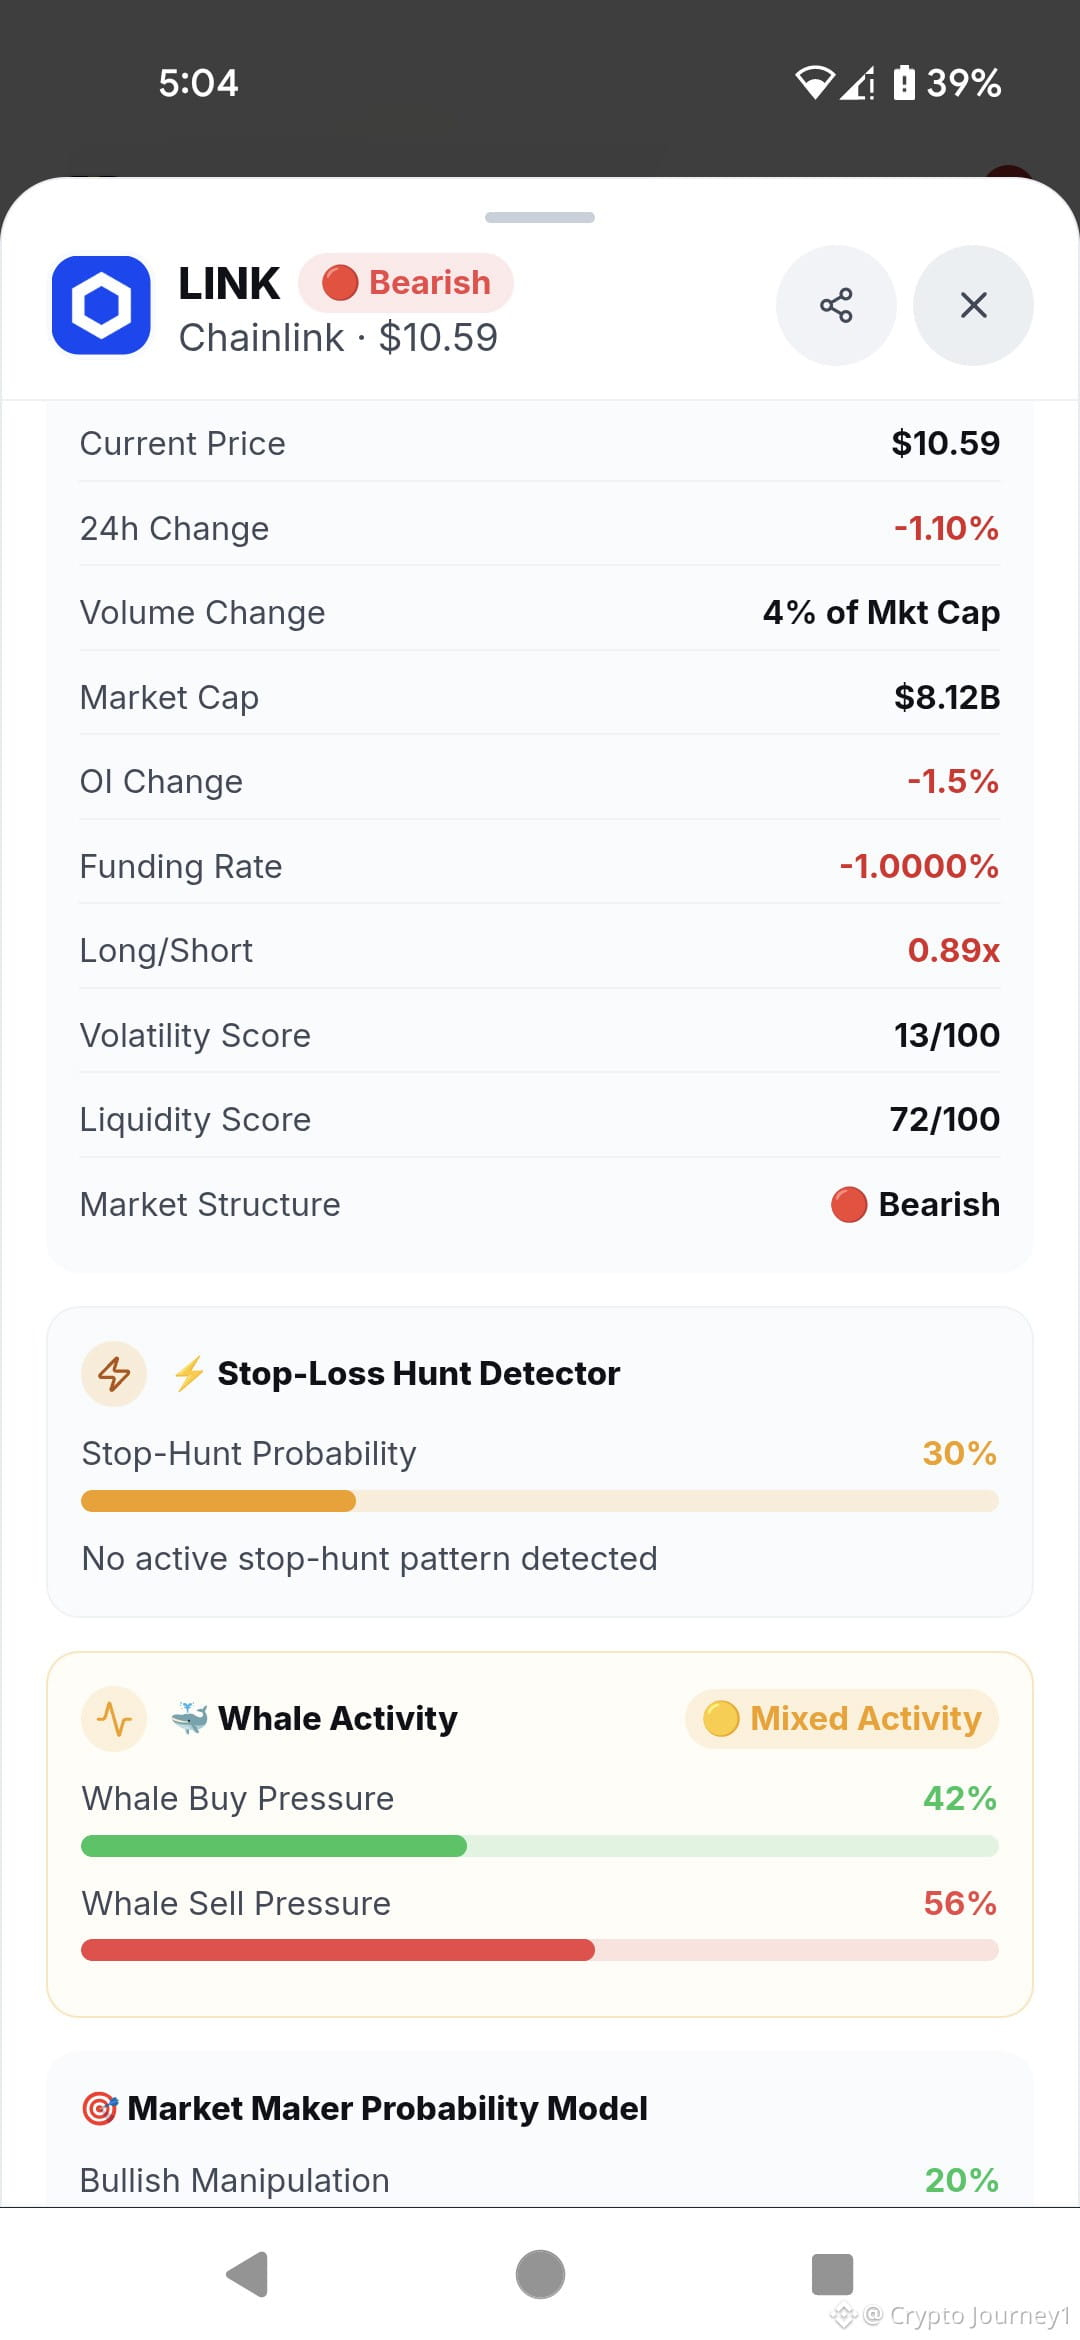
Do not try to force a long here. Chainlink is currently bleeding slowly, sitting at $10.59 after a -1.10% drop. The overall Market Structure has officially flipped to Bearish, and the market is practically asleep.
Let’s look at the exact data before you make a move:
📊 The Market Overview:
· Market Cap: $8.12B
· Volume Change: 4% of Mkt Cap (Very low activity).
· Open Interest (OI) Change: -1.5%
· Funding Rate: -1.0000% (Long/Short ratio is 0.89x).
· Volatility Score: 13/100 (Dead quiet).
· Liquidity Score: 72/100.
🐋 Whale Activity & Maker Models:
· Whale Activity: Mixed. Buy Pressure is at 42%, while Sell Pressure dominates at 56%.
· Market Maker Model: Liquidity Sweep (30%), Bullish Manipulation (20%), Bearish Manipulation (15%), Short Squeeze (12%), Long Squeeze (12%).
· Trap Alert: Stop-Loss Hunt is sitting at 30% with no active pattern detected.
🎯 My Trade Setup (SHORT Position):
Because the trend is bearish and whales are offloading, the safest play is shorting the minor bounces.
· Entry Zone: $10.60 - $10.75 (Wait for a slight push up).
· Take Profit 1 (TP1): $10.20
· Take Profit 2 (TP2): $9.80
· Stop Loss (SL): $11.10 (Above the recent lower high).
· Risk/Reward: Roughly 1:2.
💡 The Reality Check:
The dashboard summary confirms: "LINK is trading at $10.59 in a bearish zone with low volume. No high-probability manipulation pattern detected currently. Monitor for volume expansion and directional breakout."
With volatility this low and the trend pointing down, there is zero reason to buy. Wait for the market to show its hand, or short the dead bounces.
Are you shorting this LINK breakdown, or waiting on the sidelines? 👇
CHAINLINK STUCK IN THE MUD: BEARISH STRUCTURE CONFIRMED! 📉
$LINK
Do not try to force a long here. Chainlink is currently bleeding slowly, sitting at $10.59 after a -1.10% drop. The overall Market Structure has officially flipped to Bearish, and the market is practically asleep.
Let’s look at the exact data before you make a move:
📊 The Market Overview:
· Market Cap: $8.12B
· Volume Change: 4% of Mkt Cap (Very low activity).
· Open Interest (OI) Change: -1.5%
· Funding Rate: -1.0000% (Long/Short ratio is 0.89x).
· Volatility Score: 13/100 (Dead quiet).
· Liquidity Score: 72/100.
🐋 Whale Activity & Maker Models:
· Whale Activity: Mixed. Buy Pressure is at 42%, while Sell Pressure dominates at 56%.
· Market Maker Model: Liquidity Sweep (30%), Bullish Manipulation (20%), Bearish Manipulation (15%), Short Squeeze (12%), Long Squeeze (12%).
· Trap Alert: Stop-Loss Hunt is sitting at 30% with no active pattern detected.
🎯 My Trade Setup (SHORT Position):
Because the trend is bearish and whales are offloading, the safest play is shorting the minor bounces.
· Entry Zone: $10.60 - $10.75 (Wait for a slight push up).
· Take Profit 1 (TP1): $10.20
· Take Profit 2 (TP2): $9.80
· Stop Loss (SL): $11.10 (Above the recent lower high).
· Risk/Reward: Roughly 1:2.
💡 The Reality Check:
The dashboard summary confirms: "LINK is trading at $10.59 in a bearish zone with low volume. No high-probability manipulation pattern detected currently. Monitor for volume expansion and directional breakout."
With volatility this low and the trend pointing down, there is zero reason to buy. Wait for the market to show its hand, or short the dead bounces.
Are you shorting this LINK breakdown, or waiting on the sidelines? 👇
$LINK
Do not try to force a long here. Chainlink is currently bleeding slowly, sitting at $10.59 after a -1.10% drop. The overall Market Structure has officially flipped to Bearish, and the market is practically asleep.
Let’s look at the exact data before you make a move:
📊 The Market Overview:
· Market Cap: $8.12B
· Volume Change: 4% of Mkt Cap (Very low activity).
· Open Interest (OI) Change: -1.5%
· Funding Rate: -1.0000% (Long/Short ratio is 0.89x).
· Volatility Score: 13/100 (Dead quiet).
· Liquidity Score: 72/100.
🐋 Whale Activity & Maker Models:
· Whale Activity: Mixed. Buy Pressure is at 42%, while Sell Pressure dominates at 56%.
· Market Maker Model: Liquidity Sweep (30%), Bullish Manipulation (20%), Bearish Manipulation (15%), Short Squeeze (12%), Long Squeeze (12%).
· Trap Alert: Stop-Loss Hunt is sitting at 30% with no active pattern detected.
🎯 My Trade Setup (SHORT Position):
Because the trend is bearish and whales are offloading, the safest play is shorting the minor bounces.
· Entry Zone: $10.60 - $10.75 (Wait for a slight push up).
· Take Profit 1 (TP1): $10.20
· Take Profit 2 (TP2): $9.80
· Stop Loss (SL): $11.10 (Above the recent lower high).
· Risk/Reward: Roughly 1:2.
💡 The Reality Check:
The dashboard summary confirms: "LINK is trading at $10.59 in a bearish zone with low volume. No high-probability manipulation pattern detected currently. Monitor for volume expansion and directional breakout."
With volatility this low and the trend pointing down, there is zero reason to buy. Wait for the market to show its hand, or short the dead bounces.
Are you shorting this LINK breakdown, or waiting on the sidelines? 👇
1
916
I FINALLY PAID FOR PREMIUM! HERE IS WHAT IS INSIDE AND WHY IT WILL SAVE YOUR CRYPTO PORTFOLIO. 🔥
$ARB
{future}(ARBUSDT)
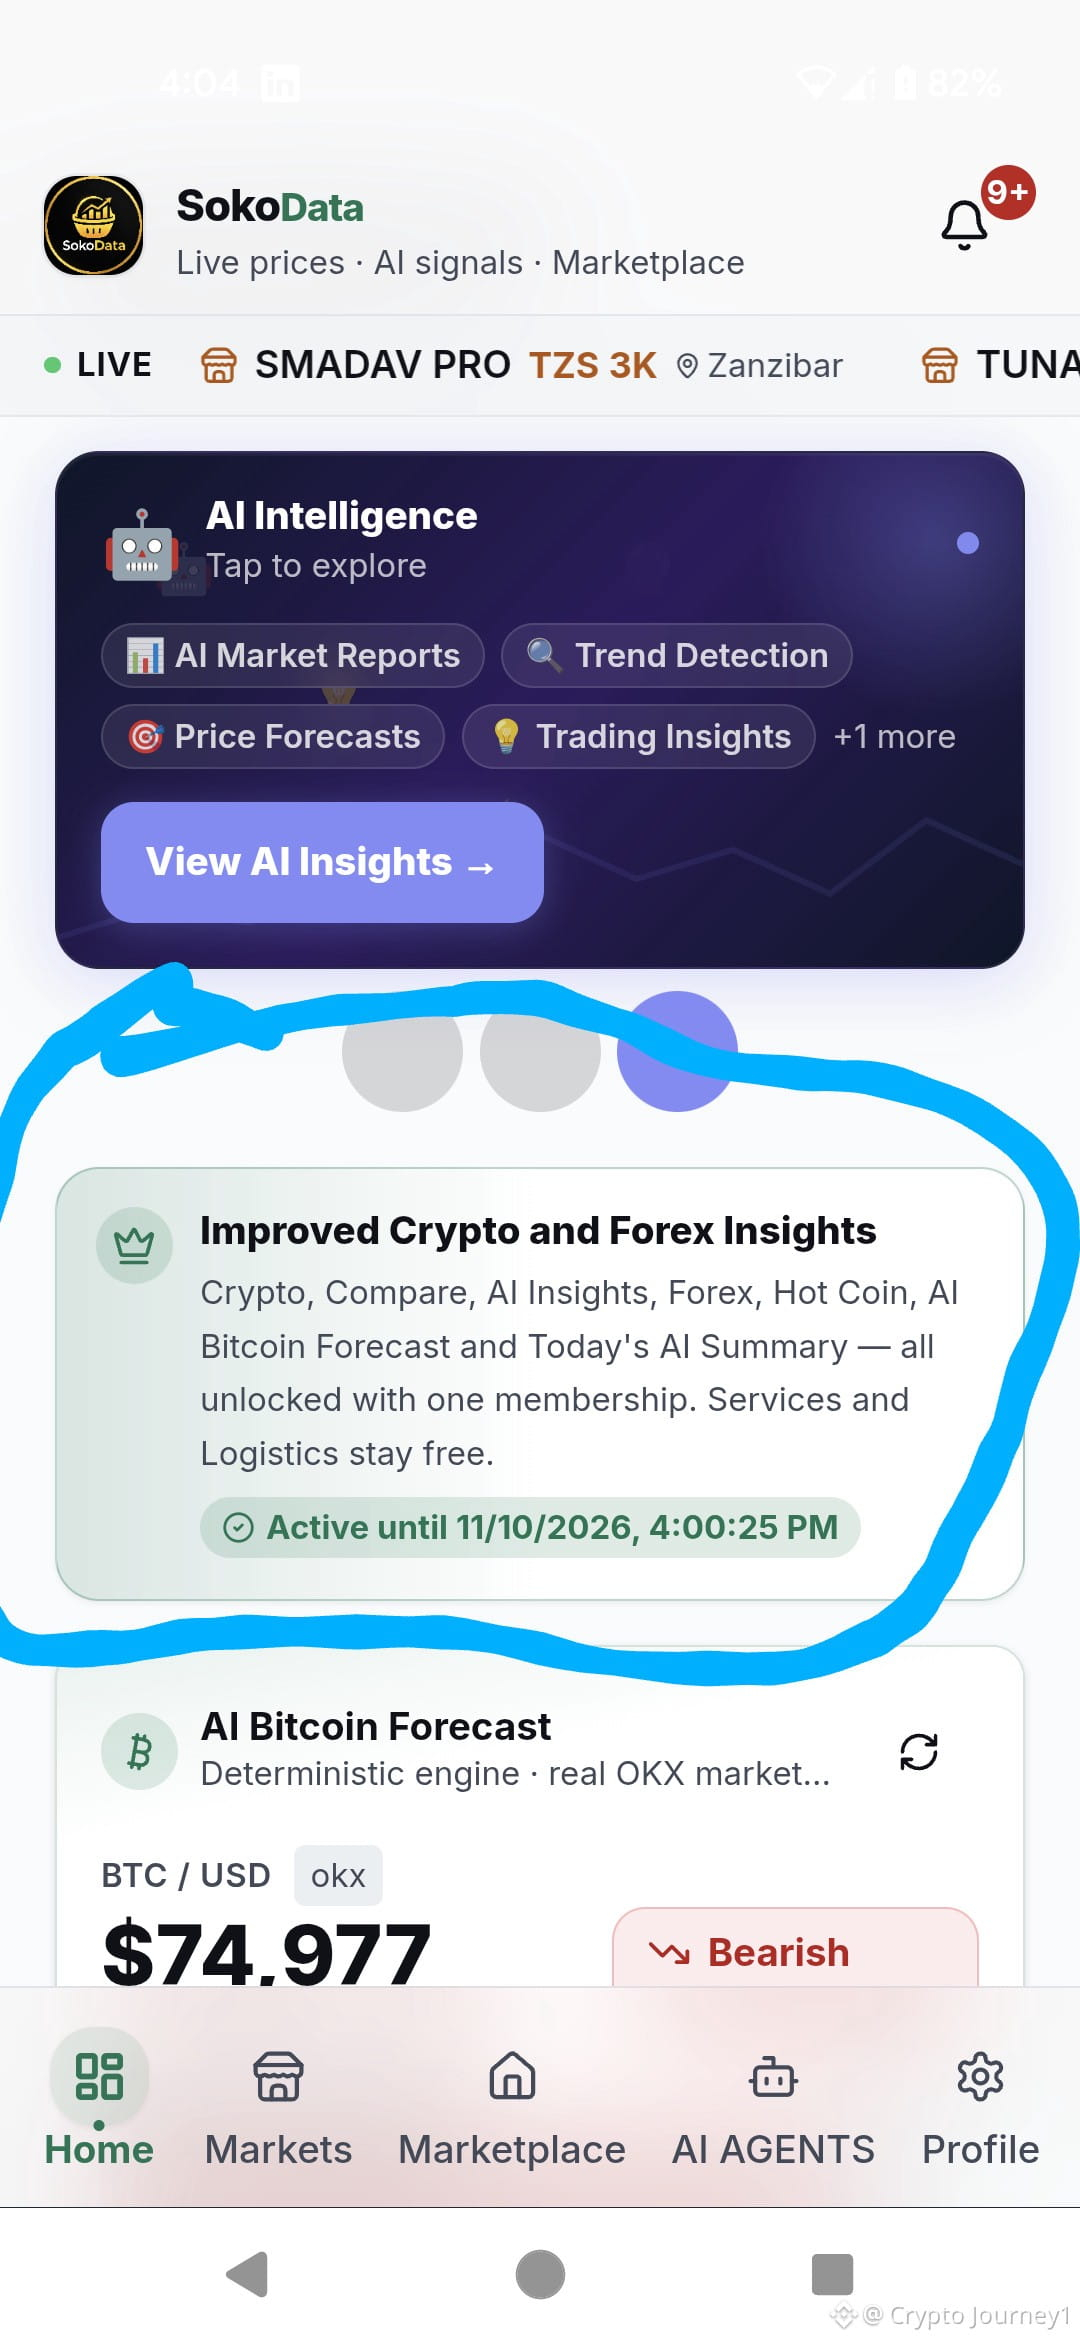
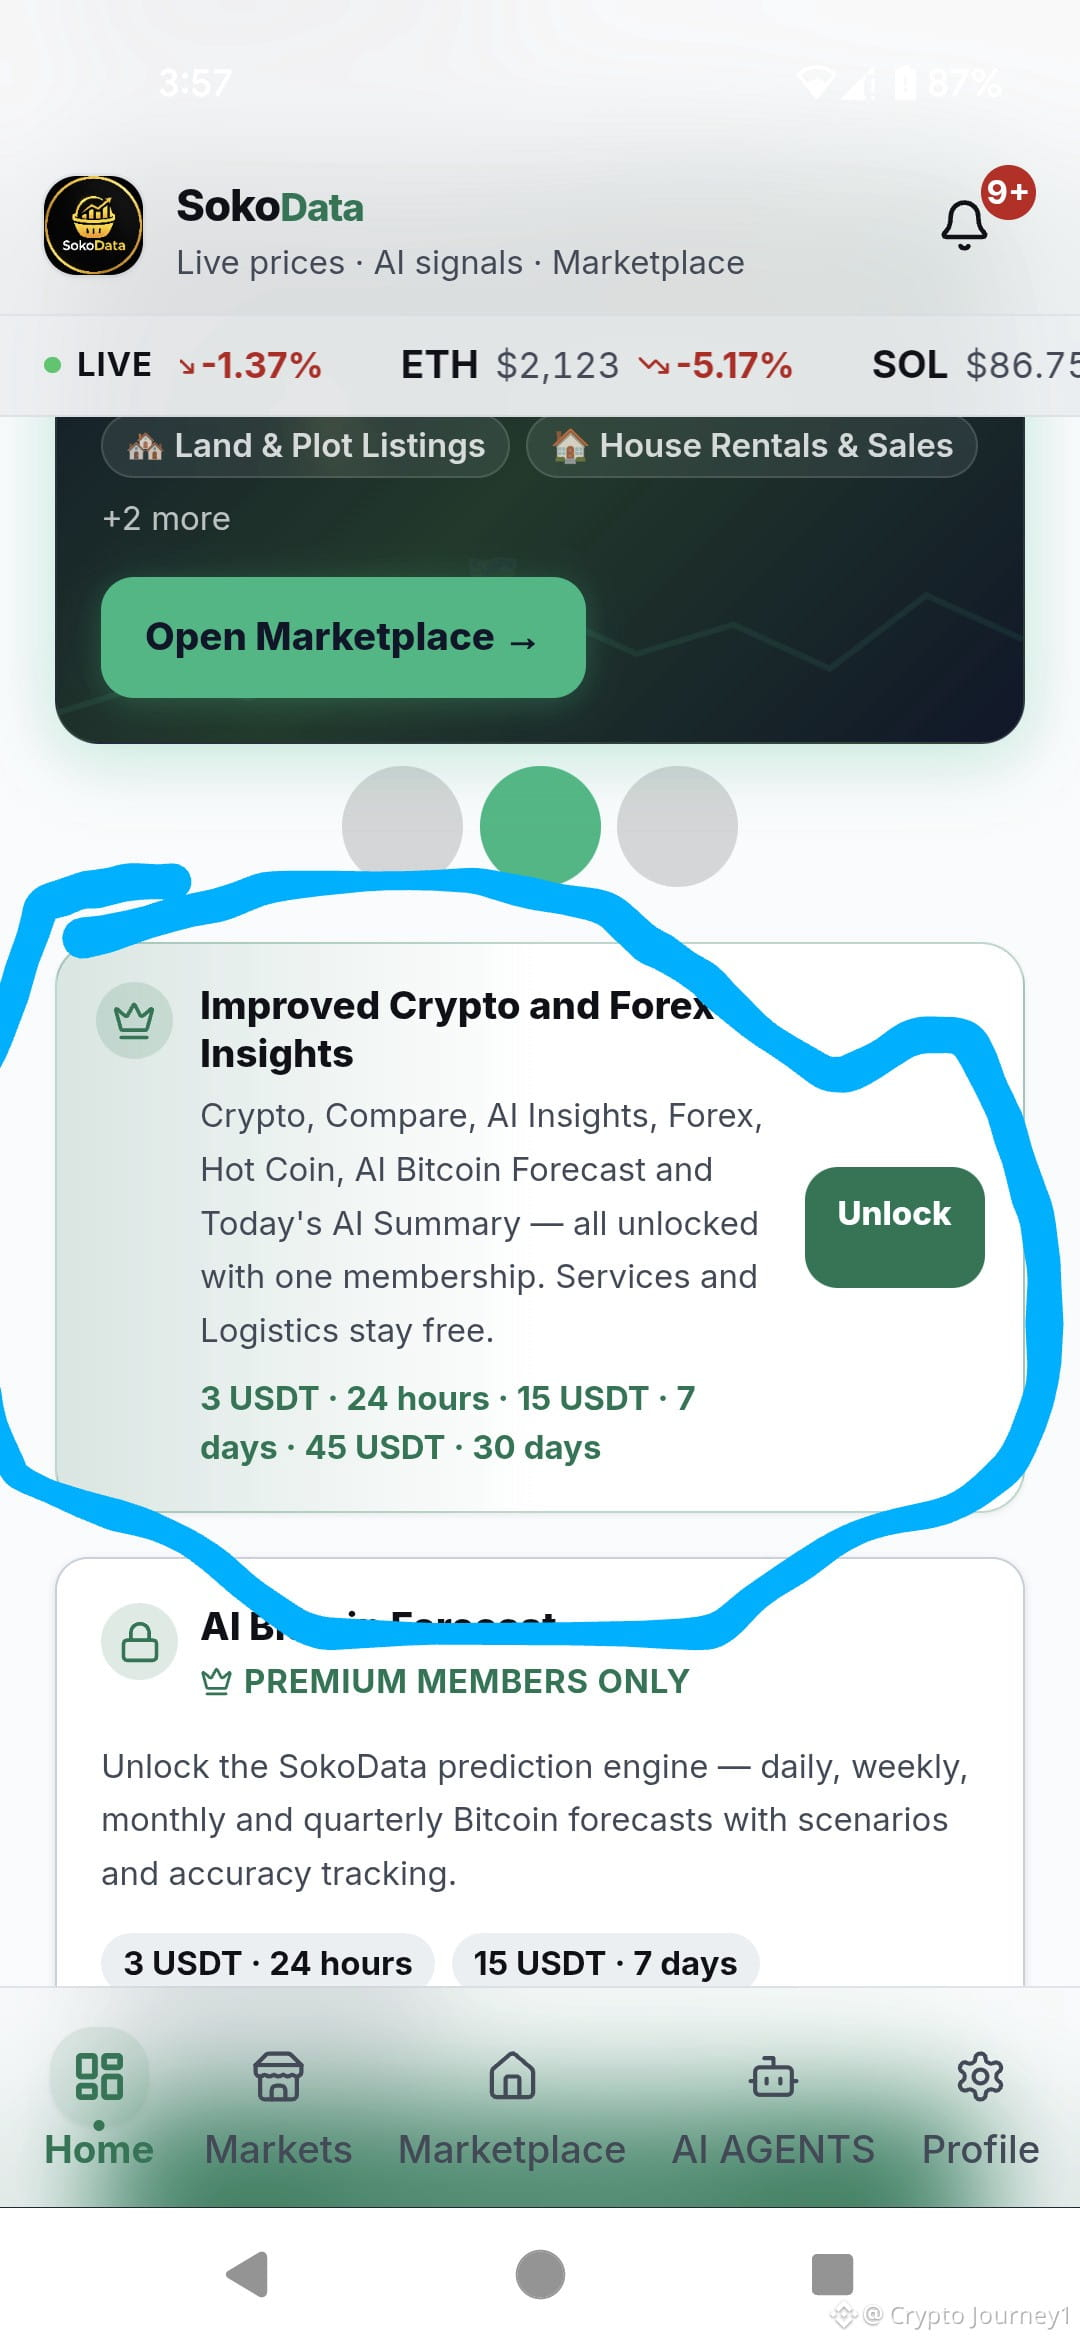
Listen up, traders. I just pulled the trigger and invested in the Improved Crypto and Forex Insights membership. Look at my screenshot—it is officially active until 11/10/2026.
Many people see the price tag (3 USDT for 24 hours, 15 USDT for 7 days, or 45 USDT for 30 days) and hesitate. But let me show you exactly what unlocks the moment you pay:
1. Bitcoin Forecast Engine: You get daily, weekly, monthly, and quarterly Bitcoin predictions. Right now, it is flashing a Bearish outlook at $74,977. This alone tells you to be careful with your longs.
2. Trend Detection & Price Forecasts: Deep analysis of market momentum and future price targets.
3. Hot Coins & Market Reports: You get instant access to the coins pumping right now, backed by daily data.
4. Today's Summary: A quick, comprehensive breakdown of everything happening in the market.
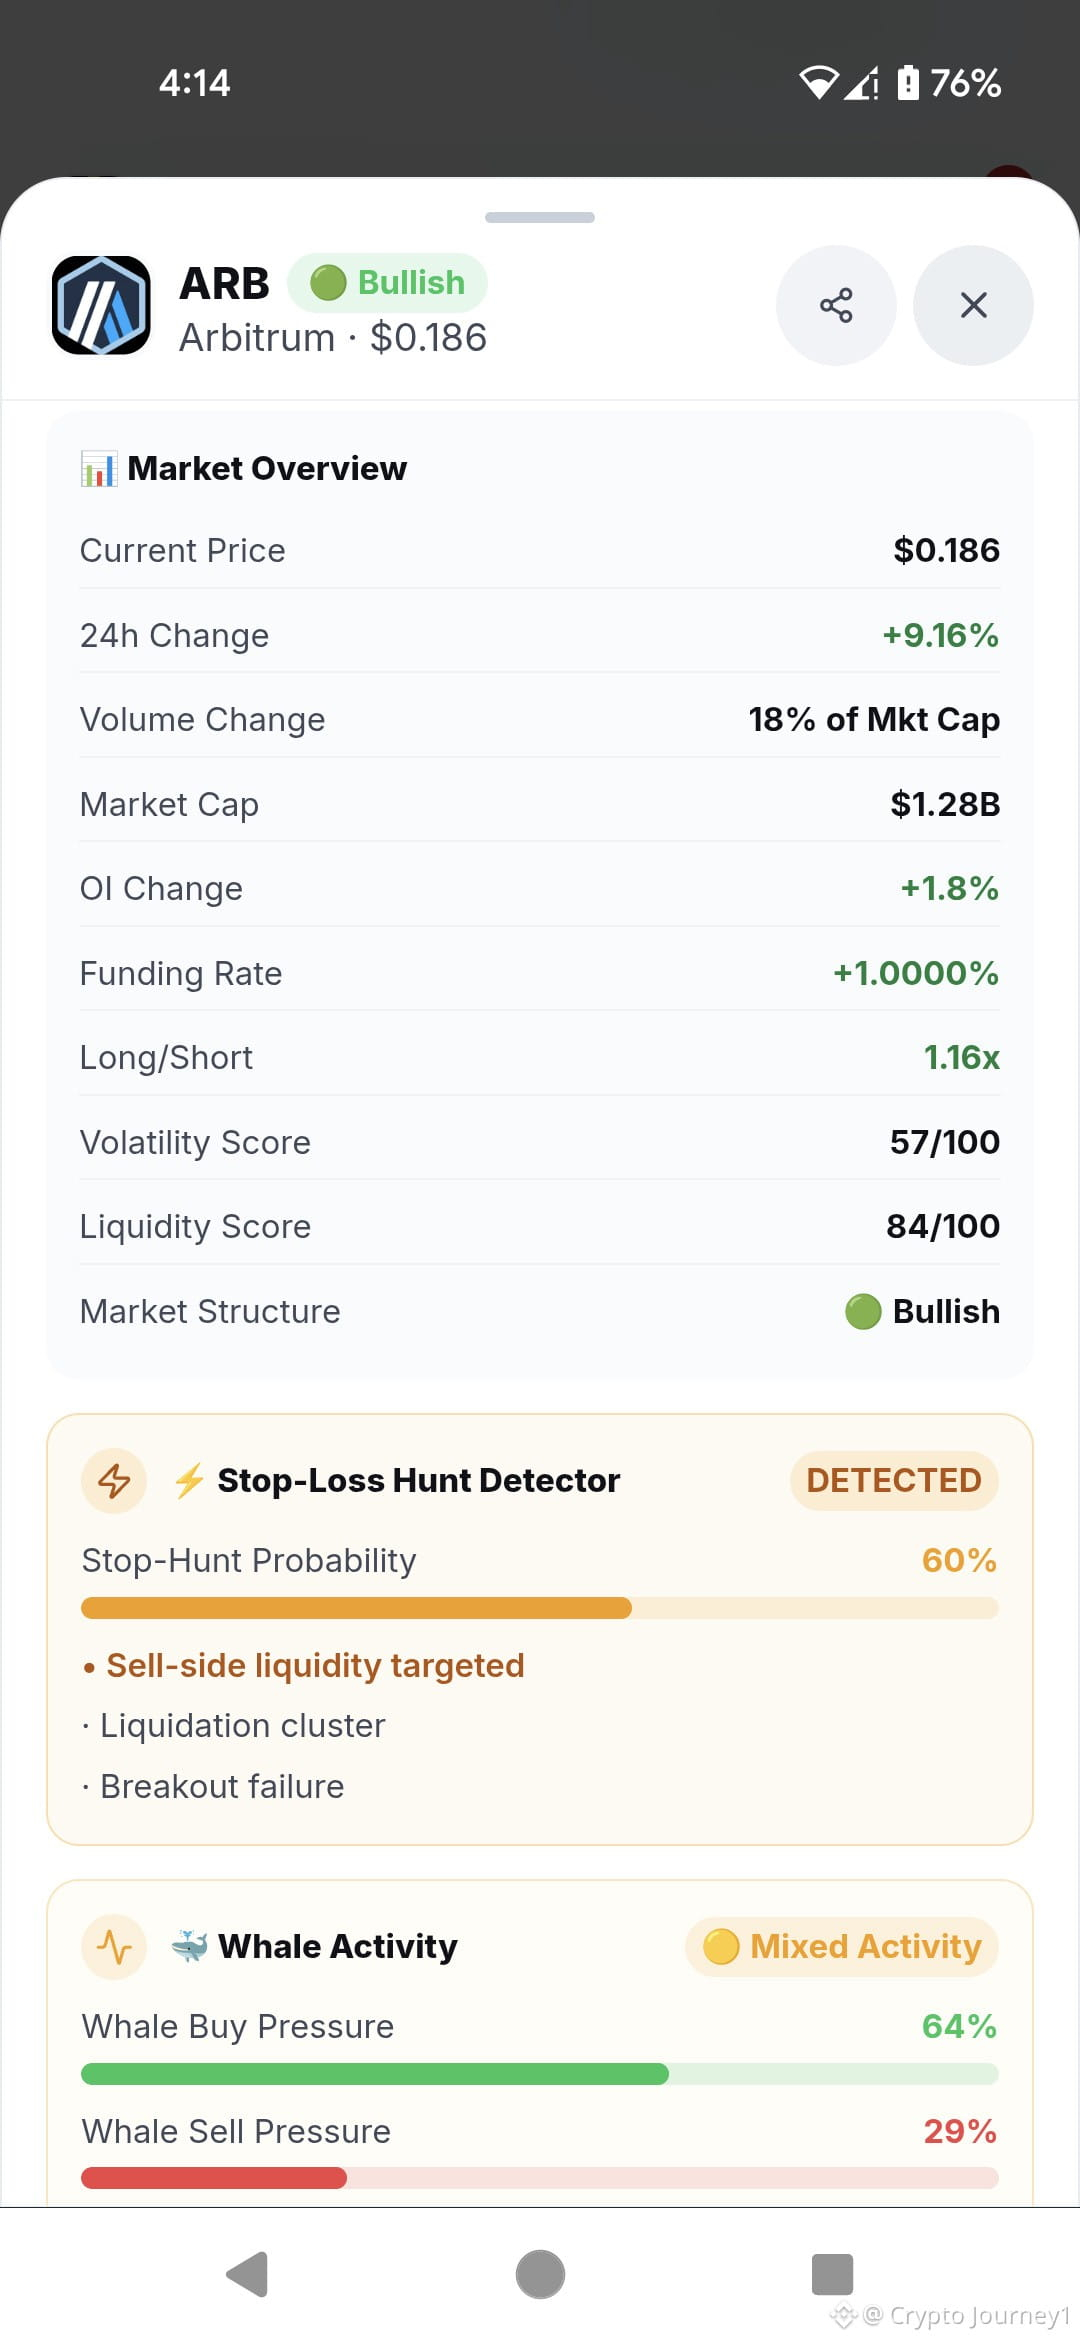
I decided to test these unlocked insights on ARB (Arbitrum) today, and the data is incredible. Here is the exact breakdown of what the dashboard is showing:
📊 Market Stats:
· Price: $0.186 (+9.16%)
· **Market Cap:** $1.28B
· Volume Change: 18% of Mkt Cap
· OI Change: +1.8%
· Funding Rate: +1.0000% (Long/Short: 1.16x)
· Volatility: 57/100 | Liquidity: 84/100
· Structure: Bullish
🐋 Whales & Probability Models:
· Whale Activity: Mixed (Buy Pressure 64% vs Sell Pressure 29%).
· Manipulation: Liquidity Sweep (52%), Bullish Manipulation (51%), Short Squeeze (25%), Bearish Manipulation (6%), Long Squeeze (0%).
· Trap Alert: Stop-Loss Hunt DETECTED (60%). It warns that sell-side liquidity is targeted, pointing to a liquidation cluster and breakout failure.
🎯 My Trade Setup (LONG Position):
Because the overall structure is bullish and whales are buying heavily, I am looking to long the dip.
· Entry Zone: $0.175 - $0.185
· Take Profit 1 (TP1): $0.210
· **Take Profit 2 (TP2):** $0.230
· Stop Loss (SL): $0.165 (Below the recent swing low to survive the hunt).
I FINALLY PAID FOR PREMIUM! HERE IS WHAT IS INSIDE AND WHY IT WILL SAVE YOUR CRYPTO PORTFOLIO. 🔥
$ARB
Listen up, traders. I just pulled the trigger and invested in the Improved Crypto and Forex Insights membership. Look at my screenshot—it is officially active until 11/10/2026.
Many people see the price tag (3 USDT for 24 hours, 15 USDT for 7 days, or 45 USDT for 30 days) and hesitate. But let me show you exactly what unlocks the moment you pay:
1. Bitcoin Forecast Engine: You get daily, weekly, monthly, and quarterly Bitcoin predictions. Right now, it is flashing a Bearish outlook at $74,977. This alone tells you to be careful with your longs.
2. Trend Detection & Price Forecasts: Deep analysis of market momentum and future price targets.
3. Hot Coins & Market Reports: You get instant access to the coins pumping right now, backed by daily data.
4. Today's Summary: A quick, comprehensive breakdown of everything happening in the market.
I decided to test these unlocked insights on ARB (Arbitrum) today, and the data is incredible. Here is the exact breakdown of what the dashboard is showing:
📊 Market Stats:
· Price: $0.186 (+9.16%)
· **Market Cap:** $1.28B
· Volume Change: 18% of Mkt Cap
· OI Change: +1.8%
· Funding Rate: +1.0000% (Long/Short: 1.16x)
· Volatility: 57/100 | Liquidity: 84/100
· Structure: Bullish
🐋 Whales & Probability Models:
· Whale Activity: Mixed (Buy Pressure 64% vs Sell Pressure 29%).
· Manipulation: Liquidity Sweep (52%), Bullish Manipulation (51%), Short Squeeze (25%), Bearish Manipulation (6%), Long Squeeze (0%).
· Trap Alert: Stop-Loss Hunt DETECTED (60%). It warns that sell-side liquidity is targeted, pointing to a liquidation cluster and breakout failure.
🎯 My Trade Setup (LONG Position):
Because the overall structure is bullish and whales are buying heavily, I am looking to long the dip.
· Entry Zone: $0.175 - $0.185
· Take Profit 1 (TP1): $0.210
· **Take Profit 2 (TP2):** $0.230
· Stop Loss (SL): $0.165 (Below the recent swing low to survive the hunt).
$ARB
Listen up, traders. I just pulled the trigger and invested in the Improved Crypto and Forex Insights membership. Look at my screenshot—it is officially active until 11/10/2026.
Many people see the price tag (3 USDT for 24 hours, 15 USDT for 7 days, or 45 USDT for 30 days) and hesitate. But let me show you exactly what unlocks the moment you pay:
1. Bitcoin Forecast Engine: You get daily, weekly, monthly, and quarterly Bitcoin predictions. Right now, it is flashing a Bearish outlook at $74,977. This alone tells you to be careful with your longs.
2. Trend Detection & Price Forecasts: Deep analysis of market momentum and future price targets.
3. Hot Coins & Market Reports: You get instant access to the coins pumping right now, backed by daily data.
4. Today's Summary: A quick, comprehensive breakdown of everything happening in the market.
I decided to test these unlocked insights on ARB (Arbitrum) today, and the data is incredible. Here is the exact breakdown of what the dashboard is showing:
📊 Market Stats:
· Price: $0.186 (+9.16%)
· **Market Cap:** $1.28B
· Volume Change: 18% of Mkt Cap
· OI Change: +1.8%
· Funding Rate: +1.0000% (Long/Short: 1.16x)
· Volatility: 57/100 | Liquidity: 84/100
· Structure: Bullish
🐋 Whales & Probability Models:
· Whale Activity: Mixed (Buy Pressure 64% vs Sell Pressure 29%).
· Manipulation: Liquidity Sweep (52%), Bullish Manipulation (51%), Short Squeeze (25%), Bearish Manipulation (6%), Long Squeeze (0%).
· Trap Alert: Stop-Loss Hunt DETECTED (60%). It warns that sell-side liquidity is targeted, pointing to a liquidation cluster and breakout failure.
🎯 My Trade Setup (LONG Position):
Because the overall structure is bullish and whales are buying heavily, I am looking to long the dip.
· Entry Zone: $0.175 - $0.185
· Take Profit 1 (TP1): $0.210
· **Take Profit 2 (TP2):** $0.230
· Stop Loss (SL): $0.165 (Below the recent swing low to survive the hunt).
2
1.5k
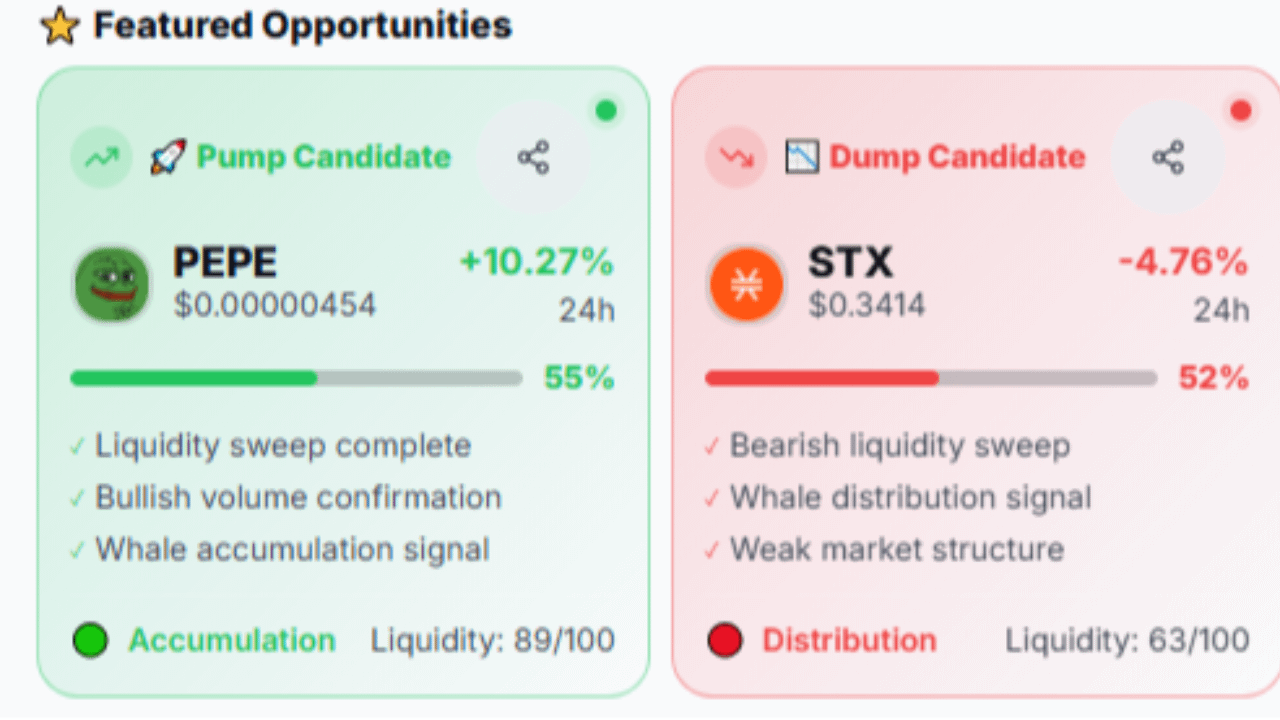
🎙️ PEPE IS PUMPING +10%! Are You Buying or Fading the Pump? 🐸🚀
End
54 m 01 s
232
0
0
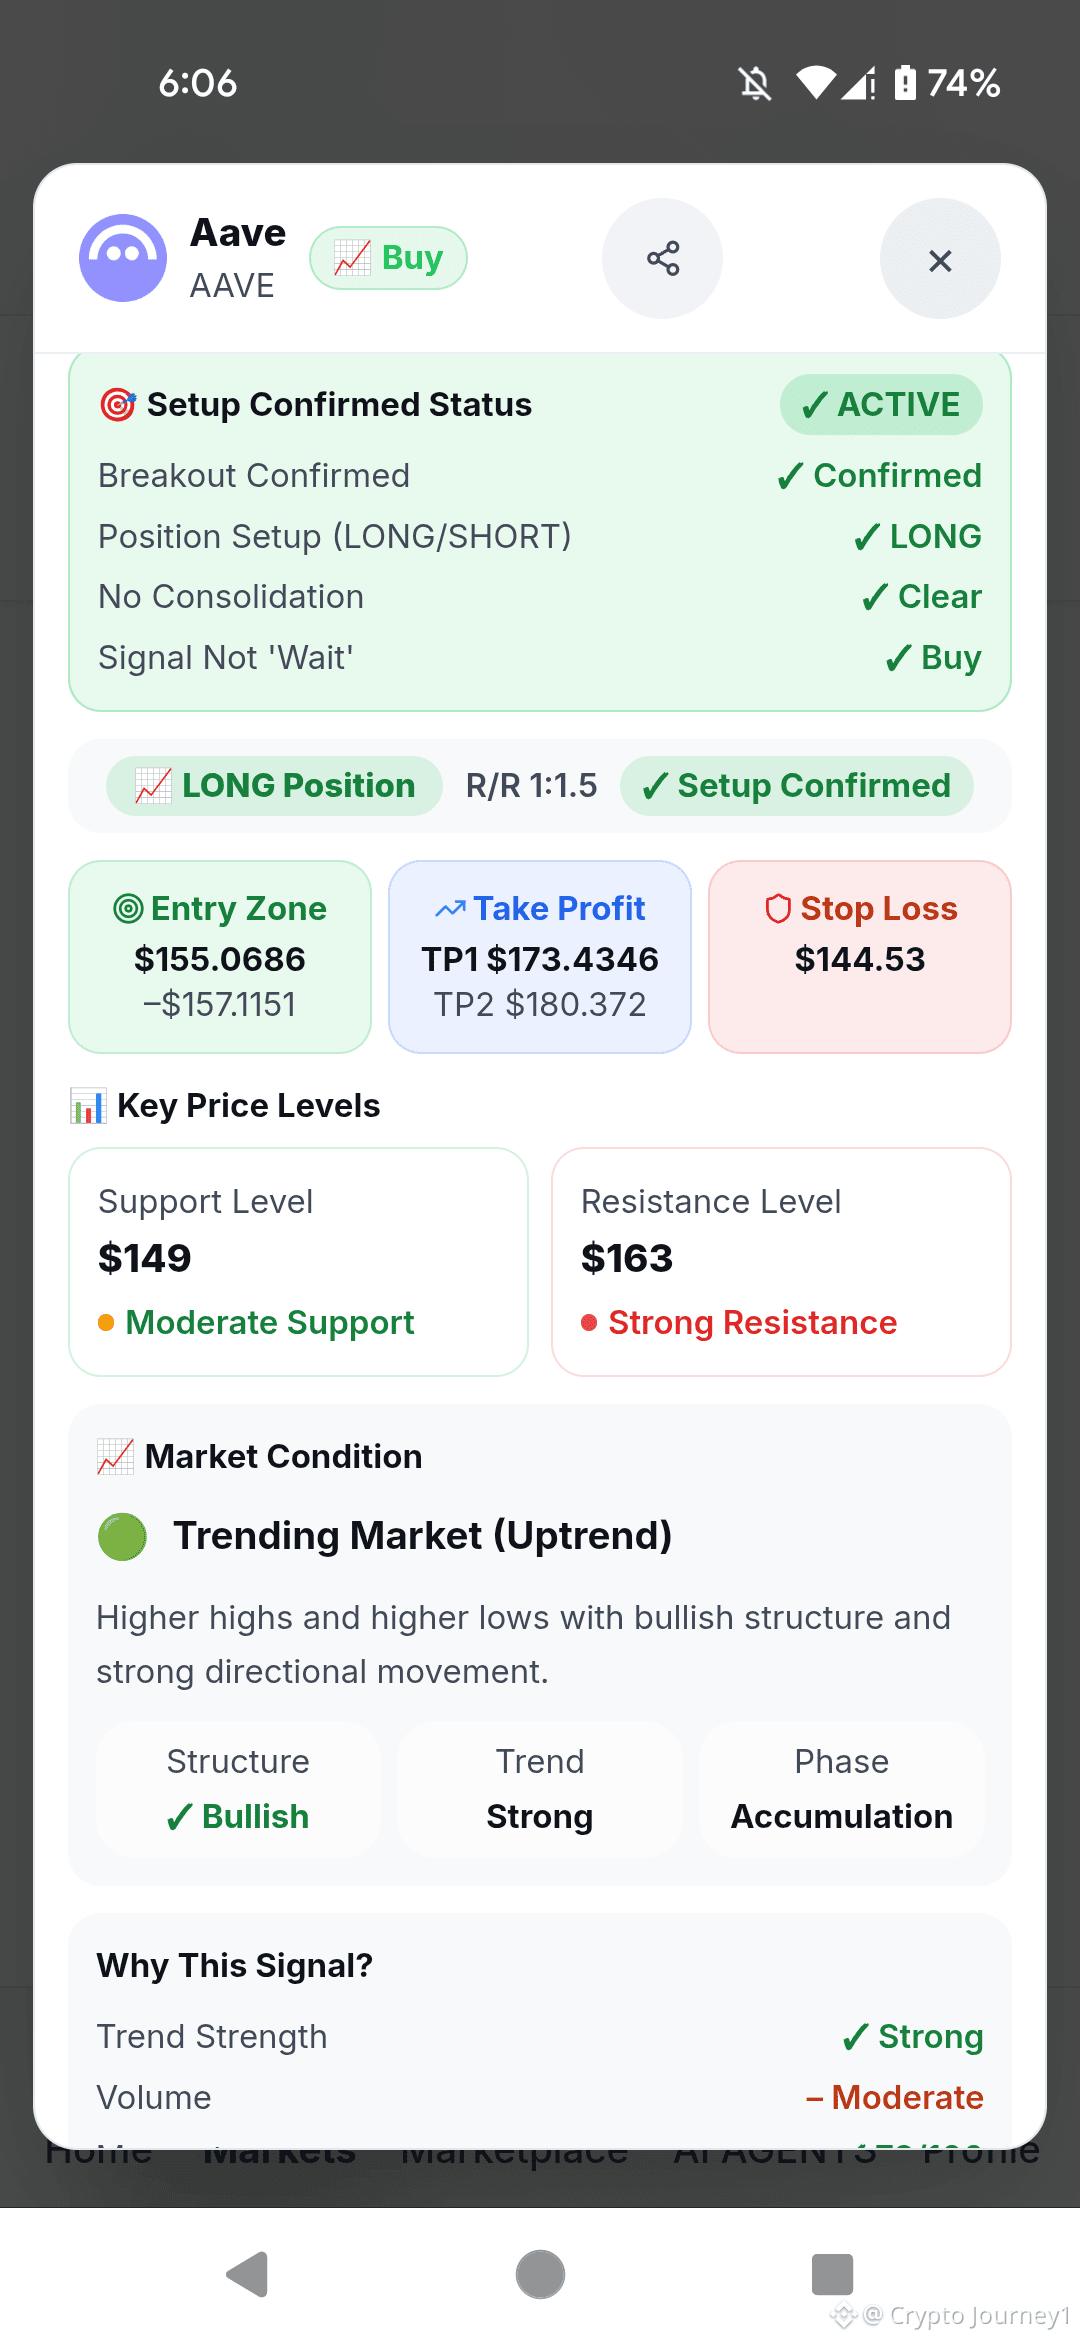
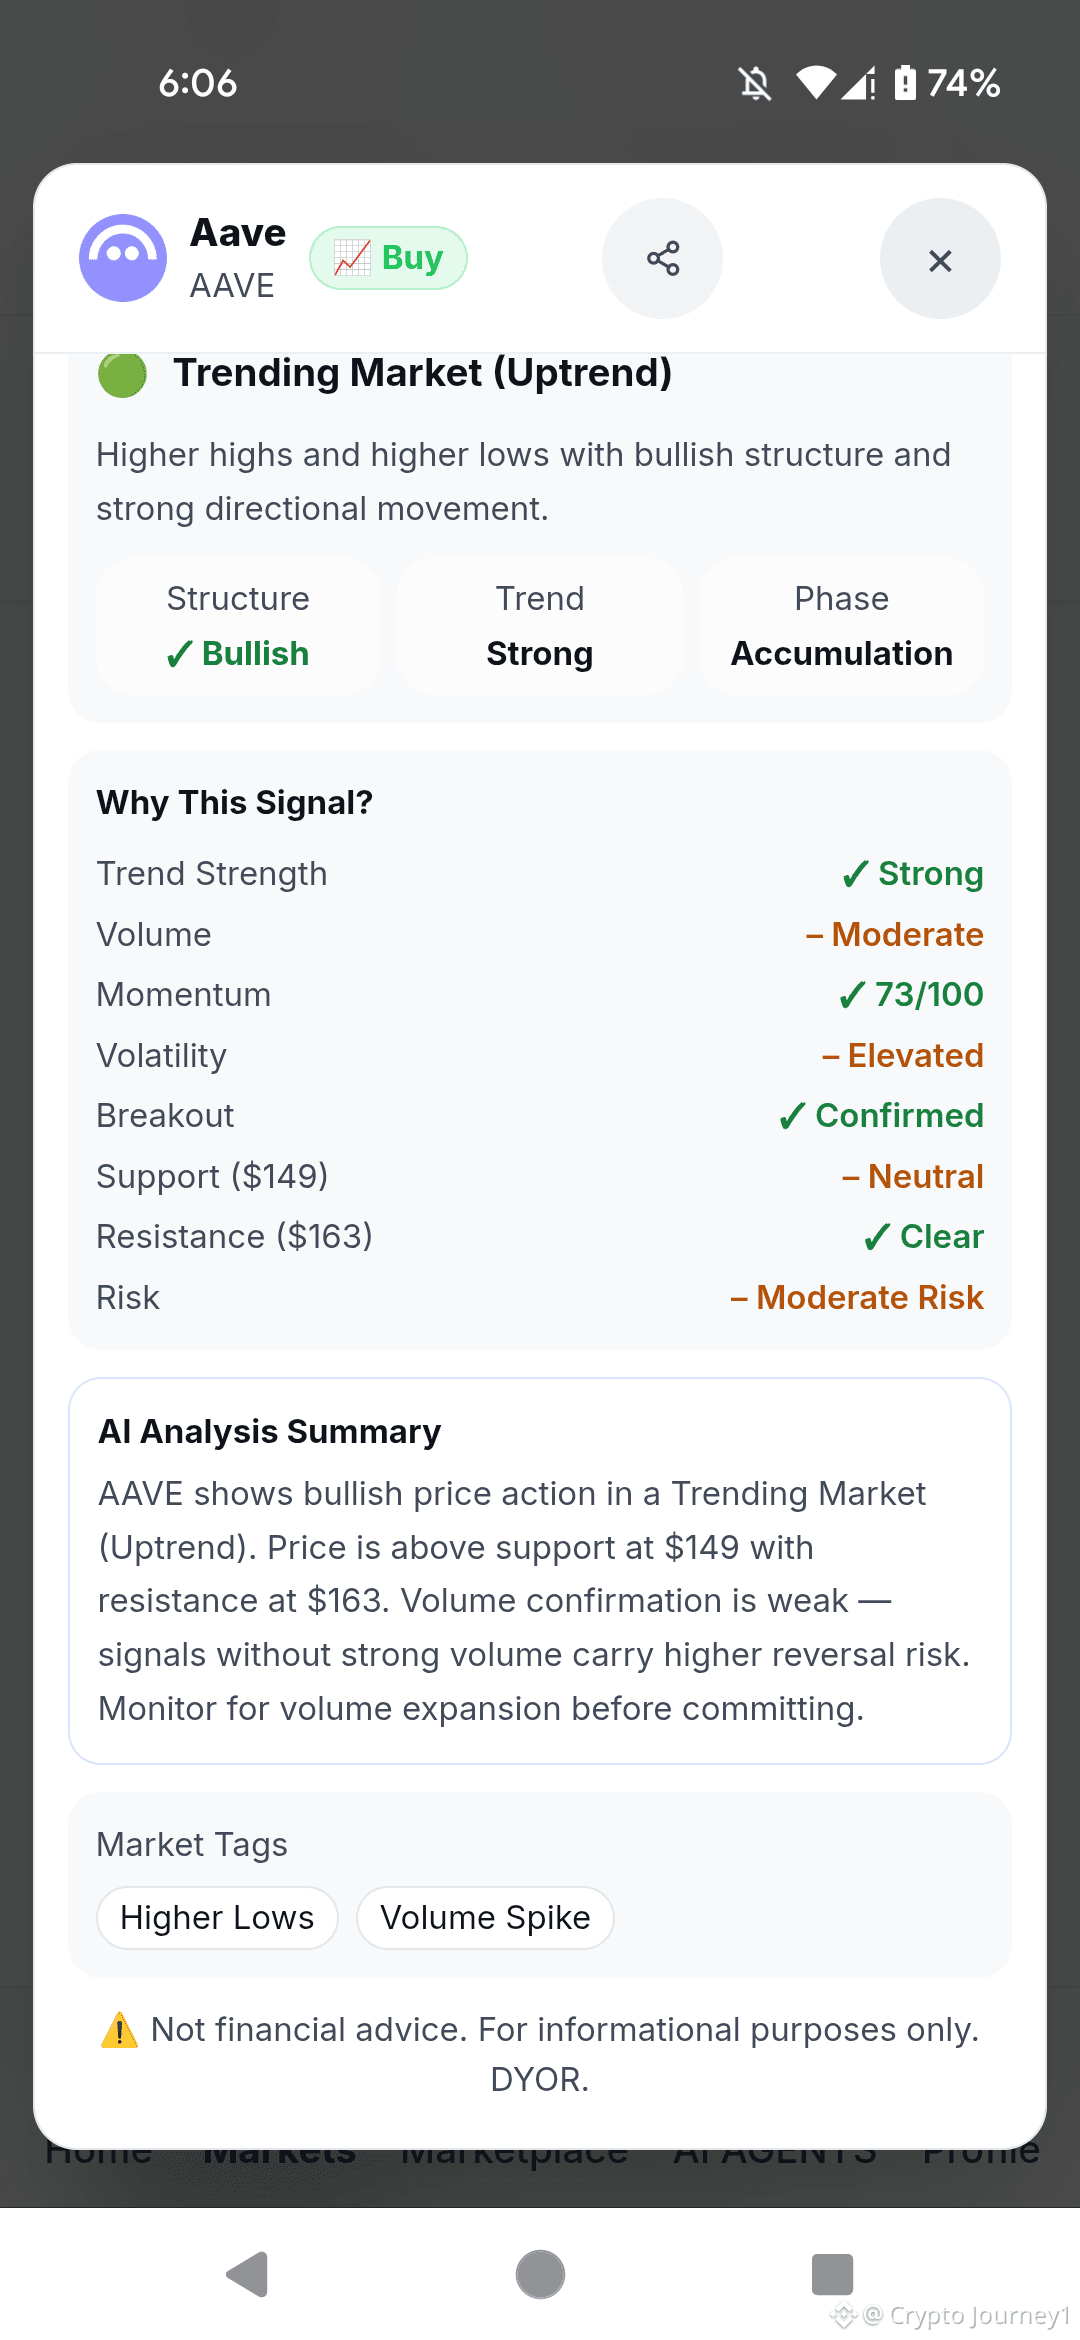
$AAVE BIG LONG : AAVE has officially flipped to an active long setup after our previous short call at $175 played out perfectly. The structure is now bullish, but the AI warns that weak volume carries a high reversal risk, so watch for volume expansion.
Trading Ideas Long $AAVE
{future}(AAVEUSDT)
Entry: 155.06 - 157.11
SL: 144.53
TP1: 173.43
TP2: 180.37
TP3: 195.00
trade $AAVE here :👇
$AAVE BIG LONG : AAVE has officially flipped to an active long setup after our previous short call at $175 played out perfectly. The structure is now bullish, but the AI warns that weak volume carries a high reversal risk, so watch for volume expansion.
Trading Ideas Long $AAVE
Entry: 155.06 - 157.11
SL: 144.53
TP1: 173.43
TP2: 180.37
TP3: 195.00
trade $AAVE here :👇
Trading Ideas Long $AAVE
Entry: 155.06 - 157.11
SL: 144.53
TP1: 173.43
TP2: 180.37
TP3: 195.00
trade $AAVE here :👇
2
698
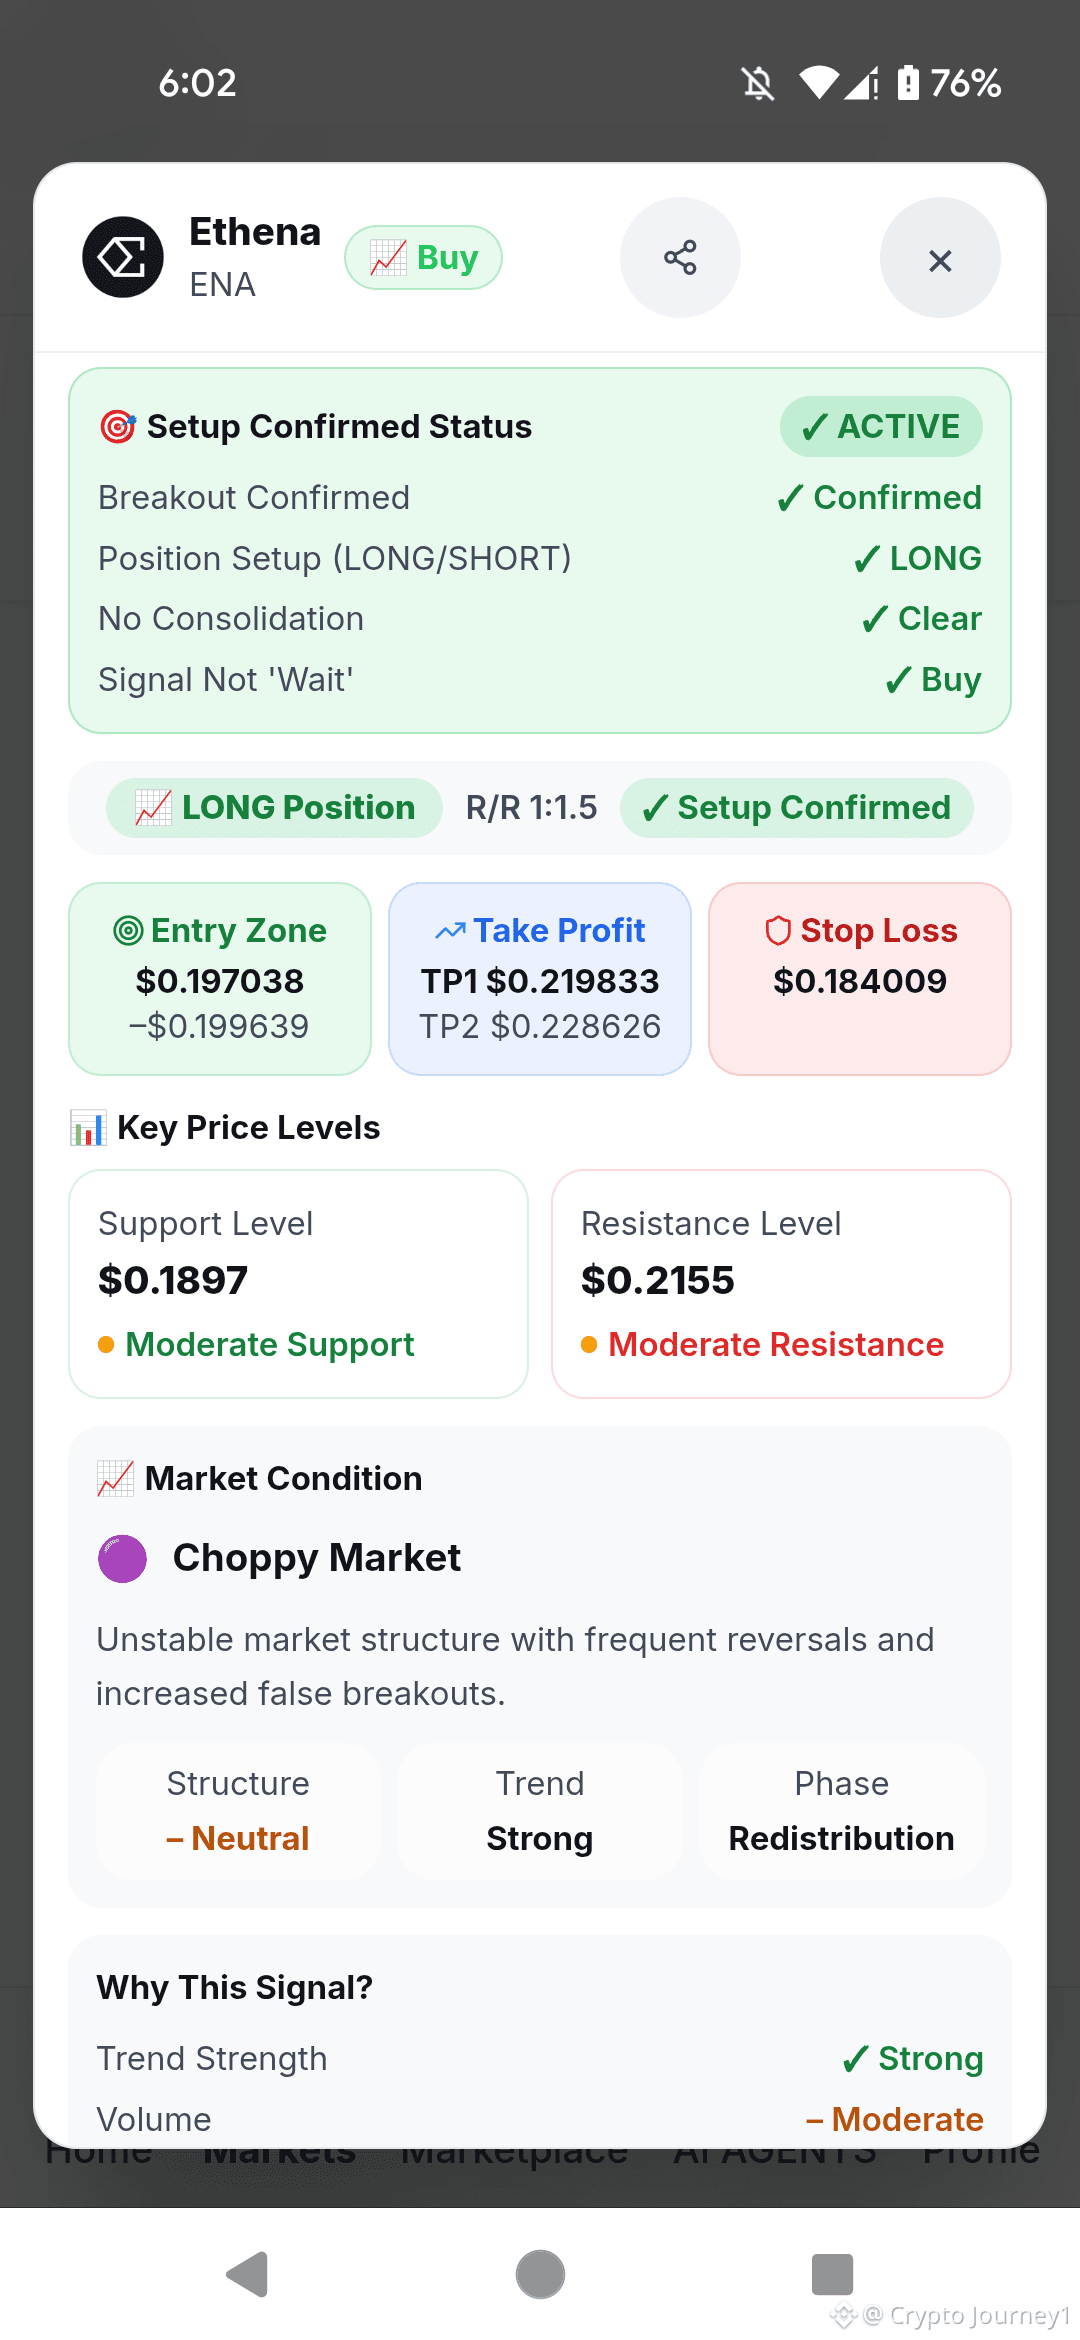
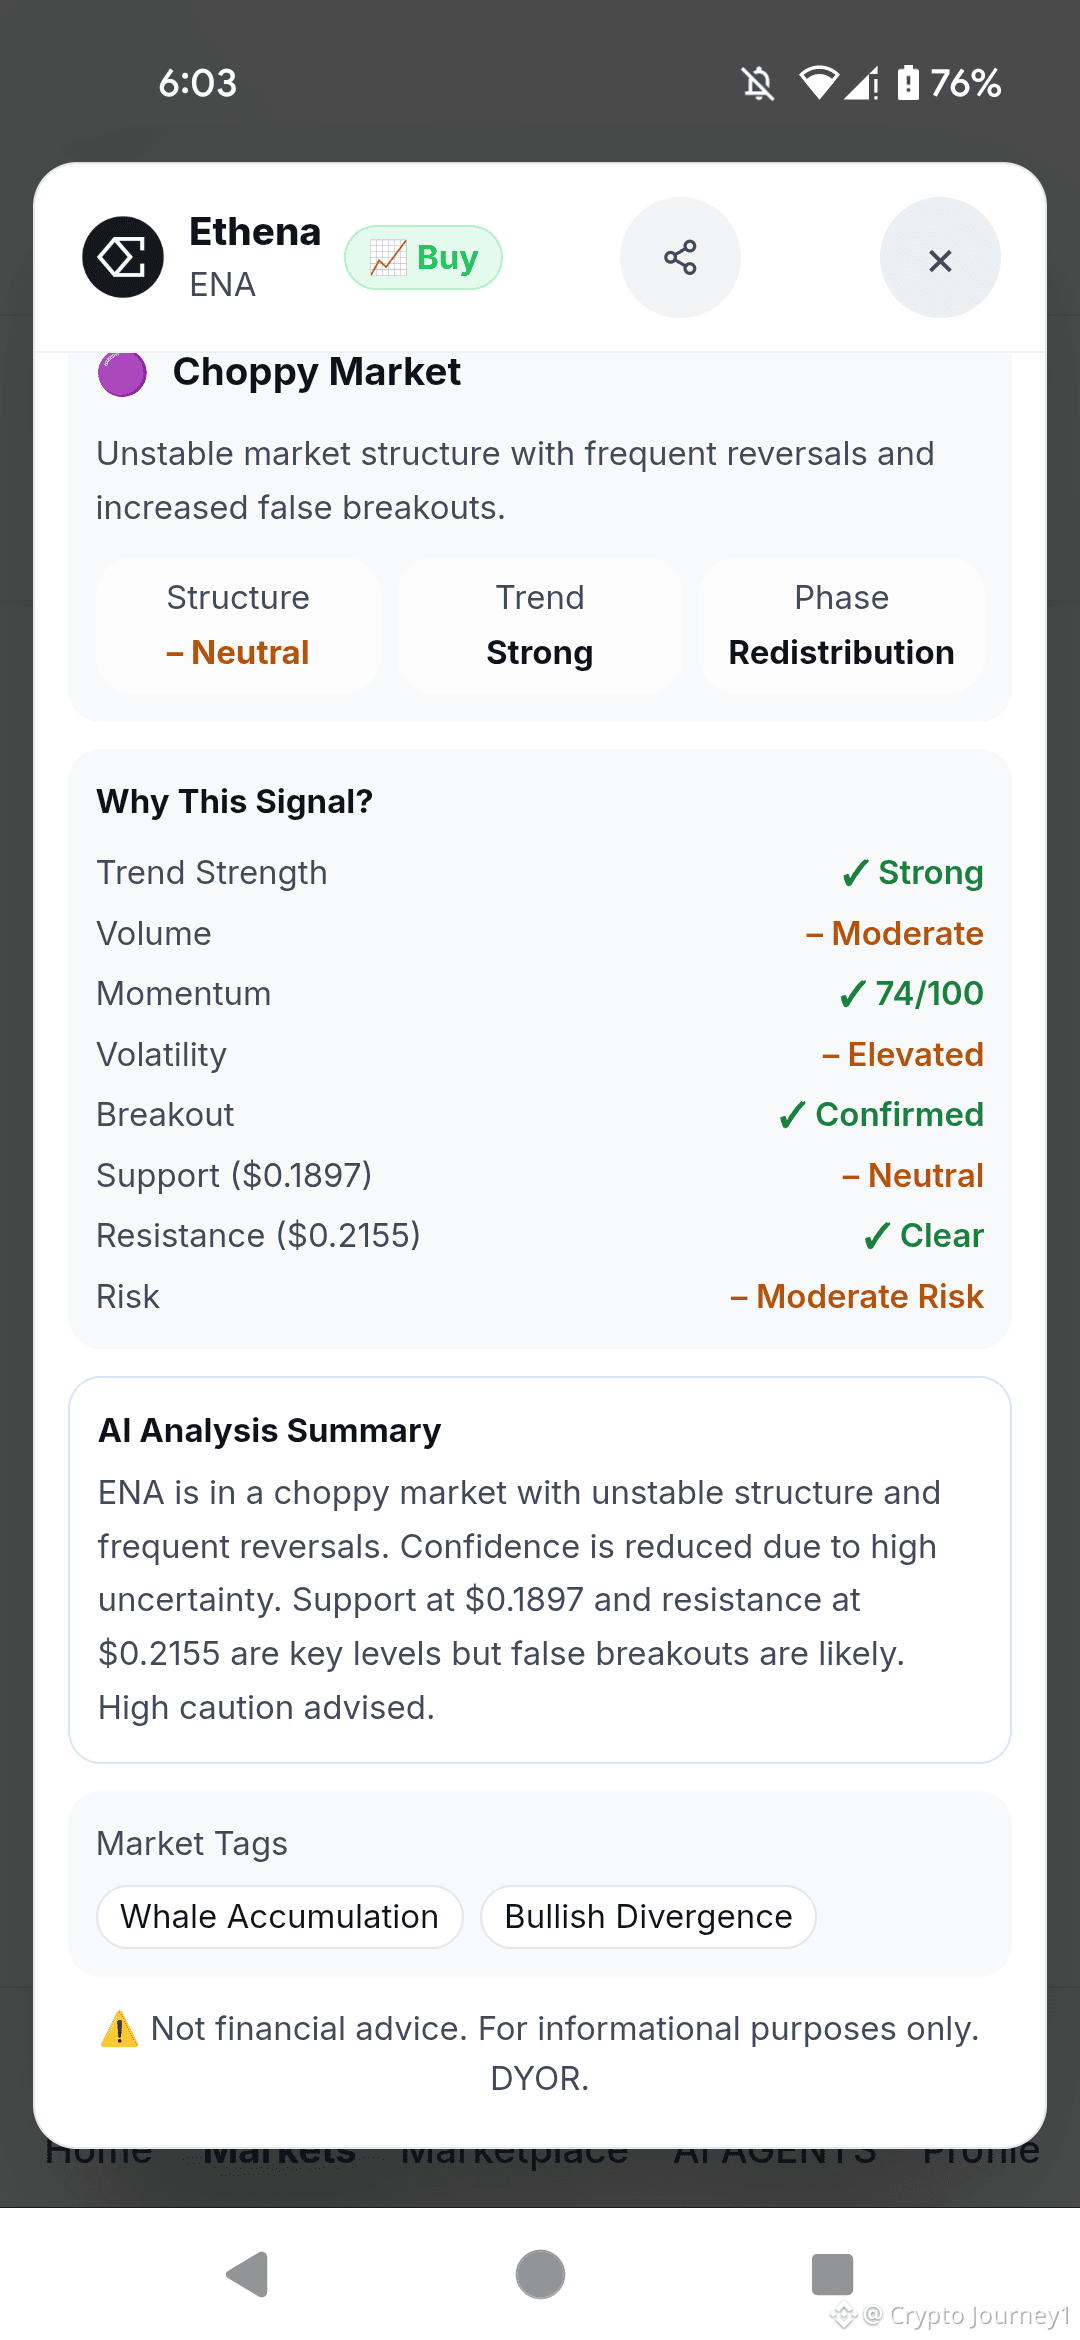
$ENA BIG LONG : ENA is showing an active long setup with a confirmed breakout, bouncing from the support zone despite a choppy market structure.
Previous Check: We analyzed ENA at higher levels before. If you held those longs, you are in a loss. This is a fresh entry setup based on the current whale accumulation.
Trading Ideas Long $ENA
{future}(ENAUSDT)
Entry: 0.1970 - 0.1996
SL: 0.1840
TP1: 0.2198
TP2: 0.2286
TP3: 0.2400
trade $ENA here :👇
$ENA BIG LONG : ENA is showing an active long setup with a confirmed breakout, bouncing from the support zone despite a choppy market structure.
Previous Check: We analyzed ENA at higher levels before. If you held those longs, you are in a loss. This is a fresh entry setup based on the current whale accumulation.
Trading Ideas Long $ENA
Entry: 0.1970 - 0.1996
SL: 0.1840
TP1: 0.2198
TP2: 0.2286
TP3: 0.2400
trade $ENA here :👇
Previous Check: We analyzed ENA at higher levels before. If you held those longs, you are in a loss. This is a fresh entry setup based on the current whale accumulation.
Trading Ideas Long $ENA
Entry: 0.1970 - 0.1996
SL: 0.1840
TP1: 0.2198
TP2: 0.2286
TP3: 0.2400
trade $ENA here :👇
1
1.3k
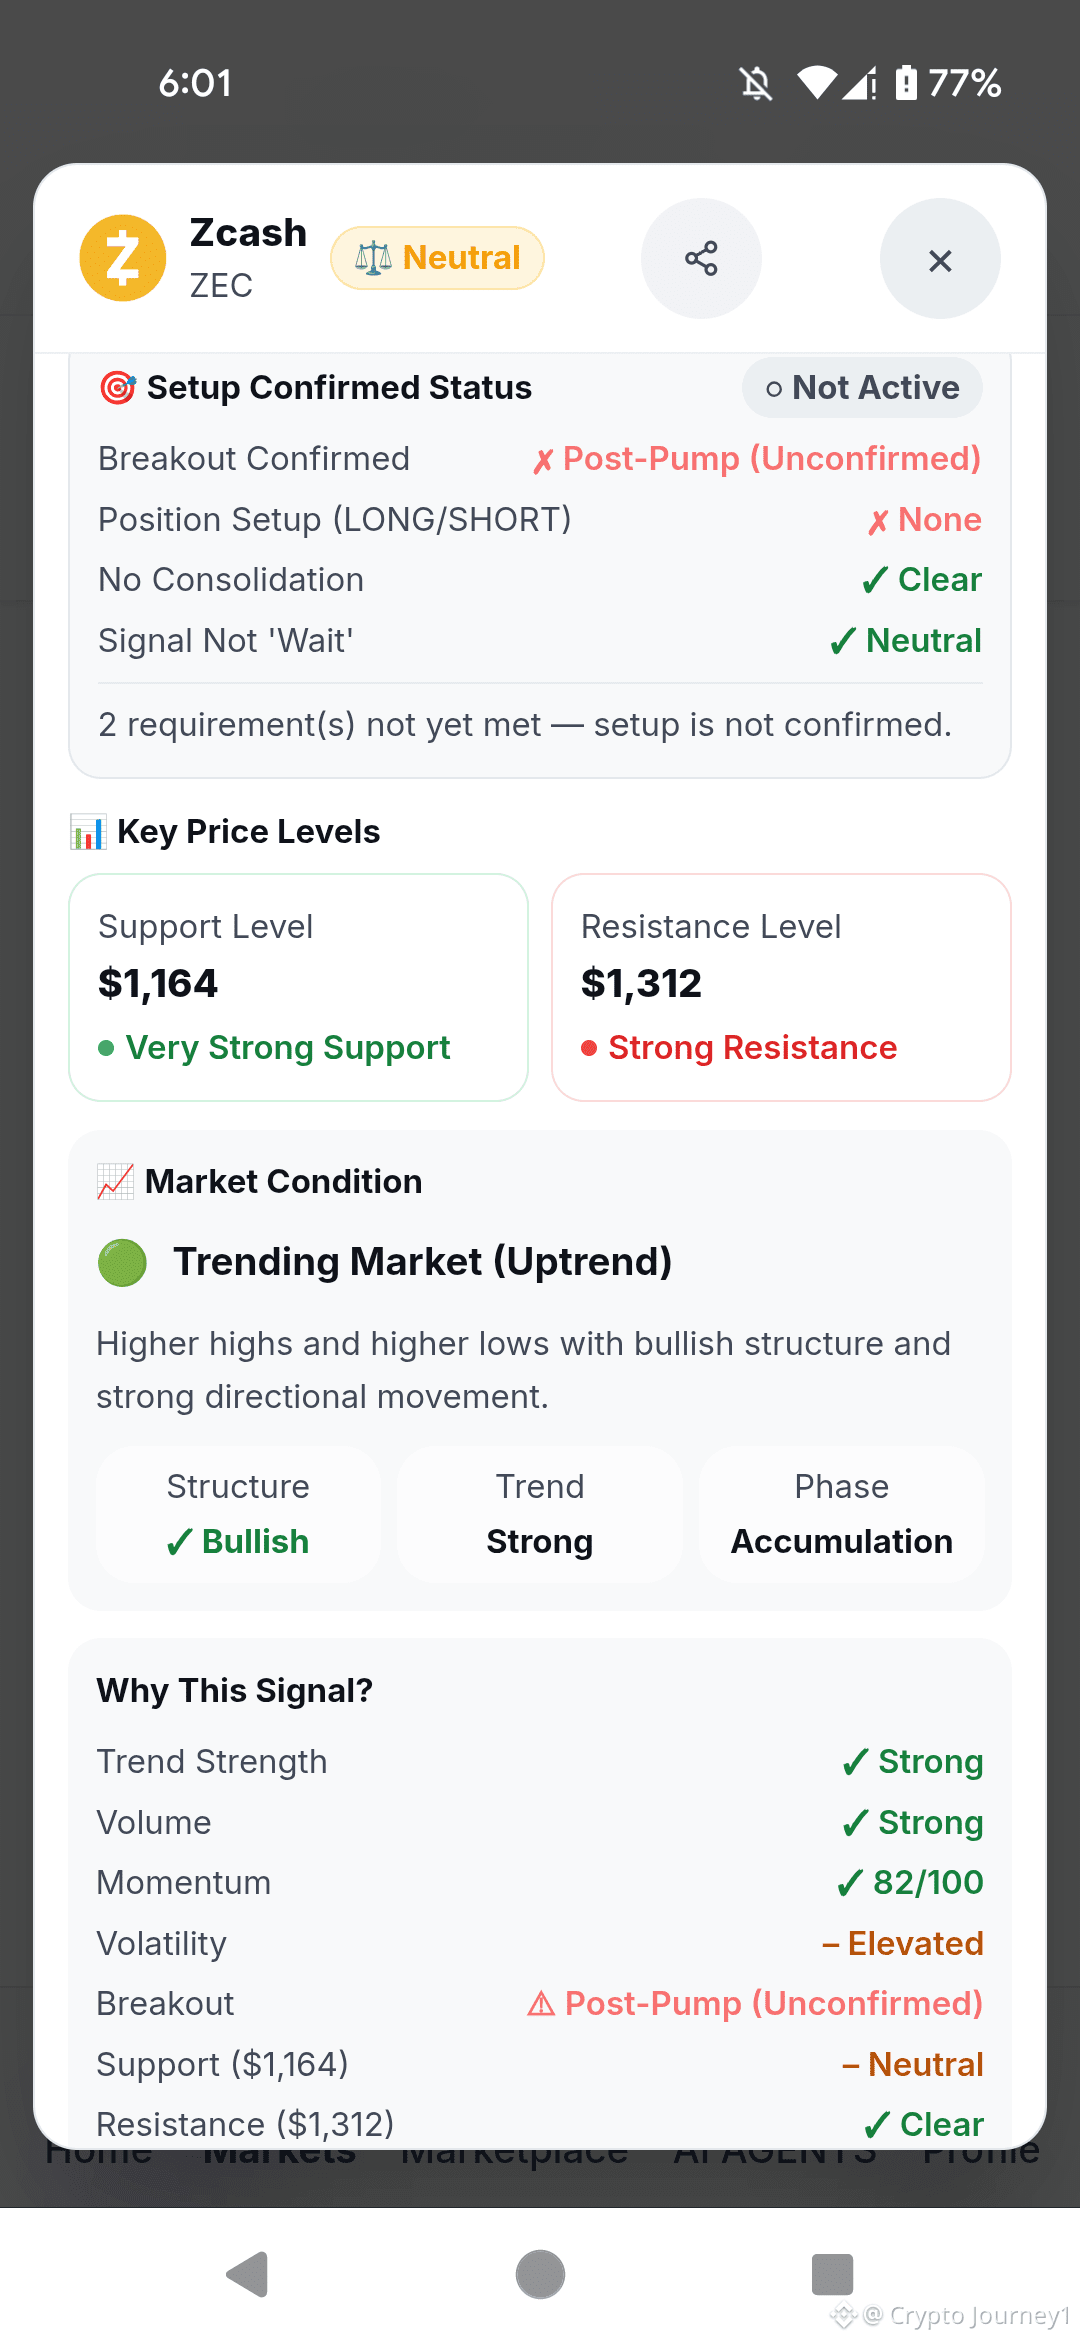
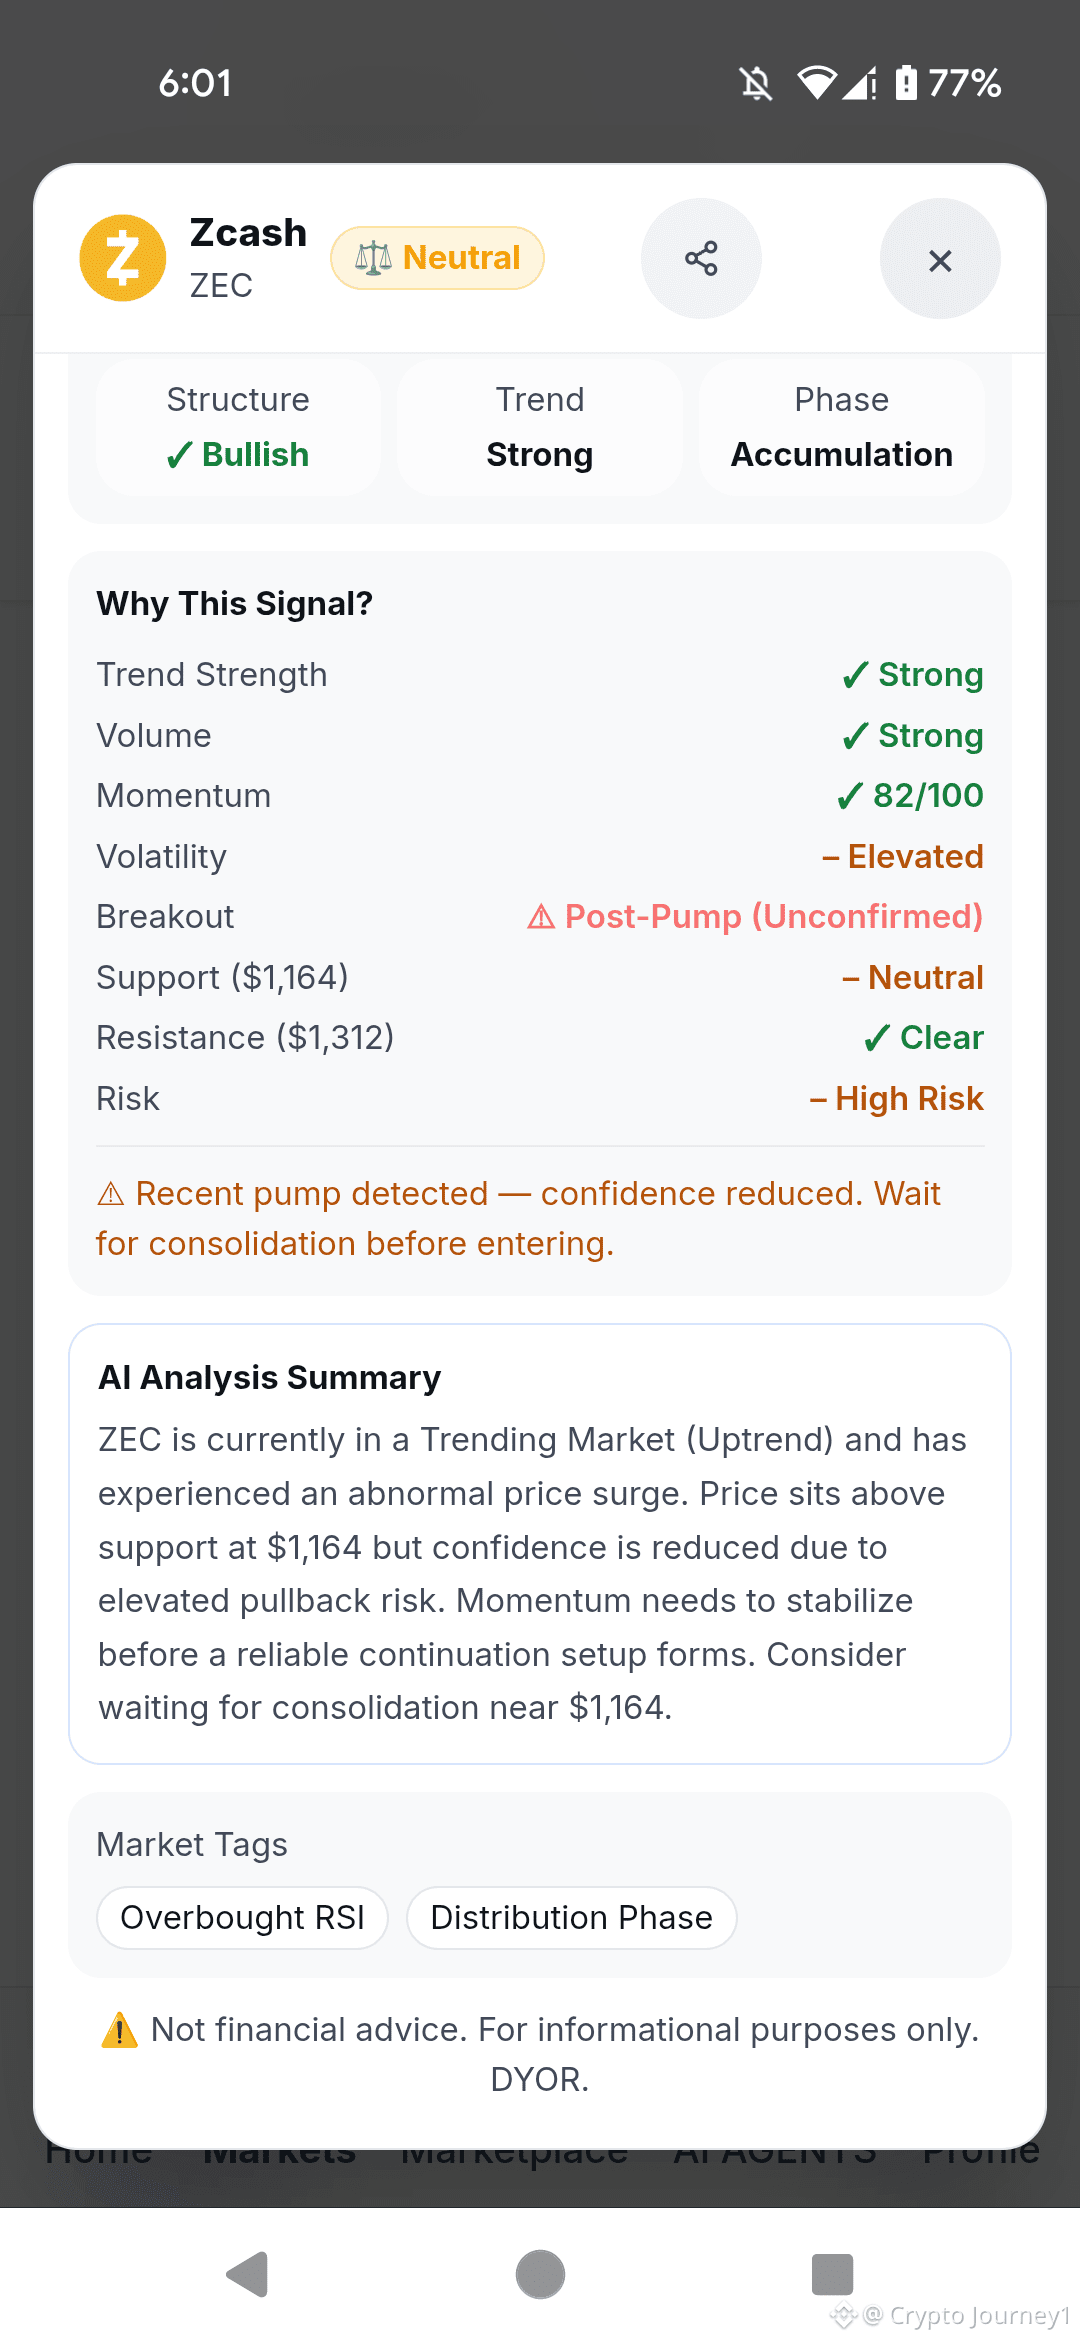
$ZEC BIG LONG is currently in a post-pump consolidation phase. We previously caught the move from $1,206, and now the system advises waiting for a pullback to the major support before the next leg up.
Trading Ideas Long $ZEC
{future}(ZECUSDT)
Entry: 1,164 - 1,180
SL: 1,100
TP1: 1,250
TP2: 1,312
TP3: 1,400
trade $ZEC here :👇
$ZEC BIG LONG is currently in a post-pump consolidation phase. We previously caught the move from $1,206, and now the system advises waiting for a pullback to the major support before the next leg up.
Trading Ideas Long $ZEC
Entry: 1,164 - 1,180
SL: 1,100
TP1: 1,250
TP2: 1,312
TP3: 1,400
trade $ZEC here :👇
Trading Ideas Long $ZEC
Entry: 1,164 - 1,180
SL: 1,100
TP1: 1,250
TP2: 1,312
TP3: 1,400
trade $ZEC here :👇
2
1.8k
$BTW WHALE EXODUS: THE LONG SQUEEZE IS LOADING 🩸
$BTW
{future}(BTWUSDT)
Listen closely, class. Let’s review the board.
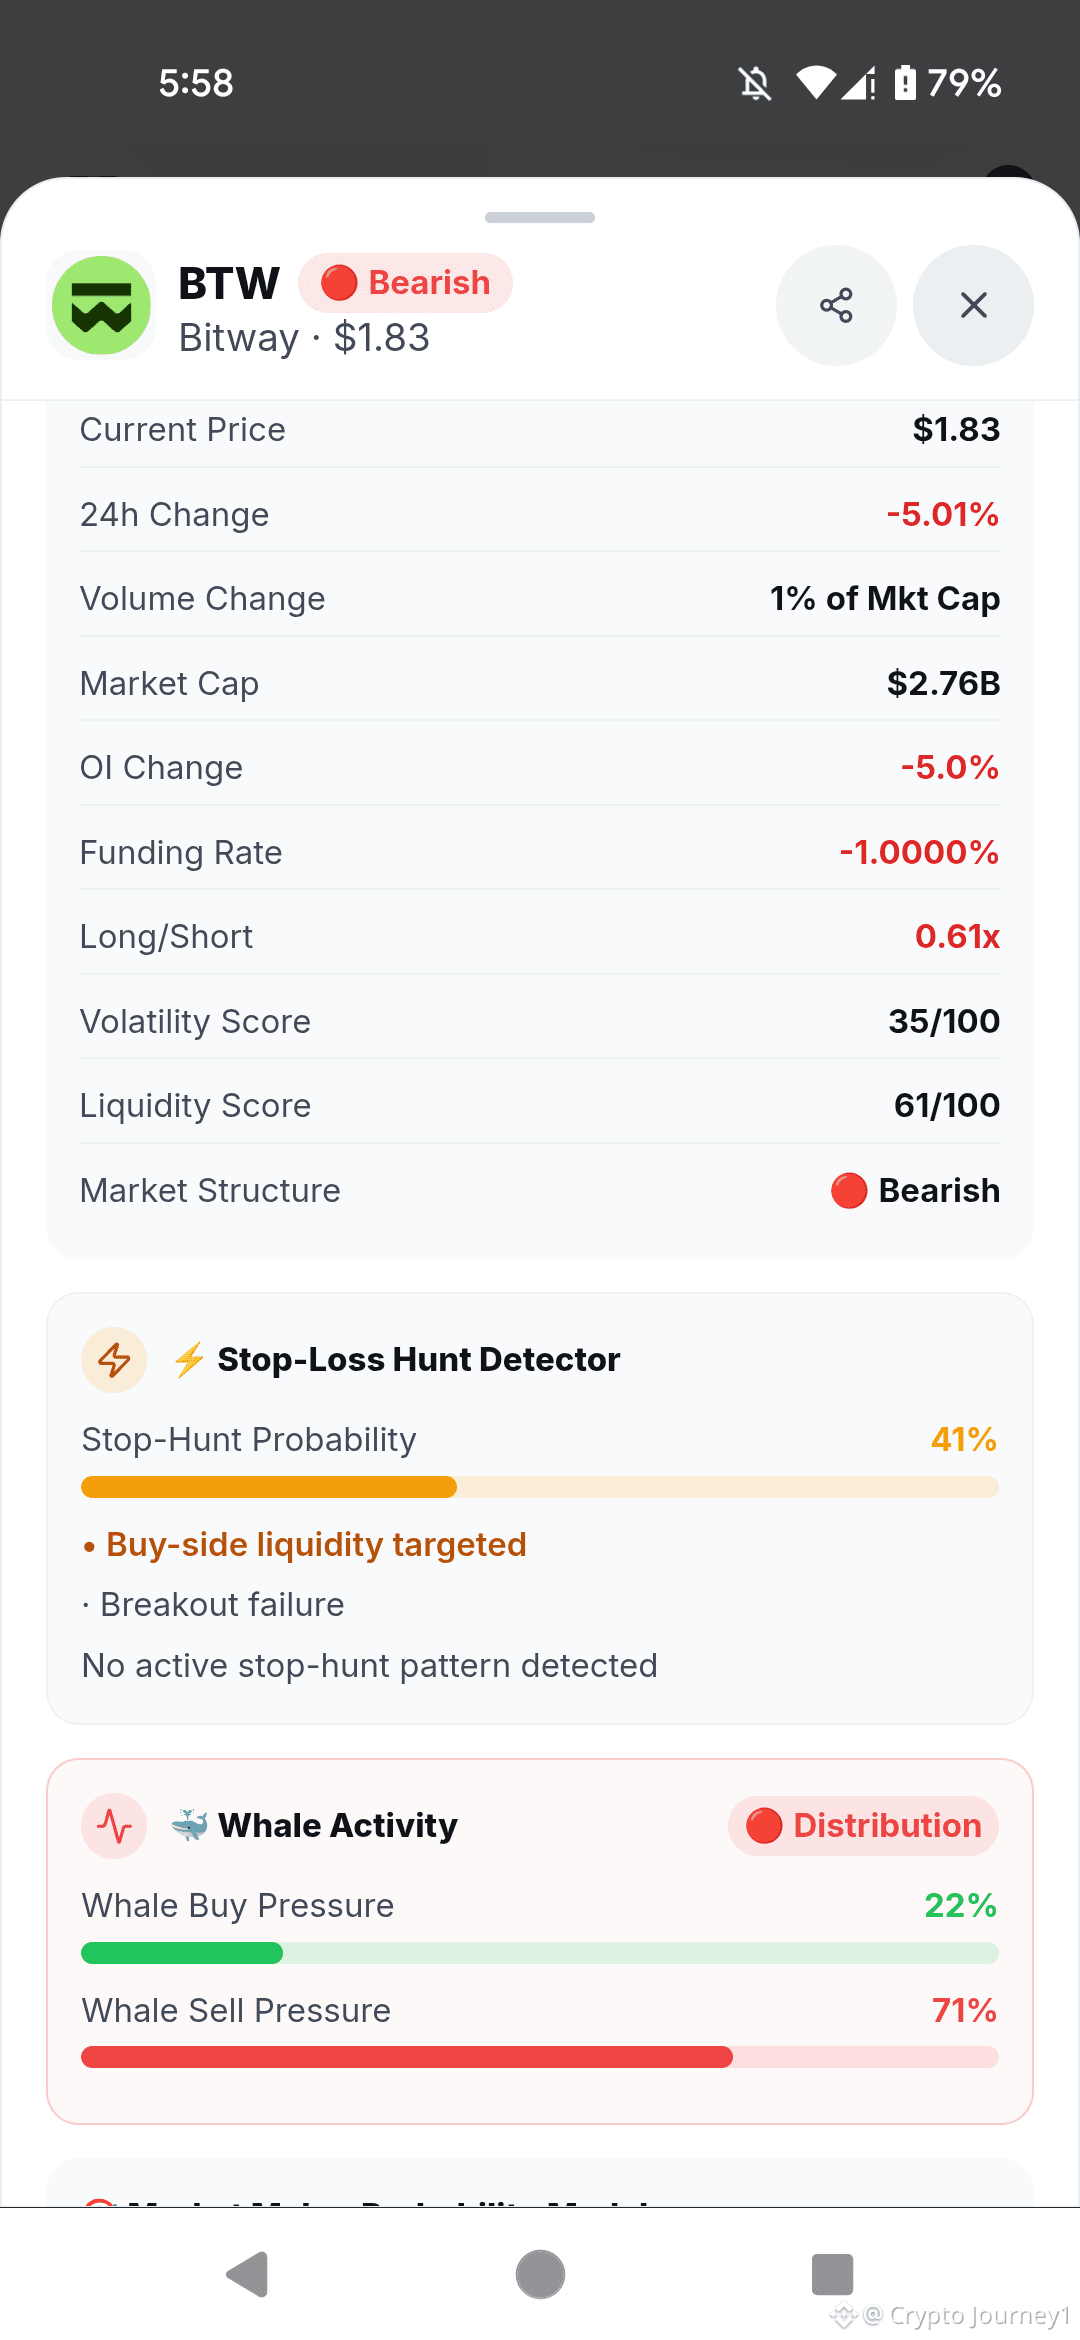
Previous Update Check: We called the short on BTW when it was hovering around $2.08. The market has bled exactly as planned. Price is now at $1.83. If you took that setup, you are sitting in solid profit. If you held a long, you are bleeding.
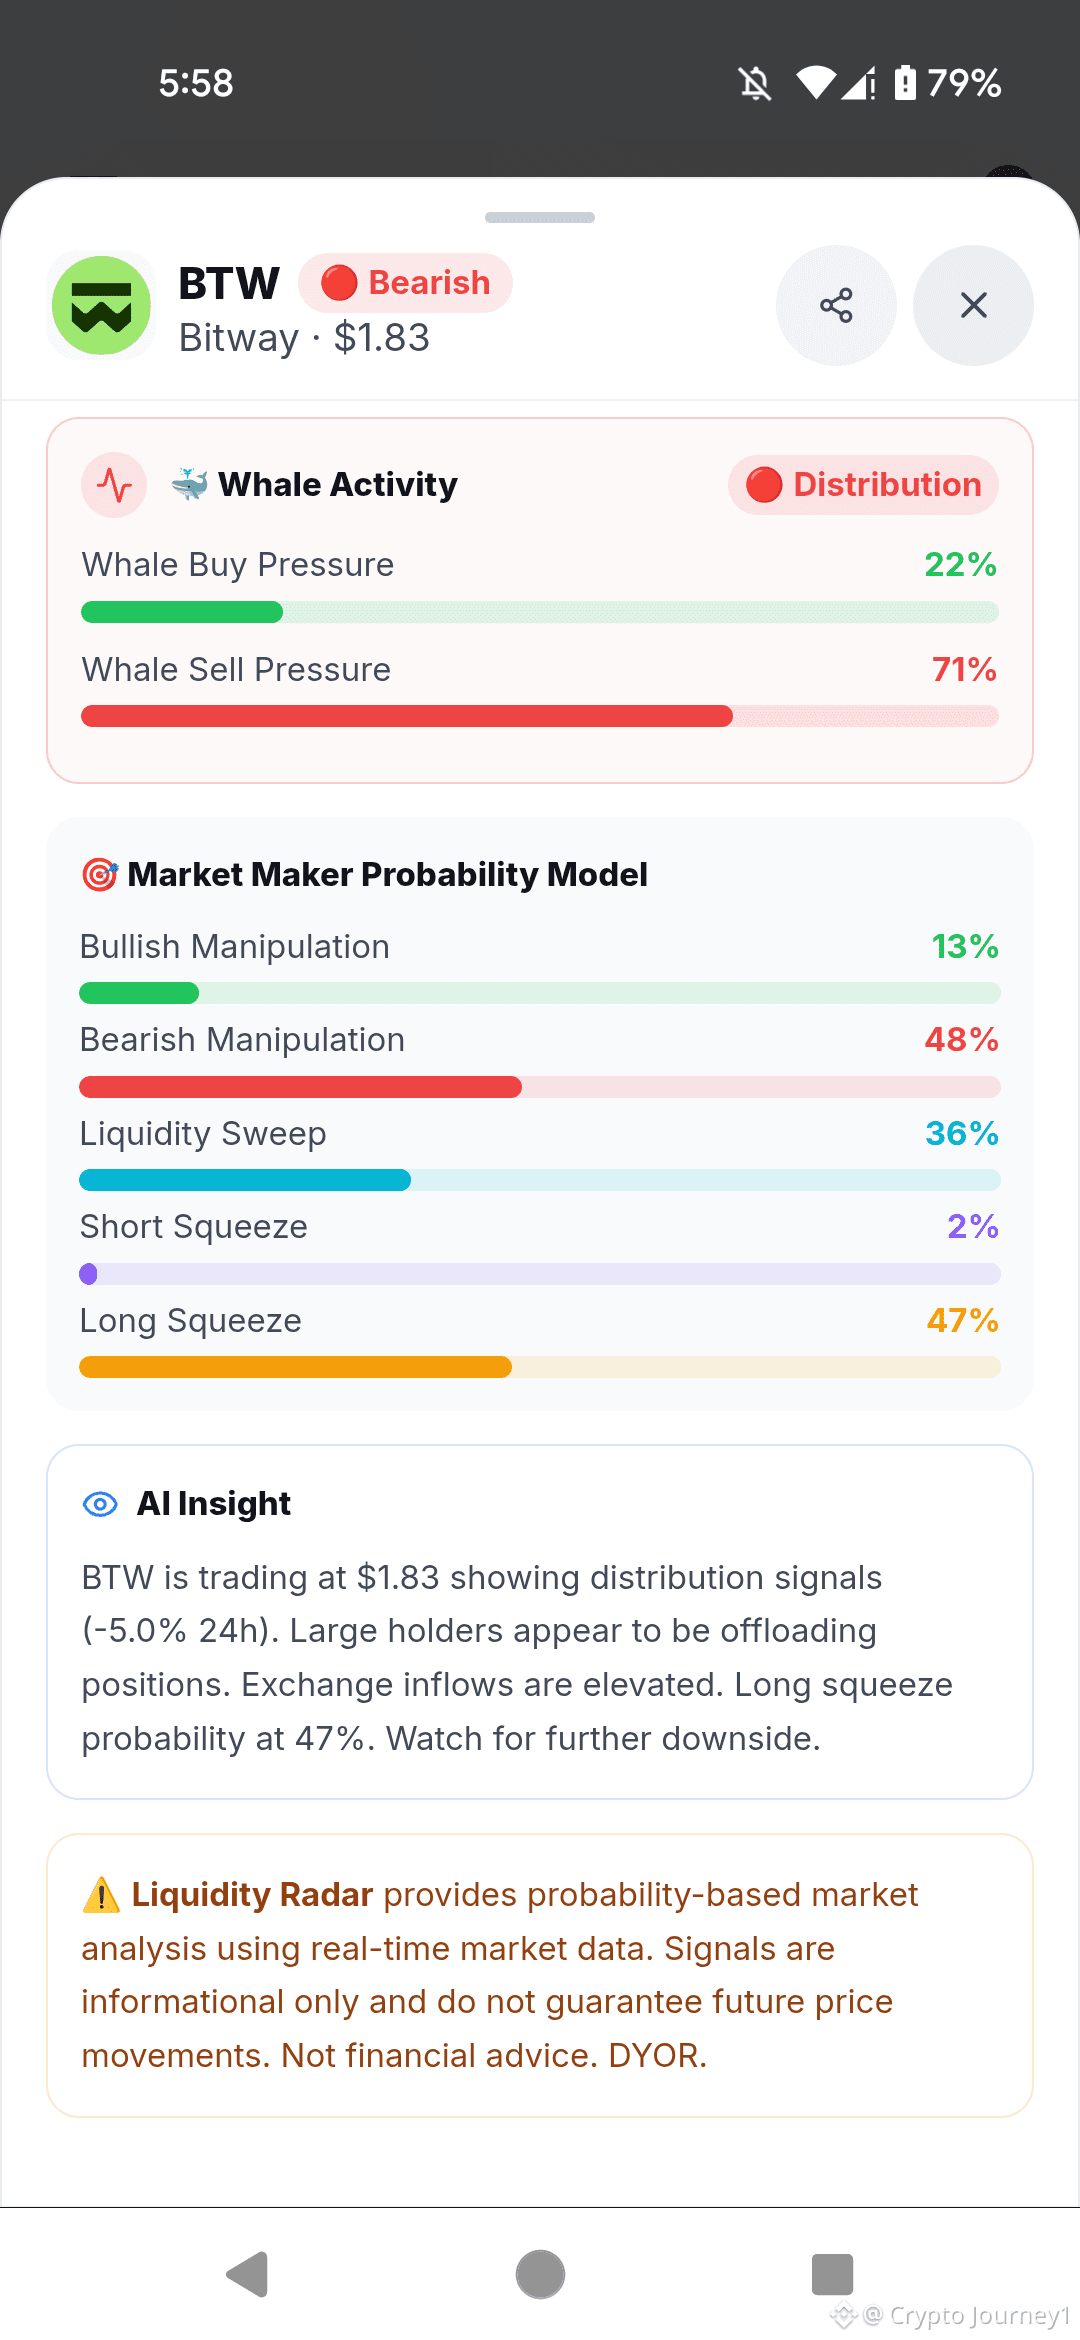
Current Observation: The dashboard is flashing pure danger. Market structure is strictly Bearish. Whales are aggressively exiting with 71% sell pressure. The Long/Short ratio is 0.61x, and the Long Squeeze probability sits at a massive 47%. The system explicitly warns of further downside as large holders offload on exchanges. Volume is dead at 1% of Market Cap.
Here is your tactical plan:
Watch Zone: 1.88 – 1.92 (Wait for a weak bounce)
Risk Level: 2.05 (Above local resistance)
Targets: 1.75 – 1.65 – 1.50
Support: 1.80 | Resistance: 2.00
Execution Strategy: Do not buy this dip. The trend is your enemy here. Wait for a dead-cat bounce into our watch zone and look for bearish rejection. If price reclaims $2.05 with volume, step aside.
Disclaimer: This is market analysis for educational purposes, not financial advice. Always do your own research and manage your risk.
Trade on $BTW ...
$BTW WHALE EXODUS: THE LONG SQUEEZE IS LOADING 🩸
$BTW
Listen closely, class. Let’s review the board.
Previous Update Check: We called the short on BTW when it was hovering around $2.08. The market has bled exactly as planned. Price is now at $1.83. If you took that setup, you are sitting in solid profit. If you held a long, you are bleeding.
Current Observation: The dashboard is flashing pure danger. Market structure is strictly Bearish. Whales are aggressively exiting with 71% sell pressure. The Long/Short ratio is 0.61x, and the Long Squeeze probability sits at a massive 47%. The system explicitly warns of further downside as large holders offload on exchanges. Volume is dead at 1% of Market Cap.
Here is your tactical plan:
Watch Zone: 1.88 – 1.92 (Wait for a weak bounce)
Risk Level: 2.05 (Above local resistance)
Targets: 1.75 – 1.65 – 1.50
Support: 1.80 | Resistance: 2.00
Execution Strategy: Do not buy this dip. The trend is your enemy here. Wait for a dead-cat bounce into our watch zone and look for bearish rejection. If price reclaims $2.05 with volume, step aside.
Disclaimer: This is market analysis for educational purposes, not financial advice. Always do your own research and manage your risk.
Trade on $BTW ...
$BTW
Listen closely, class. Let’s review the board.
Previous Update Check: We called the short on BTW when it was hovering around $2.08. The market has bled exactly as planned. Price is now at $1.83. If you took that setup, you are sitting in solid profit. If you held a long, you are bleeding.
Current Observation: The dashboard is flashing pure danger. Market structure is strictly Bearish. Whales are aggressively exiting with 71% sell pressure. The Long/Short ratio is 0.61x, and the Long Squeeze probability sits at a massive 47%. The system explicitly warns of further downside as large holders offload on exchanges. Volume is dead at 1% of Market Cap.
Here is your tactical plan:
Watch Zone: 1.88 – 1.92 (Wait for a weak bounce)
Risk Level: 2.05 (Above local resistance)
Targets: 1.75 – 1.65 – 1.50
Support: 1.80 | Resistance: 2.00
Execution Strategy: Do not buy this dip. The trend is your enemy here. Wait for a dead-cat bounce into our watch zone and look for bearish rejection. If price reclaims $2.05 with volume, step aside.
Disclaimer: This is market analysis for educational purposes, not financial advice. Always do your own research and manage your risk.
Trade on $BTW ...
1
2k
$WLD WHALE ACCUMULATION SURGE 🚀
{future}(WLDUSDT)
Let's open our notebooks and look at the board. Today, Worldcoin is showing a major shift in momentum.
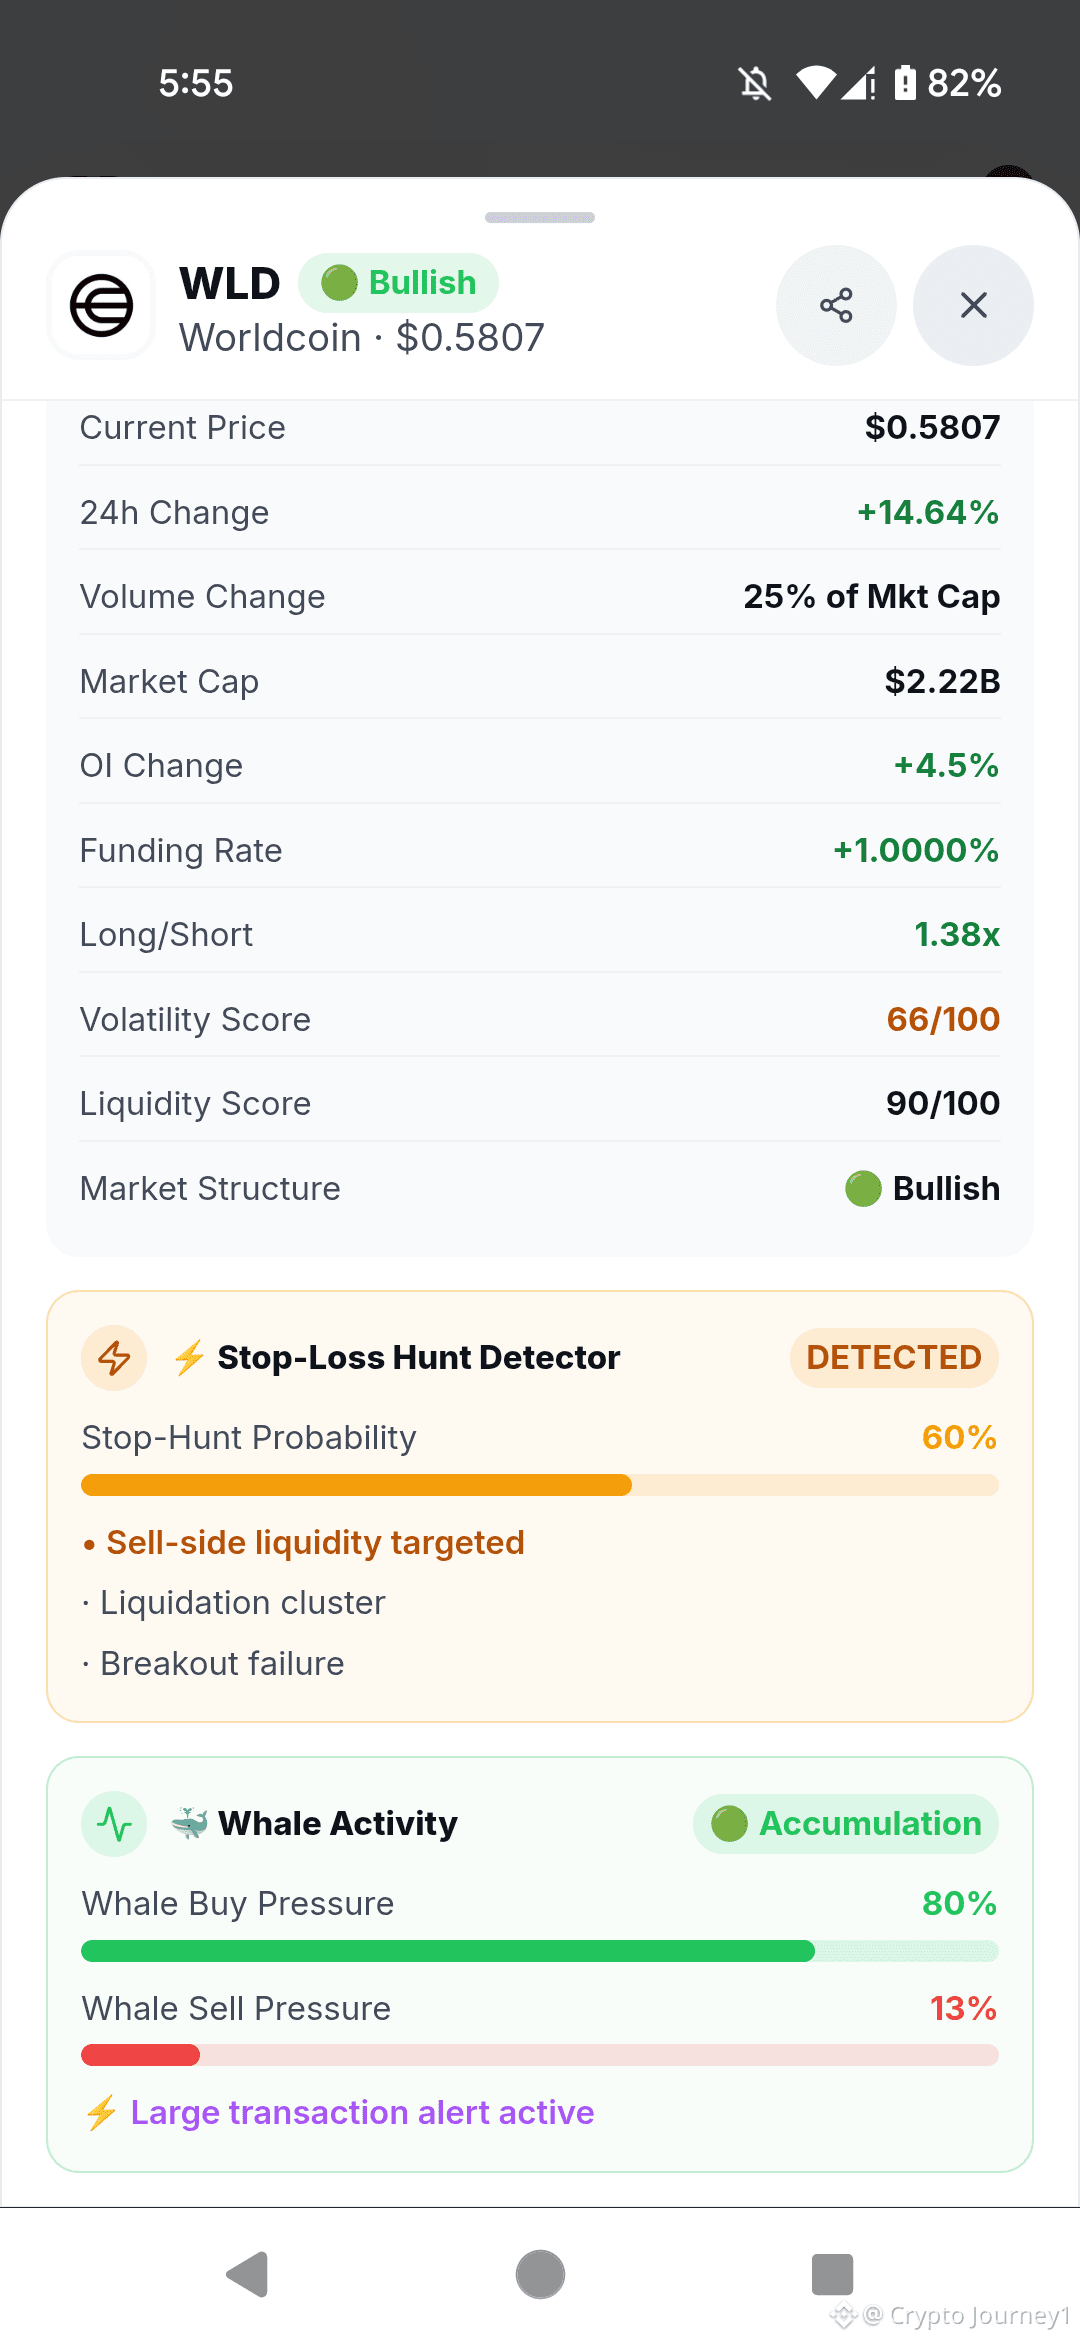
Previous Update Check: In our last lesson, we analyzed WLD hovering around the $0.52 support zone in a choppy structure. We noted the underlying accumulation. The market respected that floor, and we have now blasted up 14% to $0.5807. If you caught that bounce from support, you are currently sitting in a very healthy profit.
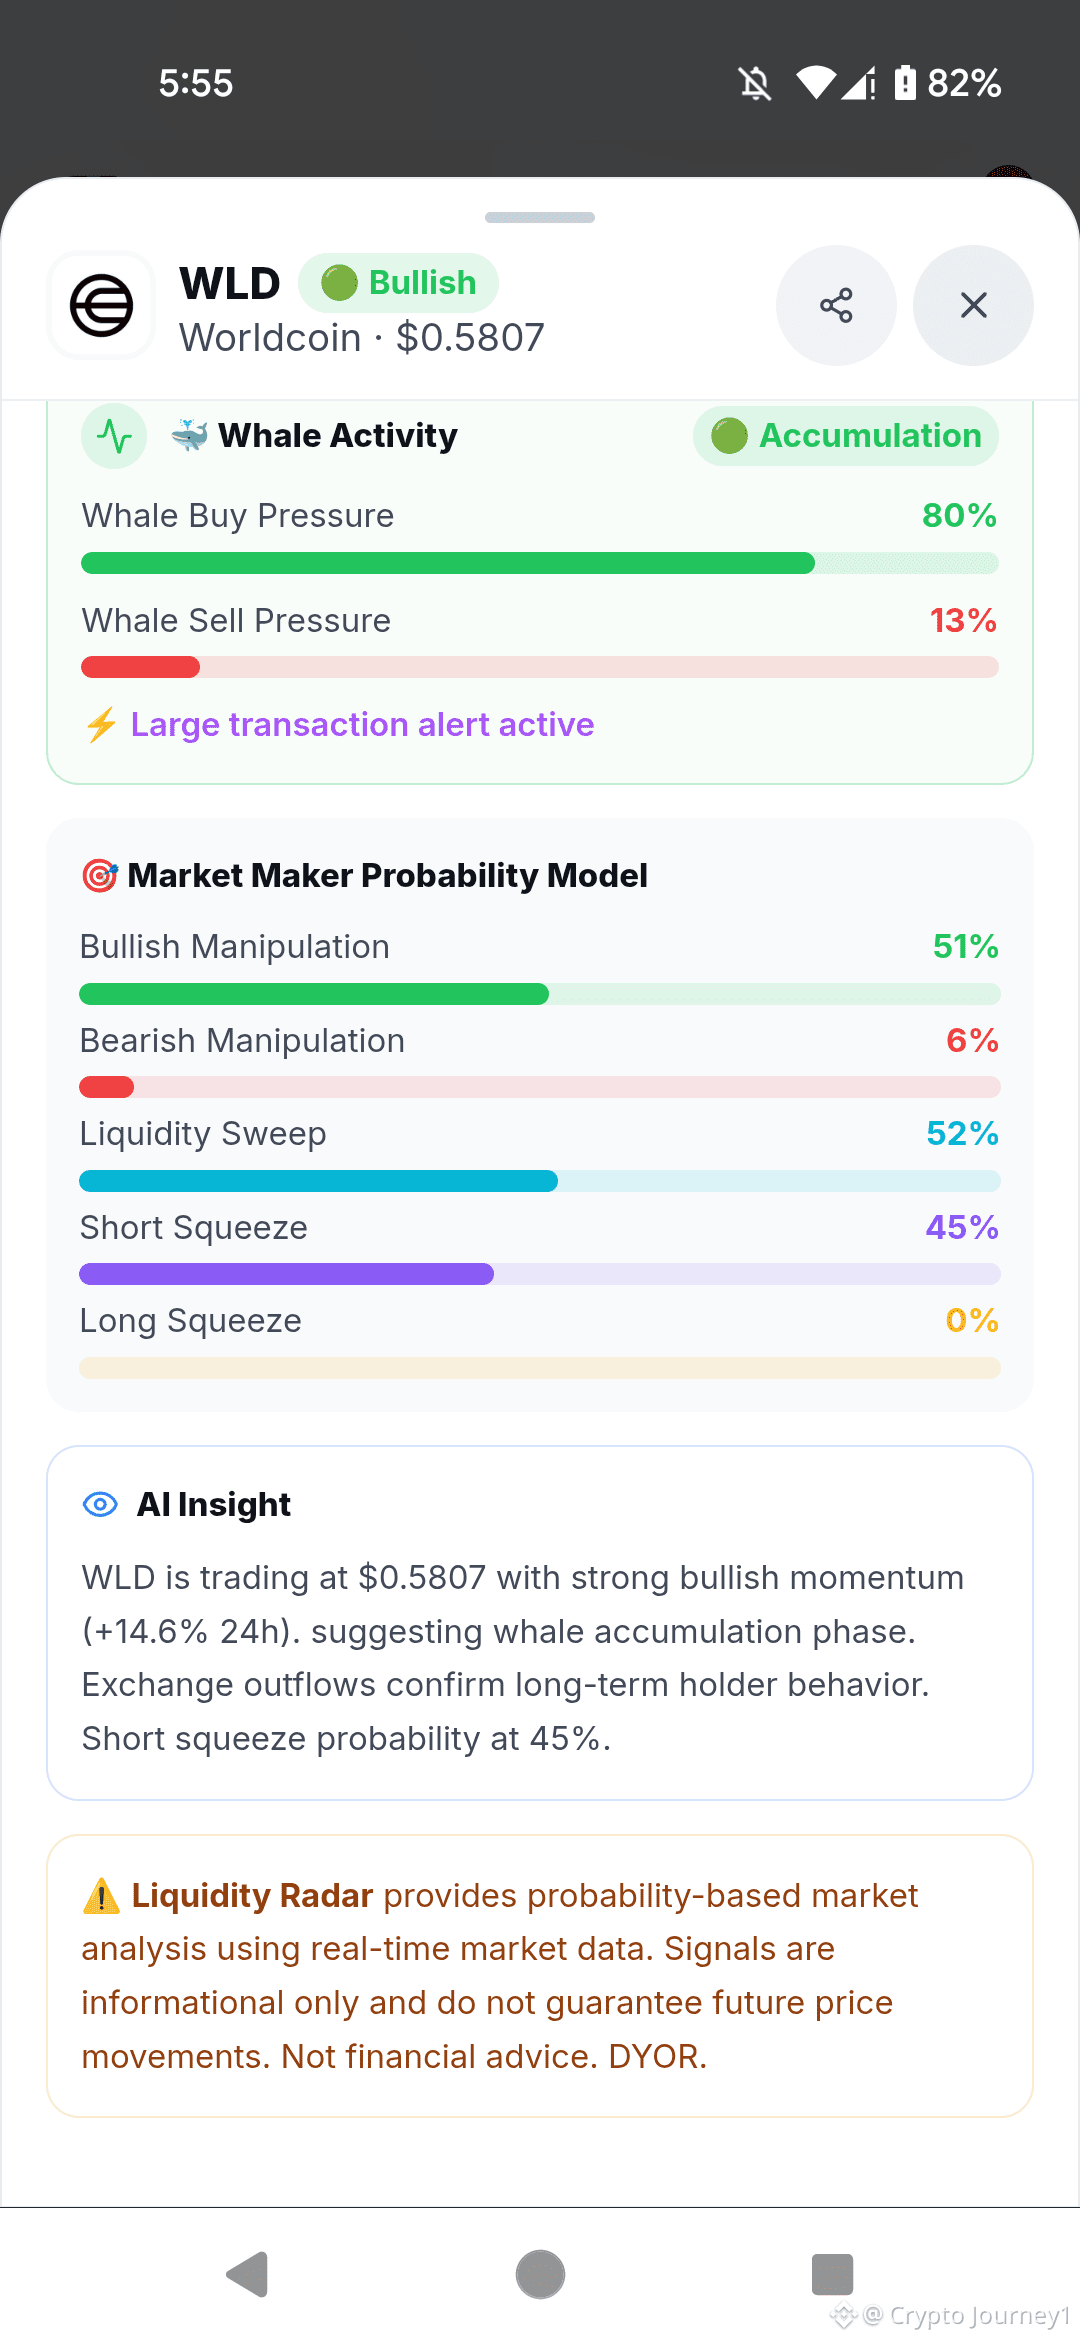
Current Observation: Look at the dashboard. Whales are aggressively loading up with 80% buy pressure. The structure is officially Bullish. However, the funding rate is elevated at +1.00%, meaning the longs are heavily crowded (1.38x ratio). The Stop-Loss Hunt Detector is screaming at 60%, targeting sell-side liquidity. This means market makers may intentionally drop the price to hit stop losses before the real breakout.
Here is the tactical plan:
Watch Zone: 0.5400 – 0.5550 (Wait for the sweep)
Risk Level: 0.4900
Targets: 0.6500 – 0.7500 – 0.9000
Support: 0.5500 | Resistance: 0.6000
Execution Strategy: Do not chase the green candle. With a 45% short squeeze probability, the upside potential is massive, but the 60% stop-hunt probability means a sudden dip is highly likely. Wait for the pullback into our watch zone, look for the rejection wicks, and let the market prove the support is real. If it reclaims $0.60 with massive volume, the path to our aggressive targets opens up.
$WLD WHALE ACCUMULATION SURGE 🚀
Let's open our notebooks and look at the board. Today, Worldcoin is showing a major shift in momentum.
Previous Update Check: In our last lesson, we analyzed WLD hovering around the $0.52 support zone in a choppy structure. We noted the underlying accumulation. The market respected that floor, and we have now blasted up 14% to $0.5807. If you caught that bounce from support, you are currently sitting in a very healthy profit.
Current Observation: Look at the dashboard. Whales are aggressively loading up with 80% buy pressure. The structure is officially Bullish. However, the funding rate is elevated at +1.00%, meaning the longs are heavily crowded (1.38x ratio). The Stop-Loss Hunt Detector is screaming at 60%, targeting sell-side liquidity. This means market makers may intentionally drop the price to hit stop losses before the real breakout.
Here is the tactical plan:
Watch Zone: 0.5400 – 0.5550 (Wait for the sweep)
Risk Level: 0.4900
Targets: 0.6500 – 0.7500 – 0.9000
Support: 0.5500 | Resistance: 0.6000
Execution Strategy: Do not chase the green candle. With a 45% short squeeze probability, the upside potential is massive, but the 60% stop-hunt probability means a sudden dip is highly likely. Wait for the pullback into our watch zone, look for the rejection wicks, and let the market prove the support is real. If it reclaims $0.60 with massive volume, the path to our aggressive targets opens up.
Let's open our notebooks and look at the board. Today, Worldcoin is showing a major shift in momentum.
Previous Update Check: In our last lesson, we analyzed WLD hovering around the $0.52 support zone in a choppy structure. We noted the underlying accumulation. The market respected that floor, and we have now blasted up 14% to $0.5807. If you caught that bounce from support, you are currently sitting in a very healthy profit.
Current Observation: Look at the dashboard. Whales are aggressively loading up with 80% buy pressure. The structure is officially Bullish. However, the funding rate is elevated at +1.00%, meaning the longs are heavily crowded (1.38x ratio). The Stop-Loss Hunt Detector is screaming at 60%, targeting sell-side liquidity. This means market makers may intentionally drop the price to hit stop losses before the real breakout.
Here is the tactical plan:
Watch Zone: 0.5400 – 0.5550 (Wait for the sweep)
Risk Level: 0.4900
Targets: 0.6500 – 0.7500 – 0.9000
Support: 0.5500 | Resistance: 0.6000
Execution Strategy: Do not chase the green candle. With a 45% short squeeze probability, the upside potential is massive, but the 60% stop-hunt probability means a sudden dip is highly likely. Wait for the pullback into our watch zone, look for the rejection wicks, and let the market prove the support is real. If it reclaims $0.60 with massive volume, the path to our aggressive targets opens up.
4
3k
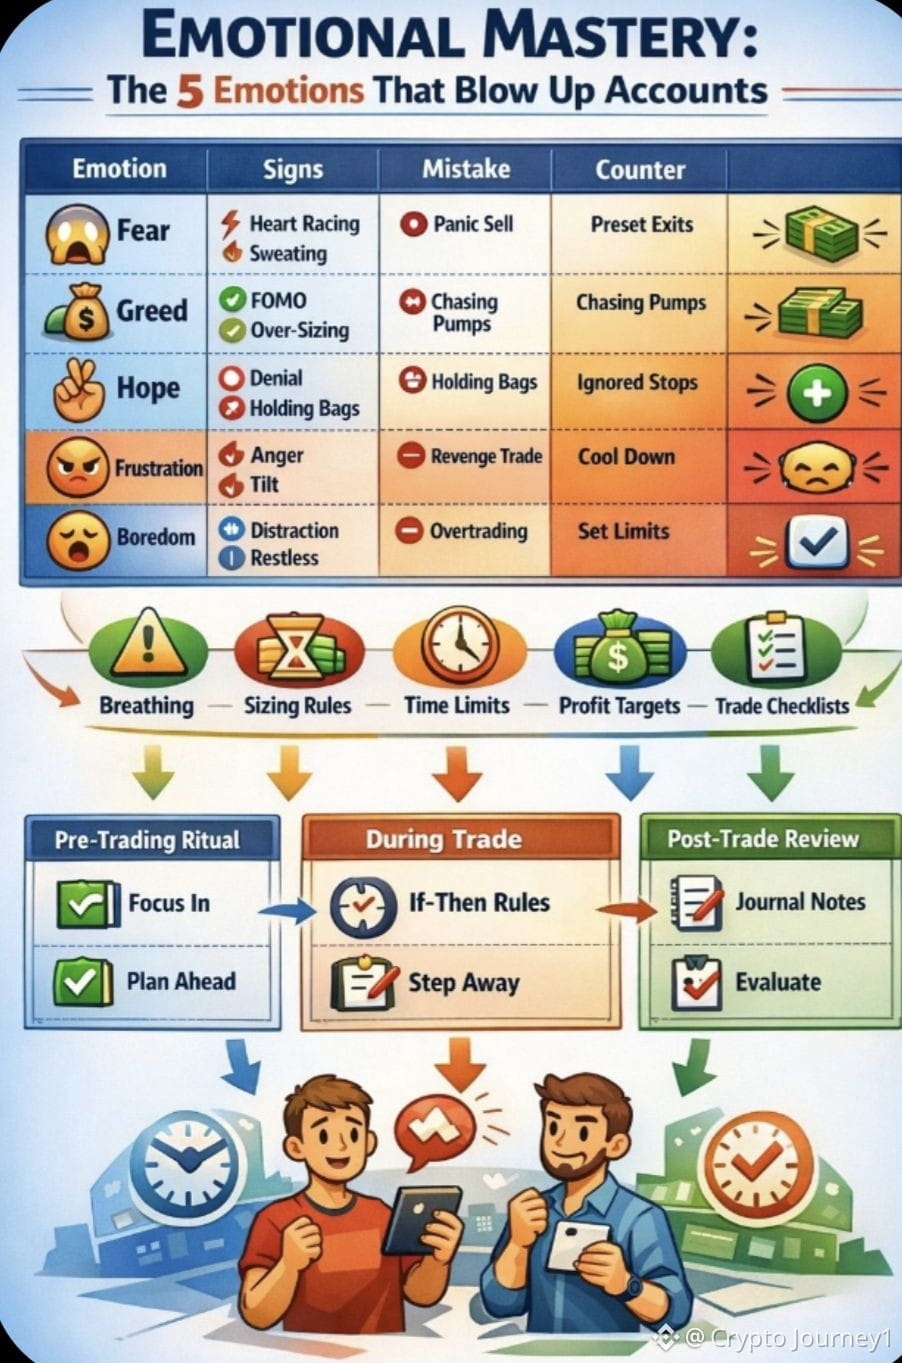
The biggest mistake traders make in this market (Spoiler: It's not the entry price).
$BTC
I have been looking at the charts all week, and the volatility is insane. 📉📈
But here is the hard truth: 90% of traders lose money not because they pick the wrong coin, but because they let their emotions control their hands. They hold their losers and cut their winners too early.
The market is designed to test your psychology, not just your technical analysis. 🧠
I want to hear from my 68K+ community today. Let's be honest with each other:
What is the biggest mistake YOU made this month, and what did you learn from it? 👇
Drop your answer in the comments. Let's help each other become better traders.
And if this hits home, share this post with a friend who needs to hear it today. 🤝
The biggest mistake traders make in this market (Spoiler: It's not the entry price).
$BTC
I have been looking at the charts all week, and the volatility is insane. 📉📈
But here is the hard truth: 90% of traders lose money not because they pick the wrong coin, but because they let their emotions control their hands. They hold their losers and cut their winners too early.
The market is designed to test your psychology, not just your technical analysis. 🧠
I want to hear from my 68K+ community today. Let's be honest with each other:
What is the biggest mistake YOU made this month, and what did you learn from it? 👇
Drop your answer in the comments. Let's help each other become better traders.
And if this hits home, share this post with a friend who needs to hear it today. 🤝
$BTC
I have been looking at the charts all week, and the volatility is insane. 📉📈
But here is the hard truth: 90% of traders lose money not because they pick the wrong coin, but because they let their emotions control their hands. They hold their losers and cut their winners too early.
The market is designed to test your psychology, not just your technical analysis. 🧠
I want to hear from my 68K+ community today. Let's be honest with each other:
What is the biggest mistake YOU made this month, and what did you learn from it? 👇
Drop your answer in the comments. Let's help each other become better traders.
And if this hits home, share this post with a friend who needs to hear it today. 🤝
1
2
1.2k
Log in to explore more content
Join global crypto users on Binance Square
⚡️ Get latest and useful information about crypto.
💬 Trusted by the world’s largest crypto exchange.
👍 Discover real insights from verified creators.
Email / Phone number
Trending Topics
HotCPIDecemberHikePriced
66,756 views
872 Discussing
CPI Market Watch | US CPI Rises 0.4% in October, Hotter Than 0.3% Forecast
Binance News
·26 Likes
·40.6k views
AnthropicRejectsIPODelayValuationinQuestion
198,450 views
1,684 Discussing
NvidiaInvestigatesAfterHuang’sAffairApology
481,184 views
3,117 Discussing