

GK-ARONNO
14.7k Posts

GK-ARONNO
 Square Verified+
Report
Block User
👉 Spot Trader 📊 | Guiding Traders to Stay Disciplined, Avoid FOMO & Trade with Confidence | X: @GkAronno ✅
Open Trade

PEPE Holder
Frequent Trader
4.5 Years
5 Following
32.3K+ Followers
98.5K+ Liked
Posts
Portfolio
All
Quotes
Videos
Live
·
--
Article
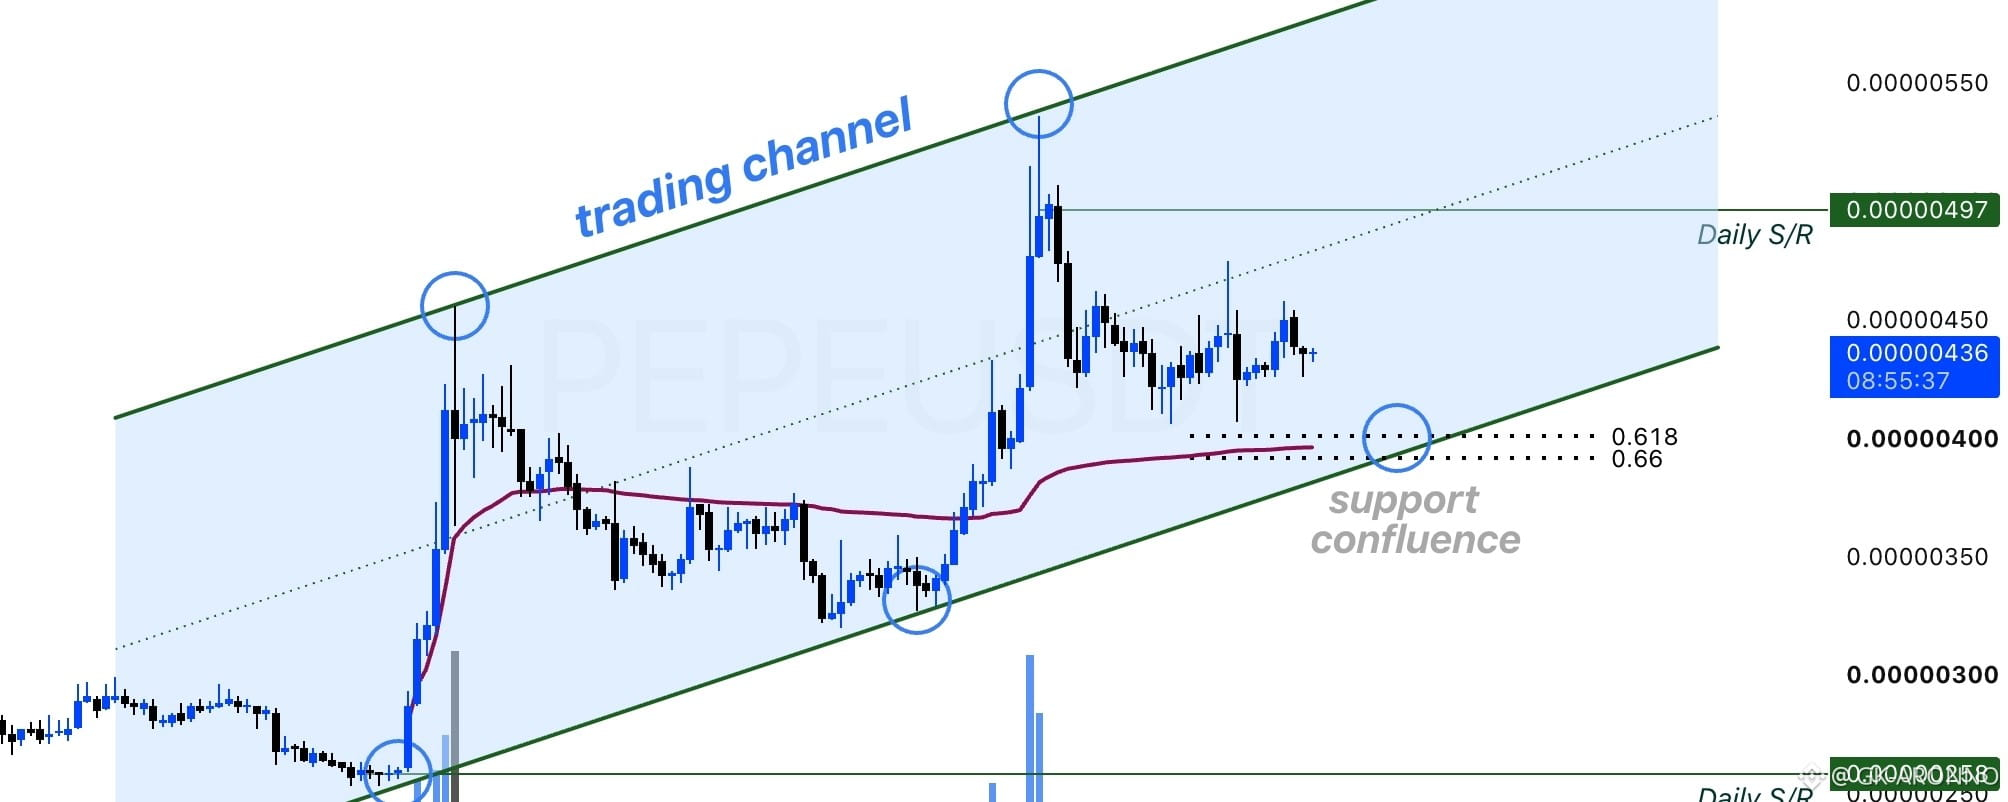
PEPE Channel Support Retest Approaches⭐⭐⭐PEPE price action continues to trade within a well-defined larger trading channel, with price recently rejecting from the upper boundary and now rotating back toward a key support confluence zone.
If price is able to hold above this support region, the current channel structure remains intact, increasing the probability of further rotational price action. A sustained reaction from support could allow price to move back toward the channel midpoint before potentially challenging the upper boundary again.
However, a confirmed breakdown below the current support zone would weaken the existing structure and shift the short-term bias toward further downside. In that scenario, price could rotate toward lower support levels within the broader range as the market searches for another area of demand.
For now, the reaction around the current support remains the key factor. Holding the level would preserve the range-bound structure, while losing it would increase the probability of a deeper correction.
While these levels can provide areas where buyers may respond, price confirmation and market structure should remain the key factors rather than treating any level as certain.
----------------------------------------------------------------------------------------------
UK residents: Don't invest unless you're prepared to lose all the money you invest. This is a high-risk investment and you should not expect to be protected if something goes wrong. Take 2 mins to learn more: coinjar.com/uk/risk-summary
The article is an opinion expressed by the author at a point in time and does not represent the views of CoinJar UK Limited or CoinJar Australia Pty Ltd. Take care to consider the date of this article and be aware that this opinion is based on circumstances at the time of publishing. No responsibility or liability is accepted for any errors of fact or omission expressed therein. Past performance is not a reliable indicator of future results.
This above article is not to be read as investment, legal or tax advice and it takes no account of particular personal or market circumstances; all readers should seek independent investment advice before investing in cryptocurrencies.
We recommend you obtain financial advice before making a decision to use your credit card to purchase cryptoassets or to invest in cryptoassets.In the UK, it's legal to buy, hold, and trade crypto, however cryptocurrency is not regulated in the UK. It's vital to understand that once your money is in the crypto ecosystem, there are no rules to protect it, unlike with regular investments.
You should not expect to be protected if something goes wrong. So, if you make any crypto-related investments, you're unlikely to have recourse to the Financial Services Compensation Scheme (FSCS) or the Financial Ombudsman Service (FOS) if something goes wrong.
----------------------------------------------------------------------------------------------
EU residents: Warning: If you invest in this product, you may lose some, or all, of the money you invest. The value of crypto-assets may rise or fall rapidly. Past performance is not indicative of future results. To learn more see our Risk Disclosures.
CoinJar Europe Limited is authorised by the Central Bank of Ireland as a crypto-asset service provider (registration number C496731)
----------------------------------------------------------------------------------------------
$PEPE
{alpha}(nullnull)
PEPE Channel Support Retest Approaches⭐⭐⭐
PEPE price action continues to trade within a well-defined larger trading channel, with price recently rejecting from the upper boundary and now rotating back toward a key support confluence zone.
If price is able to hold above this support region, the current channel structure remains intact, increasing the probability of further rotational price action. A sustained reaction from support could allow price to move back toward the channel midpoint before potentially challenging the upper boundary again.
However, a confirmed breakdown below the current support zone would weaken the existing structure and shift the short-term bias toward further downside. In that scenario, price could rotate toward lower support levels within the broader range as the market searches for another area of demand.
For now, the reaction around the current support remains the key factor. Holding the level would preserve the range-bound structure, while losing it would increase the probability of a deeper correction.
While these levels can provide areas where buyers may respond, price confirmation and market structure should remain the key factors rather than treating any level as certain.
----------------------------------------------------------------------------------------------
UK residents: Don't invest unless you're prepared to lose all the money you invest. This is a high-risk investment and you should not expect to be protected if something goes wrong. Take 2 mins to learn more: coinjar.com/uk/risk-summary
The article is an opinion expressed by the author at a point in time and does not represent the views of CoinJar UK Limited or CoinJar Australia Pty Ltd. Take care to consider the date of this article and be aware that this opinion is based on circumstances at the time of publishing. No responsibility or liability is accepted for any errors of fact or omission expressed therein. Past performance is not a reliable indicator of future results.
This above article is not to be read as investment, legal or tax advice and it takes no account of particular personal or market circumstances; all readers should seek independent investment advice before investing in cryptocurrencies.
We recommend you obtain financial advice before making a decision to use your credit card to purchase cryptoassets or to invest in cryptoassets.In the UK, it's legal to buy, hold, and trade crypto, however cryptocurrency is not regulated in the UK. It's vital to understand that once your money is in the crypto ecosystem, there are no rules to protect it, unlike with regular investments.
You should not expect to be protected if something goes wrong. So, if you make any crypto-related investments, you're unlikely to have recourse to the Financial Services Compensation Scheme (FSCS) or the Financial Ombudsman Service (FOS) if something goes wrong.
----------------------------------------------------------------------------------------------
EU residents: Warning: If you invest in this product, you may lose some, or all, of the money you invest. The value of crypto-assets may rise or fall rapidly. Past performance is not indicative of future results. To learn more see our Risk Disclosures.
CoinJar Europe Limited is authorised by the Central Bank of Ireland as a crypto-asset service provider (registration number C496731)
----------------------------------------------------------------------------------------------
$PEPE
If price is able to hold above this support region, the current channel structure remains intact, increasing the probability of further rotational price action. A sustained reaction from support could allow price to move back toward the channel midpoint before potentially challenging the upper boundary again.
However, a confirmed breakdown below the current support zone would weaken the existing structure and shift the short-term bias toward further downside. In that scenario, price could rotate toward lower support levels within the broader range as the market searches for another area of demand.
For now, the reaction around the current support remains the key factor. Holding the level would preserve the range-bound structure, while losing it would increase the probability of a deeper correction.
While these levels can provide areas where buyers may respond, price confirmation and market structure should remain the key factors rather than treating any level as certain.
----------------------------------------------------------------------------------------------
UK residents: Don't invest unless you're prepared to lose all the money you invest. This is a high-risk investment and you should not expect to be protected if something goes wrong. Take 2 mins to learn more: coinjar.com/uk/risk-summary
The article is an opinion expressed by the author at a point in time and does not represent the views of CoinJar UK Limited or CoinJar Australia Pty Ltd. Take care to consider the date of this article and be aware that this opinion is based on circumstances at the time of publishing. No responsibility or liability is accepted for any errors of fact or omission expressed therein. Past performance is not a reliable indicator of future results.
This above article is not to be read as investment, legal or tax advice and it takes no account of particular personal or market circumstances; all readers should seek independent investment advice before investing in cryptocurrencies.
We recommend you obtain financial advice before making a decision to use your credit card to purchase cryptoassets or to invest in cryptoassets.In the UK, it's legal to buy, hold, and trade crypto, however cryptocurrency is not regulated in the UK. It's vital to understand that once your money is in the crypto ecosystem, there are no rules to protect it, unlike with regular investments.
You should not expect to be protected if something goes wrong. So, if you make any crypto-related investments, you're unlikely to have recourse to the Financial Services Compensation Scheme (FSCS) or the Financial Ombudsman Service (FOS) if something goes wrong.
----------------------------------------------------------------------------------------------
EU residents: Warning: If you invest in this product, you may lose some, or all, of the money you invest. The value of crypto-assets may rise or fall rapidly. Past performance is not indicative of future results. To learn more see our Risk Disclosures.
CoinJar Europe Limited is authorised by the Central Bank of Ireland as a crypto-asset service provider (registration number C496731)
----------------------------------------------------------------------------------------------
$PEPE
60
·
--
Article
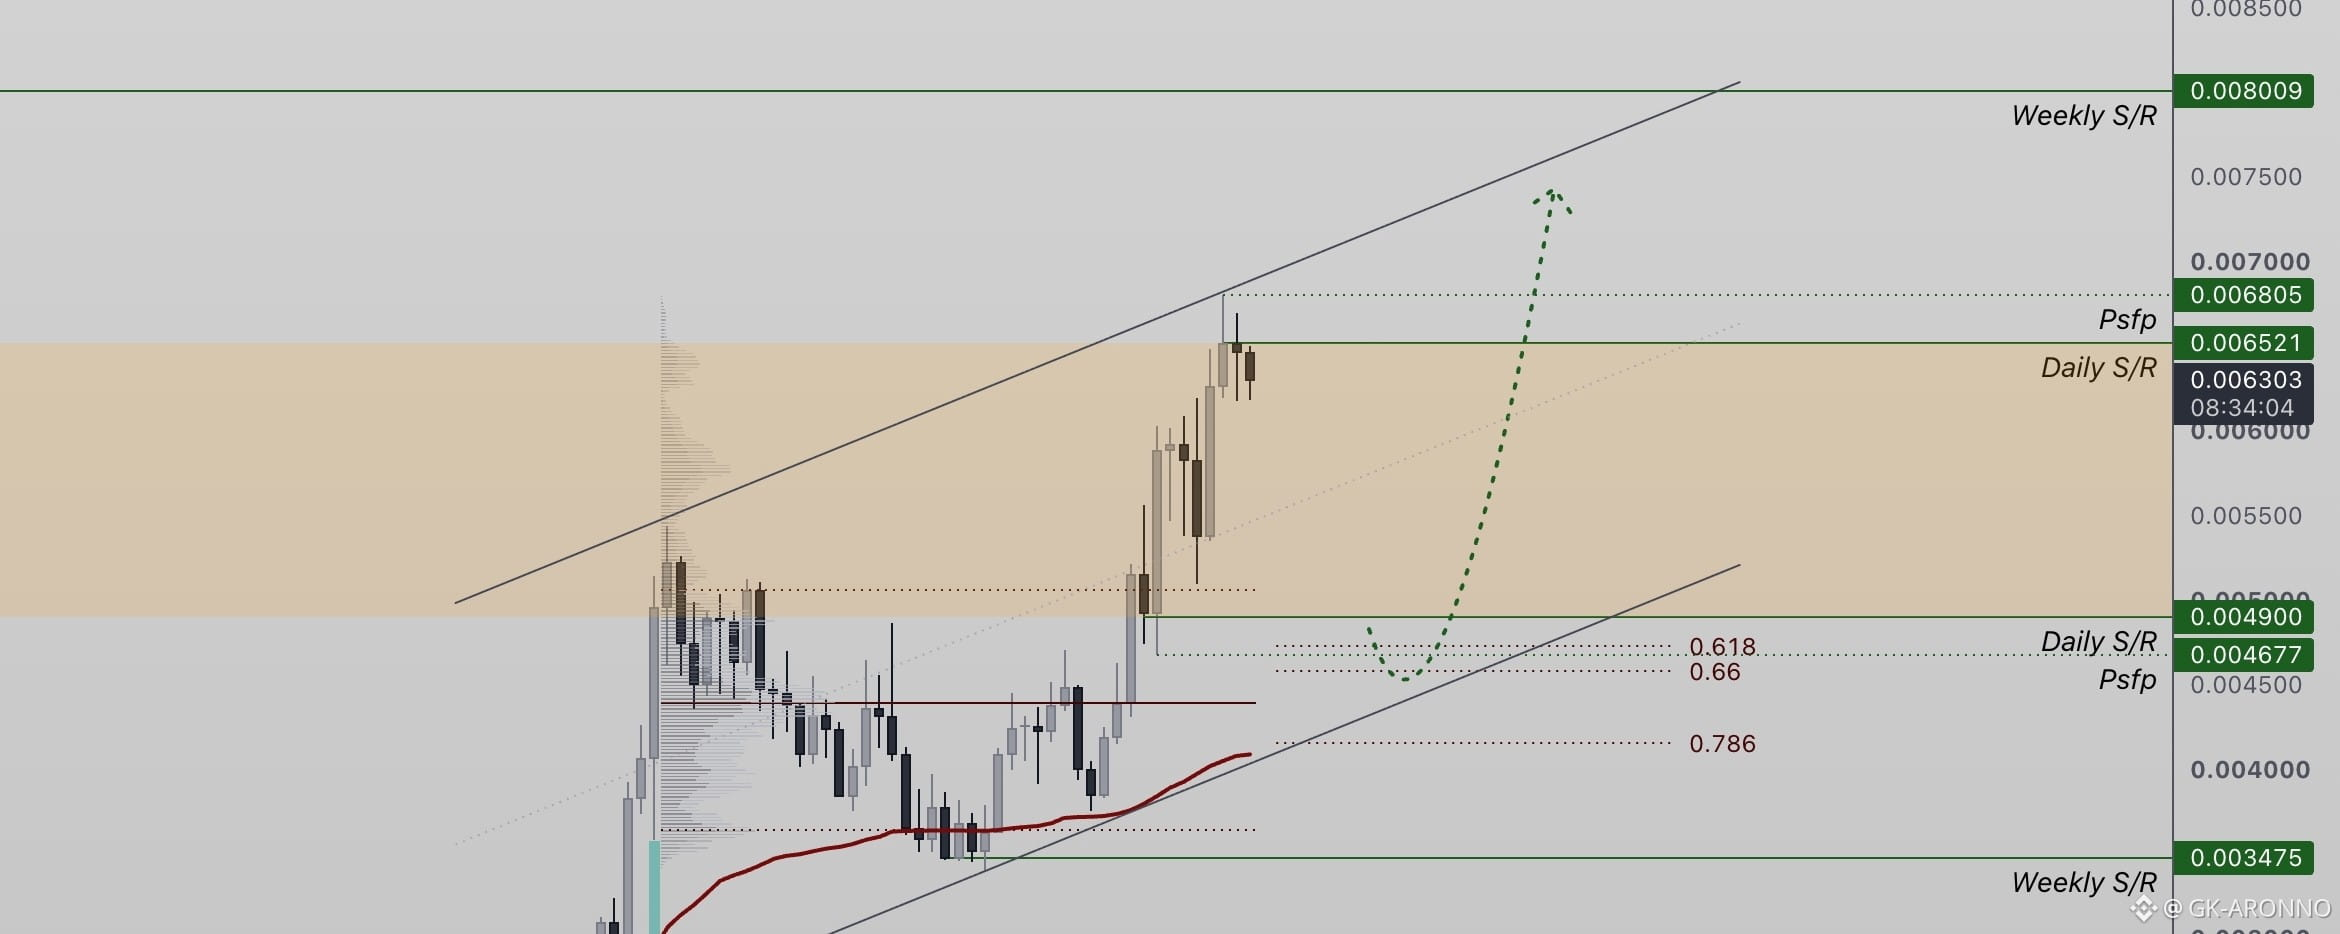
Range High Resistance & Higher-Low Setup🔔🔔🔔PUMP price action is currently trading into range-high resistance, where a new daily resistance level has been established. This region is likely to remain an important area of supply, particularly if price begins showing signs of rejection or weakening momentum.
A correction from the current resistance zone could open the probability of a retest toward daily support, which carries strong technical confluence with the 0.618 Fibonacci retracement and the lower boundary of the established channel. This combination makes the area particularly important for assessing whether buyers remain in control.
If price action holds this support zone and establishes a higher low, it could provide the foundation for another bullish continuation and a potential retest of the range highs. Maintaining the broader channel structure would further support the prevailing bullish trend.
However, price needs to demonstrate sustained demand around support rather than simply touching the level. A decisive breakdown through this confluence zone would weaken the current bullish structure and increase the probability of a deeper retracement.
$PUMP
{future}(PUMPUSDT)
Range High Resistance & Higher-Low Setup🔔🔔🔔
PUMP price action is currently trading into range-high resistance, where a new daily resistance level has been established. This region is likely to remain an important area of supply, particularly if price begins showing signs of rejection or weakening momentum.
A correction from the current resistance zone could open the probability of a retest toward daily support, which carries strong technical confluence with the 0.618 Fibonacci retracement and the lower boundary of the established channel. This combination makes the area particularly important for assessing whether buyers remain in control.
If price action holds this support zone and establishes a higher low, it could provide the foundation for another bullish continuation and a potential retest of the range highs. Maintaining the broader channel structure would further support the prevailing bullish trend.
However, price needs to demonstrate sustained demand around support rather than simply touching the level. A decisive breakdown through this confluence zone would weaken the current bullish structure and increase the probability of a deeper retracement.
$PUMP
A correction from the current resistance zone could open the probability of a retest toward daily support, which carries strong technical confluence with the 0.618 Fibonacci retracement and the lower boundary of the established channel. This combination makes the area particularly important for assessing whether buyers remain in control.
If price action holds this support zone and establishes a higher low, it could provide the foundation for another bullish continuation and a potential retest of the range highs. Maintaining the broader channel structure would further support the prevailing bullish trend.
However, price needs to demonstrate sustained demand around support rather than simply touching the level. A decisive breakdown through this confluence zone would weaken the current bullish structure and increase the probability of a deeper retracement.
$PUMP
85
·
--
Article
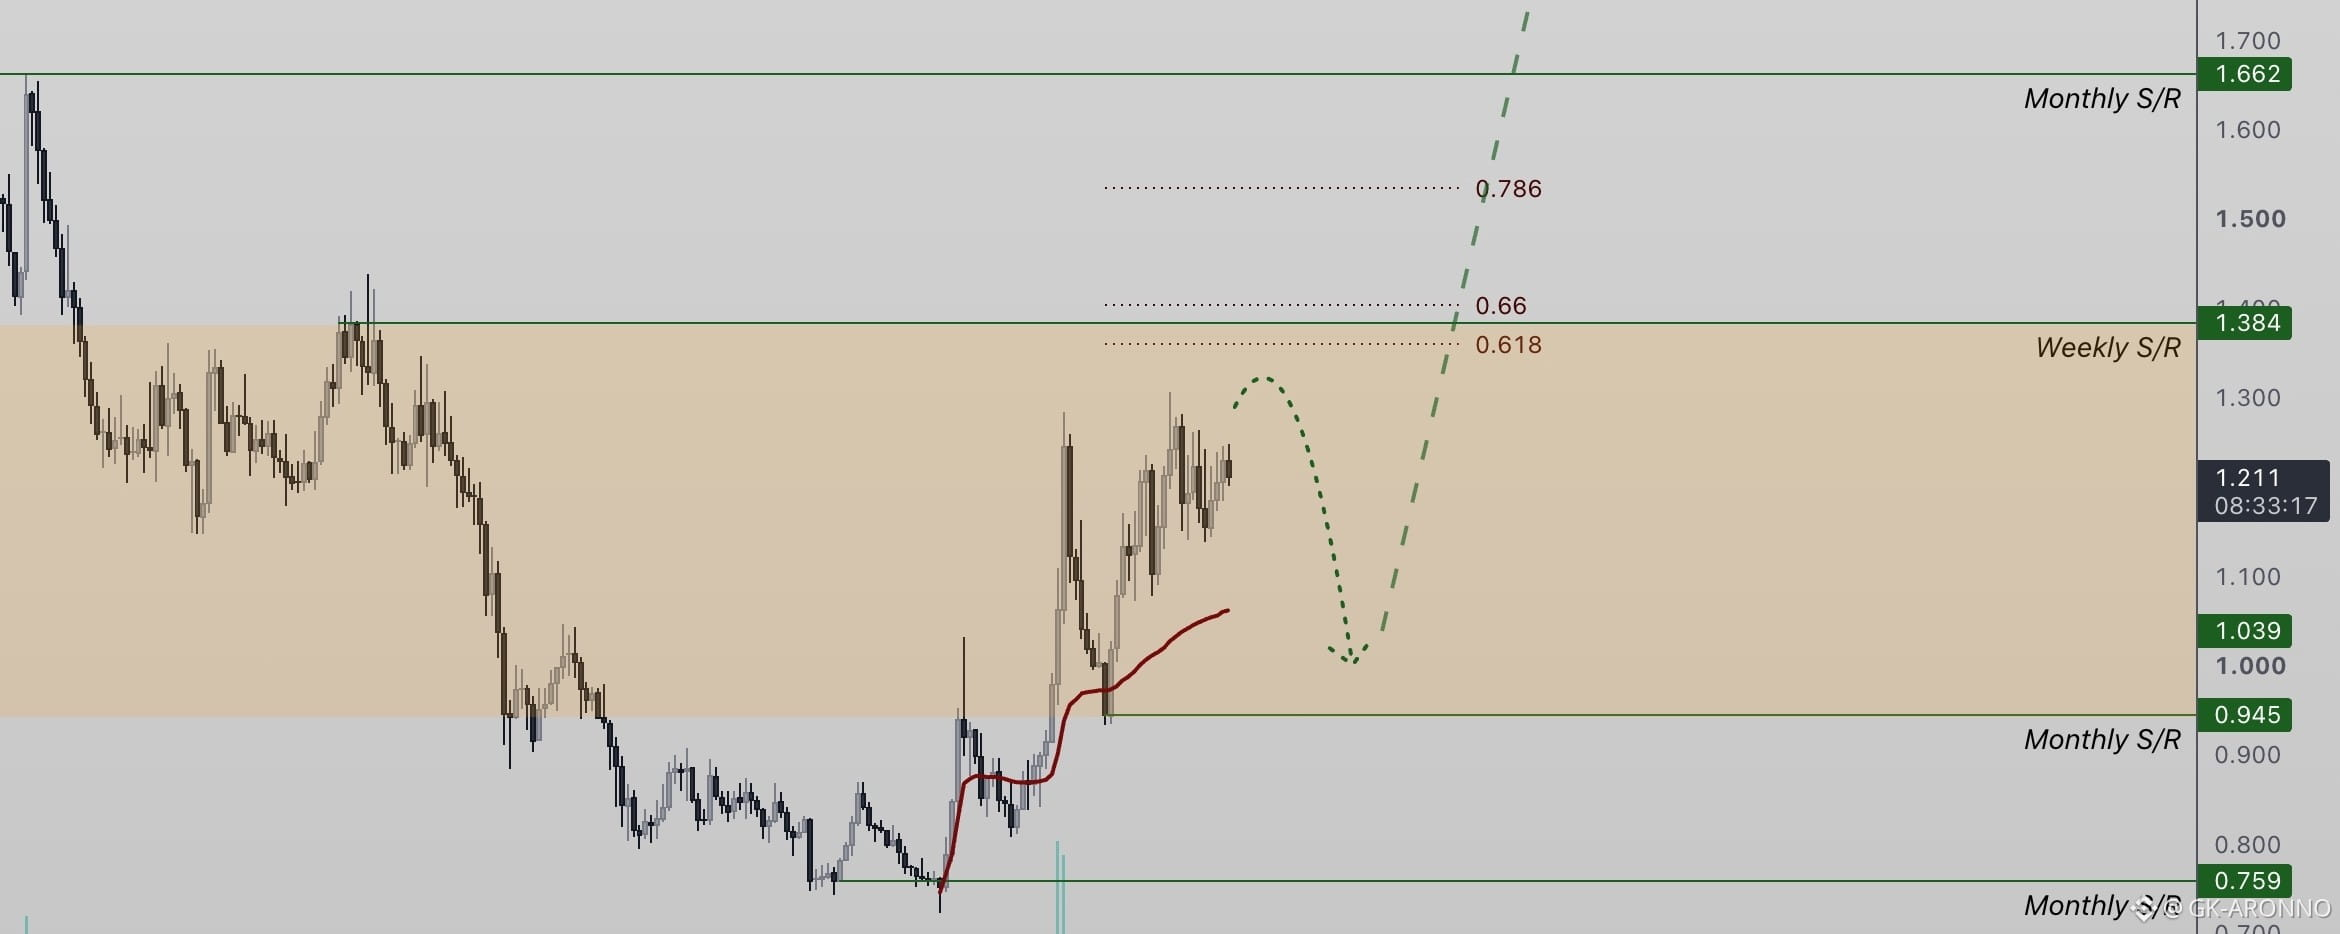
DOT Bullish Structure Holds Above Key Support✅🚀DOT price action continues to maintain a constructive bullish structure, forming consecutive higher highs and higher lows throughout the current rally. This suggests buyers remain in control of the broader short-term trend.
The key level to monitor is $0.94 support. As long as price action remains above this region, the current market structure remains intact and the probability of continued upside increases. From a technical perspective, the formation of a higher low above this support would further strengthen the bullish continuation setup.
If buyers successfully defend $0.94 and price begins to establish another higher high, it could signal that the broader rally is preparing for another expansion toward higher levels.
However, a sustained breakdown below the key support would weaken the current structure and could indicate that the bullish sequence of higher lows is beginning to fail..
$DOT
{future}(DOTUSDT)
DOT Bullish Structure Holds Above Key Support✅🚀
DOT price action continues to maintain a constructive bullish structure, forming consecutive higher highs and higher lows throughout the current rally. This suggests buyers remain in control of the broader short-term trend.
The key level to monitor is $0.94 support. As long as price action remains above this region, the current market structure remains intact and the probability of continued upside increases. From a technical perspective, the formation of a higher low above this support would further strengthen the bullish continuation setup.
If buyers successfully defend $0.94 and price begins to establish another higher high, it could signal that the broader rally is preparing for another expansion toward higher levels.
However, a sustained breakdown below the key support would weaken the current structure and could indicate that the bullish sequence of higher lows is beginning to fail..
$DOT
The key level to monitor is $0.94 support. As long as price action remains above this region, the current market structure remains intact and the probability of continued upside increases. From a technical perspective, the formation of a higher low above this support would further strengthen the bullish continuation setup.
If buyers successfully defend $0.94 and price begins to establish another higher high, it could signal that the broader rally is preparing for another expansion toward higher levels.
However, a sustained breakdown below the key support would weaken the current structure and could indicate that the bullish sequence of higher lows is beginning to fail..
$DOT
73
·
--
Article
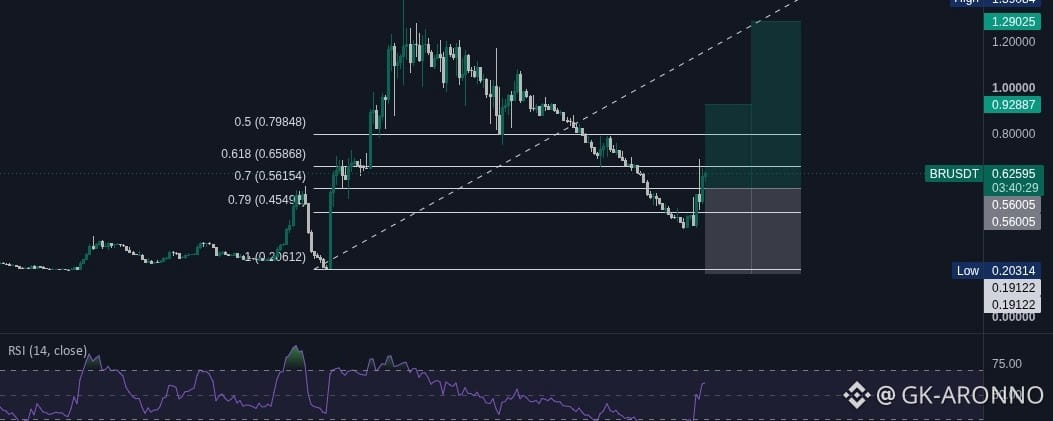
BRUSDT Buy Limit at 0.56154 — Fibonacci Reclaim Setup💥🎯BRUSDT is showing a potential buy-limit setup around the 0.56154 Fibonacci 0.70 level, where price has recently bounced strongly.
📌 Trade Setup:
🟢 Buy Limit: 0.56154
🛑 Stop Loss: 0.56005
🎯 TP1: 0.92887
🚀 TP2: 1.29025
The setup is based on a deep Fibonacci retracement and bullish reaction from the lower support zone.
$BR
{future}(BRUSDT)
BRUSDT Buy Limit at 0.56154 — Fibonacci Reclaim Setup💥🎯
BRUSDT is showing a potential buy-limit setup around the 0.56154 Fibonacci 0.70 level, where price has recently bounced strongly.
📌 Trade Setup:
🟢 Buy Limit: 0.56154
🛑 Stop Loss: 0.56005
🎯 TP1: 0.92887
🚀 TP2: 1.29025
The setup is based on a deep Fibonacci retracement and bullish reaction from the lower support zone.
$BR
📌 Trade Setup:
🟢 Buy Limit: 0.56154
🛑 Stop Loss: 0.56005
🎯 TP1: 0.92887
🚀 TP2: 1.29025
The setup is based on a deep Fibonacci retracement and bullish reaction from the lower support zone.
$BR
87
·
--
Article
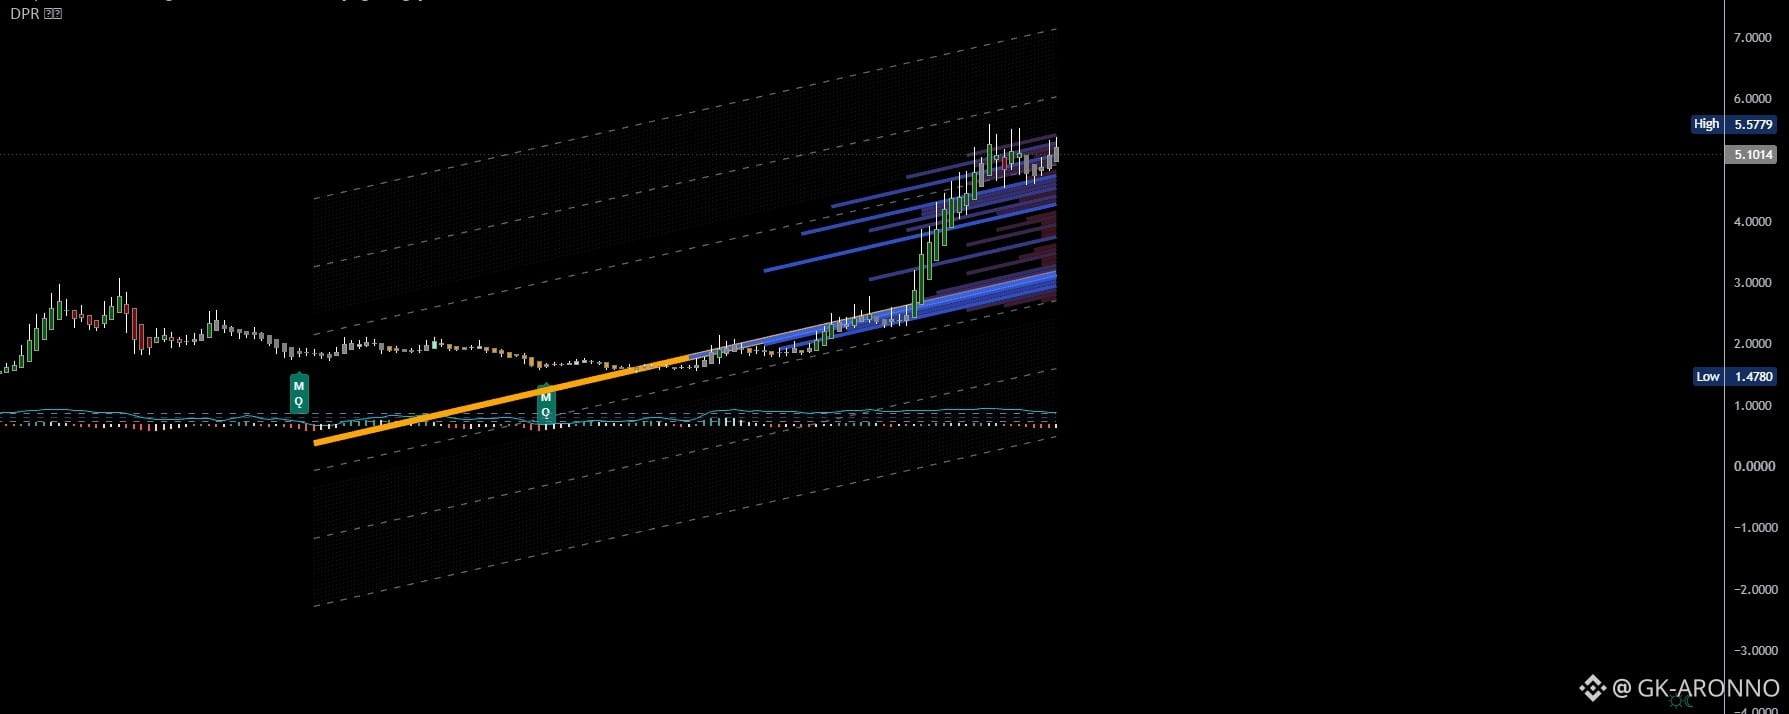
NEAR/USDC, Whale Footprint Confirms the Breakout Setup🔔📣NEAR/USDC is setting up for a momentum breakout on Coinbase Advanced Spot, and the institutional footprint behind it is one of the strongest we've seen on a large-cap asset. Eight out of thirteen detection methods have fired large hidden buy orders, off-exchange accumulation, fake sell walls designed to shake out weak hands, stop-hunt liquidity sweeps, buy volume exceeding sell volume without price movement, overwhelming buyer dominance, multiple whale trades, and classic accumulation patterns all pointing the same way. The buy-side imbalance sits at +45.2%, meaning sellers are getting absorbed rather than just outnumbered, and the 24-hour volume of 36.3M USDC confirms this isn't retail noise. Volume is surging at 3.84x the normal rate, which tells us real participation is behind the move. The 24-hour change sits at +2.1%, so price hasn't run yet despite the heavy accumulation underneath.
The entry sits at 5.11350000 with a take profit at 5.31804000. What matters most from here is whether buyers defend the 5.083 area on the 15-minute EMA, whether the +45.2% imbalance holds as price pushes toward target, and whether volume continues expanding rather than fading. If buyer dominance collapses below that EMA support, the setup weakens quickly.
When whales align at once on an asset with this much liquidity, the accumulation isn't random it's deliberate positioning ahead of a move
$NEAR
{future}(NEARUSDT)
NEAR/USDC, Whale Footprint Confirms the Breakout Setup🔔📣
NEAR/USDC is setting up for a momentum breakout on Coinbase Advanced Spot, and the institutional footprint behind it is one of the strongest we've seen on a large-cap asset. Eight out of thirteen detection methods have fired large hidden buy orders, off-exchange accumulation, fake sell walls designed to shake out weak hands, stop-hunt liquidity sweeps, buy volume exceeding sell volume without price movement, overwhelming buyer dominance, multiple whale trades, and classic accumulation patterns all pointing the same way. The buy-side imbalance sits at +45.2%, meaning sellers are getting absorbed rather than just outnumbered, and the 24-hour volume of 36.3M USDC confirms this isn't retail noise. Volume is surging at 3.84x the normal rate, which tells us real participation is behind the move. The 24-hour change sits at +2.1%, so price hasn't run yet despite the heavy accumulation underneath.
The entry sits at 5.11350000 with a take profit at 5.31804000. What matters most from here is whether buyers defend the 5.083 area on the 15-minute EMA, whether the +45.2% imbalance holds as price pushes toward target, and whether volume continues expanding rather than fading. If buyer dominance collapses below that EMA support, the setup weakens quickly.
When whales align at once on an asset with this much liquidity, the accumulation isn't random it's deliberate positioning ahead of a move
$NEAR
The entry sits at 5.11350000 with a take profit at 5.31804000. What matters most from here is whether buyers defend the 5.083 area on the 15-minute EMA, whether the +45.2% imbalance holds as price pushes toward target, and whether volume continues expanding rather than fading. If buyer dominance collapses below that EMA support, the setup weakens quickly.
When whales align at once on an asset with this much liquidity, the accumulation isn't random it's deliberate positioning ahead of a move
$NEAR
49
·
--
Article
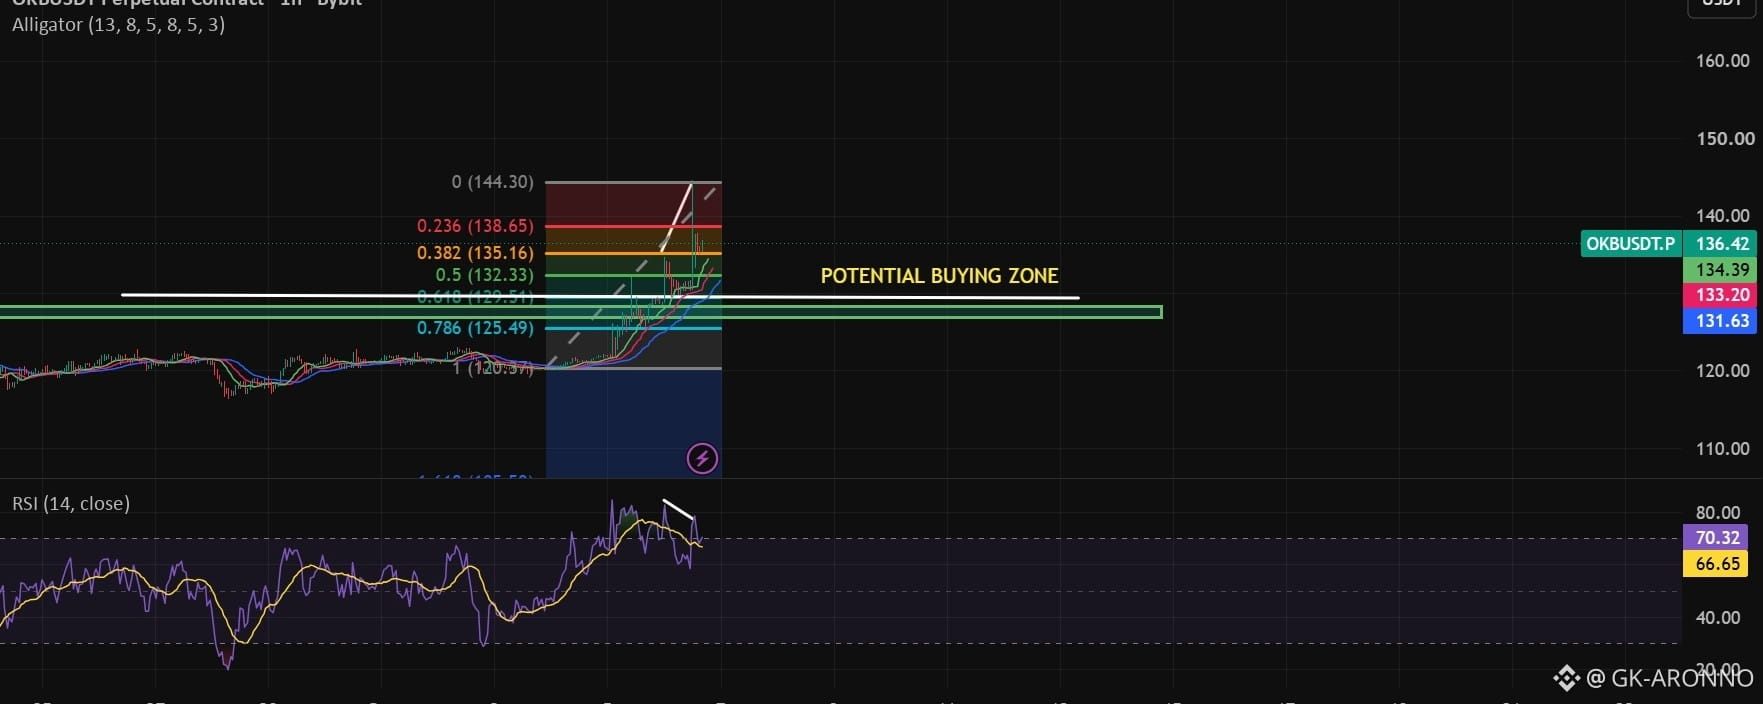
OKBUSDT 1H — Buying the Pullback: Two Zones, One Trigger✅🚀OKB ran 120.37 → 144.30 (~20%) in two days and is now retracing. Price 136.46, holding above all three Alligator lines (jaw 131.63 / teeth 133.19 / lips 134.38). RSI 70.40, above its MA at 66.66 — still bullish, but overbought and cooling.
The move was near-vertical, so I'm treating this as a trend to buy on confirmation, not to chase.
Trigger — both zones: green 1H candle closing above the Alligator lips.
Zone 1 (primary) — 132.33–135.16. The 0.382–0.5 band, stacked with lips, teeth and jaw. Stop below 130.80. Full size.
Zone 2 (secondary) — 125.49–129.51. The 0.618–0.786 band with prior Sept 19–23 structure. This sits below the Alligator, so it only applies if the trend breaks and then reclaims. Half size, stop below the signal candle low.
Invalidation: 4H close below 120.37.
Perp notes: funding is likely elevated after a move this size — holding costs. Watch volume for confirmation. No confirming candle = no trade.
15m over 5m. Five-minute candles on a post-parabolic perp are mostly liquidation noise and wick-hunting. 15m filters enough of it to be usable while still giving you a much earlier entry than 1H.
One extra filter worth adding: require the 15m signal candle to appear while price is inside the zone, not after it has already left. Chasing a reclaim 2 points above the zone with the same 130.80 stop quietly doubles your risk.
Tags: OKB, OKBUSDT, Alligator, Fibonacci, RSI, PriceAction, CryptoAnalysis
Not financial advice.
OKBUSDT 1H — Buying the Pullback: Two Zones, One Trigger✅🚀
OKB ran 120.37 → 144.30 (~20%) in two days and is now retracing. Price 136.46, holding above all three Alligator lines (jaw 131.63 / teeth 133.19 / lips 134.38). RSI 70.40, above its MA at 66.66 — still bullish, but overbought and cooling.
The move was near-vertical, so I'm treating this as a trend to buy on confirmation, not to chase.
Trigger — both zones: green 1H candle closing above the Alligator lips.
Zone 1 (primary) — 132.33–135.16. The 0.382–0.5 band, stacked with lips, teeth and jaw. Stop below 130.80. Full size.
Zone 2 (secondary) — 125.49–129.51. The 0.618–0.786 band with prior Sept 19–23 structure. This sits below the Alligator, so it only applies if the trend breaks and then reclaims. Half size, stop below the signal candle low.
Invalidation: 4H close below 120.37.
Perp notes: funding is likely elevated after a move this size — holding costs. Watch volume for confirmation. No confirming candle = no trade.
15m over 5m. Five-minute candles on a post-parabolic perp are mostly liquidation noise and wick-hunting. 15m filters enough of it to be usable while still giving you a much earlier entry than 1H.
One extra filter worth adding: require the 15m signal candle to appear while price is inside the zone, not after it has already left. Chasing a reclaim 2 points above the zone with the same 130.80 stop quietly doubles your risk.
Tags: OKB, OKBUSDT, Alligator, Fibonacci, RSI, PriceAction, CryptoAnalysis
Not financial advice.
The move was near-vertical, so I'm treating this as a trend to buy on confirmation, not to chase.
Trigger — both zones: green 1H candle closing above the Alligator lips.
Zone 1 (primary) — 132.33–135.16. The 0.382–0.5 band, stacked with lips, teeth and jaw. Stop below 130.80. Full size.
Zone 2 (secondary) — 125.49–129.51. The 0.618–0.786 band with prior Sept 19–23 structure. This sits below the Alligator, so it only applies if the trend breaks and then reclaims. Half size, stop below the signal candle low.
Invalidation: 4H close below 120.37.
Perp notes: funding is likely elevated after a move this size — holding costs. Watch volume for confirmation. No confirming candle = no trade.
15m over 5m. Five-minute candles on a post-parabolic perp are mostly liquidation noise and wick-hunting. 15m filters enough of it to be usable while still giving you a much earlier entry than 1H.
One extra filter worth adding: require the 15m signal candle to appear while price is inside the zone, not after it has already left. Chasing a reclaim 2 points above the zone with the same 130.80 stop quietly doubles your risk.
Tags: OKB, OKBUSDT, Alligator, Fibonacci, RSI, PriceAction, CryptoAnalysis
Not financial advice.
27
·
--
Article
ONDO at Make-or-Break Support — Rally Next🔔🎯💥are you ready for #ONDO’s next major move, or will this critical support fail before bulls can take control?
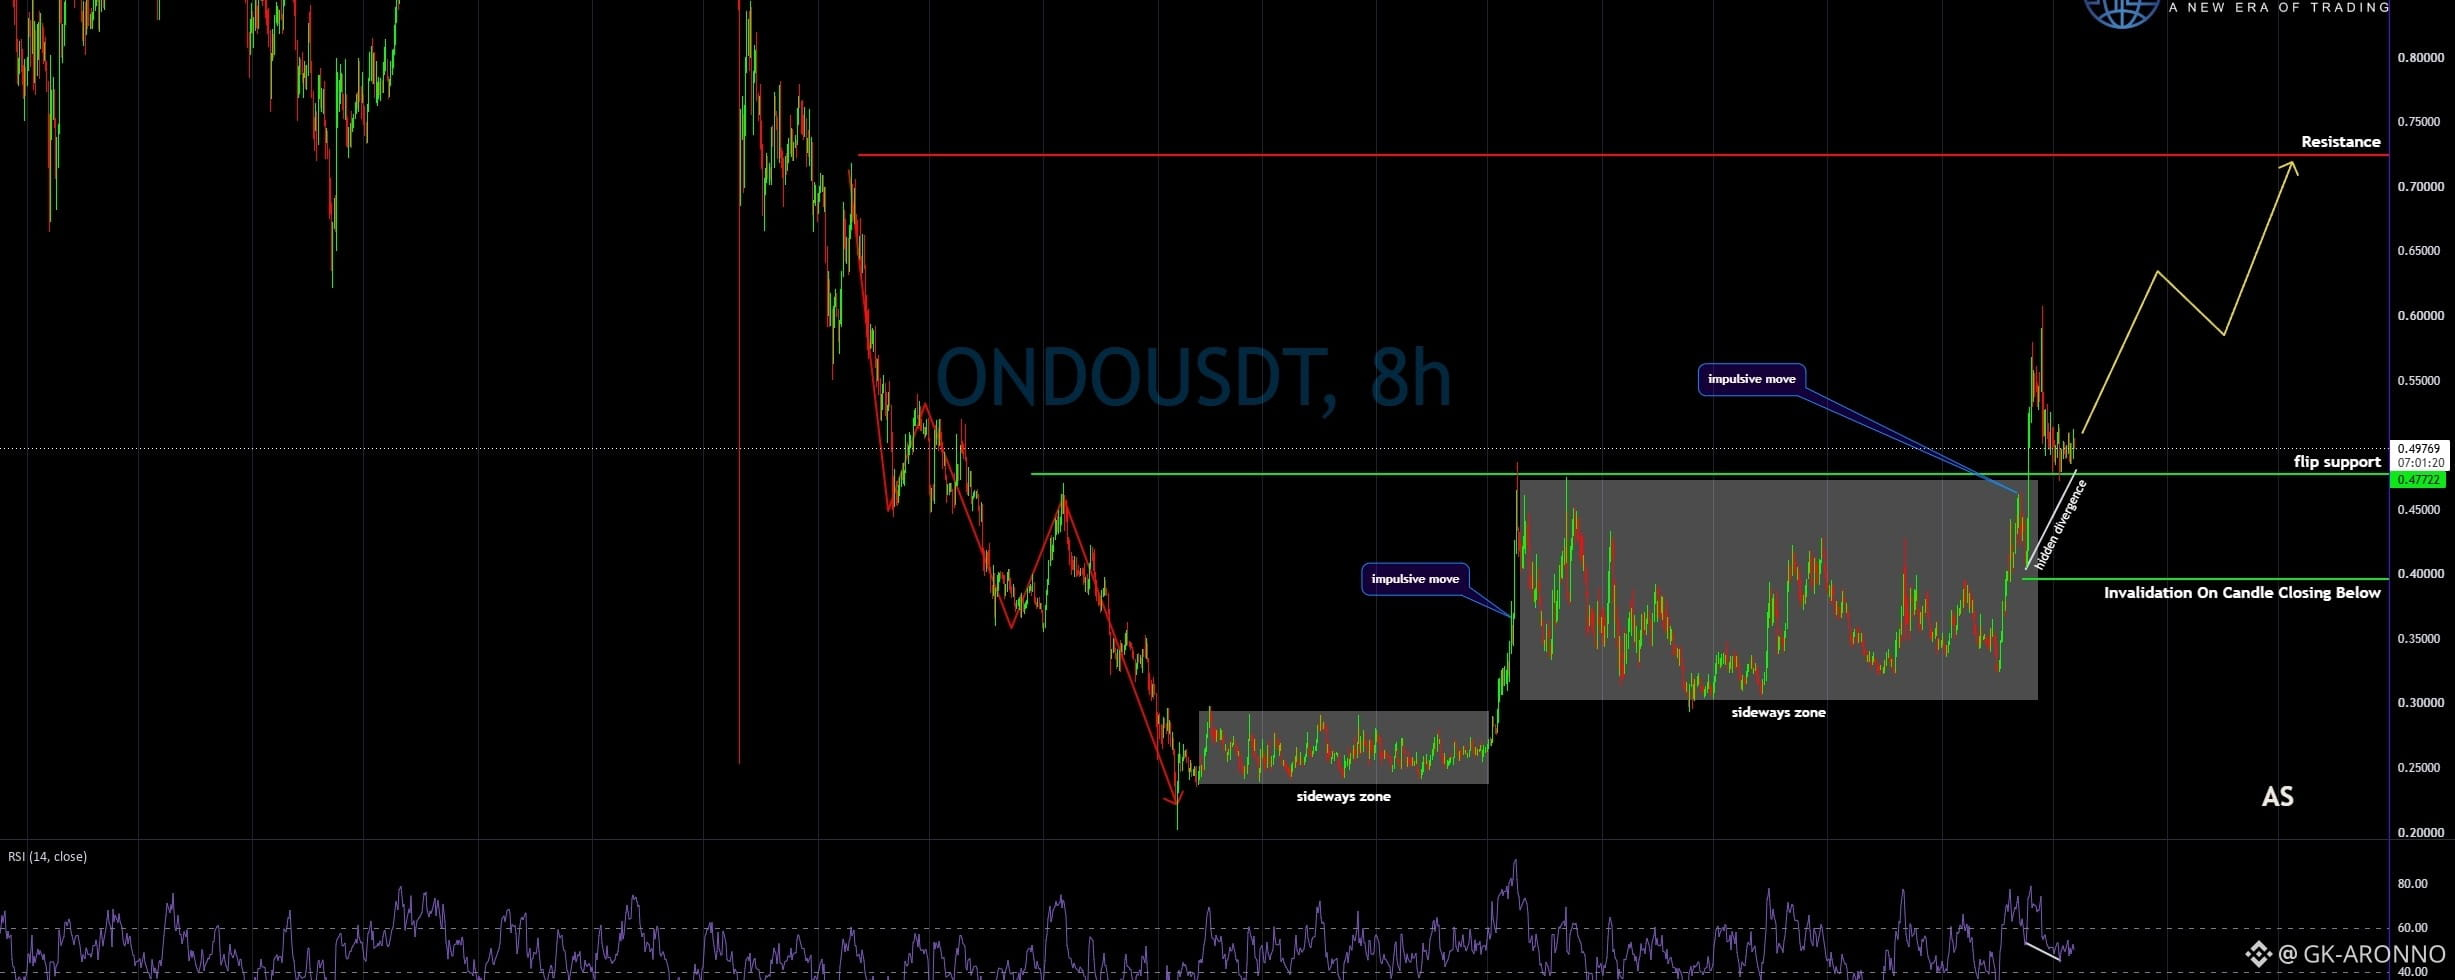
💎#ONDO has finally broken out of the large sideways structure that kept price trapped for several months. After the breakout, price delivered a strong impulsive move toward the $0.55-$0.60 region and is now pulling back toward one of the most important levels on the chart.
💎The key area we are watching is around $0.477. This former resistance has now turned into potential support, creating a classic resistance-to-support flip. As long as #ONDO continues holding above this area, the broader bullish structure remains intact.
💎What makes this setup even more interesting is the hidden bullish divergence developing around the pullback. Price is maintaining a higher-low structure while momentum has cooled down, which can indicate that buyers are quietly regaining strength before another expansion.
💎If the $0.477 support continues to hold and buyers confirm their strength, #ONDO could begin another impulsive move higher. The first major expansion could take price back toward the recent highs, while the larger technical target remains around the $0.70-$0.72 resistance zone.
💎However, we cannot ignore the invalidation level. A confirmed candle close below approximately $0.40 would significantly weaken this bullish structure and invalidate the current continuation scenario. Until that happens, the pullback can still be treated as a healthy retest rather than an immediate bearish reversal.
💎The important part now is not chasing ONDO after an impulsive candle. The highest-probability opportunities usually come when price confirms support and gives traders a clearly defined invalidation level. That is where patience and proper risk management become much more important than FOMO.
Strive for consistency Paradisers, not quick profits. Treat the market as a businessman, not as a gambler. Discipline, patience, and proper risk management are what keep traders inside the winner circle.
$ONDO
{future}(ONDOUSDT)
ONDO at Make-or-Break Support — Rally Next🔔🎯💥
are you ready for #ONDO’s next major move, or will this critical support fail before bulls can take control?
💎#ONDO has finally broken out of the large sideways structure that kept price trapped for several months. After the breakout, price delivered a strong impulsive move toward the $0.55-$0.60 region and is now pulling back toward one of the most important levels on the chart.
💎The key area we are watching is around $0.477. This former resistance has now turned into potential support, creating a classic resistance-to-support flip. As long as #ONDO continues holding above this area, the broader bullish structure remains intact.
💎What makes this setup even more interesting is the hidden bullish divergence developing around the pullback. Price is maintaining a higher-low structure while momentum has cooled down, which can indicate that buyers are quietly regaining strength before another expansion.
💎If the $0.477 support continues to hold and buyers confirm their strength, #ONDO could begin another impulsive move higher. The first major expansion could take price back toward the recent highs, while the larger technical target remains around the $0.70-$0.72 resistance zone.
💎However, we cannot ignore the invalidation level. A confirmed candle close below approximately $0.40 would significantly weaken this bullish structure and invalidate the current continuation scenario. Until that happens, the pullback can still be treated as a healthy retest rather than an immediate bearish reversal.
💎The important part now is not chasing ONDO after an impulsive candle. The highest-probability opportunities usually come when price confirms support and gives traders a clearly defined invalidation level. That is where patience and proper risk management become much more important than FOMO.
Strive for consistency Paradisers, not quick profits. Treat the market as a businessman, not as a gambler. Discipline, patience, and proper risk management are what keep traders inside the winner circle.
$ONDO
💎#ONDO has finally broken out of the large sideways structure that kept price trapped for several months. After the breakout, price delivered a strong impulsive move toward the $0.55-$0.60 region and is now pulling back toward one of the most important levels on the chart.
💎The key area we are watching is around $0.477. This former resistance has now turned into potential support, creating a classic resistance-to-support flip. As long as #ONDO continues holding above this area, the broader bullish structure remains intact.
💎What makes this setup even more interesting is the hidden bullish divergence developing around the pullback. Price is maintaining a higher-low structure while momentum has cooled down, which can indicate that buyers are quietly regaining strength before another expansion.
💎If the $0.477 support continues to hold and buyers confirm their strength, #ONDO could begin another impulsive move higher. The first major expansion could take price back toward the recent highs, while the larger technical target remains around the $0.70-$0.72 resistance zone.
💎However, we cannot ignore the invalidation level. A confirmed candle close below approximately $0.40 would significantly weaken this bullish structure and invalidate the current continuation scenario. Until that happens, the pullback can still be treated as a healthy retest rather than an immediate bearish reversal.
💎The important part now is not chasing ONDO after an impulsive candle. The highest-probability opportunities usually come when price confirms support and gives traders a clearly defined invalidation level. That is where patience and proper risk management become much more important than FOMO.
Strive for consistency Paradisers, not quick profits. Treat the market as a businessman, not as a gambler. Discipline, patience, and proper risk management are what keep traders inside the winner circle.
$ONDO
84
·
--
Article
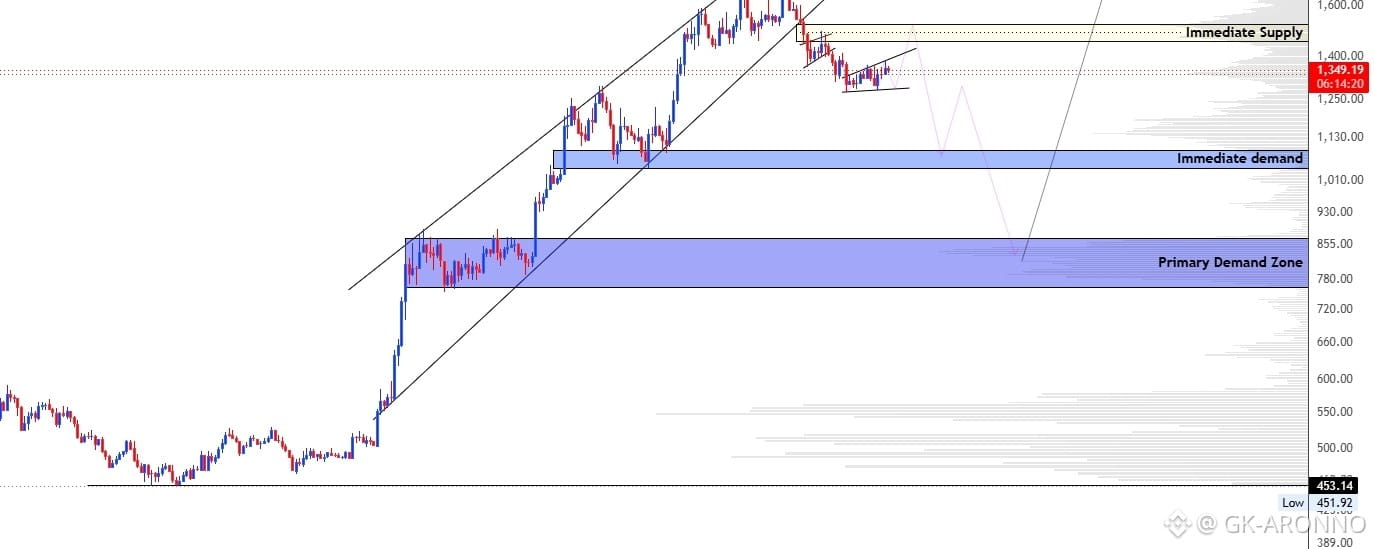
ZEC Rising Wedge Breakdown: Is a Deeper Correction Coming?p🚀🚀🚀ZEC is showing a notable shift in structure after breaking below its rising wedge, following a strong expansion into the $1,600+ region. What makes this setup more interesting is the bearish RSI divergence formed at the highs. While price pushed to a higher high, RSI produced a lower high, signalling weakening momentum before the breakdown.
Price is now consolidating below the broken structure. A recovery toward the $1,430–$1,480 Immediate Supply could act as a pullback into resistance before another bearish leg develops. If supply rejects price, the first major downside area sits around the $1,030–$1,080 Immediate Demand. Failure to hold that zone could expose the deeper $775–$850 Primary Demand Zone.
The bearish thesis weakens if ZEC reclaims $1,693, as that would place price back above the major resistance structure.
Will ZEC retest supply before the next correction, or will buyers reclaim the structure?
$ZEC
{future}(ZECUSDT)
ZEC Rising Wedge Breakdown: Is a Deeper Correction Coming?p🚀🚀🚀
ZEC is showing a notable shift in structure after breaking below its rising wedge, following a strong expansion into the $1,600+ region. What makes this setup more interesting is the bearish RSI divergence formed at the highs. While price pushed to a higher high, RSI produced a lower high, signalling weakening momentum before the breakdown.
Price is now consolidating below the broken structure. A recovery toward the $1,430–$1,480 Immediate Supply could act as a pullback into resistance before another bearish leg develops. If supply rejects price, the first major downside area sits around the $1,030–$1,080 Immediate Demand. Failure to hold that zone could expose the deeper $775–$850 Primary Demand Zone.
The bearish thesis weakens if ZEC reclaims $1,693, as that would place price back above the major resistance structure.
Will ZEC retest supply before the next correction, or will buyers reclaim the structure?
$ZEC
Price is now consolidating below the broken structure. A recovery toward the $1,430–$1,480 Immediate Supply could act as a pullback into resistance before another bearish leg develops. If supply rejects price, the first major downside area sits around the $1,030–$1,080 Immediate Demand. Failure to hold that zone could expose the deeper $775–$850 Primary Demand Zone.
The bearish thesis weakens if ZEC reclaims $1,693, as that would place price back above the major resistance structure.
Will ZEC retest supply before the next correction, or will buyers reclaim the structure?
$ZEC
143
·
--
Article
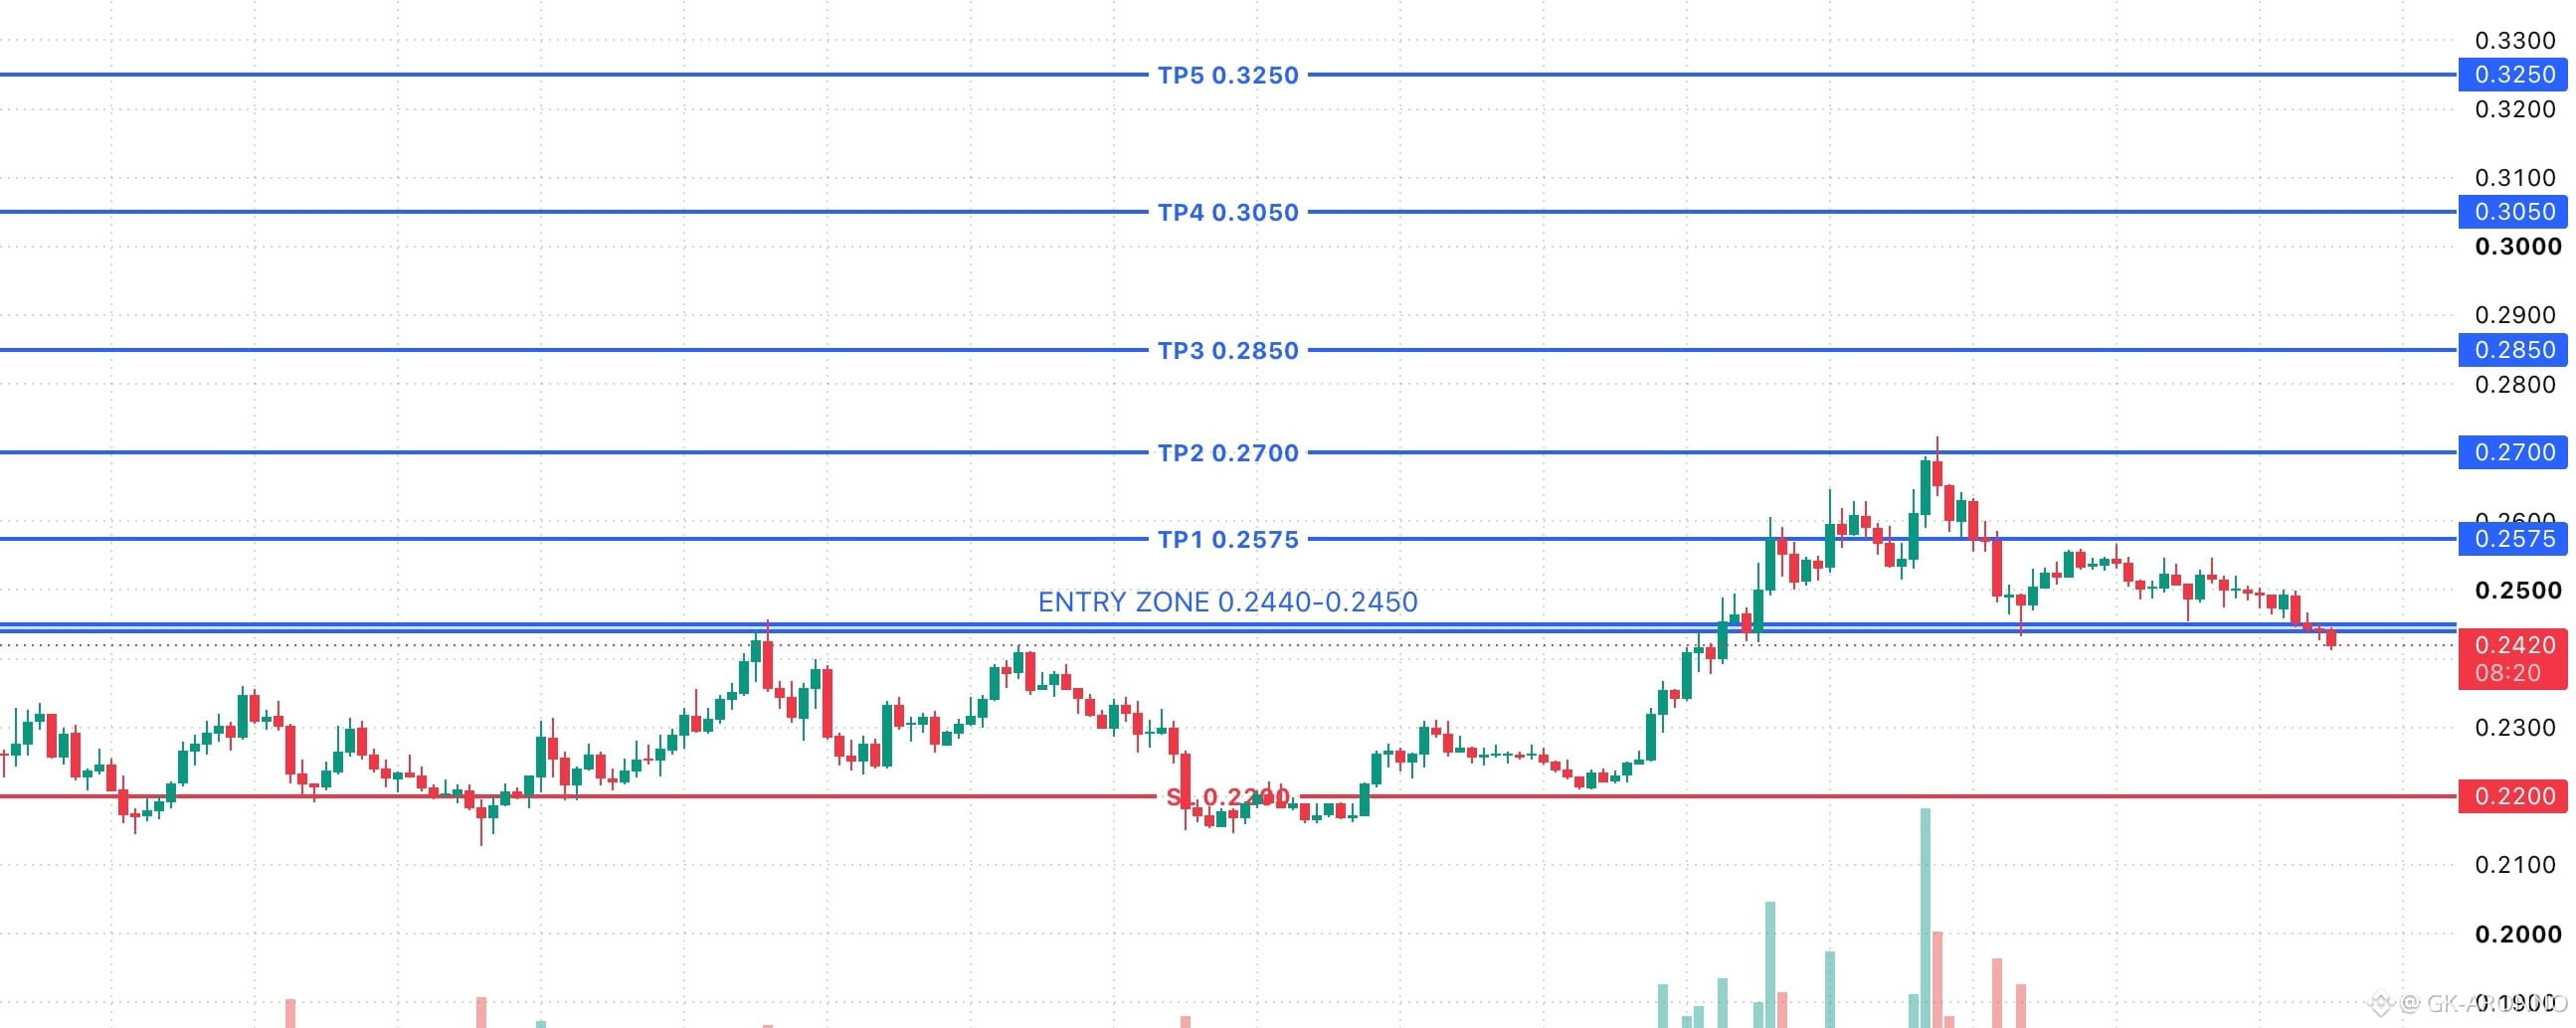
FET/USDT long — Signal #073📣✅Signal #073
LONG FET/USDT
Entry: 0.2440 – 0.2450 (limit order)
SL: 0.2200
TP: 0.2575 / 0.2700 / 0.2850 / 0.3050 / 0.3250 / 0.3450
The entry zone was already reached at 15:50 UTC, before this post
$FET
{future}(FETUSDT)
FET/USDT long — Signal #073📣✅
Signal #073
LONG FET/USDT
Entry: 0.2440 – 0.2450 (limit order)
SL: 0.2200
TP: 0.2575 / 0.2700 / 0.2850 / 0.3050 / 0.3250 / 0.3450
The entry zone was already reached at 15:50 UTC, before this post
$FET
LONG FET/USDT
Entry: 0.2440 – 0.2450 (limit order)
SL: 0.2200
TP: 0.2575 / 0.2700 / 0.2850 / 0.3050 / 0.3250 / 0.3450
The entry zone was already reached at 15:50 UTC, before this post
$FET
1
130
·
--
Article
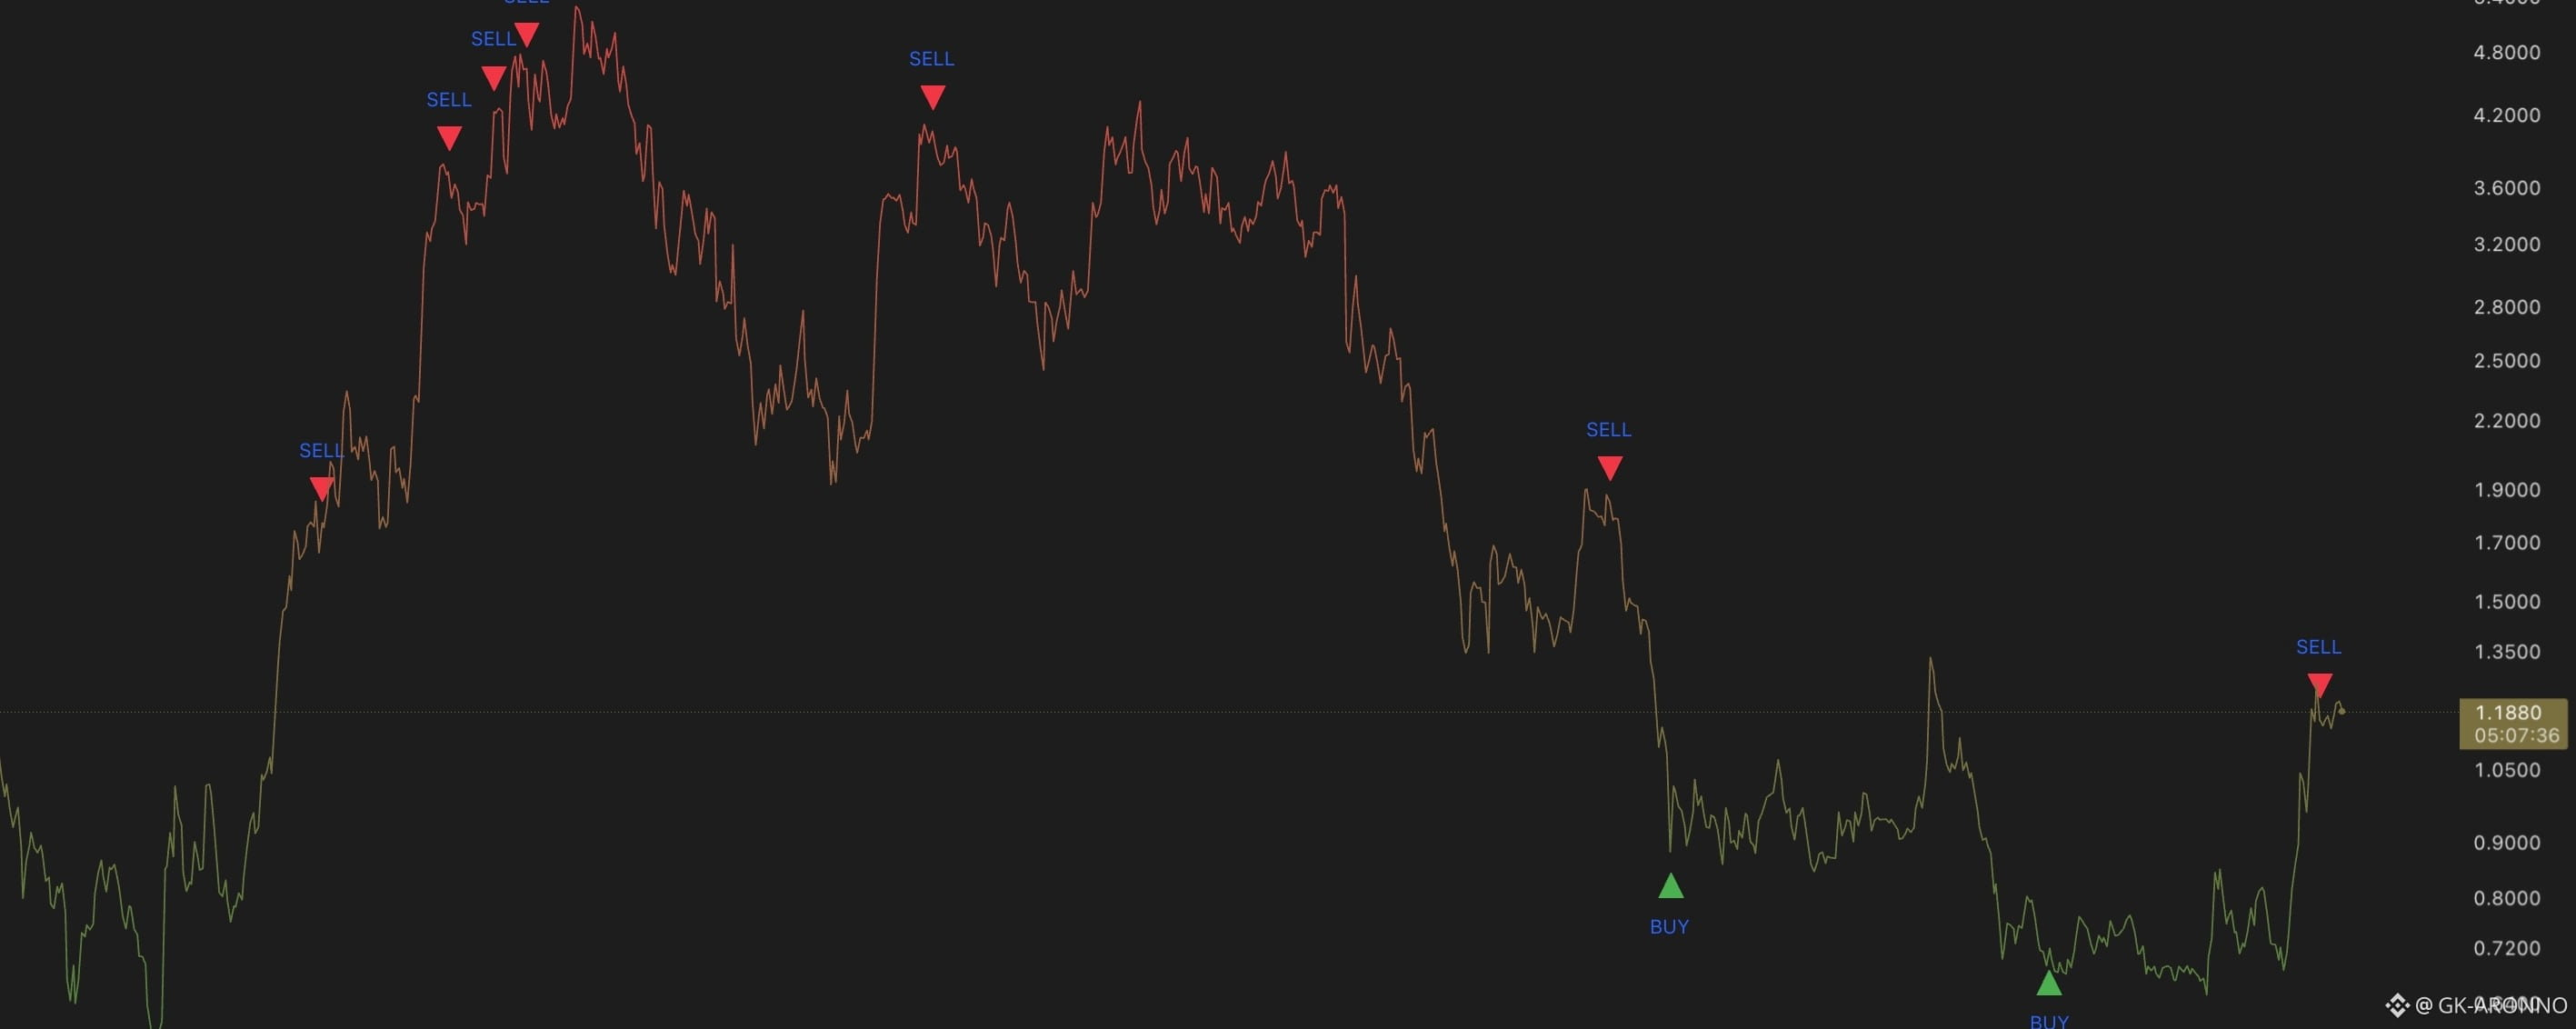
SUI - Daily: VDS just flashed a SEll🔔🎇🔔A solid VDS setup is developing on the SUI daily chart.
It’s not a perfect setup, but the majority of historical signals have been remarkably clean. The setup has managed to catch most of the major tops and bottoms on SUI, which makes the current signal worth paying attention to.
A new SELL signal has just appeared.
Considering the current state of the broader market, the signal looks well justified. Of course, VDS is not a crystal ball, and no single signal should be traded blindly. But when the current setup is supported by what we can see in its own history, it can become a useful piece of the decision-making process.
SUI is now at another interesting point.
Watch how this one develops.
$SUI
{future}(SUIUSDT)
SUI - Daily: VDS just flashed a SEll🔔🎇🔔
A solid VDS setup is developing on the SUI daily chart.
It’s not a perfect setup, but the majority of historical signals have been remarkably clean. The setup has managed to catch most of the major tops and bottoms on SUI, which makes the current signal worth paying attention to.
A new SELL signal has just appeared.
Considering the current state of the broader market, the signal looks well justified. Of course, VDS is not a crystal ball, and no single signal should be traded blindly. But when the current setup is supported by what we can see in its own history, it can become a useful piece of the decision-making process.
SUI is now at another interesting point.
Watch how this one develops.
$SUI
It’s not a perfect setup, but the majority of historical signals have been remarkably clean. The setup has managed to catch most of the major tops and bottoms on SUI, which makes the current signal worth paying attention to.
A new SELL signal has just appeared.
Considering the current state of the broader market, the signal looks well justified. Of course, VDS is not a crystal ball, and no single signal should be traded blindly. But when the current setup is supported by what we can see in its own history, it can become a useful piece of the decision-making process.
SUI is now at another interesting point.
Watch how this one develops.
$SUI
92
·
--
Article
MARSCOIN pumping soon🚀⚡Hello Traders,
Sharing a quick look at MARSCOIN.
I've spotted multiple BULLISH signals lining up:
1-Breakout: Cleared the mid-range downward trendline.
2-Fakeout / Bear Trap: A false breakdown below the primary bullish trendline—price closed below support, then quickly reclaimed it.
3-Divergence: Bullish divergence confirmed across both the 1h and 4h timeframes.
4-Volume: Steady increase in buying volume.
5-Daily Confirmation: If today’s daily candle closes around current levels, it will confirm a fake breakdown designed to shake out weak hands on the higher timeframe.
What to Expect?
Expecting continuation tomorrow if today's candle closes above $0.1078.
Key Level: A clean break above $0.1150 will initiate the move toward our targets:
SL: 0.1020 (10%)
Target 1: $0.1250 (+10%)
Target 2: $0.1330 (+17%)
Target 3: $0.1415 (+24%)
Moon Target: $0.2100 (+67% if FOMO kicks in)
Hopefully it plays out well.
DYOR
NFA
6 hours ago
Note
Looking for long position either after breaking 0.1150 with 4h candle close above or buying at support level.
$MarsCoin
{future}(MARSCOINUSDT)
MARSCOIN pumping soon🚀⚡
Hello Traders,
Sharing a quick look at MARSCOIN.
I've spotted multiple BULLISH signals lining up:
1-Breakout: Cleared the mid-range downward trendline.
2-Fakeout / Bear Trap: A false breakdown below the primary bullish trendline—price closed below support, then quickly reclaimed it.
3-Divergence: Bullish divergence confirmed across both the 1h and 4h timeframes.
4-Volume: Steady increase in buying volume.
5-Daily Confirmation: If today’s daily candle closes around current levels, it will confirm a fake breakdown designed to shake out weak hands on the higher timeframe.
What to Expect?
Expecting continuation tomorrow if today's candle closes above $0.1078.
Key Level: A clean break above $0.1150 will initiate the move toward our targets:
SL: 0.1020 (10%)
Target 1: $0.1250 (+10%)
Target 2: $0.1330 (+17%)
Target 3: $0.1415 (+24%)
Moon Target: $0.2100 (+67% if FOMO kicks in)
Hopefully it plays out well.
DYOR
NFA
6 hours ago
Note
Looking for long position either after breaking 0.1150 with 4h candle close above or buying at support level.
$MarsCoin
Sharing a quick look at MARSCOIN.
I've spotted multiple BULLISH signals lining up:
1-Breakout: Cleared the mid-range downward trendline.
2-Fakeout / Bear Trap: A false breakdown below the primary bullish trendline—price closed below support, then quickly reclaimed it.
3-Divergence: Bullish divergence confirmed across both the 1h and 4h timeframes.
4-Volume: Steady increase in buying volume.
5-Daily Confirmation: If today’s daily candle closes around current levels, it will confirm a fake breakdown designed to shake out weak hands on the higher timeframe.
What to Expect?
Expecting continuation tomorrow if today's candle closes above $0.1078.
Key Level: A clean break above $0.1150 will initiate the move toward our targets:
SL: 0.1020 (10%)
Target 1: $0.1250 (+10%)
Target 2: $0.1330 (+17%)
Target 3: $0.1415 (+24%)
Moon Target: $0.2100 (+67% if FOMO kicks in)
Hopefully it plays out well.
DYOR
NFA
6 hours ago
Note
Looking for long position either after breaking 0.1150 with 4h candle close above or buying at support level.
$MarsCoin
88
·
--
Article
PARTIUSDT 3Dpp💫💫💫#PARTI is moving inside a descending channel on the 3-day chart. Volume has increased, which is promising. In case of a breakout above the channel resistance and the 3-day EMA50, the potential upside targets are:
🎯 $0.0482
🎯 $0.0653
🎯 $0.0791
🎯 $0.0928
🎯 $0.1124
🎯 $0.1374
⚠️ Always remember to use a tight stop-loss and maintain proper risk management.
.$PARTI
{future}(PARTIUSDT)
PARTIUSDT 3Dpp💫💫💫
#PARTI is moving inside a descending channel on the 3-day chart. Volume has increased, which is promising. In case of a breakout above the channel resistance and the 3-day EMA50, the potential upside targets are:
🎯 $0.0482
🎯 $0.0653
🎯 $0.0791
🎯 $0.0928
🎯 $0.1124
🎯 $0.1374
⚠️ Always remember to use a tight stop-loss and maintain proper risk management.
.$PARTI
🎯 $0.0482
🎯 $0.0653
🎯 $0.0791
🎯 $0.0928
🎯 $0.1124
🎯 $0.1374
⚠️ Always remember to use a tight stop-loss and maintain proper risk management.
.$PARTI
1
121
·
--
Article
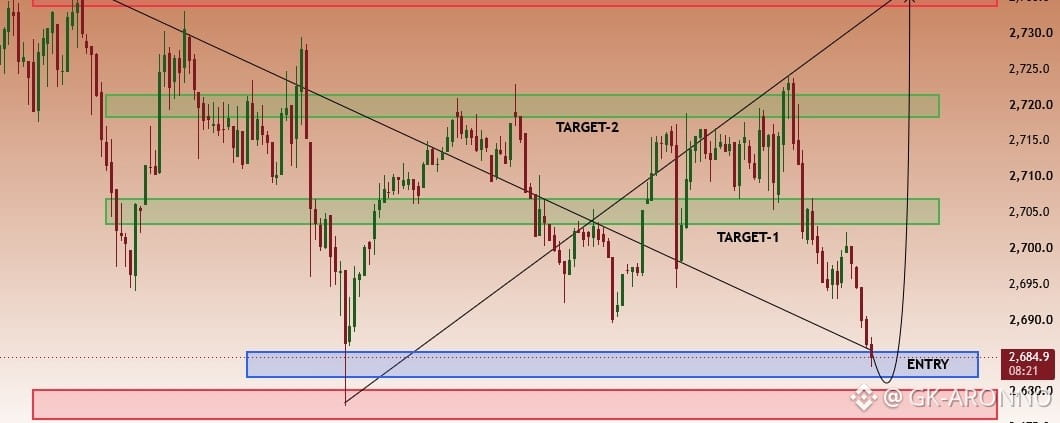
ETHUSD | Demand Zone Reversal Setup | 15M Bullish Scenario✅📣📊 ETHUSD 15M Analysis
Ethereum has reached a key demand zone around 2681-2685, an area where buyers may step in after the recent decline.
The current structure suggests a potential bullish reaction from support if price successfully holds this zone. The idea is based on:
✅ Strong demand/support area
✅ Previous intraday reaction zone
✅ Potential liquidity sweep into support
✅ Recovery toward nearby resistance levels
🎯 Targets
• Target 1: 2705
• Target 2: 2720
• Target 3: 2735
⚠️ Invalidation occurs if price fails to hold the highlighted demand zone.
Note: This is an educational market outlook based on current price structure and should be used alongside your own risk management and analysis.
$ETH
{future}(ETHUSDT)
ETHUSD | Demand Zone Reversal Setup | 15M Bullish Scenario✅📣
📊 ETHUSD 15M Analysis
Ethereum has reached a key demand zone around 2681-2685, an area where buyers may step in after the recent decline.
The current structure suggests a potential bullish reaction from support if price successfully holds this zone. The idea is based on:
✅ Strong demand/support area
✅ Previous intraday reaction zone
✅ Potential liquidity sweep into support
✅ Recovery toward nearby resistance levels
🎯 Targets
• Target 1: 2705
• Target 2: 2720
• Target 3: 2735
⚠️ Invalidation occurs if price fails to hold the highlighted demand zone.
Note: This is an educational market outlook based on current price structure and should be used alongside your own risk management and analysis.
$ETH
Ethereum has reached a key demand zone around 2681-2685, an area where buyers may step in after the recent decline.
The current structure suggests a potential bullish reaction from support if price successfully holds this zone. The idea is based on:
✅ Strong demand/support area
✅ Previous intraday reaction zone
✅ Potential liquidity sweep into support
✅ Recovery toward nearby resistance levels
🎯 Targets
• Target 1: 2705
• Target 2: 2720
• Target 3: 2735
⚠️ Invalidation occurs if price fails to hold the highlighted demand zone.
Note: This is an educational market outlook based on current price structure and should be used alongside your own risk management and analysis.
$ETH
112
·
--
Article
HOW-TO: tell when Overbought on 4H means it keeps going🙏Overbought" sounds like a sell signal. On the 4 hour chart it usually wasn't.
We measured every time Harmonic Oscillator printed Exit Overbought on the 4 hour chart: 76 perpetual futures on Bybit (63 crypto coins and 13 stock, ETF and commodity contracts), 22 April 2025 to 29 September 2026, 633 first fires (a repeat within three bars counts once).
What followed, 12 hours later
The coin was higher: 52.4% of the time Other coins on the same bar, with a similar run-up: 46.7% Median move: +0.16%
Comparing with other coins on the same bar matters. It takes out the market's own move that day, so what's left is the coin and its signal. Those other coins were higher only 46.7% of the time, so the period leaned down, and overbought coins still did better.
The crowd decides which kind of overbought it is
We split the fires by the long/short account ratio at the bar's close, compared with that coin's own last 30 days.
Longs not crowded (468 fires): higher 53.6% of the time, against 46.2% for other coins. Median move +0.26%. Longs crowded (149 fires): higher 47.0%, against 46.7%. Median move -0.47%.
When the crowd wasn't already leaning long, overbought more often meant the move kept going. When it was, that edge disappeared and the typical 12 hours ended lower.
On the chart
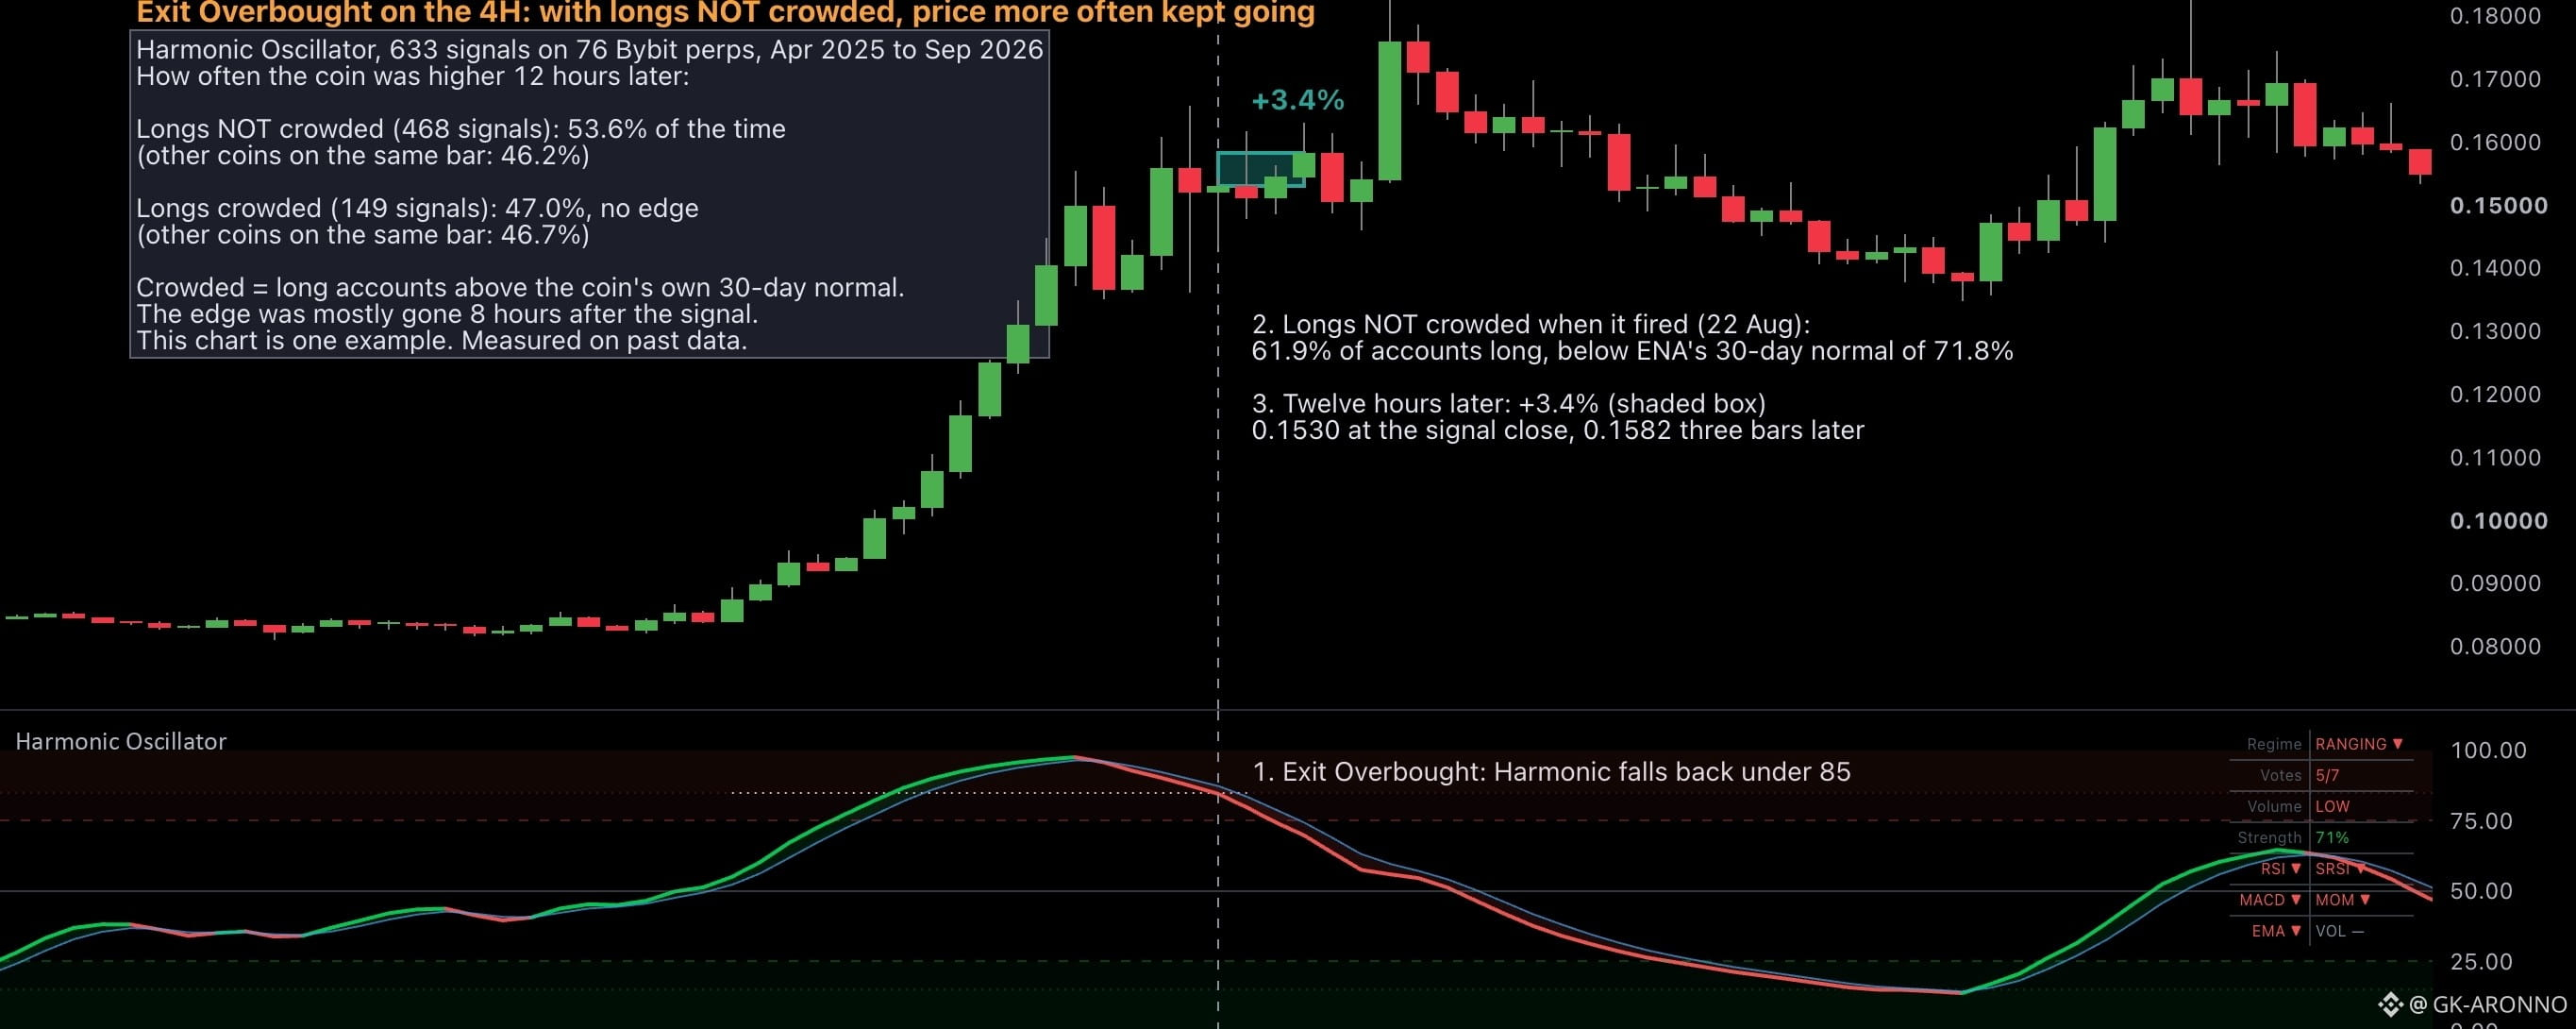
ENA, 4 hour, 22 August 2026. Harmonic printed Exit Overbought while 61.9% of accounts were long, below ENA's own 30-day normal of 71.8%. Twelve hours later ENA was 3.4% higher. It's one example, picked to show the case; the numbers above cover all 633.
How to do it
Step 1: On the 4 hour chart, note when Harmonic prints Exit Overbought. Step 2: Look up the long/short account ratio for that coin and compare it with its last 30 days. Step 3: Below its usual level: overbought has more often been a pause inside a move that keeps going. Above it: treat the print as a warning worth respecting. Step 4: Read it quickly or not at all. The difference was mostly gone two bars (8 hours) after the print.
Extreme Overbought behaved the same way overall: 623 fires, higher 50.7% of the time against 46.0%.
How fast it fades
The gap against other coins was 5.8 points if you read it at the print, 5.0 if you came in one bar later, and 1.3 two bars later. Most of the difference is gone within 8 hours, which is why step 4 says read it quickly or not at all.
How we checked it wasn't noise
Every test was declared before it ran. We compared each fire with coins that had made the same move on the same bar (a price twin), then with coins that also matched on volume (a volume twin), and we reran the whole measurement on 10 versions of shuffled history to see how often luck alone produces a gap this size. It held up in all three.
What this does not tell you
Higher more often is not a trade. The gap is a few points of probability, the median move is small, and on short holds fees eat a lot of it. One timeframe, one 17-month stretch, measured in sample. It held up against a price-only comparison and against shuffled history, and we've started counting it forward from 3 October on bars that didn't exist when we measured. We'll post what that count shows, either way
.$ENA
{future}(ENAUSDT)
HOW-TO: tell when Overbought on 4H means it keeps going🙏
Overbought" sounds like a sell signal. On the 4 hour chart it usually wasn't.
We measured every time Harmonic Oscillator printed Exit Overbought on the 4 hour chart: 76 perpetual futures on Bybit (63 crypto coins and 13 stock, ETF and commodity contracts), 22 April 2025 to 29 September 2026, 633 first fires (a repeat within three bars counts once).
What followed, 12 hours later
The coin was higher: 52.4% of the time Other coins on the same bar, with a similar run-up: 46.7% Median move: +0.16%
Comparing with other coins on the same bar matters. It takes out the market's own move that day, so what's left is the coin and its signal. Those other coins were higher only 46.7% of the time, so the period leaned down, and overbought coins still did better.
The crowd decides which kind of overbought it is
We split the fires by the long/short account ratio at the bar's close, compared with that coin's own last 30 days.
Longs not crowded (468 fires): higher 53.6% of the time, against 46.2% for other coins. Median move +0.26%. Longs crowded (149 fires): higher 47.0%, against 46.7%. Median move -0.47%.
When the crowd wasn't already leaning long, overbought more often meant the move kept going. When it was, that edge disappeared and the typical 12 hours ended lower.
On the chart
ENA, 4 hour, 22 August 2026. Harmonic printed Exit Overbought while 61.9% of accounts were long, below ENA's own 30-day normal of 71.8%. Twelve hours later ENA was 3.4% higher. It's one example, picked to show the case; the numbers above cover all 633.
How to do it
Step 1: On the 4 hour chart, note when Harmonic prints Exit Overbought. Step 2: Look up the long/short account ratio for that coin and compare it with its last 30 days. Step 3: Below its usual level: overbought has more often been a pause inside a move that keeps going. Above it: treat the print as a warning worth respecting. Step 4: Read it quickly or not at all. The difference was mostly gone two bars (8 hours) after the print.
Extreme Overbought behaved the same way overall: 623 fires, higher 50.7% of the time against 46.0%.
How fast it fades
The gap against other coins was 5.8 points if you read it at the print, 5.0 if you came in one bar later, and 1.3 two bars later. Most of the difference is gone within 8 hours, which is why step 4 says read it quickly or not at all.
How we checked it wasn't noise
Every test was declared before it ran. We compared each fire with coins that had made the same move on the same bar (a price twin), then with coins that also matched on volume (a volume twin), and we reran the whole measurement on 10 versions of shuffled history to see how often luck alone produces a gap this size. It held up in all three.
What this does not tell you
Higher more often is not a trade. The gap is a few points of probability, the median move is small, and on short holds fees eat a lot of it. One timeframe, one 17-month stretch, measured in sample. It held up against a price-only comparison and against shuffled history, and we've started counting it forward from 3 October on bars that didn't exist when we measured. We'll post what that count shows, either way
.$ENA
We measured every time Harmonic Oscillator printed Exit Overbought on the 4 hour chart: 76 perpetual futures on Bybit (63 crypto coins and 13 stock, ETF and commodity contracts), 22 April 2025 to 29 September 2026, 633 first fires (a repeat within three bars counts once).
What followed, 12 hours later
The coin was higher: 52.4% of the time Other coins on the same bar, with a similar run-up: 46.7% Median move: +0.16%
Comparing with other coins on the same bar matters. It takes out the market's own move that day, so what's left is the coin and its signal. Those other coins were higher only 46.7% of the time, so the period leaned down, and overbought coins still did better.
The crowd decides which kind of overbought it is
We split the fires by the long/short account ratio at the bar's close, compared with that coin's own last 30 days.
Longs not crowded (468 fires): higher 53.6% of the time, against 46.2% for other coins. Median move +0.26%. Longs crowded (149 fires): higher 47.0%, against 46.7%. Median move -0.47%.
When the crowd wasn't already leaning long, overbought more often meant the move kept going. When it was, that edge disappeared and the typical 12 hours ended lower.
On the chart
ENA, 4 hour, 22 August 2026. Harmonic printed Exit Overbought while 61.9% of accounts were long, below ENA's own 30-day normal of 71.8%. Twelve hours later ENA was 3.4% higher. It's one example, picked to show the case; the numbers above cover all 633.
How to do it
Step 1: On the 4 hour chart, note when Harmonic prints Exit Overbought. Step 2: Look up the long/short account ratio for that coin and compare it with its last 30 days. Step 3: Below its usual level: overbought has more often been a pause inside a move that keeps going. Above it: treat the print as a warning worth respecting. Step 4: Read it quickly or not at all. The difference was mostly gone two bars (8 hours) after the print.
Extreme Overbought behaved the same way overall: 623 fires, higher 50.7% of the time against 46.0%.
How fast it fades
The gap against other coins was 5.8 points if you read it at the print, 5.0 if you came in one bar later, and 1.3 two bars later. Most of the difference is gone within 8 hours, which is why step 4 says read it quickly or not at all.
How we checked it wasn't noise
Every test was declared before it ran. We compared each fire with coins that had made the same move on the same bar (a price twin), then with coins that also matched on volume (a volume twin), and we reran the whole measurement on 10 versions of shuffled history to see how often luck alone produces a gap this size. It held up in all three.
What this does not tell you
Higher more often is not a trade. The gap is a few points of probability, the median move is small, and on short holds fees eat a lot of it. One timeframe, one 17-month stretch, measured in sample. It held up against a price-only comparison and against shuffled history, and we've started counting it forward from 3 October on bars that didn't exist when we measured. We'll post what that count shows, either way
.$ENA
133
·
--
Article
suiusdt short⚡🚀INSTRUCTIONS TO READ AND TO FOLLOW:
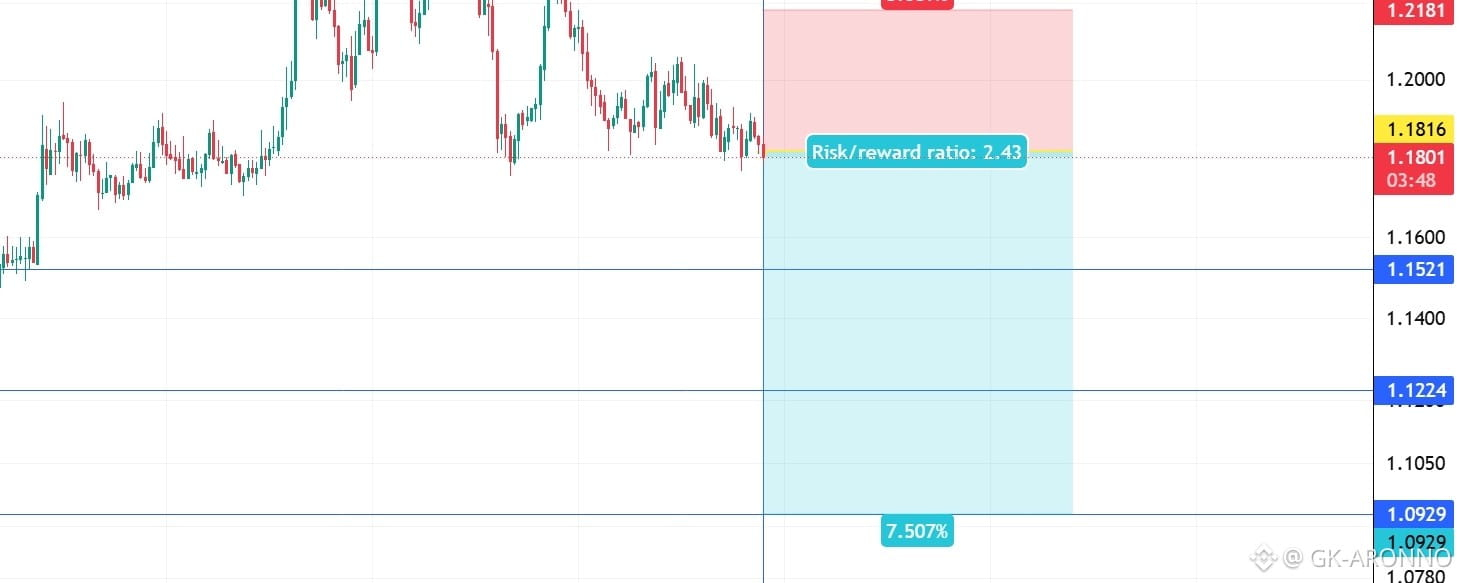
Entry point: yellow
Stop loss: red
Take profit: green or blue
👉Leverage x 5-10-20 for crypto
👉Leverage x 20-50-100 for commodities, stocks, indices, and forex
👉Margin 1-5% max:
This limits your maximum loss to 5% and guarantees that you retain 95% of your portfolio in the event of a stop-loss.
🔥🔥🔥🔥🔥🔥🔥🔥🔥🔥🔥🔥🔥🔥
ALWAYS PRACTICE RISK AND MONEY MANAGEMENT:
🔥🔥🔥🔥🔥🔥🔥🔥🔥🔥🔥🔥🔥🔥
👉Invest a maximum of 5% on any trade or across all your trades.
Invest only what you can afford to lose, as no one is in control of the market.
👉I repeat: this limits your maximum loss to 5% and guarantees—or rather, allows you to retain—95% of your portfolio in the event of a stop-loss.
👉IIn the event of a stop-loss, we always close out the loss and add substantial profit—all within a maximum of 48 hours, if not sooner. Simply follow the instructions.
👉I’m sending out several signals so you can pick the ones that look convincing to you—not all of them. Taking fewer positions certainly means lower gains, but it also means fewer losses. If you follow the instructions, we’ll either win together or crash and burn together. But rest assured, we win a lot more than we lose.
🎖️🎖️🎖️🎖️🎖️🎖️🎖️🎖️🎖️🎖️🎖️🎖️🎖️🎖️🎖️🎖️🎖️
LEARNING REMAINS THE BEST SOLUTION
🎖️🎖️🎖️🎖️🎖️🎖️🎖️🎖️🎖️🎖️🎖️🎖️🎖️🎖️🎖️🎖️
👉Learning from professionals remains the best solution: it enables you to understand signals, question them, and form your own opinion, as well as plan ahead should the signal provider be absent or inactive. In short, learning to trade grants you freedom and autonomy, making you responsible for both your gains and your losses.
👉Our analyses are primarily based on:
breakouts: two trend lines (ascending and descending) and a line indicating a horizontal breakout.
chart patterns: shoulders and head, triangle parttern, elliott impulse, etc etc.
We don't always have the time to track them at all times or to represent them visibly, given the numerous signals, the number of channels to manage, and especially because of the often rapid pace of market movements.
indicators: We associate at least two indicators with this technique.
👉considering the potential market risks and the likely short-term and long-term profits, we use specific indicators, often setting 3 or more take profit levels
👉depending on your psychological state, your beliefs, your goals or intuitions, you can close the position before or after the take profit orders indicated by the green lines if you are personally satisfied; the same applies to stop loss orders
👉Indeed, there are good days in trading and also bad days. No one can promise to win every trade, and like all traders worldwide, we also experience stop-loss orders. However, we win more than we lose and remain positive.
👉We must stay positive, clear-headed, and humble.
We need to proceed step by step—without rushing, without being overly timid, and without being too greedy either.We need to pull ourselves together and regain our confidence after hitting a stop-loss.
We must stay courageous and, above all, prudent regarding market reversals that no one can control
👉we cannot provide all instructions or all trades here on this channel.
such as:
⚡Move your stoploss
⚡Put B.E (break even)
⚡Add an additional take-profit
⚡Add a trailing stop
⚡re-entering the trade at the same entry point or lower.
⚡recovery signals provided in the event of—or following—a stop-loss (SL) hit.
⚡personalized discussions, instructions, and answers.
⚡revealing our high-performance indicators and teaching you how to configure and use them.
$SUI
{future}(SUIUSDT)
suiusdt short⚡🚀
INSTRUCTIONS TO READ AND TO FOLLOW:
Entry point: yellow
Stop loss: red
Take profit: green or blue
👉Leverage x 5-10-20 for crypto
👉Leverage x 20-50-100 for commodities, stocks, indices, and forex
👉Margin 1-5% max:
This limits your maximum loss to 5% and guarantees that you retain 95% of your portfolio in the event of a stop-loss.
🔥🔥🔥🔥🔥🔥🔥🔥🔥🔥🔥🔥🔥🔥
ALWAYS PRACTICE RISK AND MONEY MANAGEMENT:
🔥🔥🔥🔥🔥🔥🔥🔥🔥🔥🔥🔥🔥🔥
👉Invest a maximum of 5% on any trade or across all your trades.
Invest only what you can afford to lose, as no one is in control of the market.
👉I repeat: this limits your maximum loss to 5% and guarantees—or rather, allows you to retain—95% of your portfolio in the event of a stop-loss.
👉IIn the event of a stop-loss, we always close out the loss and add substantial profit—all within a maximum of 48 hours, if not sooner. Simply follow the instructions.
👉I’m sending out several signals so you can pick the ones that look convincing to you—not all of them. Taking fewer positions certainly means lower gains, but it also means fewer losses. If you follow the instructions, we’ll either win together or crash and burn together. But rest assured, we win a lot more than we lose.
🎖️🎖️🎖️🎖️🎖️🎖️🎖️🎖️🎖️🎖️🎖️🎖️🎖️🎖️🎖️🎖️🎖️
LEARNING REMAINS THE BEST SOLUTION
🎖️🎖️🎖️🎖️🎖️🎖️🎖️🎖️🎖️🎖️🎖️🎖️🎖️🎖️🎖️🎖️
👉Learning from professionals remains the best solution: it enables you to understand signals, question them, and form your own opinion, as well as plan ahead should the signal provider be absent or inactive. In short, learning to trade grants you freedom and autonomy, making you responsible for both your gains and your losses.
👉Our analyses are primarily based on:
breakouts: two trend lines (ascending and descending) and a line indicating a horizontal breakout.
chart patterns: shoulders and head, triangle parttern, elliott impulse, etc etc.
We don't always have the time to track them at all times or to represent them visibly, given the numerous signals, the number of channels to manage, and especially because of the often rapid pace of market movements.
indicators: We associate at least two indicators with this technique.
👉considering the potential market risks and the likely short-term and long-term profits, we use specific indicators, often setting 3 or more take profit levels
👉depending on your psychological state, your beliefs, your goals or intuitions, you can close the position before or after the take profit orders indicated by the green lines if you are personally satisfied; the same applies to stop loss orders
👉Indeed, there are good days in trading and also bad days. No one can promise to win every trade, and like all traders worldwide, we also experience stop-loss orders. However, we win more than we lose and remain positive.
👉We must stay positive, clear-headed, and humble.
We need to proceed step by step—without rushing, without being overly timid, and without being too greedy either.We need to pull ourselves together and regain our confidence after hitting a stop-loss.
We must stay courageous and, above all, prudent regarding market reversals that no one can control
👉we cannot provide all instructions or all trades here on this channel.
such as:
⚡Move your stoploss
⚡Put B.E (break even)
⚡Add an additional take-profit
⚡Add a trailing stop
⚡re-entering the trade at the same entry point or lower.
⚡recovery signals provided in the event of—or following—a stop-loss (SL) hit.
⚡personalized discussions, instructions, and answers.
⚡revealing our high-performance indicators and teaching you how to configure and use them.
$SUI
Entry point: yellow
Stop loss: red
Take profit: green or blue
👉Leverage x 5-10-20 for crypto
👉Leverage x 20-50-100 for commodities, stocks, indices, and forex
👉Margin 1-5% max:
This limits your maximum loss to 5% and guarantees that you retain 95% of your portfolio in the event of a stop-loss.
🔥🔥🔥🔥🔥🔥🔥🔥🔥🔥🔥🔥🔥🔥
ALWAYS PRACTICE RISK AND MONEY MANAGEMENT:
🔥🔥🔥🔥🔥🔥🔥🔥🔥🔥🔥🔥🔥🔥
👉Invest a maximum of 5% on any trade or across all your trades.
Invest only what you can afford to lose, as no one is in control of the market.
👉I repeat: this limits your maximum loss to 5% and guarantees—or rather, allows you to retain—95% of your portfolio in the event of a stop-loss.
👉IIn the event of a stop-loss, we always close out the loss and add substantial profit—all within a maximum of 48 hours, if not sooner. Simply follow the instructions.
👉I’m sending out several signals so you can pick the ones that look convincing to you—not all of them. Taking fewer positions certainly means lower gains, but it also means fewer losses. If you follow the instructions, we’ll either win together or crash and burn together. But rest assured, we win a lot more than we lose.
🎖️🎖️🎖️🎖️🎖️🎖️🎖️🎖️🎖️🎖️🎖️🎖️🎖️🎖️🎖️🎖️🎖️
LEARNING REMAINS THE BEST SOLUTION
🎖️🎖️🎖️🎖️🎖️🎖️🎖️🎖️🎖️🎖️🎖️🎖️🎖️🎖️🎖️🎖️
👉Learning from professionals remains the best solution: it enables you to understand signals, question them, and form your own opinion, as well as plan ahead should the signal provider be absent or inactive. In short, learning to trade grants you freedom and autonomy, making you responsible for both your gains and your losses.
👉Our analyses are primarily based on:
breakouts: two trend lines (ascending and descending) and a line indicating a horizontal breakout.
chart patterns: shoulders and head, triangle parttern, elliott impulse, etc etc.
We don't always have the time to track them at all times or to represent them visibly, given the numerous signals, the number of channels to manage, and especially because of the often rapid pace of market movements.
indicators: We associate at least two indicators with this technique.
👉considering the potential market risks and the likely short-term and long-term profits, we use specific indicators, often setting 3 or more take profit levels
👉depending on your psychological state, your beliefs, your goals or intuitions, you can close the position before or after the take profit orders indicated by the green lines if you are personally satisfied; the same applies to stop loss orders
👉Indeed, there are good days in trading and also bad days. No one can promise to win every trade, and like all traders worldwide, we also experience stop-loss orders. However, we win more than we lose and remain positive.
👉We must stay positive, clear-headed, and humble.
We need to proceed step by step—without rushing, without being overly timid, and without being too greedy either.We need to pull ourselves together and regain our confidence after hitting a stop-loss.
We must stay courageous and, above all, prudent regarding market reversals that no one can control
👉we cannot provide all instructions or all trades here on this channel.
such as:
⚡Move your stoploss
⚡Put B.E (break even)
⚡Add an additional take-profit
⚡Add a trailing stop
⚡re-entering the trade at the same entry point or lower.
⚡recovery signals provided in the event of—or following—a stop-loss (SL) hit.
⚡personalized discussions, instructions, and answers.
⚡revealing our high-performance indicators and teaching you how to configure and use them.
$SUI
127
·
--
Article
roseusdt short🙏🔔INSTRUCTIONS TO READ AND TO FOLLOW:
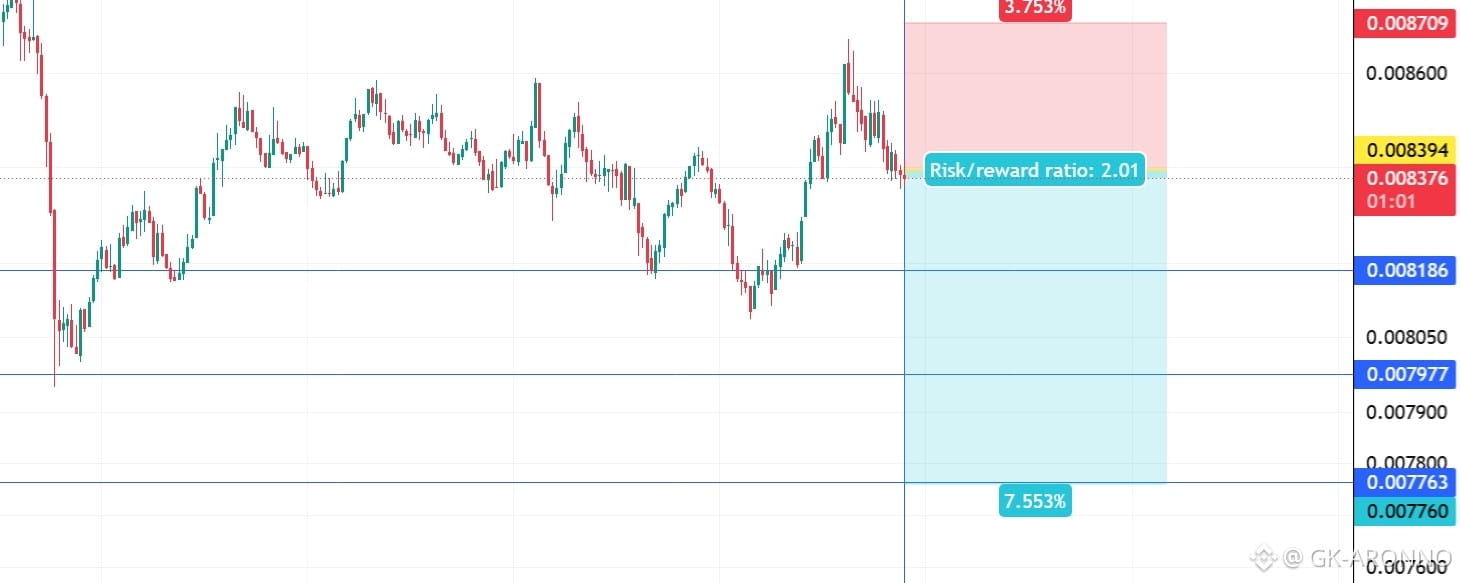
Entry point: yellow
Stop loss: red
Take profit: green or blue
👉Leverage x 5-10-20 for crypto
👉Leverage x 20-50-100 for commodities, stocks, indices, and forex
👉Margin 1-5% max:
This limits your maximum loss to 5% and guarantees that you retain 95% of your portfolio in the event of a stop-loss.
🔥🔥🔥🔥🔥🔥🔥🔥🔥🔥🔥🔥🔥🔥
ALWAYS PRACTICE RISK AND MONEY MANAGEMENT:
🔥🔥🔥🔥🔥🔥🔥🔥🔥🔥🔥🔥🔥🔥
👉Invest a maximum of 5% on any trade or across all your trades.
Invest only what you can afford to lose, as no one is in control of the market.
👉I repeat: this limits your maximum loss to 5% and guarantees—or rather, allows you to retain—95% of your portfolio in the event of a stop-loss.
👉IIn the event of a stop-loss, we always close out the loss and add substantial profit—all within a maximum of 48 hours, if not sooner. Simply follow the instructions.
👉I’m sending out several signals so you can pick the ones that look convincing to you—not all of them. Taking fewer positions certainly means lower gains, but it also means fewer losses. If you follow the instructions, we’ll either win together or crash and burn together. But rest assured, we win a lot more than we lose.
🎖️🎖️🎖️🎖️🎖️🎖️🎖️🎖️🎖️🎖️🎖️🎖️🎖️🎖️🎖️🎖️🎖️
LEARNING REMAINS THE BEST SOLUTION
🎖️🎖️🎖️🎖️🎖️🎖️🎖️🎖️🎖️🎖️🎖️🎖️🎖️🎖️🎖️🎖️
👉Learning from professionals remains the best solution: it enables you to understand signals, question them, and form your own opinion, as well as plan ahead should the signal provider be absent or inactive. In short, learning to trade grants you freedom and autonomy, making you responsible for both your gains and your losses.
👉Our analyses are primarily based on:
breakouts: two trend lines (ascending and descending) and a line indicating a horizontal breakout.
chart patterns: shoulders and head, triangle parttern, elliott impulse, etc etc.
We don't always have the time to track them at all times or to represent them visibly, given the numerous signals, the number of channels to manage, and especially because of the often rapid pace of market movements.
indicators: We associate at least two indicators with this technique.
👉considering the potential market risks and the likely short-term and long-term profits, we use specific indicators, often setting 3 or more take profit levels
👉depending on your psychological state, your beliefs, your goals or intuitions, you can close the position before or after the take profit orders indicated by the green lines if you are personally satisfied; the same applies to stop loss orders
👉Indeed, there are good days in trading and also bad days. No one can promise to win every trade, and like all traders worldwide, we also experience stop-loss orders. However, we win more than we lose and remain positive.
👉We must stay positive, clear-headed, and humble.
We need to proceed step by step—without rushing, without being overly timid, and without being too greedy either.We need to pull ourselves together and regain our confidence after hitting a stop-loss.
We must stay courageous and, above all, prudent regarding market reversals that no one can control
👉we cannot provide all instructions or all trades here on this channel.
such as:
⚡Move your stoploss
⚡Put B.E (break even)
⚡Add an additional take-profit
⚡Add a trailing stop
⚡re-entering the trade at the same entry point or lower.
⚡recovery signals provided in the event of—or following—a stop-loss (SL) hit.
⚡personalized discussions, instructions, and answers.
⚡revealing our high-performance indicators and teaching you how to configure and use them.
$ROSE
{future}(ROSEUSDT)
roseusdt short🙏🔔
INSTRUCTIONS TO READ AND TO FOLLOW:
Entry point: yellow
Stop loss: red
Take profit: green or blue
👉Leverage x 5-10-20 for crypto
👉Leverage x 20-50-100 for commodities, stocks, indices, and forex
👉Margin 1-5% max:
This limits your maximum loss to 5% and guarantees that you retain 95% of your portfolio in the event of a stop-loss.
🔥🔥🔥🔥🔥🔥🔥🔥🔥🔥🔥🔥🔥🔥
ALWAYS PRACTICE RISK AND MONEY MANAGEMENT:
🔥🔥🔥🔥🔥🔥🔥🔥🔥🔥🔥🔥🔥🔥
👉Invest a maximum of 5% on any trade or across all your trades.
Invest only what you can afford to lose, as no one is in control of the market.
👉I repeat: this limits your maximum loss to 5% and guarantees—or rather, allows you to retain—95% of your portfolio in the event of a stop-loss.
👉IIn the event of a stop-loss, we always close out the loss and add substantial profit—all within a maximum of 48 hours, if not sooner. Simply follow the instructions.
👉I’m sending out several signals so you can pick the ones that look convincing to you—not all of them. Taking fewer positions certainly means lower gains, but it also means fewer losses. If you follow the instructions, we’ll either win together or crash and burn together. But rest assured, we win a lot more than we lose.
🎖️🎖️🎖️🎖️🎖️🎖️🎖️🎖️🎖️🎖️🎖️🎖️🎖️🎖️🎖️🎖️🎖️
LEARNING REMAINS THE BEST SOLUTION
🎖️🎖️🎖️🎖️🎖️🎖️🎖️🎖️🎖️🎖️🎖️🎖️🎖️🎖️🎖️🎖️
👉Learning from professionals remains the best solution: it enables you to understand signals, question them, and form your own opinion, as well as plan ahead should the signal provider be absent or inactive. In short, learning to trade grants you freedom and autonomy, making you responsible for both your gains and your losses.
👉Our analyses are primarily based on:
breakouts: two trend lines (ascending and descending) and a line indicating a horizontal breakout.
chart patterns: shoulders and head, triangle parttern, elliott impulse, etc etc.
We don't always have the time to track them at all times or to represent them visibly, given the numerous signals, the number of channels to manage, and especially because of the often rapid pace of market movements.
indicators: We associate at least two indicators with this technique.
👉considering the potential market risks and the likely short-term and long-term profits, we use specific indicators, often setting 3 or more take profit levels
👉depending on your psychological state, your beliefs, your goals or intuitions, you can close the position before or after the take profit orders indicated by the green lines if you are personally satisfied; the same applies to stop loss orders
👉Indeed, there are good days in trading and also bad days. No one can promise to win every trade, and like all traders worldwide, we also experience stop-loss orders. However, we win more than we lose and remain positive.
👉We must stay positive, clear-headed, and humble.
We need to proceed step by step—without rushing, without being overly timid, and without being too greedy either.We need to pull ourselves together and regain our confidence after hitting a stop-loss.
We must stay courageous and, above all, prudent regarding market reversals that no one can control
👉we cannot provide all instructions or all trades here on this channel.
such as:
⚡Move your stoploss
⚡Put B.E (break even)
⚡Add an additional take-profit
⚡Add a trailing stop
⚡re-entering the trade at the same entry point or lower.
⚡recovery signals provided in the event of—or following—a stop-loss (SL) hit.
⚡personalized discussions, instructions, and answers.
⚡revealing our high-performance indicators and teaching you how to configure and use them.
$ROSE
Entry point: yellow
Stop loss: red
Take profit: green or blue
👉Leverage x 5-10-20 for crypto
👉Leverage x 20-50-100 for commodities, stocks, indices, and forex
👉Margin 1-5% max:
This limits your maximum loss to 5% and guarantees that you retain 95% of your portfolio in the event of a stop-loss.
🔥🔥🔥🔥🔥🔥🔥🔥🔥🔥🔥🔥🔥🔥
ALWAYS PRACTICE RISK AND MONEY MANAGEMENT:
🔥🔥🔥🔥🔥🔥🔥🔥🔥🔥🔥🔥🔥🔥
👉Invest a maximum of 5% on any trade or across all your trades.
Invest only what you can afford to lose, as no one is in control of the market.
👉I repeat: this limits your maximum loss to 5% and guarantees—or rather, allows you to retain—95% of your portfolio in the event of a stop-loss.
👉IIn the event of a stop-loss, we always close out the loss and add substantial profit—all within a maximum of 48 hours, if not sooner. Simply follow the instructions.
👉I’m sending out several signals so you can pick the ones that look convincing to you—not all of them. Taking fewer positions certainly means lower gains, but it also means fewer losses. If you follow the instructions, we’ll either win together or crash and burn together. But rest assured, we win a lot more than we lose.
🎖️🎖️🎖️🎖️🎖️🎖️🎖️🎖️🎖️🎖️🎖️🎖️🎖️🎖️🎖️🎖️🎖️
LEARNING REMAINS THE BEST SOLUTION
🎖️🎖️🎖️🎖️🎖️🎖️🎖️🎖️🎖️🎖️🎖️🎖️🎖️🎖️🎖️🎖️
👉Learning from professionals remains the best solution: it enables you to understand signals, question them, and form your own opinion, as well as plan ahead should the signal provider be absent or inactive. In short, learning to trade grants you freedom and autonomy, making you responsible for both your gains and your losses.
👉Our analyses are primarily based on:
breakouts: two trend lines (ascending and descending) and a line indicating a horizontal breakout.
chart patterns: shoulders and head, triangle parttern, elliott impulse, etc etc.
We don't always have the time to track them at all times or to represent them visibly, given the numerous signals, the number of channels to manage, and especially because of the often rapid pace of market movements.
indicators: We associate at least two indicators with this technique.
👉considering the potential market risks and the likely short-term and long-term profits, we use specific indicators, often setting 3 or more take profit levels
👉depending on your psychological state, your beliefs, your goals or intuitions, you can close the position before or after the take profit orders indicated by the green lines if you are personally satisfied; the same applies to stop loss orders
👉Indeed, there are good days in trading and also bad days. No one can promise to win every trade, and like all traders worldwide, we also experience stop-loss orders. However, we win more than we lose and remain positive.
👉We must stay positive, clear-headed, and humble.
We need to proceed step by step—without rushing, without being overly timid, and without being too greedy either.We need to pull ourselves together and regain our confidence after hitting a stop-loss.
We must stay courageous and, above all, prudent regarding market reversals that no one can control
👉we cannot provide all instructions or all trades here on this channel.
such as:
⚡Move your stoploss
⚡Put B.E (break even)
⚡Add an additional take-profit
⚡Add a trailing stop
⚡re-entering the trade at the same entry point or lower.
⚡recovery signals provided in the event of—or following—a stop-loss (SL) hit.
⚡personalized discussions, instructions, and answers.
⚡revealing our high-performance indicators and teaching you how to configure and use them.
$ROSE
106
·
--
Article
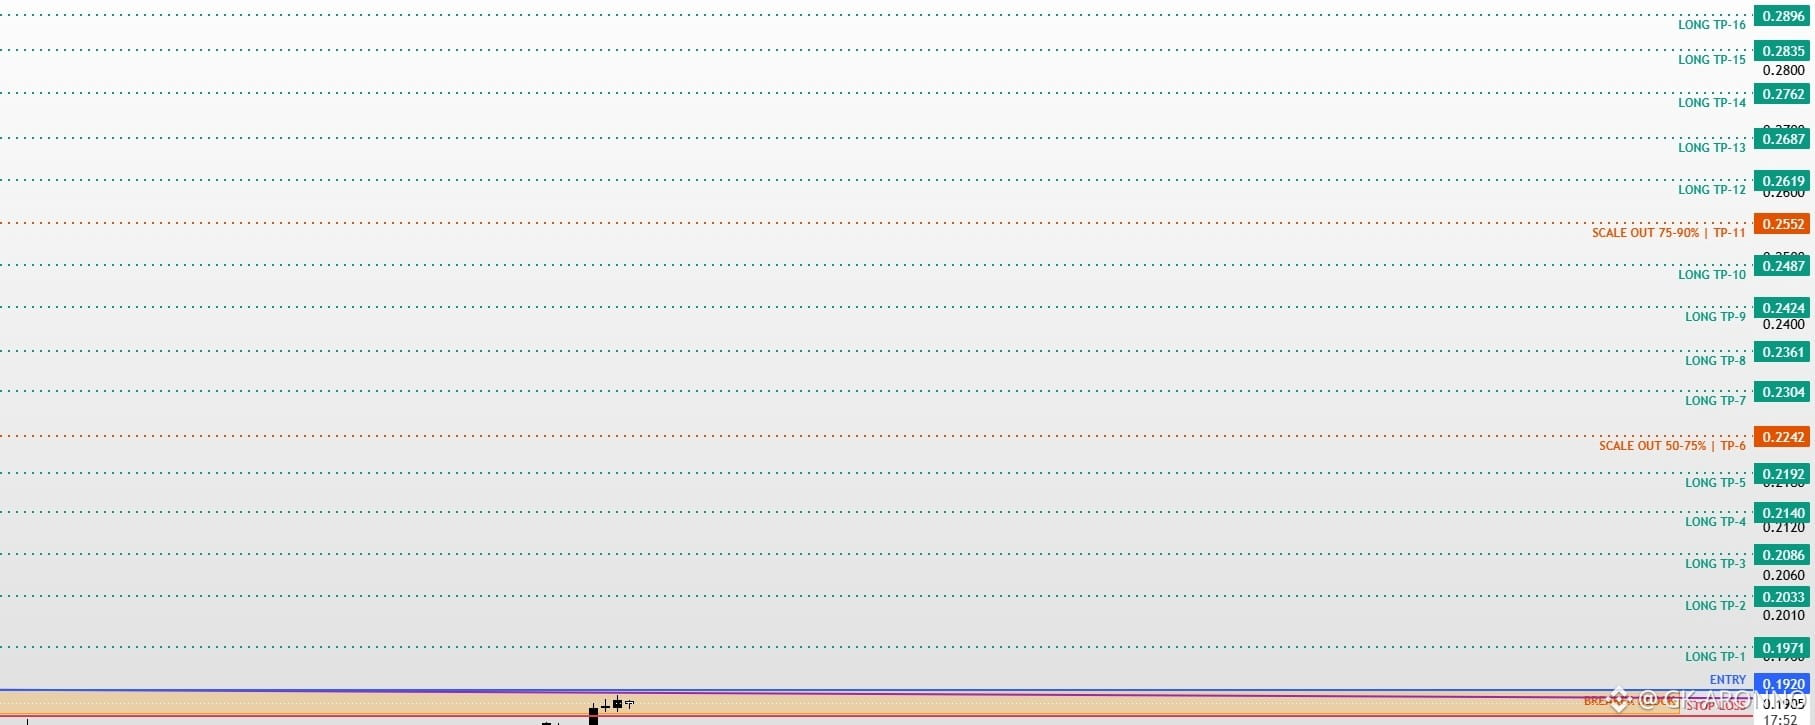
IMX / IMXUSDT Long Setup | Breaker Block Reclaim📣🚀✅MARKET ANALYSIS
IMX is currently reacting from a key technical area highlighted on the chart.
As long as the protected support zone remains intact, the bullish market structure remains valid and higher liquidity targets may continue to attract price action.
A breakdown below the invalidation level would weaken the current bullish scenario and require a reassessment of market conditions.
📍 Entry, Stop Loss and Take Profit levels are marked directly on the chart.
━━━━━━━━━━━━━━
⚠️ DISCLAIMER
This publication is provided solely for educational and market observation purposes.Nothing contained in this analysis should be considered financial advice, investment advice, or a recommendation to buy or sell any financial instrument.All trading and investment decisions remain solely the responsibility of the individual trader.Always conduct your own research and apply proper risk management before entering any position.
━━━━━━━━━━━━━━
🎯 PARALOG
▪️Crypto Market Analysis
▪️BTC Futures Signals
▪️Bitcoin & Altcoin Market Analysis
Precision • Momentum • Timing
$IMX
{future}(IMXUSDT)
IMX / IMXUSDT Long Setup | Breaker Block Reclaim📣🚀✅
MARKET ANALYSIS
IMX is currently reacting from a key technical area highlighted on the chart.
As long as the protected support zone remains intact, the bullish market structure remains valid and higher liquidity targets may continue to attract price action.
A breakdown below the invalidation level would weaken the current bullish scenario and require a reassessment of market conditions.
📍 Entry, Stop Loss and Take Profit levels are marked directly on the chart.
━━━━━━━━━━━━━━
⚠️ DISCLAIMER
This publication is provided solely for educational and market observation purposes.Nothing contained in this analysis should be considered financial advice, investment advice, or a recommendation to buy or sell any financial instrument.All trading and investment decisions remain solely the responsibility of the individual trader.Always conduct your own research and apply proper risk management before entering any position.
━━━━━━━━━━━━━━
🎯 PARALOG
▪️Crypto Market Analysis
▪️BTC Futures Signals
▪️Bitcoin & Altcoin Market Analysis
Precision • Momentum • Timing
$IMX
IMX is currently reacting from a key technical area highlighted on the chart.
As long as the protected support zone remains intact, the bullish market structure remains valid and higher liquidity targets may continue to attract price action.
A breakdown below the invalidation level would weaken the current bullish scenario and require a reassessment of market conditions.
📍 Entry, Stop Loss and Take Profit levels are marked directly on the chart.
━━━━━━━━━━━━━━
⚠️ DISCLAIMER
This publication is provided solely for educational and market observation purposes.Nothing contained in this analysis should be considered financial advice, investment advice, or a recommendation to buy or sell any financial instrument.All trading and investment decisions remain solely the responsibility of the individual trader.Always conduct your own research and apply proper risk management before entering any position.
━━━━━━━━━━━━━━
🎯 PARALOG
▪️Crypto Market Analysis
▪️BTC Futures Signals
▪️Bitcoin & Altcoin Market Analysis
Precision • Momentum • Timing
$IMX
87
·
--
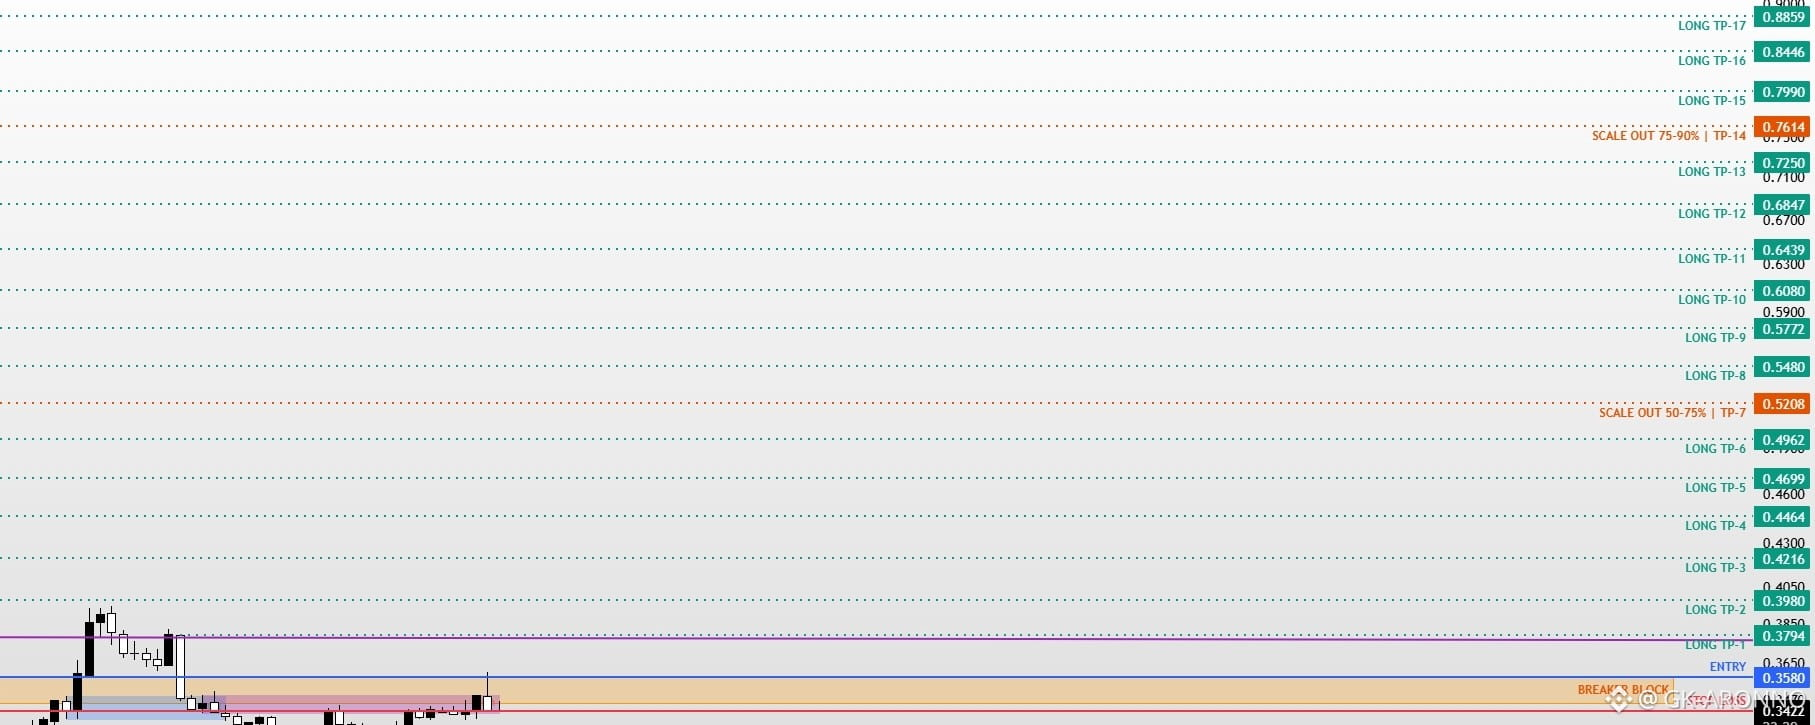
Article
API3 / API3USDT Bullish Setup | Futures Trade Idea🙏⚡MARKET ANALYSIS
API3 is currently reacting from a key technical area highlighted on the chart.
As long as the protected support zone remains intact, the bullish market structure remains valid and higher liquidity targets may continue to attract price action.
A breakdown below the invalidation level would weaken the current bullish scenario and require a reassessment of market conditions.
📍 Entry, Stop Loss and Take Profit levels are marked directly on the chart.
━━━━━━━━━━━━━━
⚠️ DISCLAIMER
This publication is provided solely for educational and market observation purposes.Nothing contained in this analysis should be considered financial advice, investment advice, or a recommendation to buy or sell any financial instrument.All trading and investment decisions remain solely the responsibility of the individual trader.Always conduct your own research and apply proper risk management before entering any position.
━━━━━━━━━━━━━━
🎯 PARALOG
▪️Crypto Market Analysis
▪️BTC Futures Signals
▪️Bitcoin & Altcoin Market Analysis
Precision • Momentum • Timing
━━━━━━━━━━━━━━
$API3
{future}(API3USDT)
API3 / API3USDT Bullish Setup | Futures Trade Idea🙏⚡
MARKET ANALYSIS
API3 is currently reacting from a key technical area highlighted on the chart.
As long as the protected support zone remains intact, the bullish market structure remains valid and higher liquidity targets may continue to attract price action.
A breakdown below the invalidation level would weaken the current bullish scenario and require a reassessment of market conditions.
📍 Entry, Stop Loss and Take Profit levels are marked directly on the chart.
━━━━━━━━━━━━━━
⚠️ DISCLAIMER
This publication is provided solely for educational and market observation purposes.Nothing contained in this analysis should be considered financial advice, investment advice, or a recommendation to buy or sell any financial instrument.All trading and investment decisions remain solely the responsibility of the individual trader.Always conduct your own research and apply proper risk management before entering any position.
━━━━━━━━━━━━━━
🎯 PARALOG
▪️Crypto Market Analysis
▪️BTC Futures Signals
▪️Bitcoin & Altcoin Market Analysis
Precision • Momentum • Timing
━━━━━━━━━━━━━━
$API3
API3 is currently reacting from a key technical area highlighted on the chart.
As long as the protected support zone remains intact, the bullish market structure remains valid and higher liquidity targets may continue to attract price action.
A breakdown below the invalidation level would weaken the current bullish scenario and require a reassessment of market conditions.
📍 Entry, Stop Loss and Take Profit levels are marked directly on the chart.
━━━━━━━━━━━━━━
⚠️ DISCLAIMER
This publication is provided solely for educational and market observation purposes.Nothing contained in this analysis should be considered financial advice, investment advice, or a recommendation to buy or sell any financial instrument.All trading and investment decisions remain solely the responsibility of the individual trader.Always conduct your own research and apply proper risk management before entering any position.
━━━━━━━━━━━━━━
🎯 PARALOG
▪️Crypto Market Analysis
▪️BTC Futures Signals
▪️Bitcoin & Altcoin Market Analysis
Precision • Momentum • Timing
━━━━━━━━━━━━━━
$API3
120
·
--
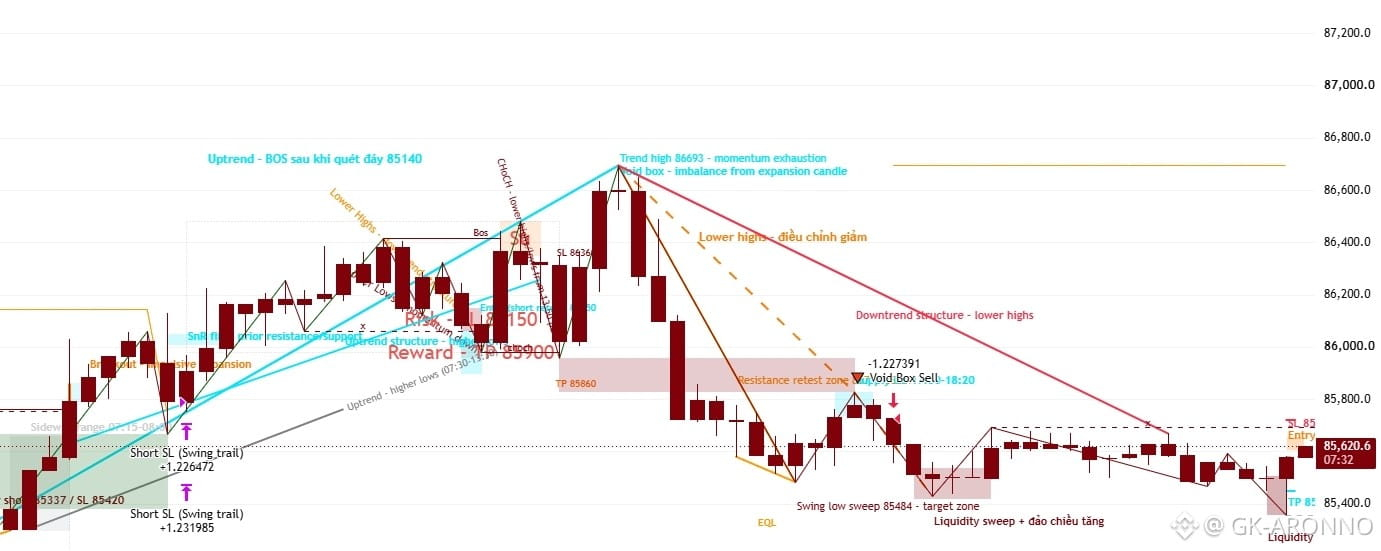
Article
BTCUSDT 5m - Short retest of 85600-85660 after liquidity sweep,🔔🔔Price-action structure mapping combined with support/resistance flip, imbalance (expansion-candle) zones, and liquidity-sweep confirmation.
Context: price rallied from a tight consolidation into a strong expansion, printing higher lows up to a swing high before stalling, then shifted into a clear sequence of lower highs into the most recent candles.
Key levels: a support-turned-resistance pocket near 86010-86050 marked the mid-rally pause, the imbalance left by the expansion candle sits just below the swing high, and a liquidity sweep below prior lows was followed by a sharp rebound into a minor supply pocket.
Scenario: favoring a short on a retest of the 85600-85660 pocket, with stop above the recent reversal high and target projected toward the area beneath the sweep low.
Invalidation: a push and close above the recent reversal high would break the lower-highs sequence and invalidate the short bias.
Analysis timeframe: M5, chart displayed on M15.
Educational chart analysis only, not financial advice.
$BTC
{future}(BTCUSDT)
BTCUSDT 5m - Short retest of 85600-85660 after liquidity sweep,🔔🔔
Price-action structure mapping combined with support/resistance flip, imbalance (expansion-candle) zones, and liquidity-sweep confirmation.
Context: price rallied from a tight consolidation into a strong expansion, printing higher lows up to a swing high before stalling, then shifted into a clear sequence of lower highs into the most recent candles.
Key levels: a support-turned-resistance pocket near 86010-86050 marked the mid-rally pause, the imbalance left by the expansion candle sits just below the swing high, and a liquidity sweep below prior lows was followed by a sharp rebound into a minor supply pocket.
Scenario: favoring a short on a retest of the 85600-85660 pocket, with stop above the recent reversal high and target projected toward the area beneath the sweep low.
Invalidation: a push and close above the recent reversal high would break the lower-highs sequence and invalidate the short bias.
Analysis timeframe: M5, chart displayed on M15.
Educational chart analysis only, not financial advice.
$BTC
Context: price rallied from a tight consolidation into a strong expansion, printing higher lows up to a swing high before stalling, then shifted into a clear sequence of lower highs into the most recent candles.
Key levels: a support-turned-resistance pocket near 86010-86050 marked the mid-rally pause, the imbalance left by the expansion candle sits just below the swing high, and a liquidity sweep below prior lows was followed by a sharp rebound into a minor supply pocket.
Scenario: favoring a short on a retest of the 85600-85660 pocket, with stop above the recent reversal high and target projected toward the area beneath the sweep low.
Invalidation: a push and close above the recent reversal high would break the lower-highs sequence and invalidate the short bias.
Analysis timeframe: M5, chart displayed on M15.
Educational chart analysis only, not financial advice.
$BTC
160
·
--
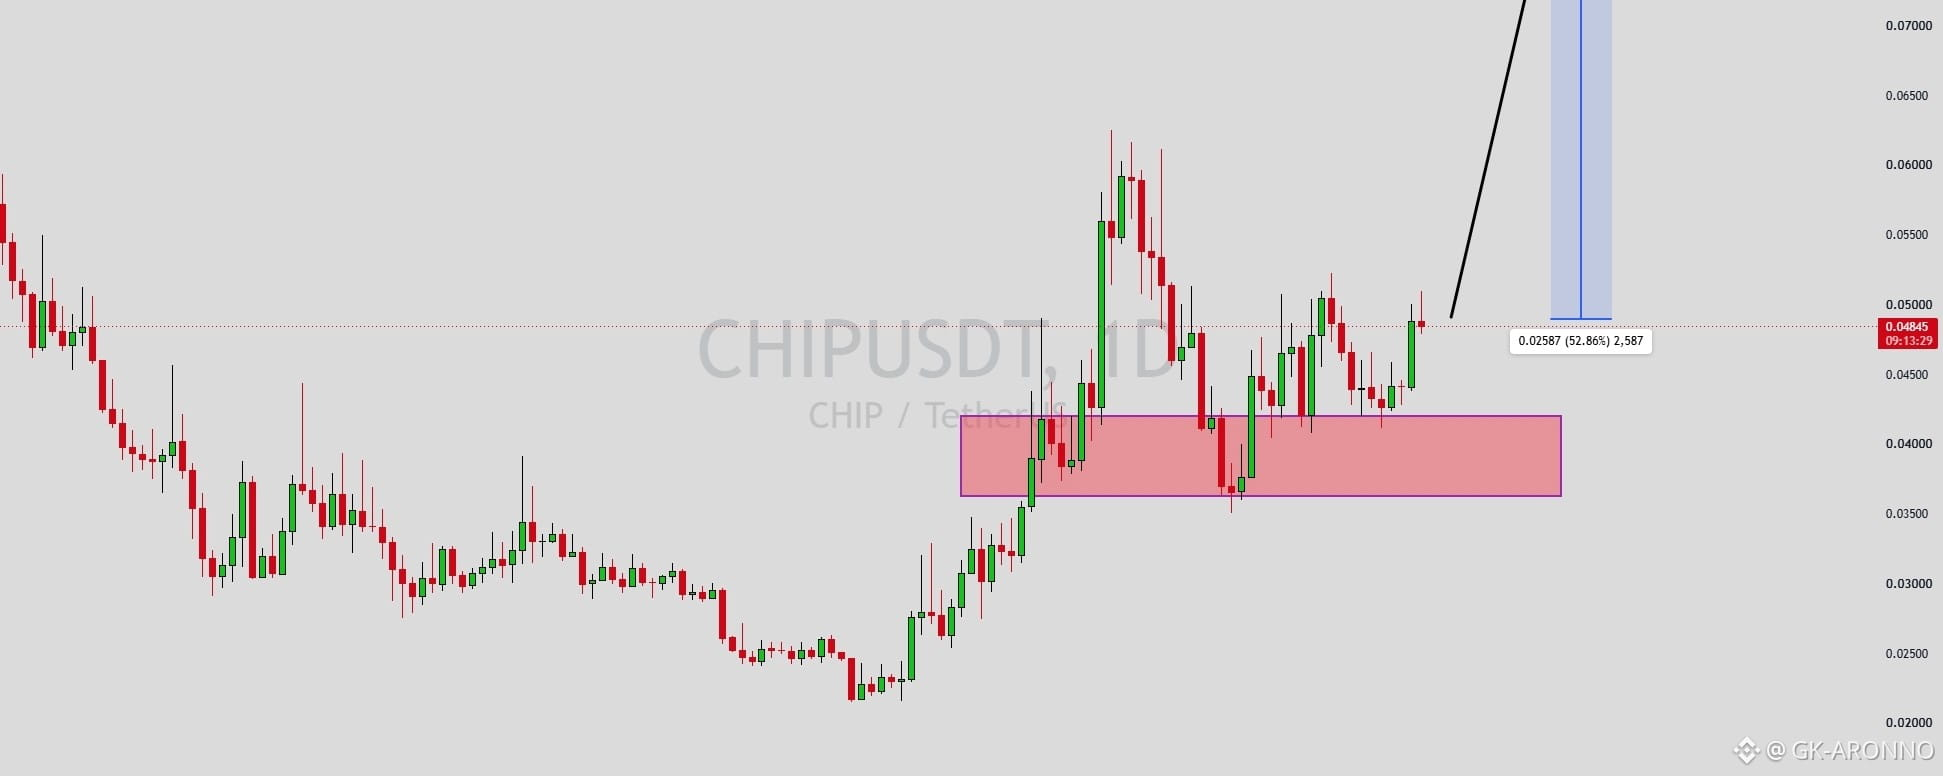
Article
CHIPUSDT Forming Bullish Momentum💫💫CHIPUSDT is forming a clear bullish momentum pattern, a classic bullish reversal signal that often indicates an upcoming breakout. The price has been consolidating within a narrowing range, suggesting that selling pressure is weakening while buyers are beginning to regain control. With consistent volume confirming accumulation at lower levels, the setup hints at a potential bullish breakout soon. The projected move could lead to an impressive gain of around 60% to 70% once the price breaks above the wedge resistance.
This bullish momentum pattern is typically seen at the end of downtrends or corrective phases, and it represents a potential shift in market sentiment from bearish to bullish. Traders closely watching CHIPUSDT are noting the strengthening momentum as it nears a breakout zone. The good trading volume adds confidence to this pattern, showing that market participants are positioning early in anticipation of a reversal.
Investors’ growing interest in CHIPUSDT reflects rising confidence in the project’s long-term fundamentals and current technical strength. If the breakout confirms with sustained volume, this could mark the start of a fresh bullish leg. Traders might find this a valuable setup for medium-term gains, especially as the wedge pattern completes and buying momentum accelerates.
✅ Show your support by hitting the like button and
✅ Leaving a comment below! (What is You opinion about this Coin)
Your feedback and engagement keep me inspired to share more insightful market analysis with you!
$CHIP
CHIPUSDT Forming Bullish Momentum💫💫
CHIPUSDT is forming a clear bullish momentum pattern, a classic bullish reversal signal that often indicates an upcoming breakout. The price has been consolidating within a narrowing range, suggesting that selling pressure is weakening while buyers are beginning to regain control. With consistent volume confirming accumulation at lower levels, the setup hints at a potential bullish breakout soon. The projected move could lead to an impressive gain of around 60% to 70% once the price breaks above the wedge resistance.
This bullish momentum pattern is typically seen at the end of downtrends or corrective phases, and it represents a potential shift in market sentiment from bearish to bullish. Traders closely watching CHIPUSDT are noting the strengthening momentum as it nears a breakout zone. The good trading volume adds confidence to this pattern, showing that market participants are positioning early in anticipation of a reversal.
Investors’ growing interest in CHIPUSDT reflects rising confidence in the project’s long-term fundamentals and current technical strength. If the breakout confirms with sustained volume, this could mark the start of a fresh bullish leg. Traders might find this a valuable setup for medium-term gains, especially as the wedge pattern completes and buying momentum accelerates.
✅ Show your support by hitting the like button and
✅ Leaving a comment below! (What is You opinion about this Coin)
Your feedback and engagement keep me inspired to share more insightful market analysis with you!
$CHIP
This bullish momentum pattern is typically seen at the end of downtrends or corrective phases, and it represents a potential shift in market sentiment from bearish to bullish. Traders closely watching CHIPUSDT are noting the strengthening momentum as it nears a breakout zone. The good trading volume adds confidence to this pattern, showing that market participants are positioning early in anticipation of a reversal.
Investors’ growing interest in CHIPUSDT reflects rising confidence in the project’s long-term fundamentals and current technical strength. If the breakout confirms with sustained volume, this could mark the start of a fresh bullish leg. Traders might find this a valuable setup for medium-term gains, especially as the wedge pattern completes and buying momentum accelerates.
✅ Show your support by hitting the like button and
✅ Leaving a comment below! (What is You opinion about this Coin)
Your feedback and engagement keep me inspired to share more insightful market analysis with you!
$CHIP
196
Log in to explore more content
Join global crypto users on Binance Square
⚡️ Get latest and useful information about crypto.
💬 Trusted by the world’s largest crypto exchange.
👍 Discover real insights from verified creators.
Email / Phone number
Trending Topics
BinanceLaunchesBinanceIntelligence
613,876 views
3,791 Discussing
#binancelaunchesbinanceintelligence
🚨 BINANCE JUST PUSHED AI DEEPER INTO CRYPTO.
Binance has launched Binance Intelligence — a new AI-powered layer built around market research, trading workflows, and crypto data.
The interesting part?
It’s not just one tool.
🧠 Binance AI → personalized market briefs, alerts and portfolio insights
⚡ Binance AI Pro → turns natural-language ideas into trading workflows
🤖 Agent OS → connects AI agents with market, wallet and on-chain capabilities
That’s a big shift.
Crypto platforms are no longer only giving traders charts and data.
They’re starting to give them AI systems that can interpret that data.
The real question is:
Will AI become as normal for traders as indicators and charts are today? 👀
$BTC $ETH
#Binance #Aİ #crypto #BTC
Doomsday-Trader
·0 Likes
·432 views
BTCFallsBelow$84K
1,423 views
24 Discussing
WinklevossFilesSpotZcashETFApplication
3,653 views
96 Discussing