
Crypto Skull Signal
7.8k Posts

Crypto Skull Signal
 Square Verified+
X.com/SkullSignal 👈 I’m not only a pretty face… I’ll show step by step how to beat this market, because I already did. Welcome to the family

Level 1 Creator
4 Following
55.8K+ Followers
93.1K+ Liked
1 Badges
Posts
All
Quotes
Videos
PINNED
#BITCOIN ANALYSIS
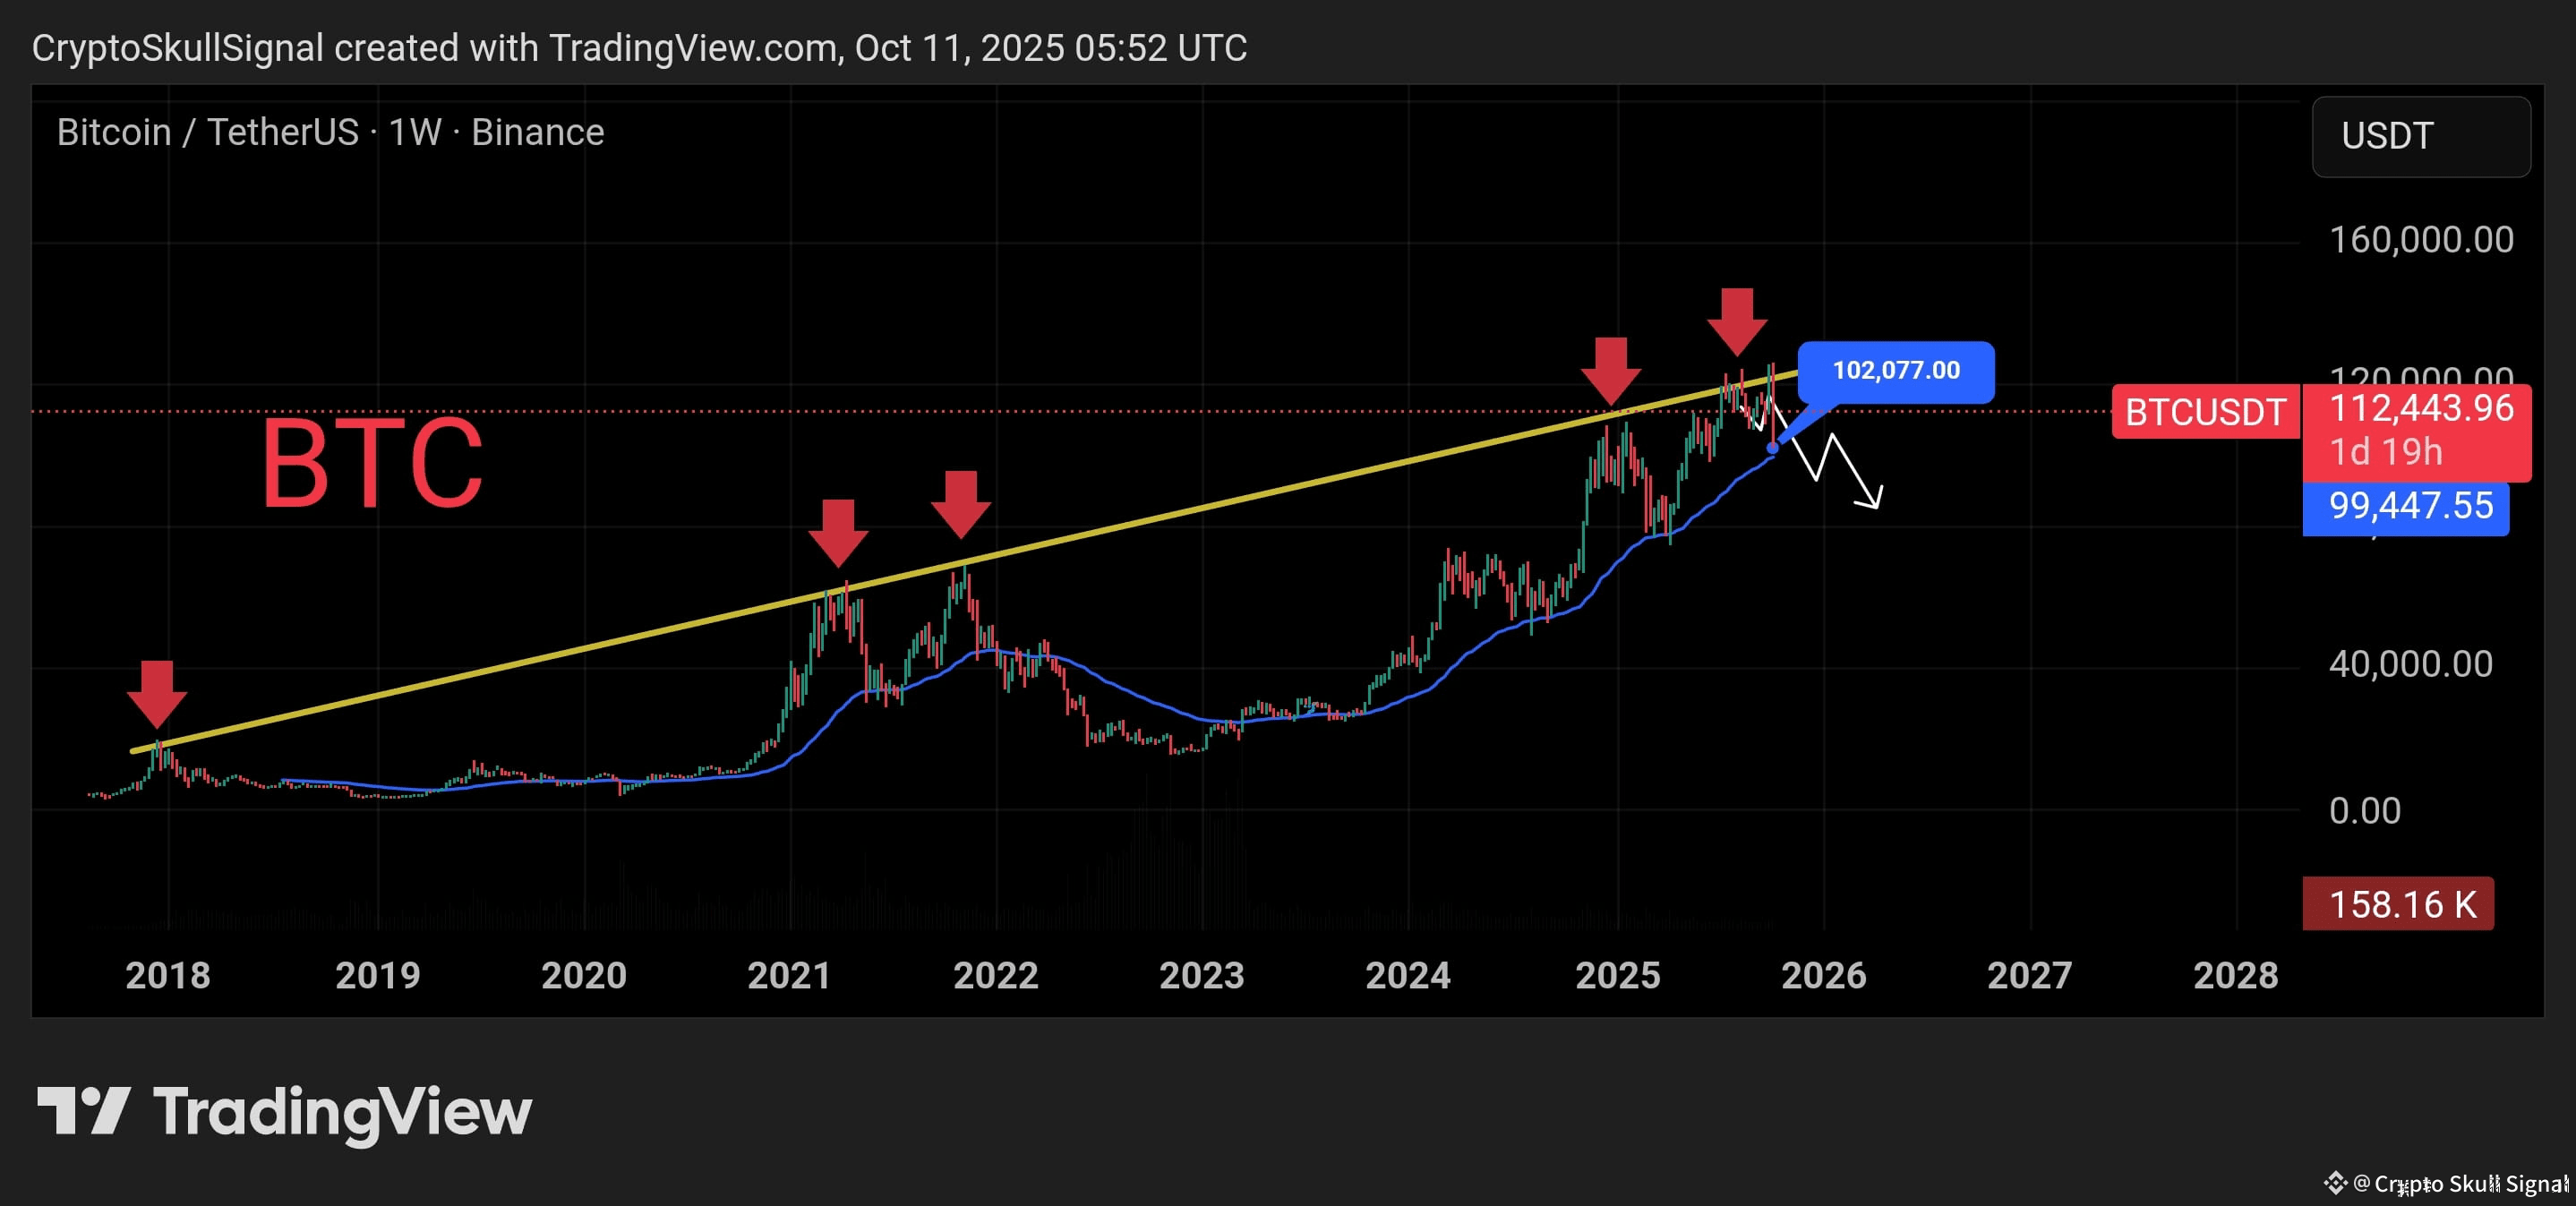
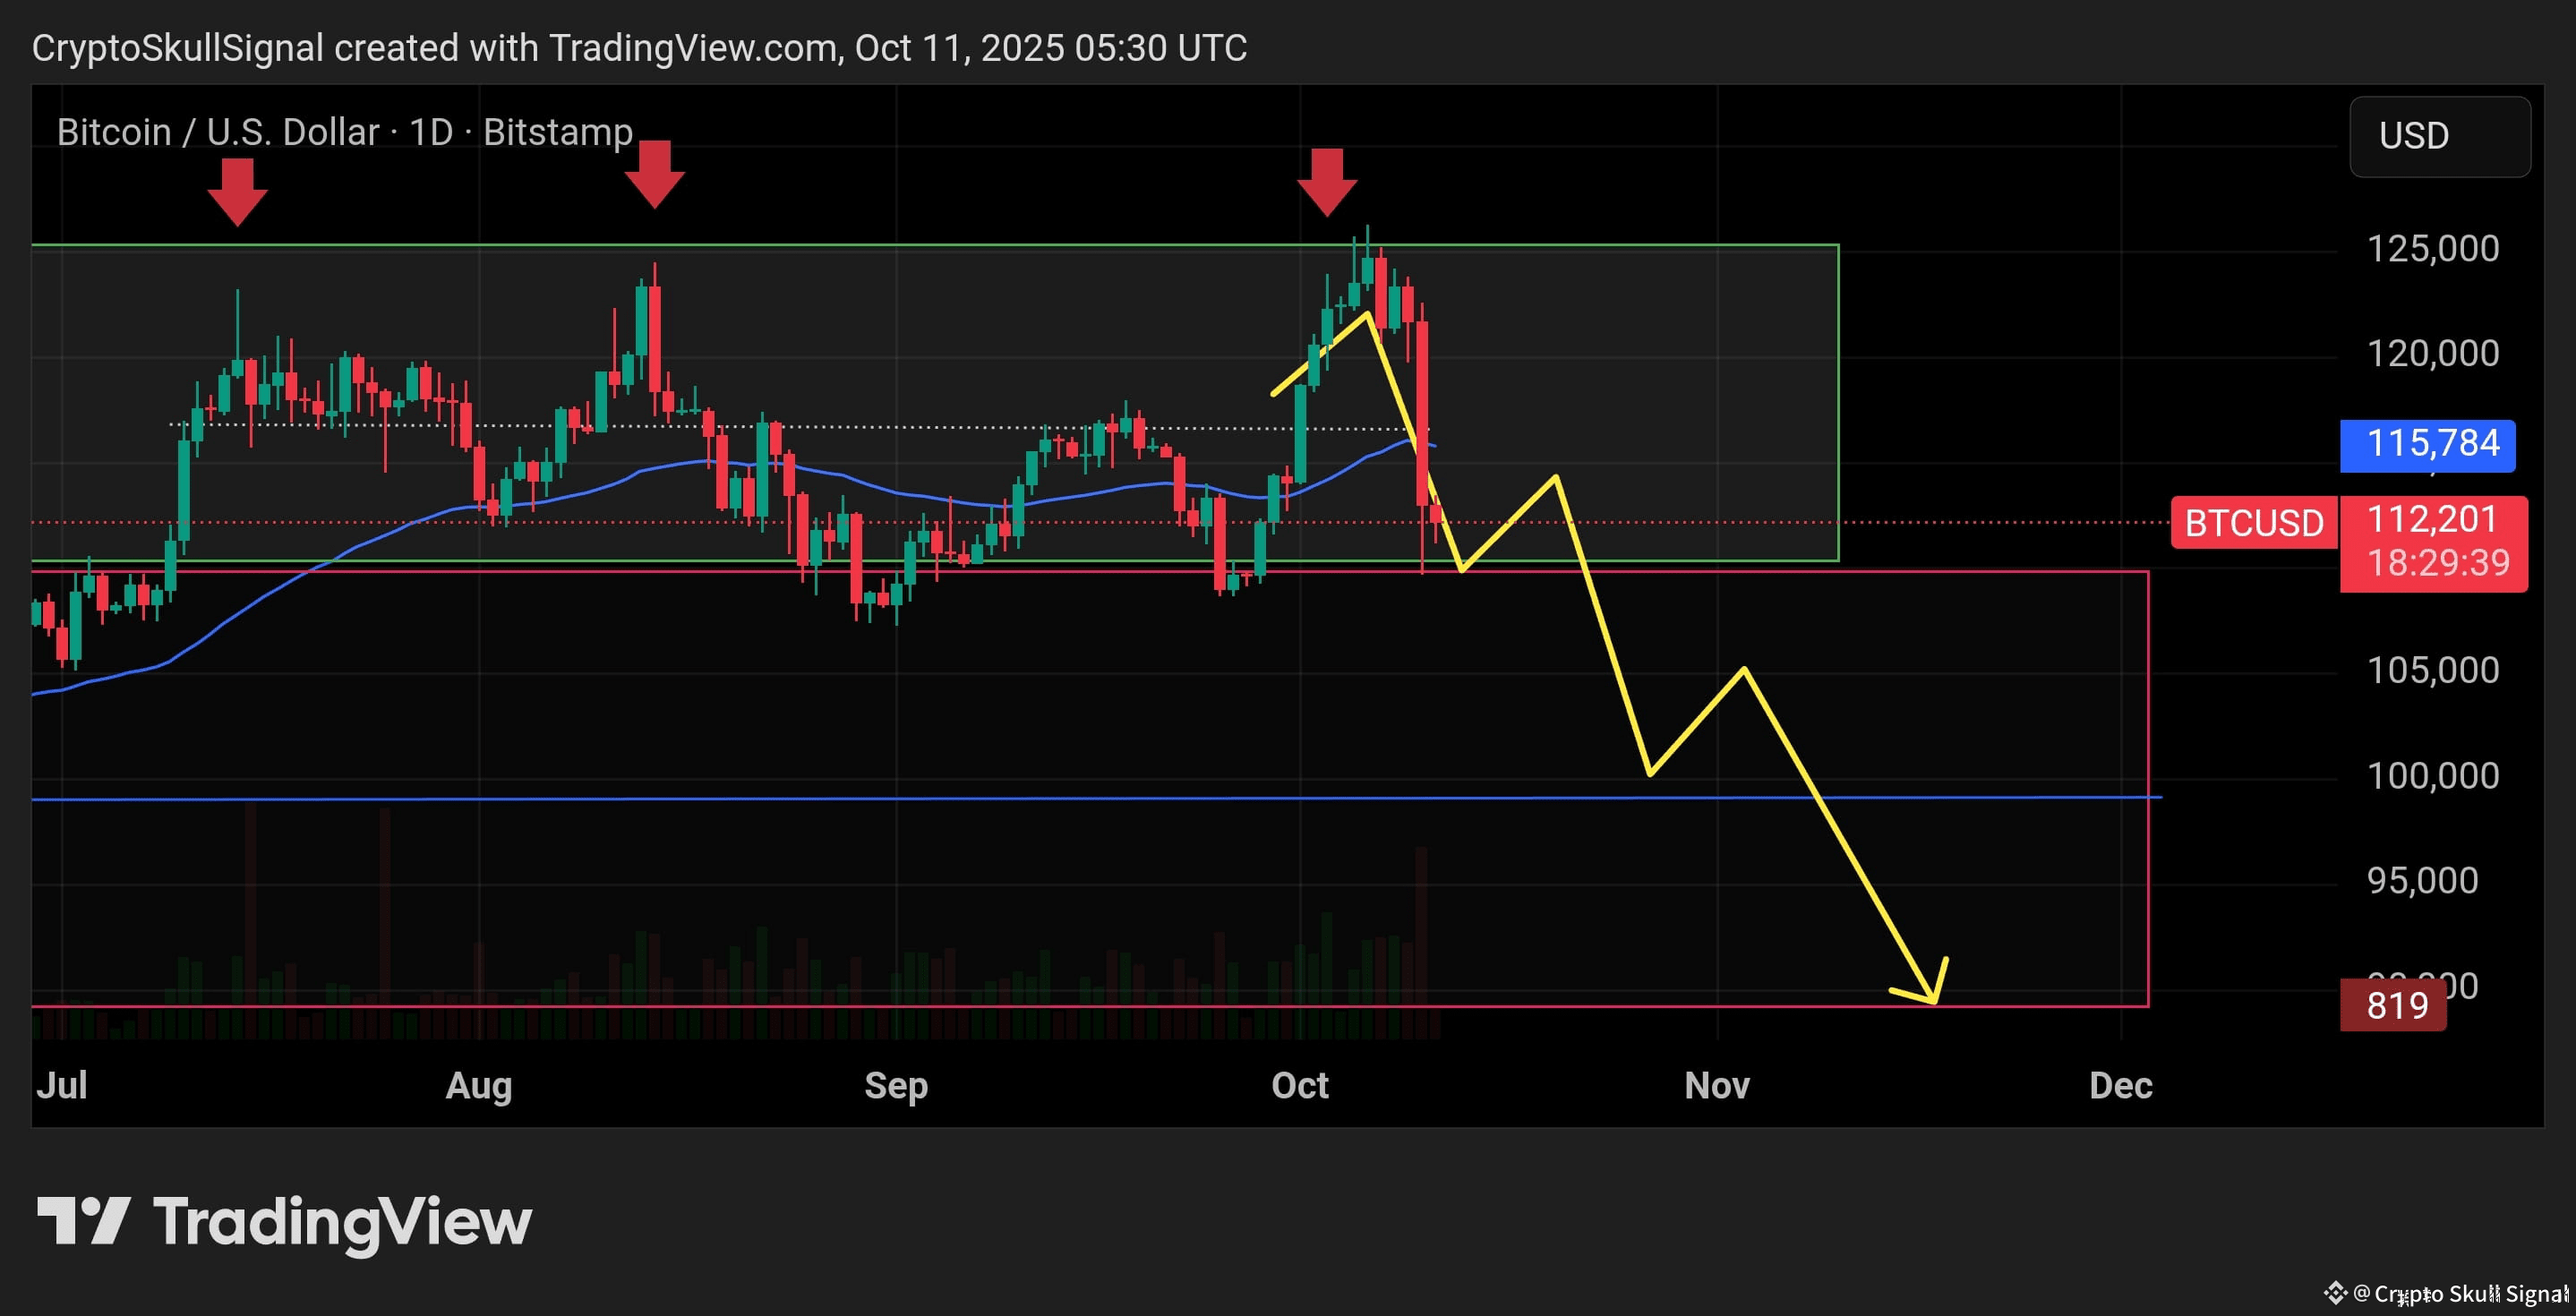
I have been warning you for the last 45 days that a big dump was coming and now it’s playing out exactly. Bitcoin has already dumped around $20K and is now trading near 112K, right at the major resistance zone that has triggered every big correction since 2018.
A small bounce to 115K–116K is possible, but after that I expect another leg down toward 100K, and potentially lower to 90K.
I’m still holding my 50% short position. If anything changes or I close my position, I’ll update you. Remember I mentioned earlier that if BTC went back to 125K–128K, I would add more shorts and that plan hasn’t changed.
Till Monday, I expect some volatility, but Monday’s price action will give a clearer direction.
🔸 Weekly:
BTC touched the long-term trendline again → clear rejection happened.
👉 Until we get a weekly close above 125K, the risk of a major pullback stays high.
🔸 Daily:
Price is inside the 110K–125K supply zone. Structure is weak.
If price breaks and resists below 110K, then 100K is the next target.
📊 My Trade:
✅ First target 105K hit
Holding 50% shorts, expecting a bounce to 115K, then lower.
📌 Downside Targets: 105K ✅ → 100K → 95K → 90K
$BTC #TrumpTariffs
I have been warning you for the last 45 days that a big dump was coming and now it’s playing out exactly. Bitcoin has already dumped around $20K and is now trading near 112K, right at the major resistance zone that has triggered every big correction since 2018.
A small bounce to 115K–116K is possible, but after that I expect another leg down toward 100K, and potentially lower to 90K.
I’m still holding my 50% short position. If anything changes or I close my position, I’ll update you. Remember I mentioned earlier that if BTC went back to 125K–128K, I would add more shorts and that plan hasn’t changed.
Till Monday, I expect some volatility, but Monday’s price action will give a clearer direction.
🔸 Weekly:
BTC touched the long-term trendline again → clear rejection happened.
👉 Until we get a weekly close above 125K, the risk of a major pullback stays high.
🔸 Daily:
Price is inside the 110K–125K supply zone. Structure is weak.
If price breaks and resists below 110K, then 100K is the next target.
📊 My Trade:
✅ First target 105K hit
Holding 50% shorts, expecting a bounce to 115K, then lower.
📌 Downside Targets: 105K ✅ → 100K → 95K → 90K
$BTC #TrumpTariffs
Crypto Skull Signal
·
--
Bearish#BITCOIN ANALYSIS
For the last 40 days I’ve been telling you guys I’m bearish on $BTC. We already dropped almost 8K twice, but every time Bitcoin reclaimed the levels again. Right now it’s trading around 18K to 119k but nothing has changed for me. I’m still bearish.
I’ve said many times that the 115K to 124K region is a short zone, not a long zone. If you’re still holding longs, I’d strongly suggest you flip to shorts because the chart is flashing multiple top signals.
Don’t get trapped by hype like “Bitcoin to 1 million by the end of this year.” That’s just noise. The structure is weak, liquidity is being engineered, and the bigger downside move is still ahead.
📌 Downside Targets:
105K → 100K → 95K → 90K
$BTC
For the last 40 days I’ve been telling you guys I’m bearish on $BTC. We already dropped almost 8K twice, but every time Bitcoin reclaimed the levels again. Right now it’s trading around 18K to 119k but nothing has changed for me. I’m still bearish.
I’ve said many times that the 115K to 124K region is a short zone, not a long zone. If you’re still holding longs, I’d strongly suggest you flip to shorts because the chart is flashing multiple top signals.
Don’t get trapped by hype like “Bitcoin to 1 million by the end of this year.” That’s just noise. The structure is weak, liquidity is being engineered, and the bigger downside move is still ahead.
📌 Downside Targets:
105K → 100K → 95K → 90K
$BTC
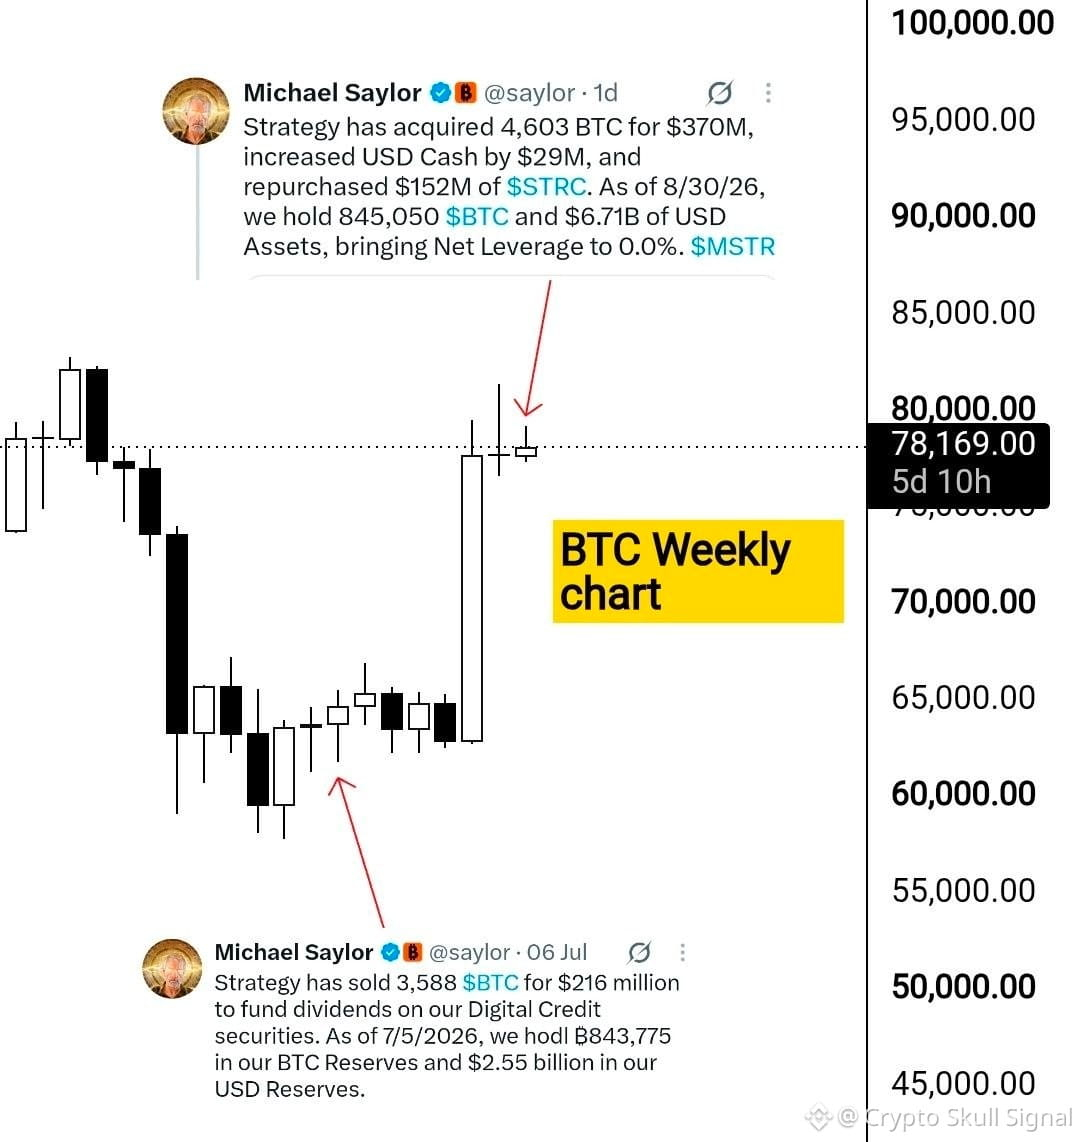
Saylor is playing retail perfectly, treating them like dumb money.
Selling posts at the bottom → creating panic.
Buying posts at the top → creating FOMO.
Selling posts at the bottom → creating panic.
Buying posts at the top → creating FOMO.
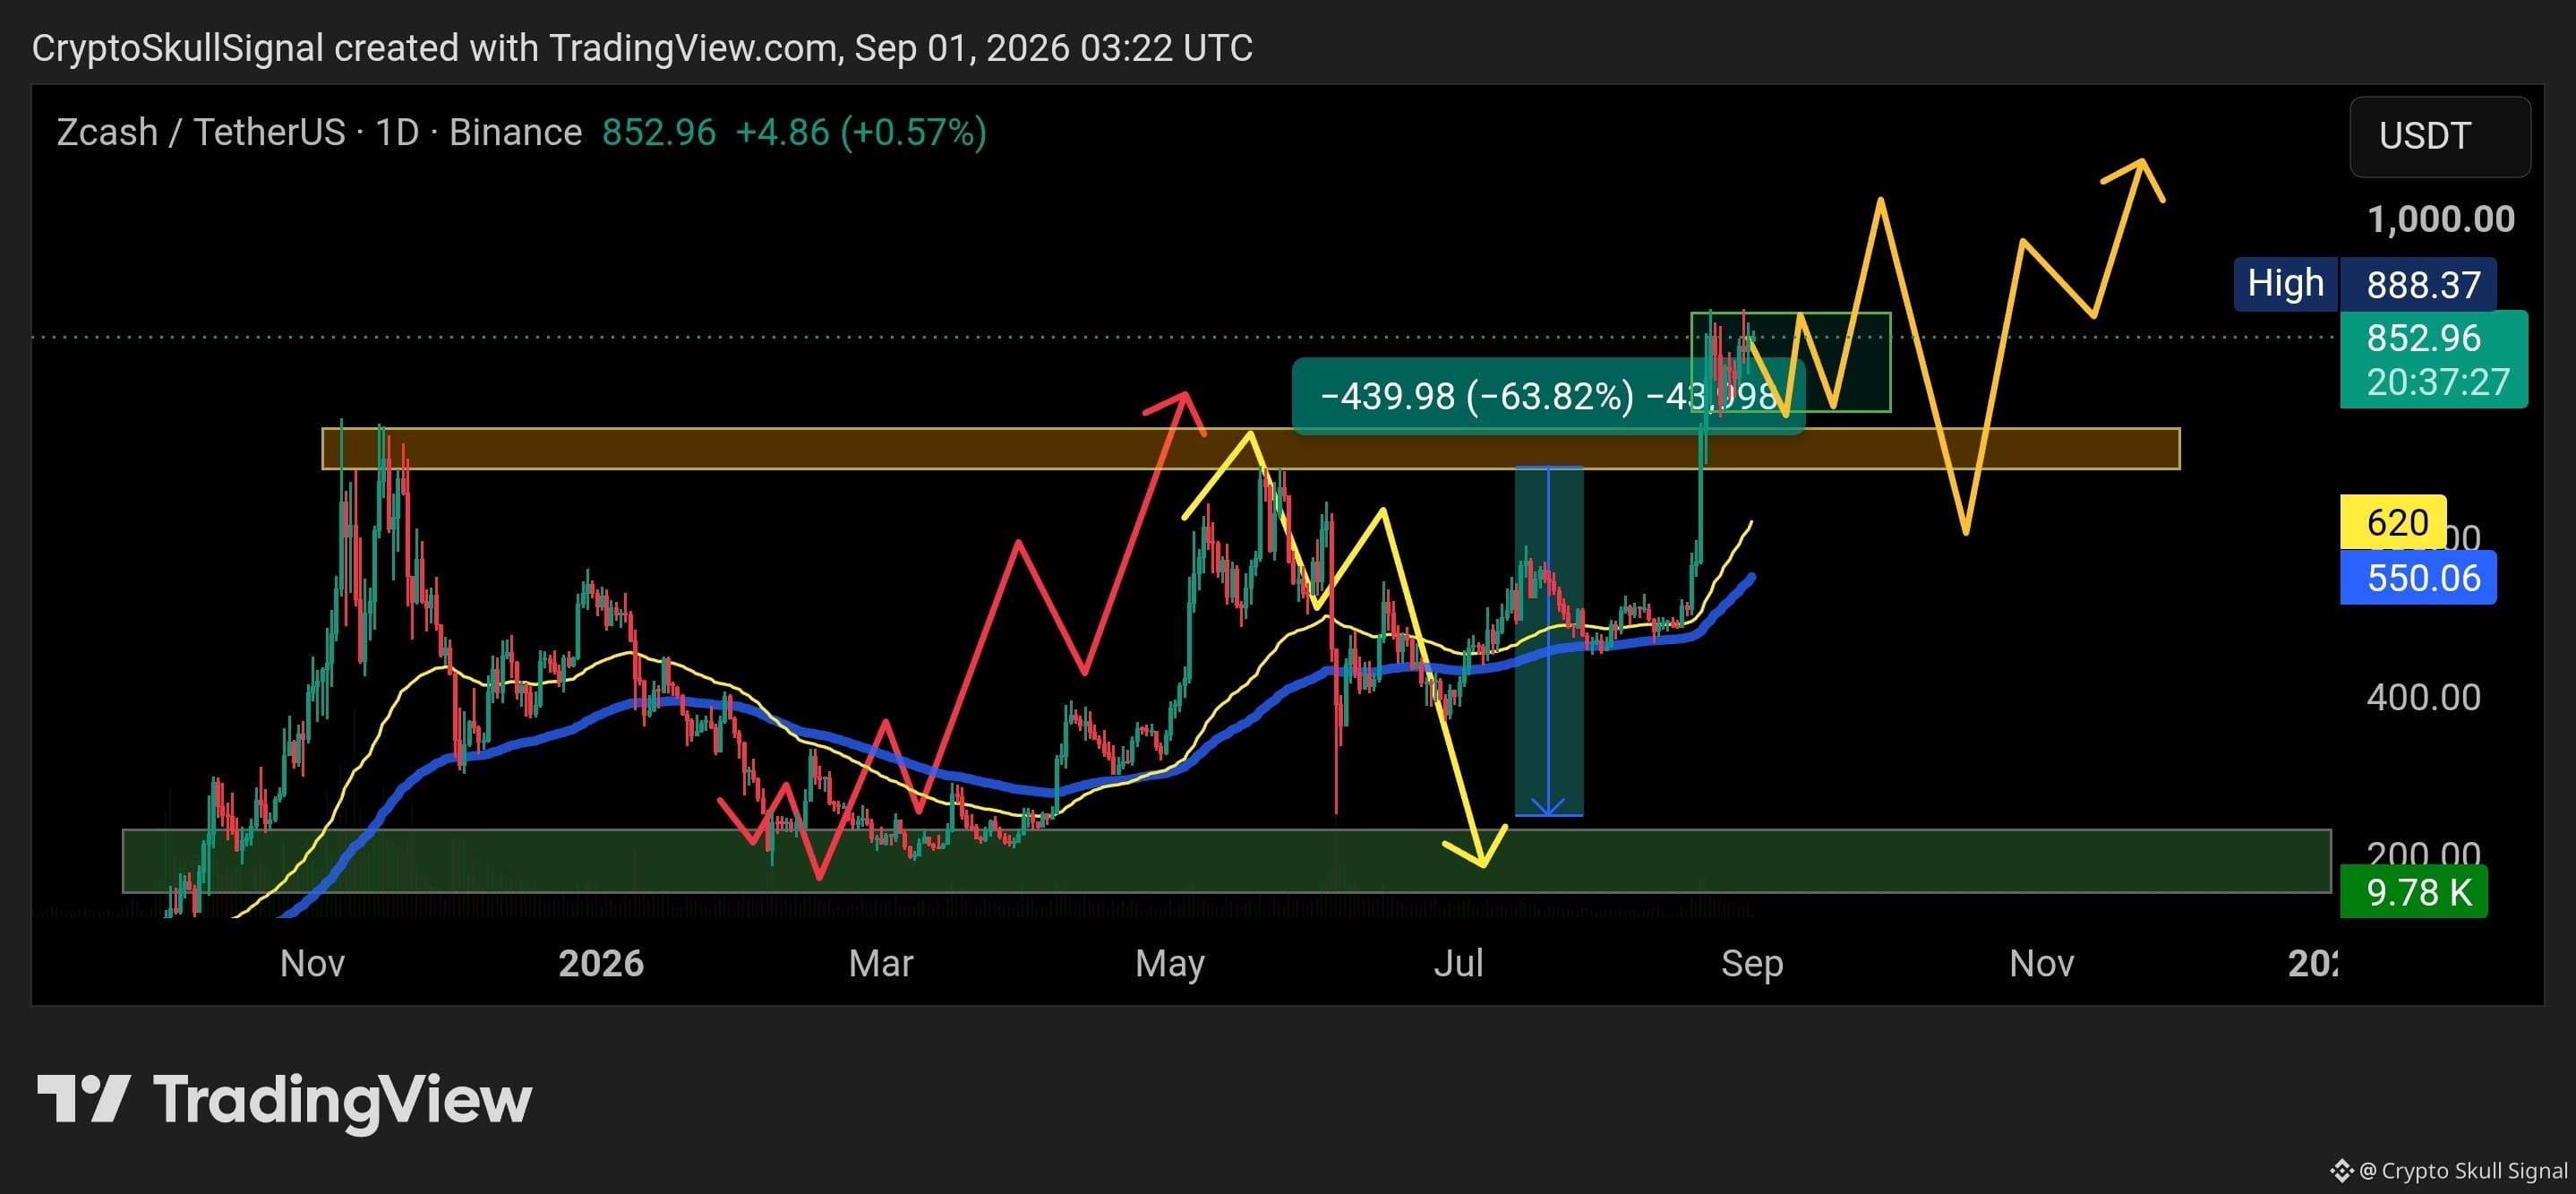
$ZEC BREAKOUT UPDATE 🚀
$ZEC has finally broken out of the major resistance zone, exactly as we were waiting for. The previous resistance is now turning into support.
We already caught 3 successful moves on $ZEC , including the last move of around 63% 📈
Now the key area is $688–$737. As long as $ZEC holds above this support zone, I remain bullish and believe it can easily push toward and above $1,000.
But losing this support zone would make the setup highly risky again, so this is the level I’m watching closely.
For now, breakout is confirmed, support is holding, and I’m bullish on $ZEC .
Target: $1,000+ 🚀
$ZEC has finally broken out of the major resistance zone, exactly as we were waiting for. The previous resistance is now turning into support.
We already caught 3 successful moves on $ZEC , including the last move of around 63% 📈
Now the key area is $688–$737. As long as $ZEC holds above this support zone, I remain bullish and believe it can easily push toward and above $1,000.
But losing this support zone would make the setup highly risky again, so this is the level I’m watching closely.
For now, breakout is confirmed, support is holding, and I’m bullish on $ZEC .
Target: $1,000+ 🚀
Crypto Skull Signal
·
--
Bullish$ZEC hit the major resistance zone exactly as expected and saw a sharp rejection. 🎯
The weekly chart now suggests a deeper correction could be underway.
As long as bulls fail to reclaim the $600-$700 region, price may continue trending lower toward the key demand zone around $155-$229.
That area will be the most important level to watch for a potential bottom and the next bullish reversal. 👀
The weekly chart now suggests a deeper correction could be underway.
As long as bulls fail to reclaim the $600-$700 region, price may continue trending lower toward the key demand zone around $155-$229.
That area will be the most important level to watch for a potential bottom and the next bullish reversal. 👀
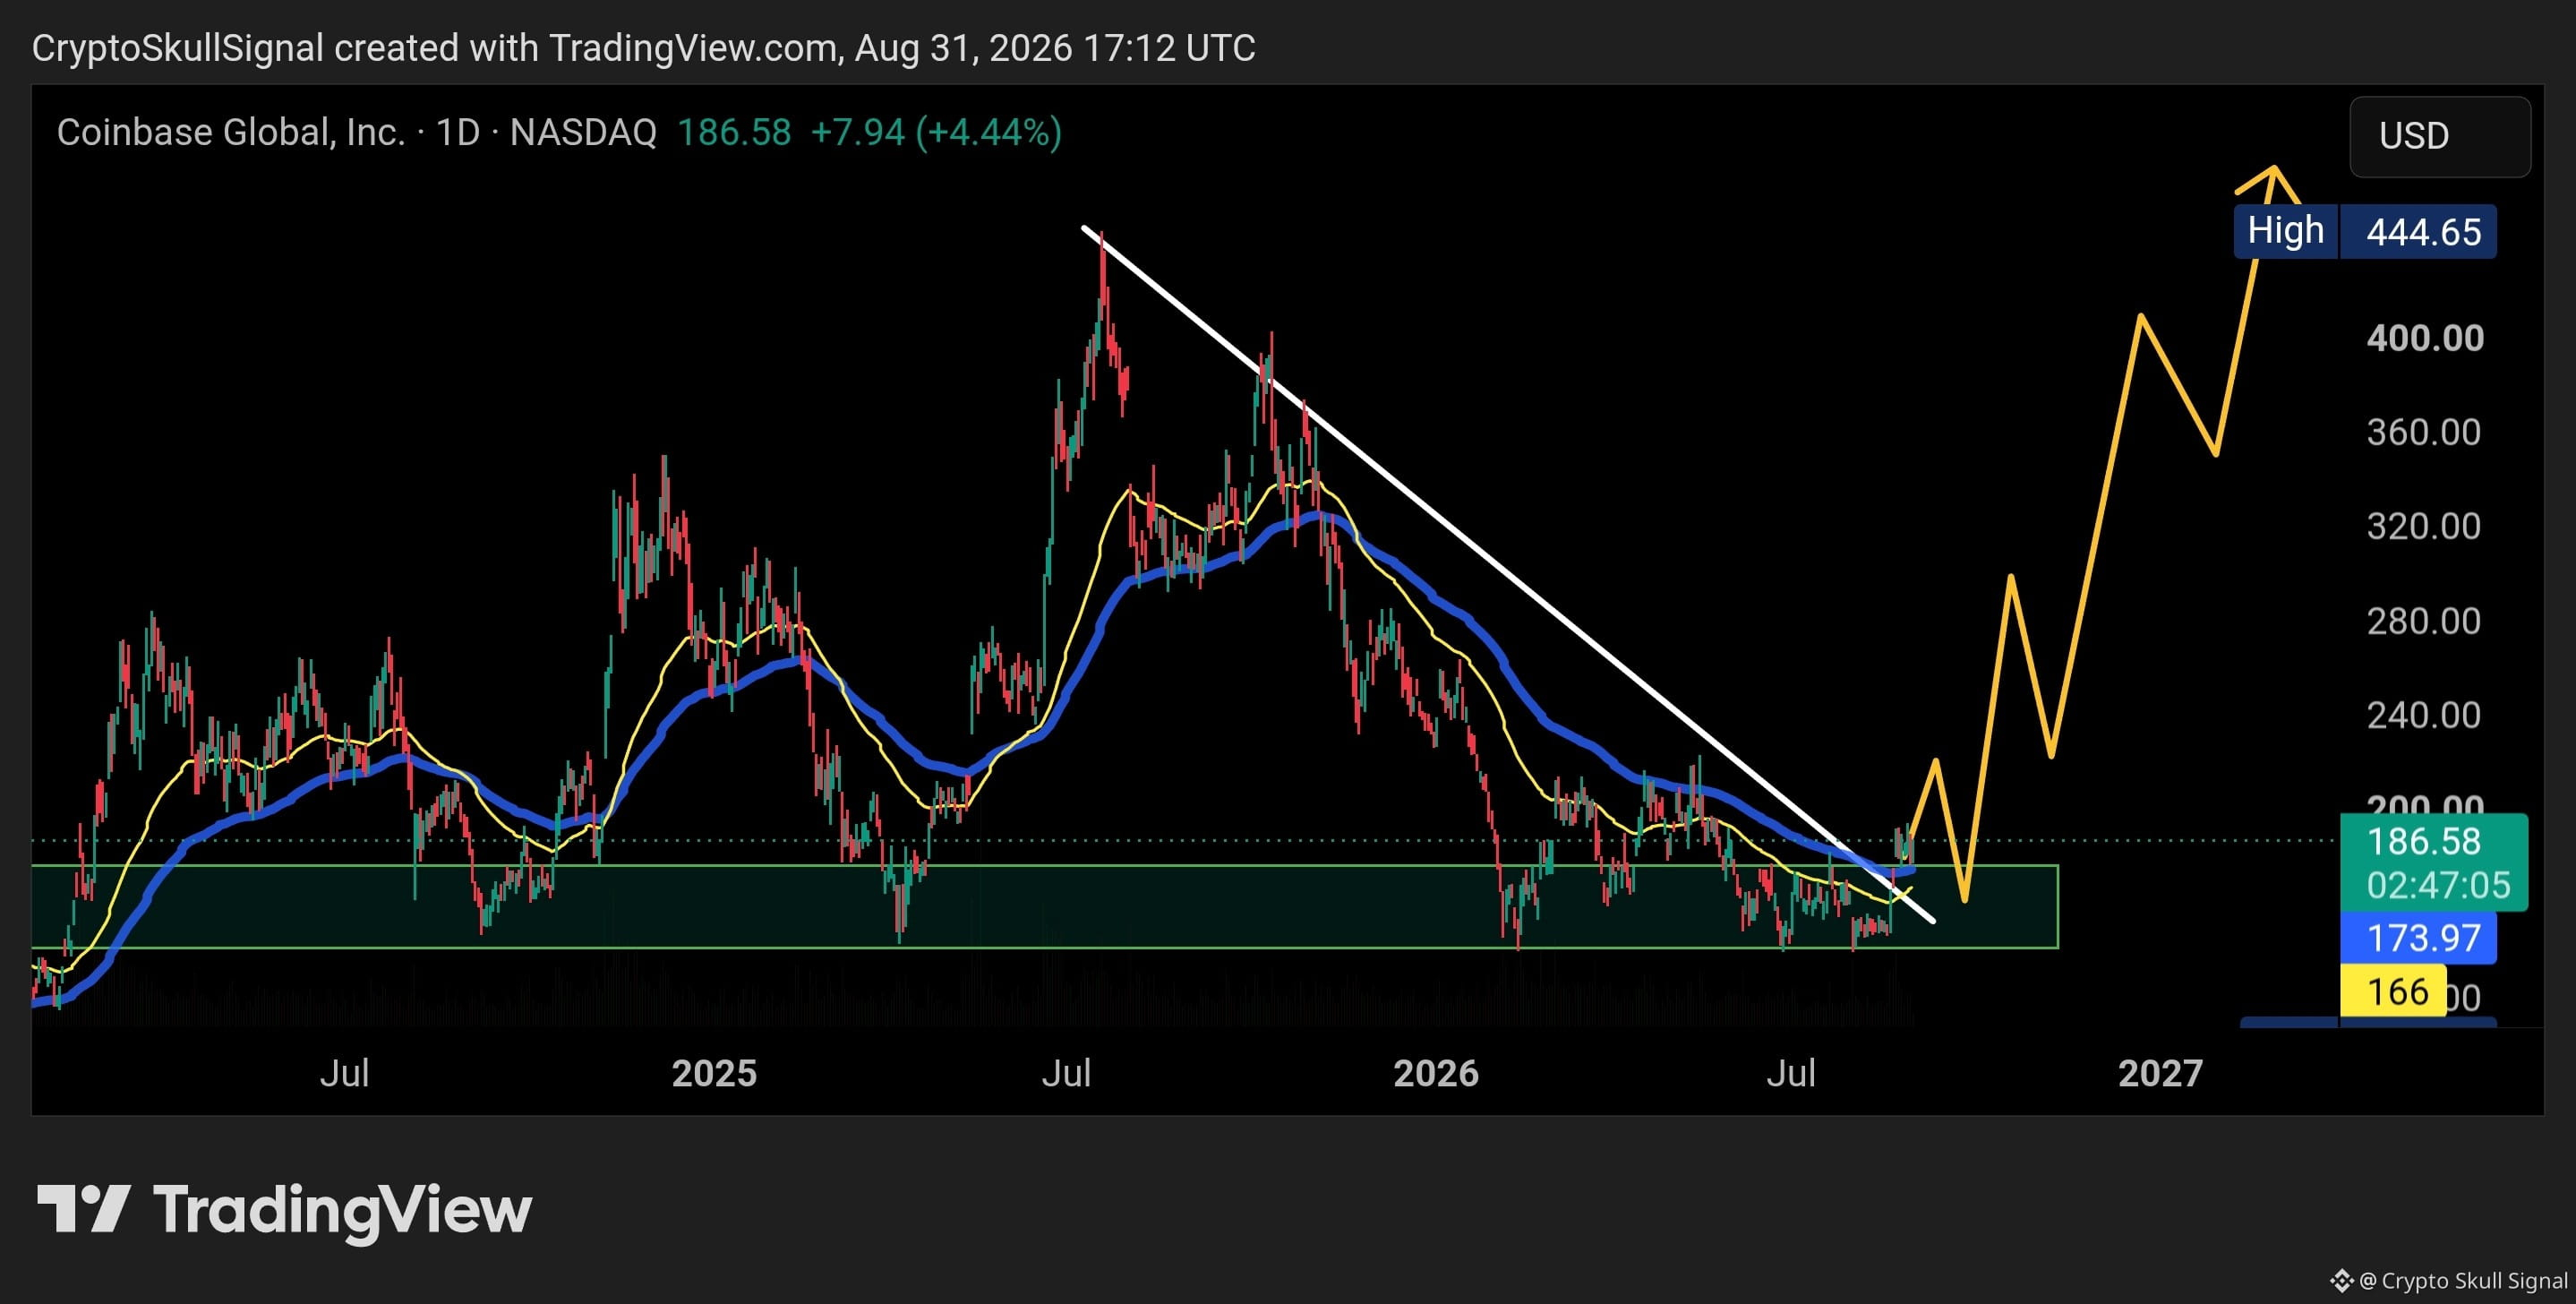
$COIN HAS BROKEN OUT 🚀
After a long accumulation inside the $142–$176 zone, $COIN has now broken above the accumulation zone and the major descending trendline.
Price is also trading above the EMAs and starting to spread higher, which keeps the bullish structure strong.
As long as $COIN holds above $176, I remain strongly bullish and expect further upside. A successful retest of the breakout area could trigger the next leg higher.
Upside targets: $240 → $280 → $320 → $360 → $400+ 🚀
The previous high around $444 remains the bigger target.
$142–$176 = Accumulation Zone
Above $176 = Strong Bullish 🚀
Below $142 = Bearish Invalidation 🔴
After a long accumulation inside the $142–$176 zone, $COIN has now broken above the accumulation zone and the major descending trendline.
Price is also trading above the EMAs and starting to spread higher, which keeps the bullish structure strong.
As long as $COIN holds above $176, I remain strongly bullish and expect further upside. A successful retest of the breakout area could trigger the next leg higher.
Upside targets: $240 → $280 → $320 → $360 → $400+ 🚀
The previous high around $444 remains the bigger target.
$142–$176 = Accumulation Zone
Above $176 = Strong Bullish 🚀
Below $142 = Bearish Invalidation 🔴
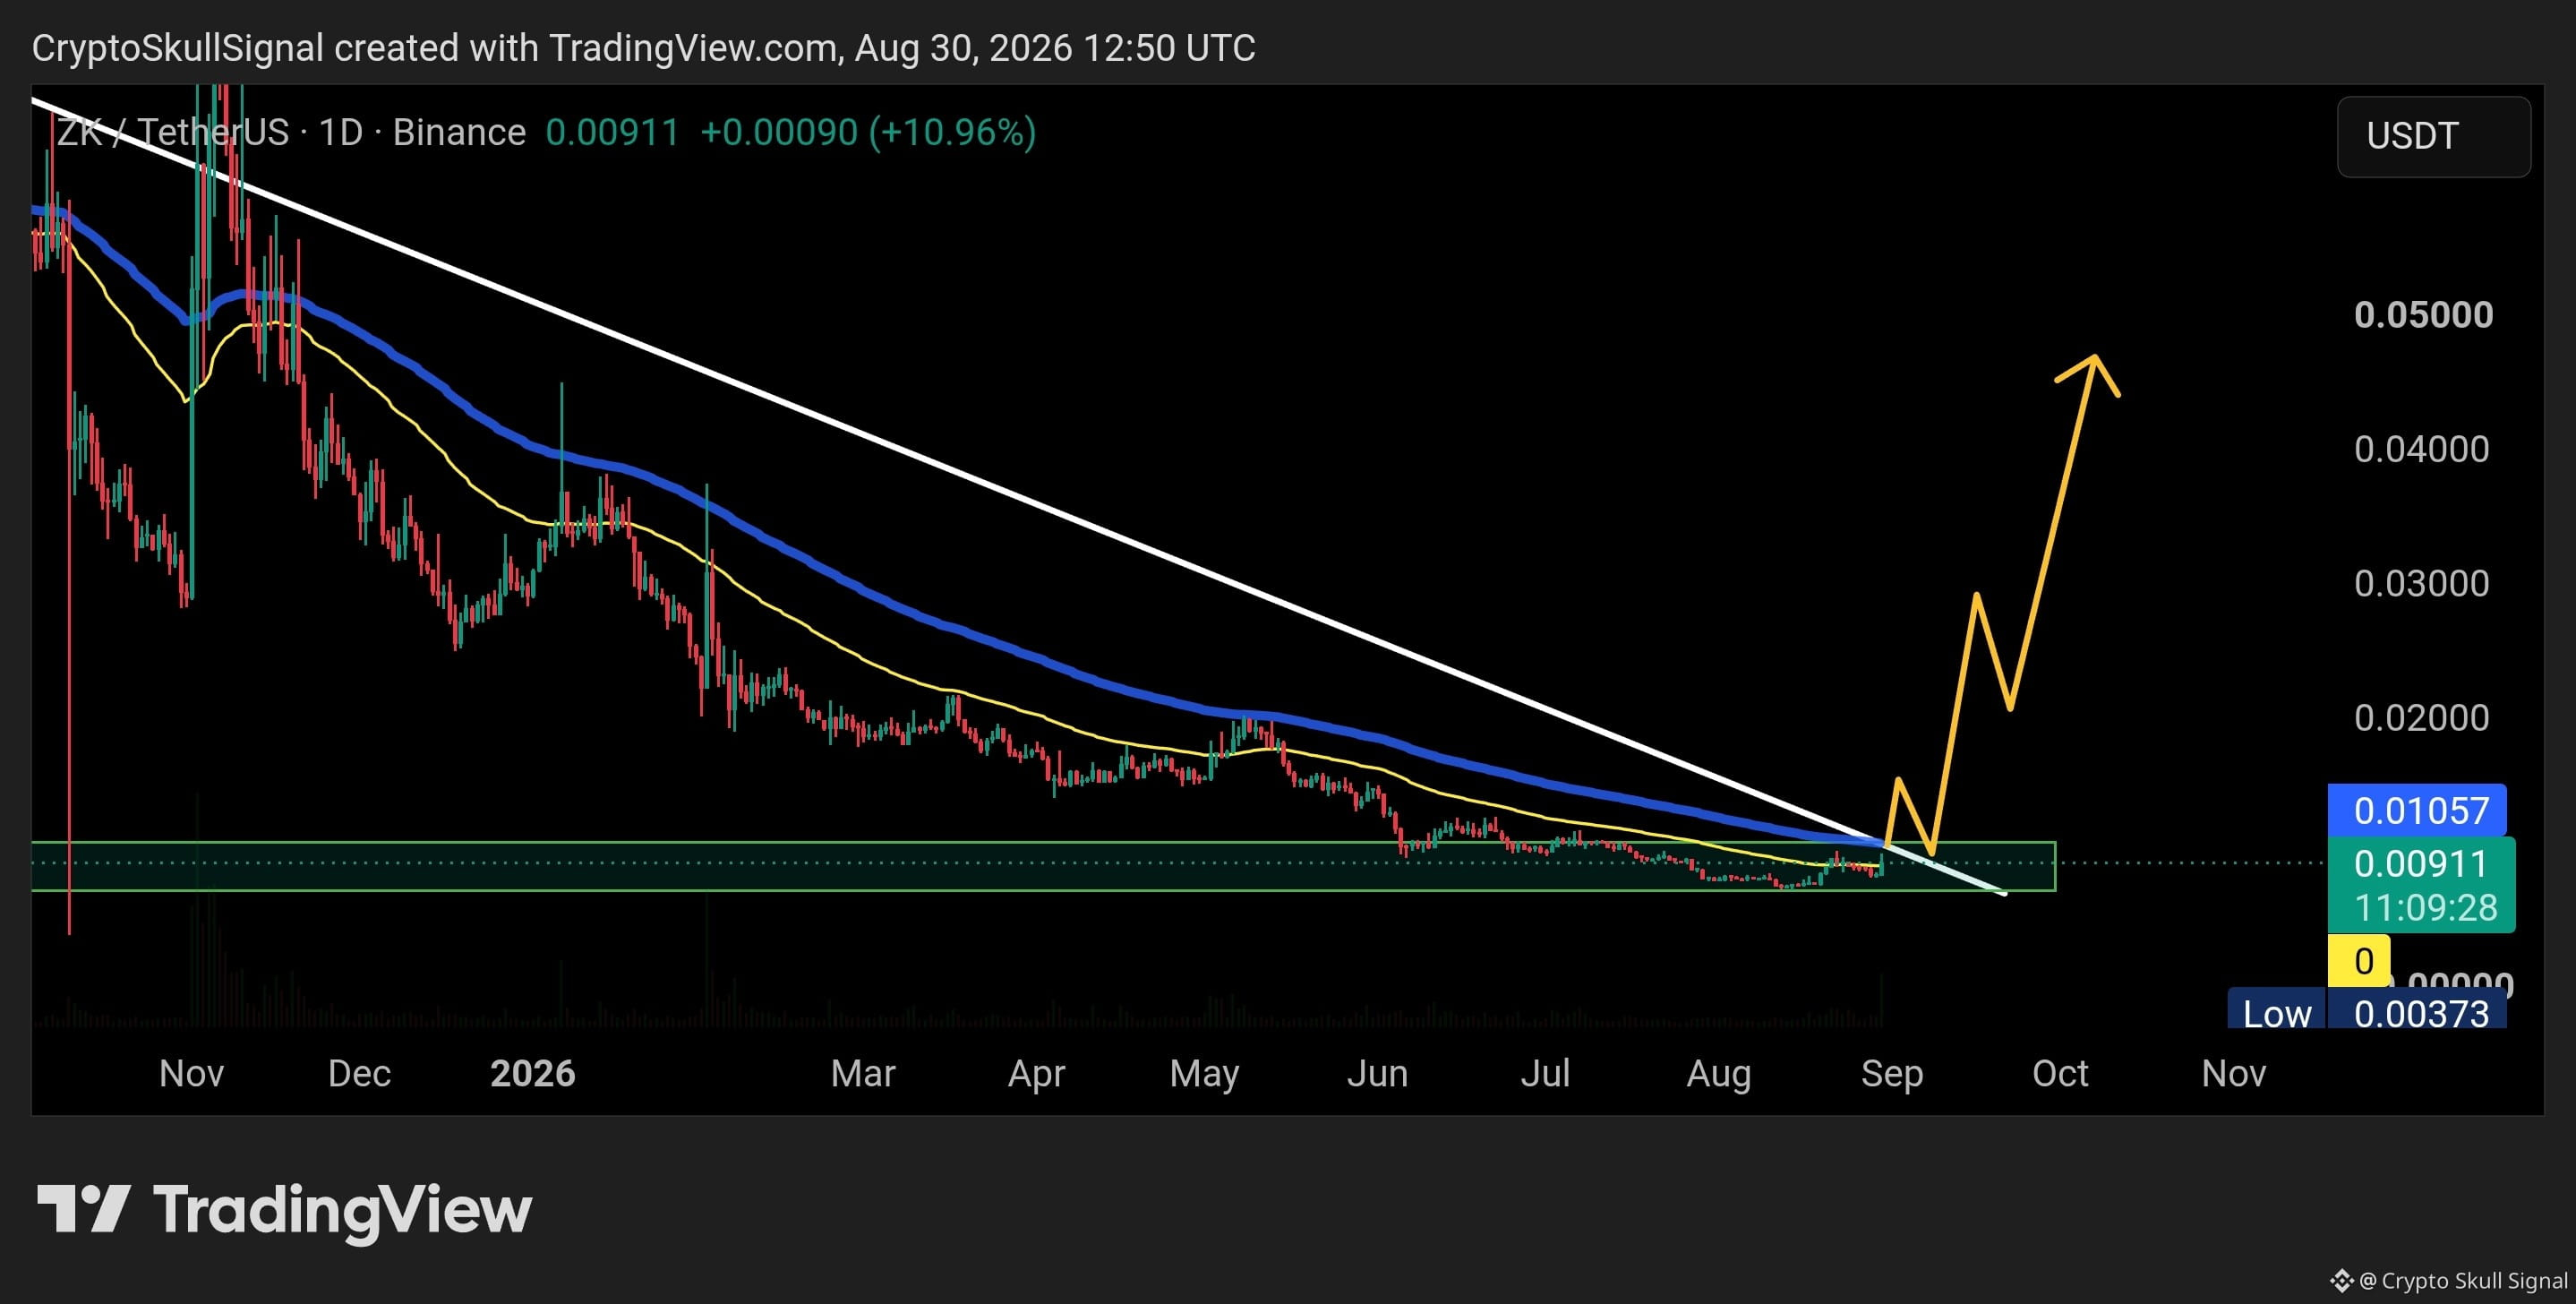
$ZK is finally showing some strength. 👀
Price is holding the accumulation zone and pushing into the long-term downtrend resistance.
If we break and hold above the $0.0105 area, I’m expecting the next move toward $0.02, with $0.03–$0.045 possible if momentum continues.
Still bullish as long as the accumulation zone holds. 📈
Price is holding the accumulation zone and pushing into the long-term downtrend resistance.
If we break and hold above the $0.0105 area, I’m expecting the next move toward $0.02, with $0.03–$0.045 possible if momentum continues.
Still bullish as long as the accumulation zone holds. 📈
🟠 BTC SUNDAY ANALYSIS
Nothing changed from my last update. I’m still looking at this move as a possible trap pump.
BTC is around $78K, but the level I’m watching is still $82K. I already told you, I need a weekly candle close above $82K and then BTC must hold above it. Until that happens, I’m not changing my view.
Right now, it looks like this weekly candle will close below $82K.
One important thing has changed though: $70K-$72K is now support. The same zone I was calling resistance before has now turned into support.
So watch these two levels closely:
🔴 $82K = Key resistance
🟢 $70K-$72K = Key support
If BTC breaks and holds above $82K, I will reconsider my bearish view.
But if BTC comes back to $70K-$72K and fails to hold this support, then I will take that as a strong confirmation that this pump was a trap.
For now, I’m still holding my short position and waiting.
Nothing changed. Let’s see what Bitcoin does next. 👀
$BTC
Nothing changed from my last update. I’m still looking at this move as a possible trap pump.
BTC is around $78K, but the level I’m watching is still $82K. I already told you, I need a weekly candle close above $82K and then BTC must hold above it. Until that happens, I’m not changing my view.
Right now, it looks like this weekly candle will close below $82K.
One important thing has changed though: $70K-$72K is now support. The same zone I was calling resistance before has now turned into support.
So watch these two levels closely:
🔴 $82K = Key resistance
🟢 $70K-$72K = Key support
If BTC breaks and holds above $82K, I will reconsider my bearish view.
But if BTC comes back to $70K-$72K and fails to hold this support, then I will take that as a strong confirmation that this pump was a trap.
For now, I’m still holding my short position and waiting.
Nothing changed. Let’s see what Bitcoin does next. 👀
$BTC
Crypto Skull Signal
·
--
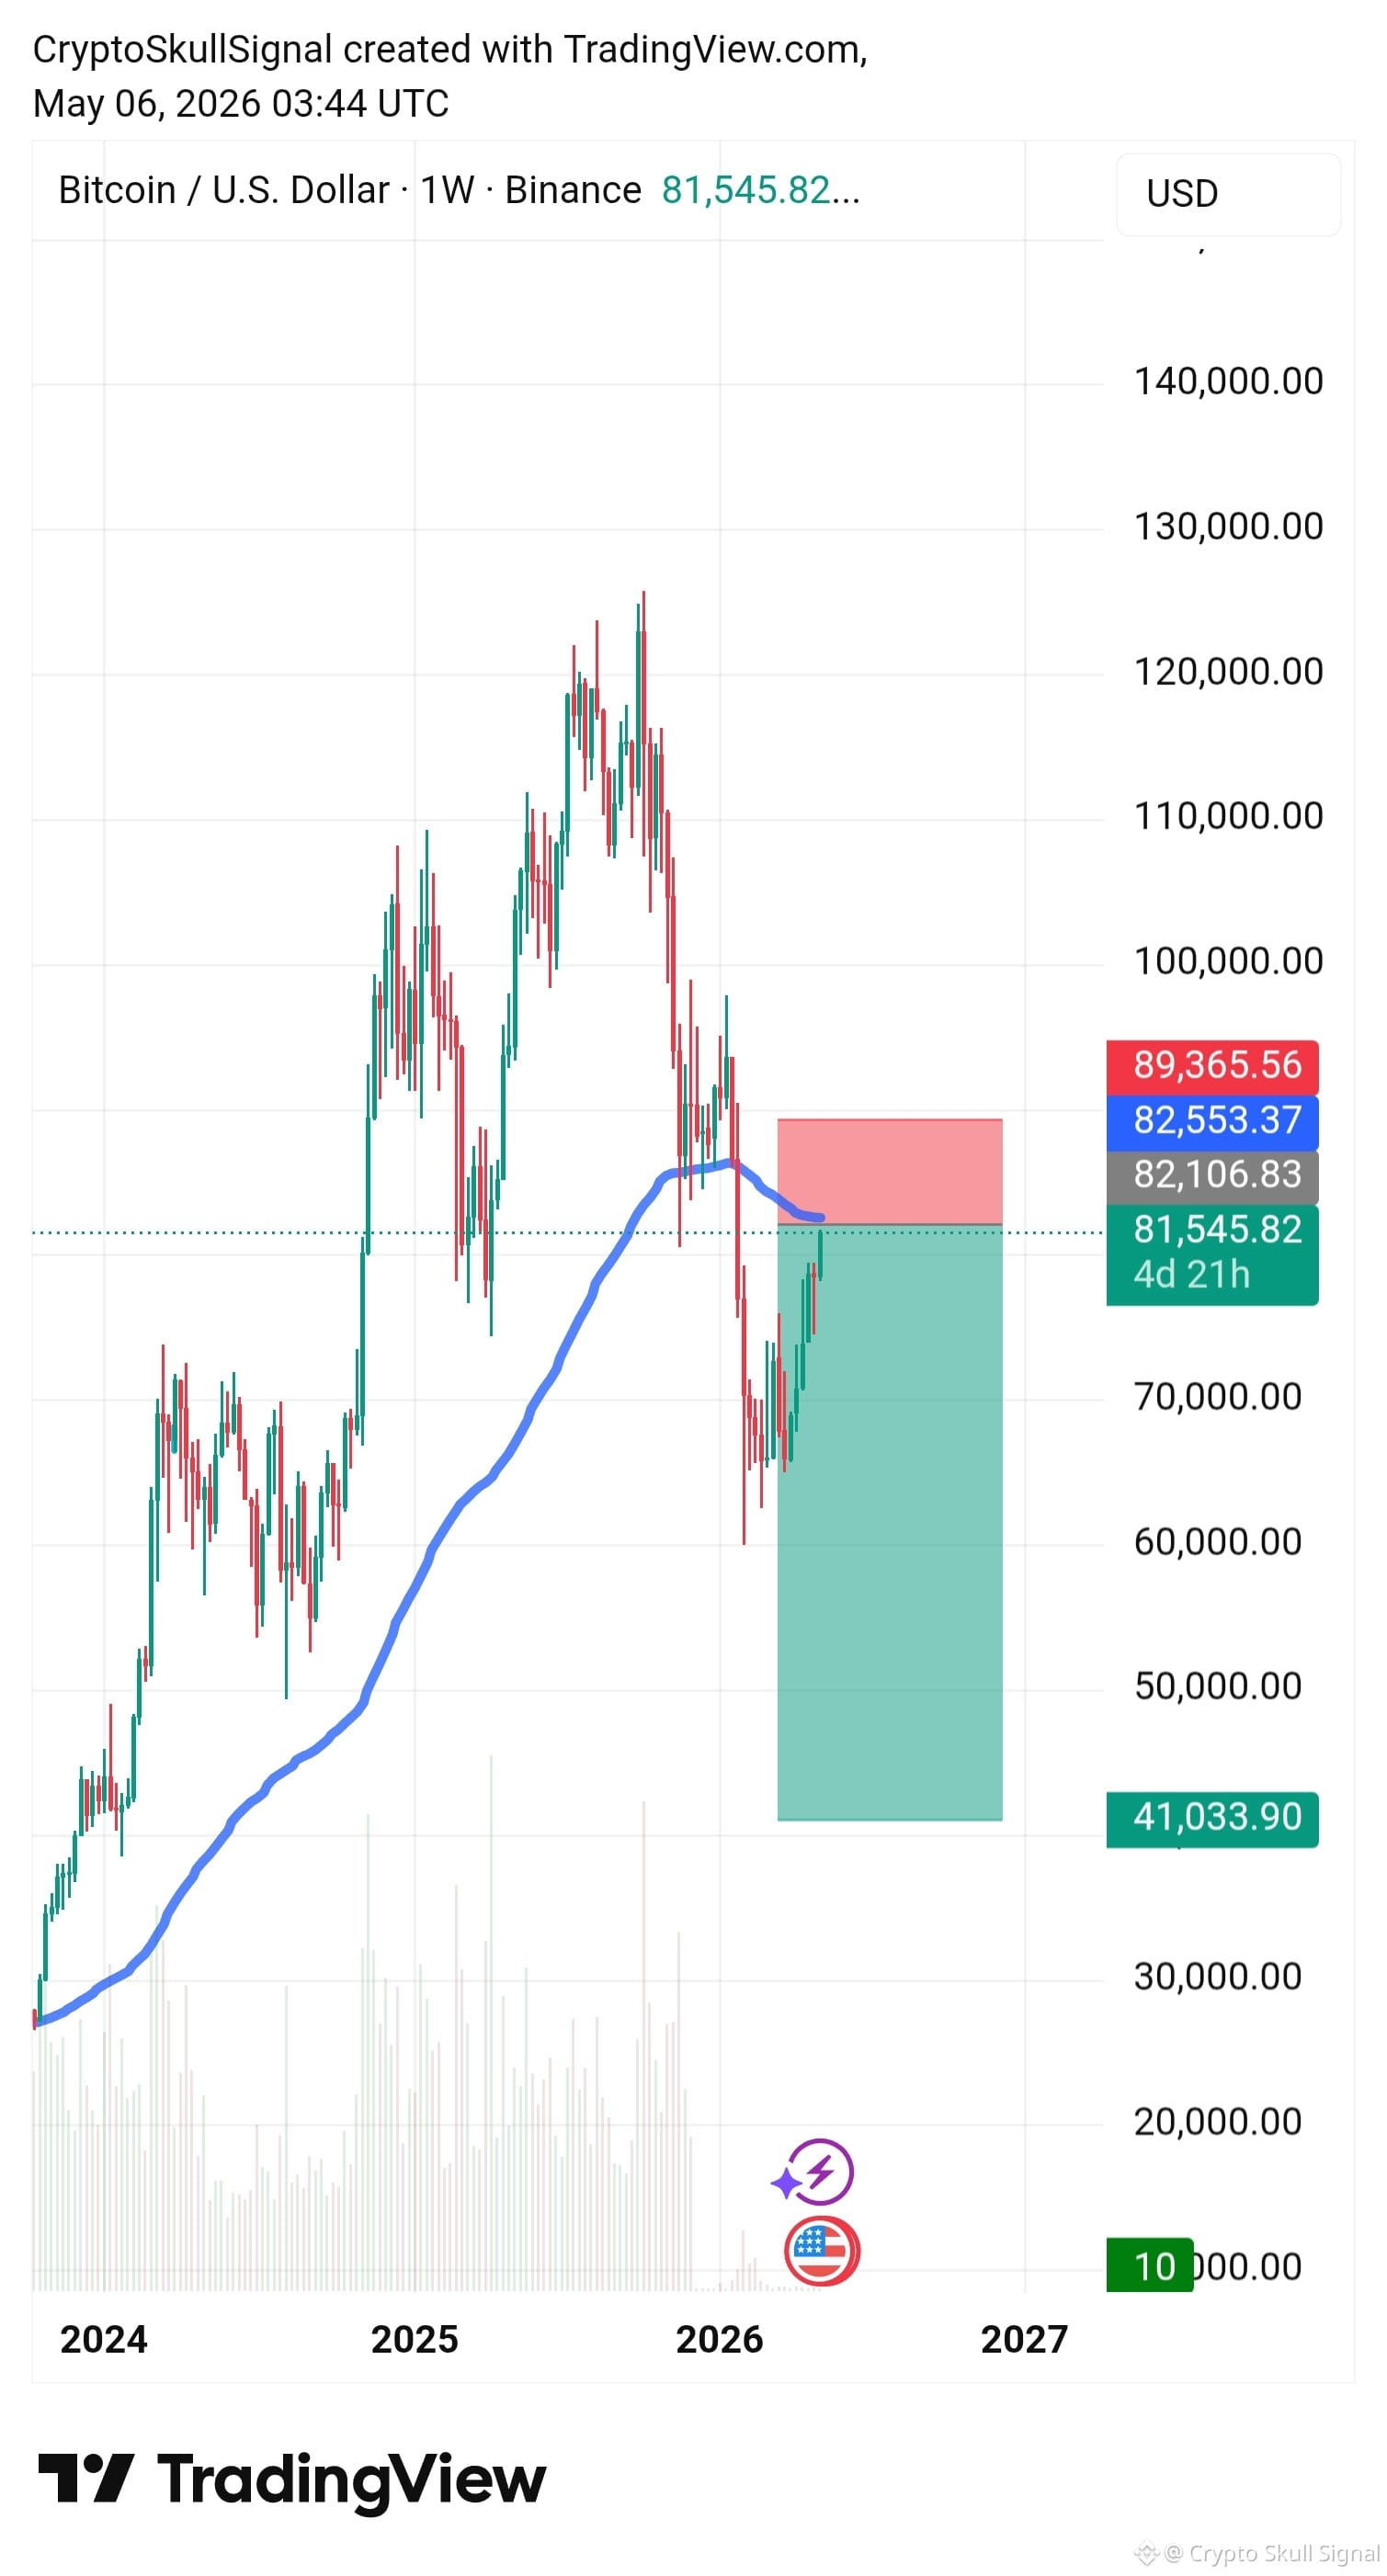
Bearish$BTC SUNDAY ANALYSIS
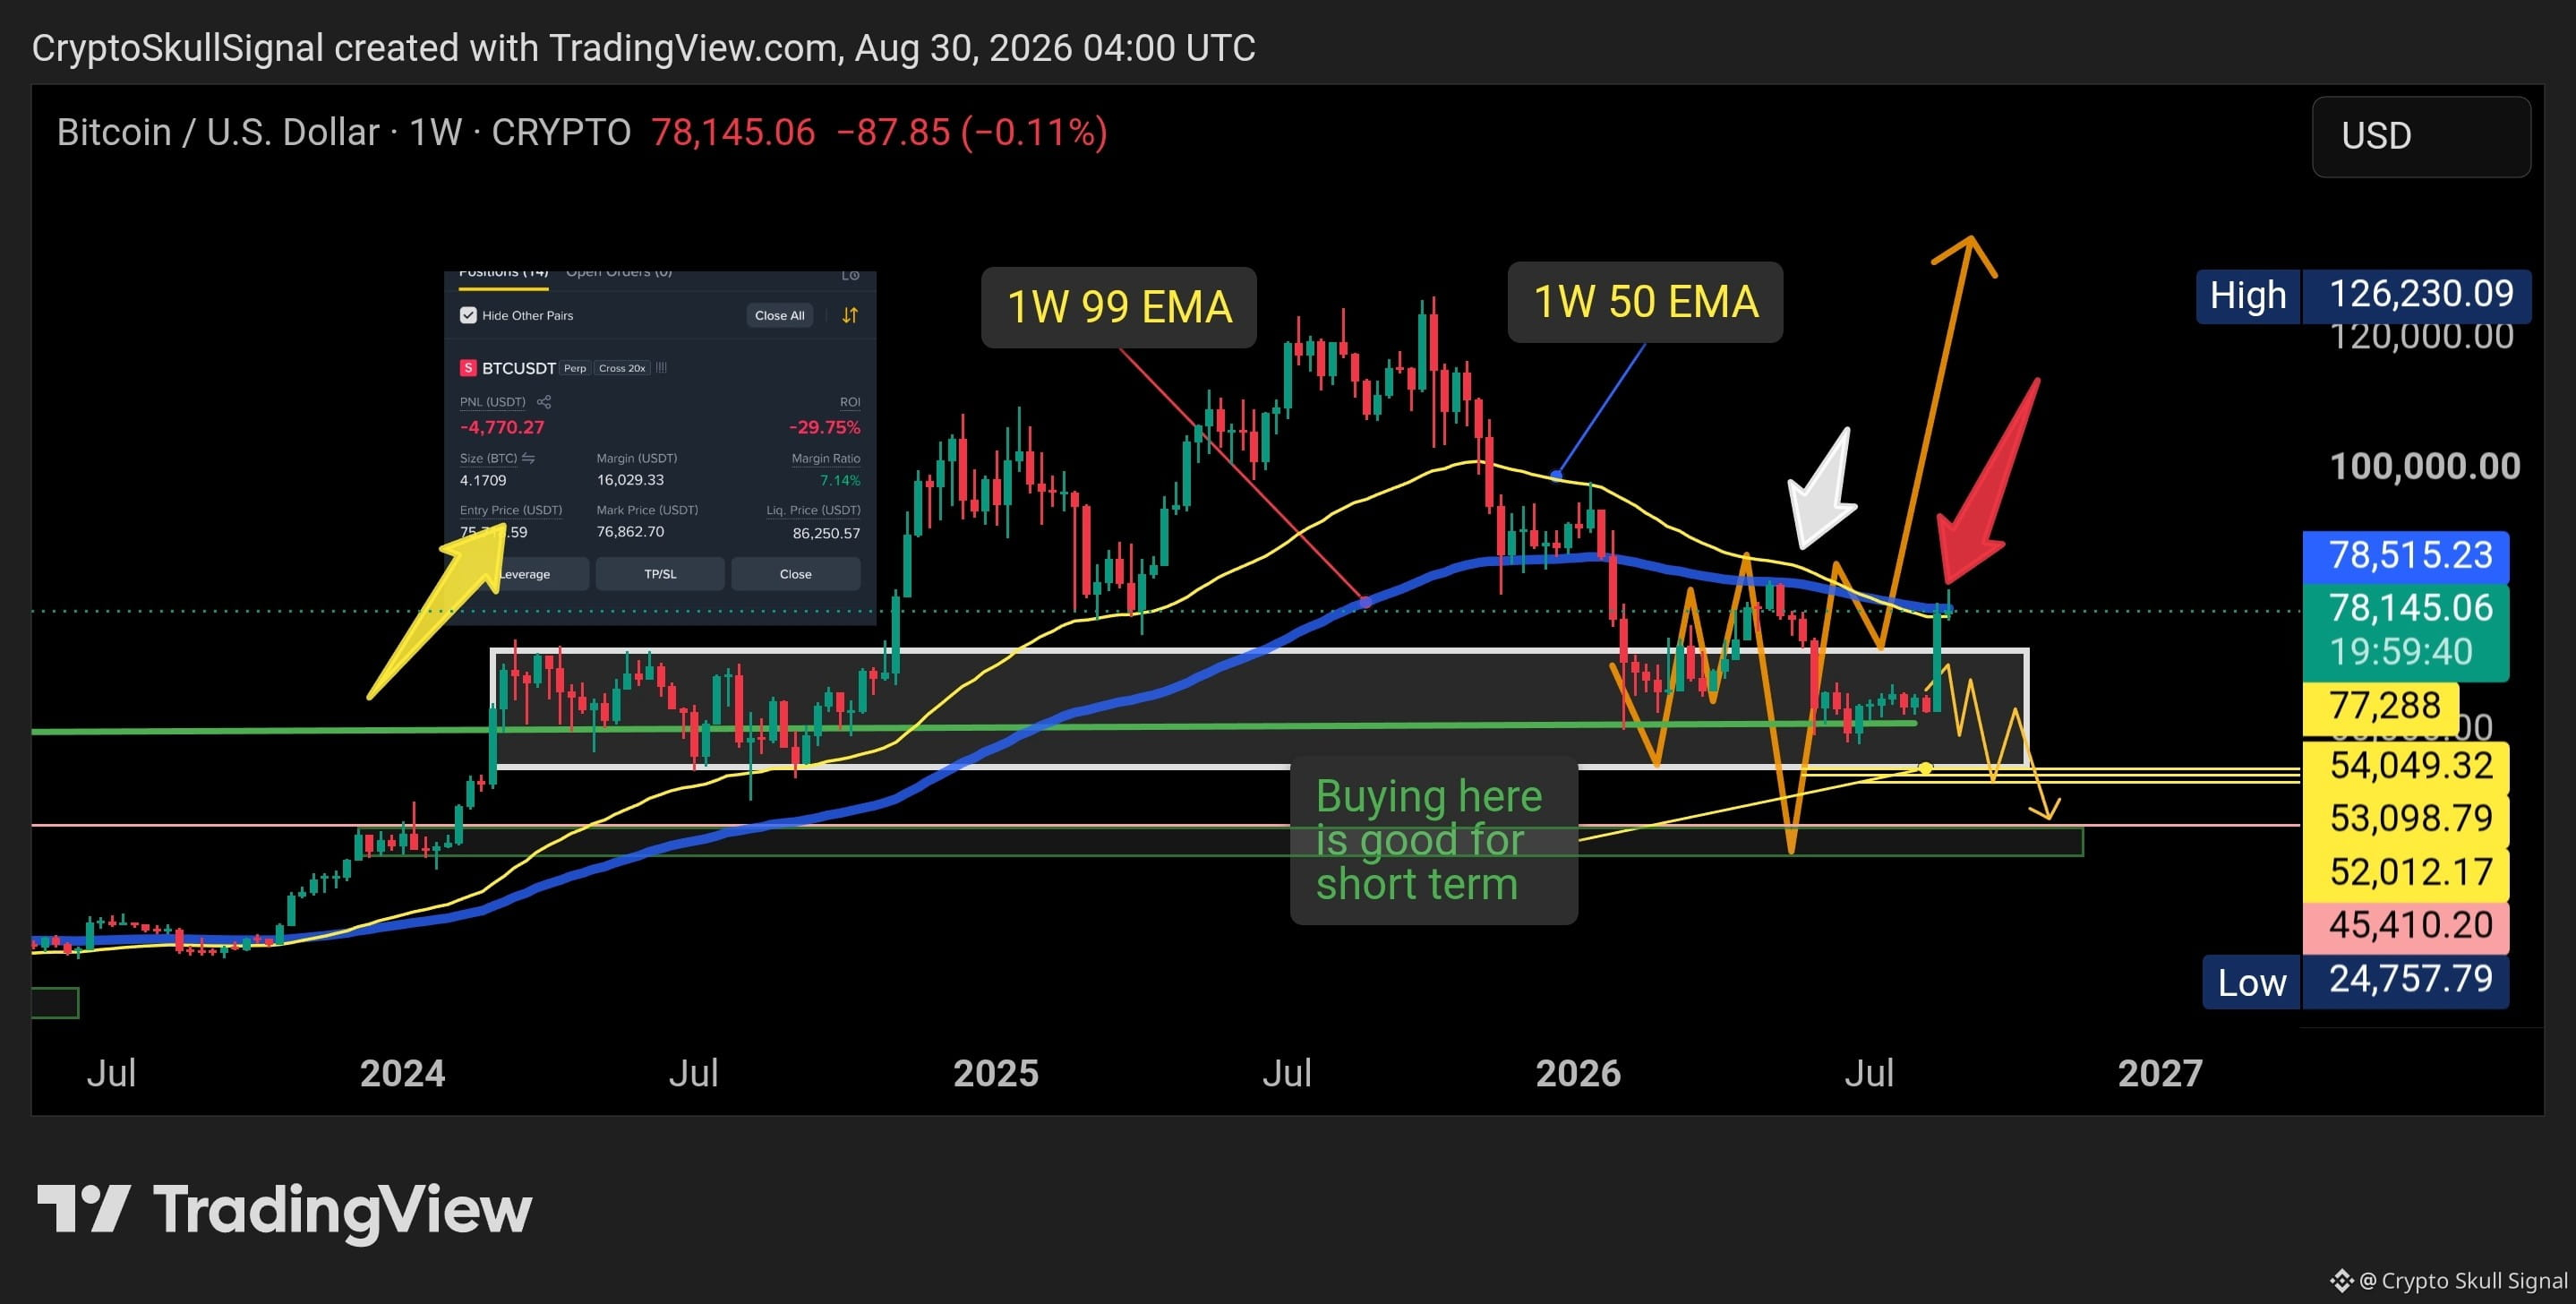
#Bitcoin finally broke above $72K, exactly the level I told you I was watching.
I also told you I would add more short positions around this area. I did it, and yes, my short is currently in loss. You can see the position on the chart. At one point, this trade was already more than $40,000 in profit, but I didn't close it because I was expecting the bigger move down.
Now the situation has changed a little.
BTC is testing the major weekly EMA resistance zone. You can see the 1W 50 EMA and 1W 99 EMA on the chart. The last time BTC reached this area, we got a rejection.
Right now, $78K is the important level.
If BTC gets a strong WEEKLY CLOSE above $78K-$82K, I will accept that my bearish setup is wrong and I will close my short, even if I have to take the loss. After that, I will update you about where I plan to start building a long position.
Until then, I am still holding my short.
And honestly, I still think this move can be a trap. A lot of shorts were sitting above and around these levels, so a sharp move higher can easily trigger liquidations and force shorts to close.
For weeks, when BTC was trading around $64K-$65K, I kept telling you the same thing: this was the middle of the box, not the place I wanted to chase a long or short. I gave you the levels again and again. I was waiting for the breakdown.
But the market chose the other direction.
That's trading. Sometimes your analysis is right about the bigger picture but the market takes the opposite path first.
My bearish view is still alive unless BTC proves otherwise with a weekly close above $78K-$82K.
I started building this short around the $118K area, and I have shared the journey and the levels throughout my previous Sunday analyses. I was expecting much lower levels, and $50K is still a level I am watching.
Let's see what the market gives us next.
Profit or loss, I will update you when I change the plan.
This is my personal analysis, not financial advice. DYOR.
#Bitcoin finally broke above $72K, exactly the level I told you I was watching.
I also told you I would add more short positions around this area. I did it, and yes, my short is currently in loss. You can see the position on the chart. At one point, this trade was already more than $40,000 in profit, but I didn't close it because I was expecting the bigger move down.
Now the situation has changed a little.
BTC is testing the major weekly EMA resistance zone. You can see the 1W 50 EMA and 1W 99 EMA on the chart. The last time BTC reached this area, we got a rejection.
Right now, $78K is the important level.
If BTC gets a strong WEEKLY CLOSE above $78K-$82K, I will accept that my bearish setup is wrong and I will close my short, even if I have to take the loss. After that, I will update you about where I plan to start building a long position.
Until then, I am still holding my short.
And honestly, I still think this move can be a trap. A lot of shorts were sitting above and around these levels, so a sharp move higher can easily trigger liquidations and force shorts to close.
For weeks, when BTC was trading around $64K-$65K, I kept telling you the same thing: this was the middle of the box, not the place I wanted to chase a long or short. I gave you the levels again and again. I was waiting for the breakdown.
But the market chose the other direction.
That's trading. Sometimes your analysis is right about the bigger picture but the market takes the opposite path first.
My bearish view is still alive unless BTC proves otherwise with a weekly close above $78K-$82K.
I started building this short around the $118K area, and I have shared the journey and the levels throughout my previous Sunday analyses. I was expecting much lower levels, and $50K is still a level I am watching.
Let's see what the market gives us next.
Profit or loss, I will update you when I change the plan.
This is my personal analysis, not financial advice. DYOR.
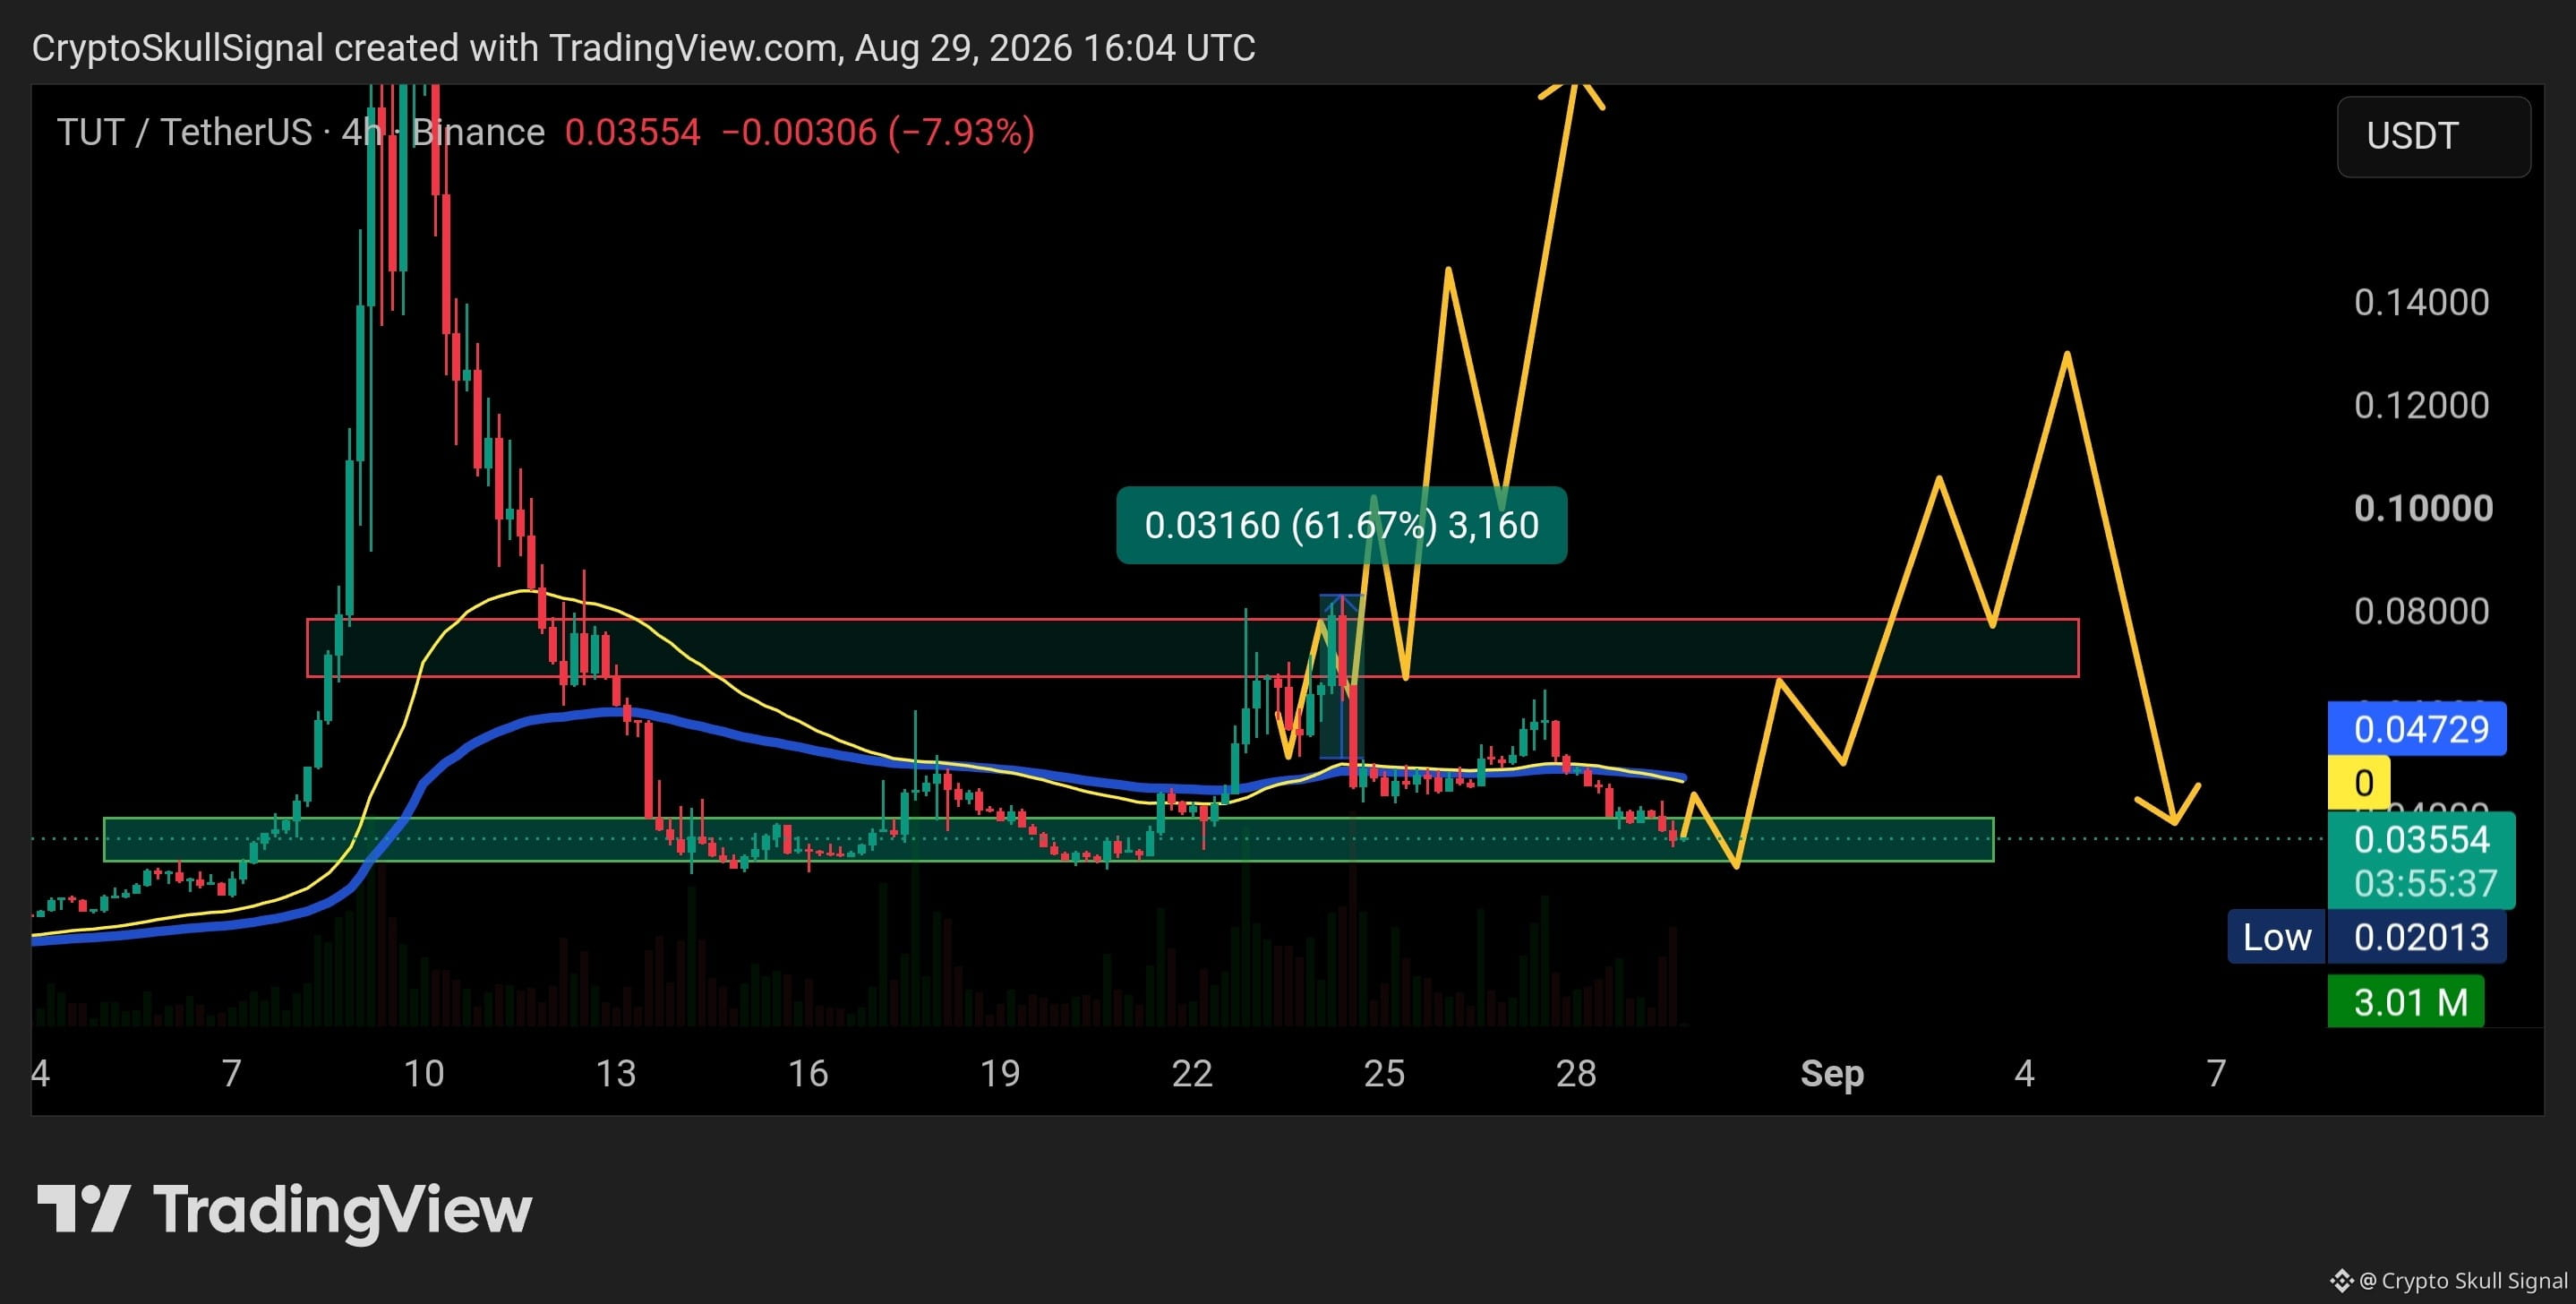
$TUT is still looking bullish here.
After the last ~62% move we caught, price has come back into the accumulation zone and is holding it well.
I’m expecting the first move toward the $0.068–$0.080 resistance zone. If TUT breaks and holds above this area, a small pullback into the resistance-turned-support would be healthy. After that, I’m looking for another bullish reversal and continuation higher.
As long as the accumulation zone holds, I’m still bullish on TUT. 🔥
After the last ~62% move we caught, price has come back into the accumulation zone and is holding it well.
I’m expecting the first move toward the $0.068–$0.080 resistance zone. If TUT breaks and holds above this area, a small pullback into the resistance-turned-support would be healthy. After that, I’m looking for another bullish reversal and continuation higher.
As long as the accumulation zone holds, I’m still bullish on TUT. 🔥
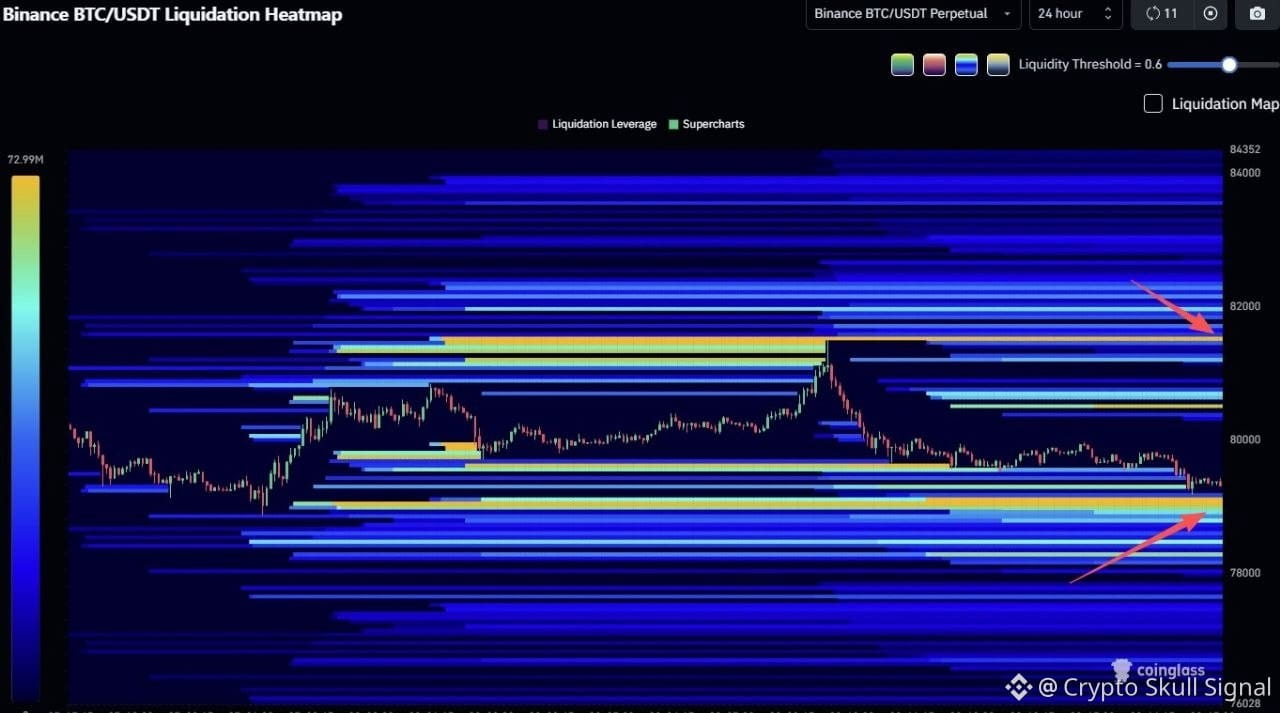
🚨Hello friends, there are two key liquidity zones for Bitcoin that act as liquidation points for high leverage trades. The first is at $79,000, which is the liquidation point for long positions with high leverage. The second is at $81,000, which is the liquidation point for short positions with high leverage. $BTC
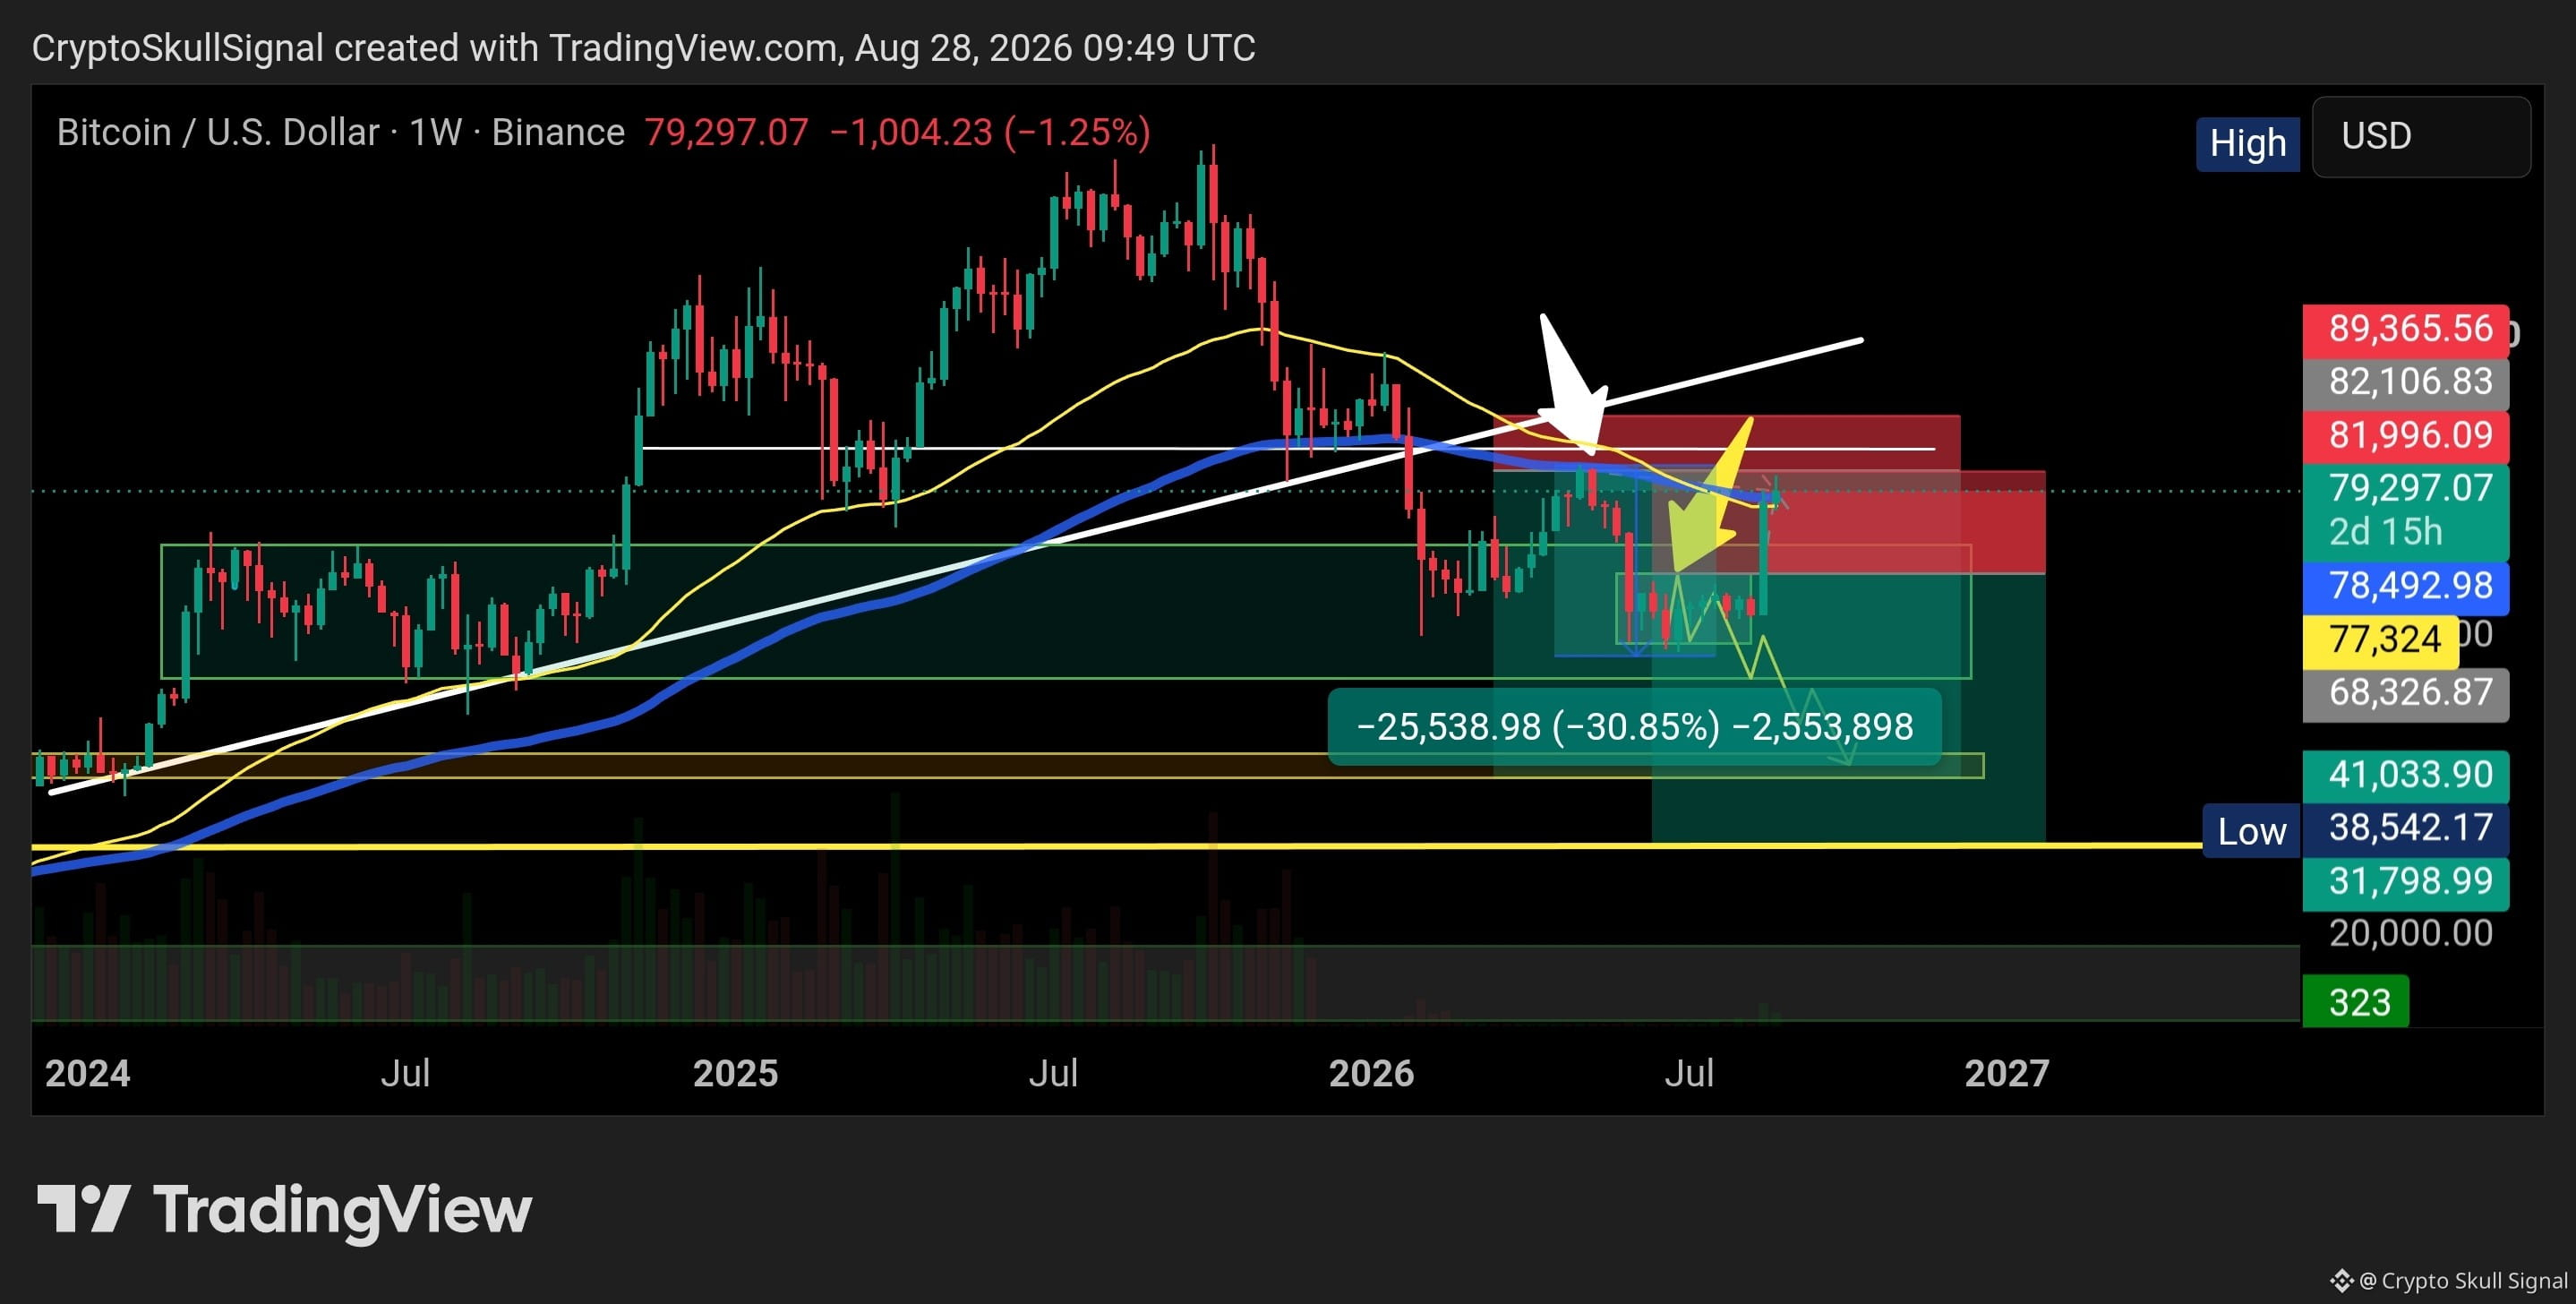
🚨 I’M STILL HOLDING MY $BTC SHORT.
🚨 I DON’T THINK BUYING BITCOIN RIGHT NOW IS A GOOD OPTION.
BTC has moved above the zone where I expected rejection, so yes, my short is currently under pressure. But I’m not changing the plan just because price moved against me.
My downside targets are still:
$70K → $65K → below $50K
I’m waiting to see how BTC behaves around the $78K-$81K resistance area. If the weekly structure gives me the confirmation I’m waiting for, I’ll continue holding for the downside.
I already told you I would add more short positions, and I did.
For now, I’m not chasing a long here. I’m waiting for the market to prove the direction.
Let’s see whether this is a real breakout or another liquidity move.
DYOR and manage your risk.
🚨 I DON’T THINK BUYING BITCOIN RIGHT NOW IS A GOOD OPTION.
BTC has moved above the zone where I expected rejection, so yes, my short is currently under pressure. But I’m not changing the plan just because price moved against me.
My downside targets are still:
$70K → $65K → below $50K
I’m waiting to see how BTC behaves around the $78K-$81K resistance area. If the weekly structure gives me the confirmation I’m waiting for, I’ll continue holding for the downside.
I already told you I would add more short positions, and I did.
For now, I’m not chasing a long here. I’m waiting for the market to prove the direction.
Let’s see whether this is a real breakout or another liquidity move.
DYOR and manage your risk.
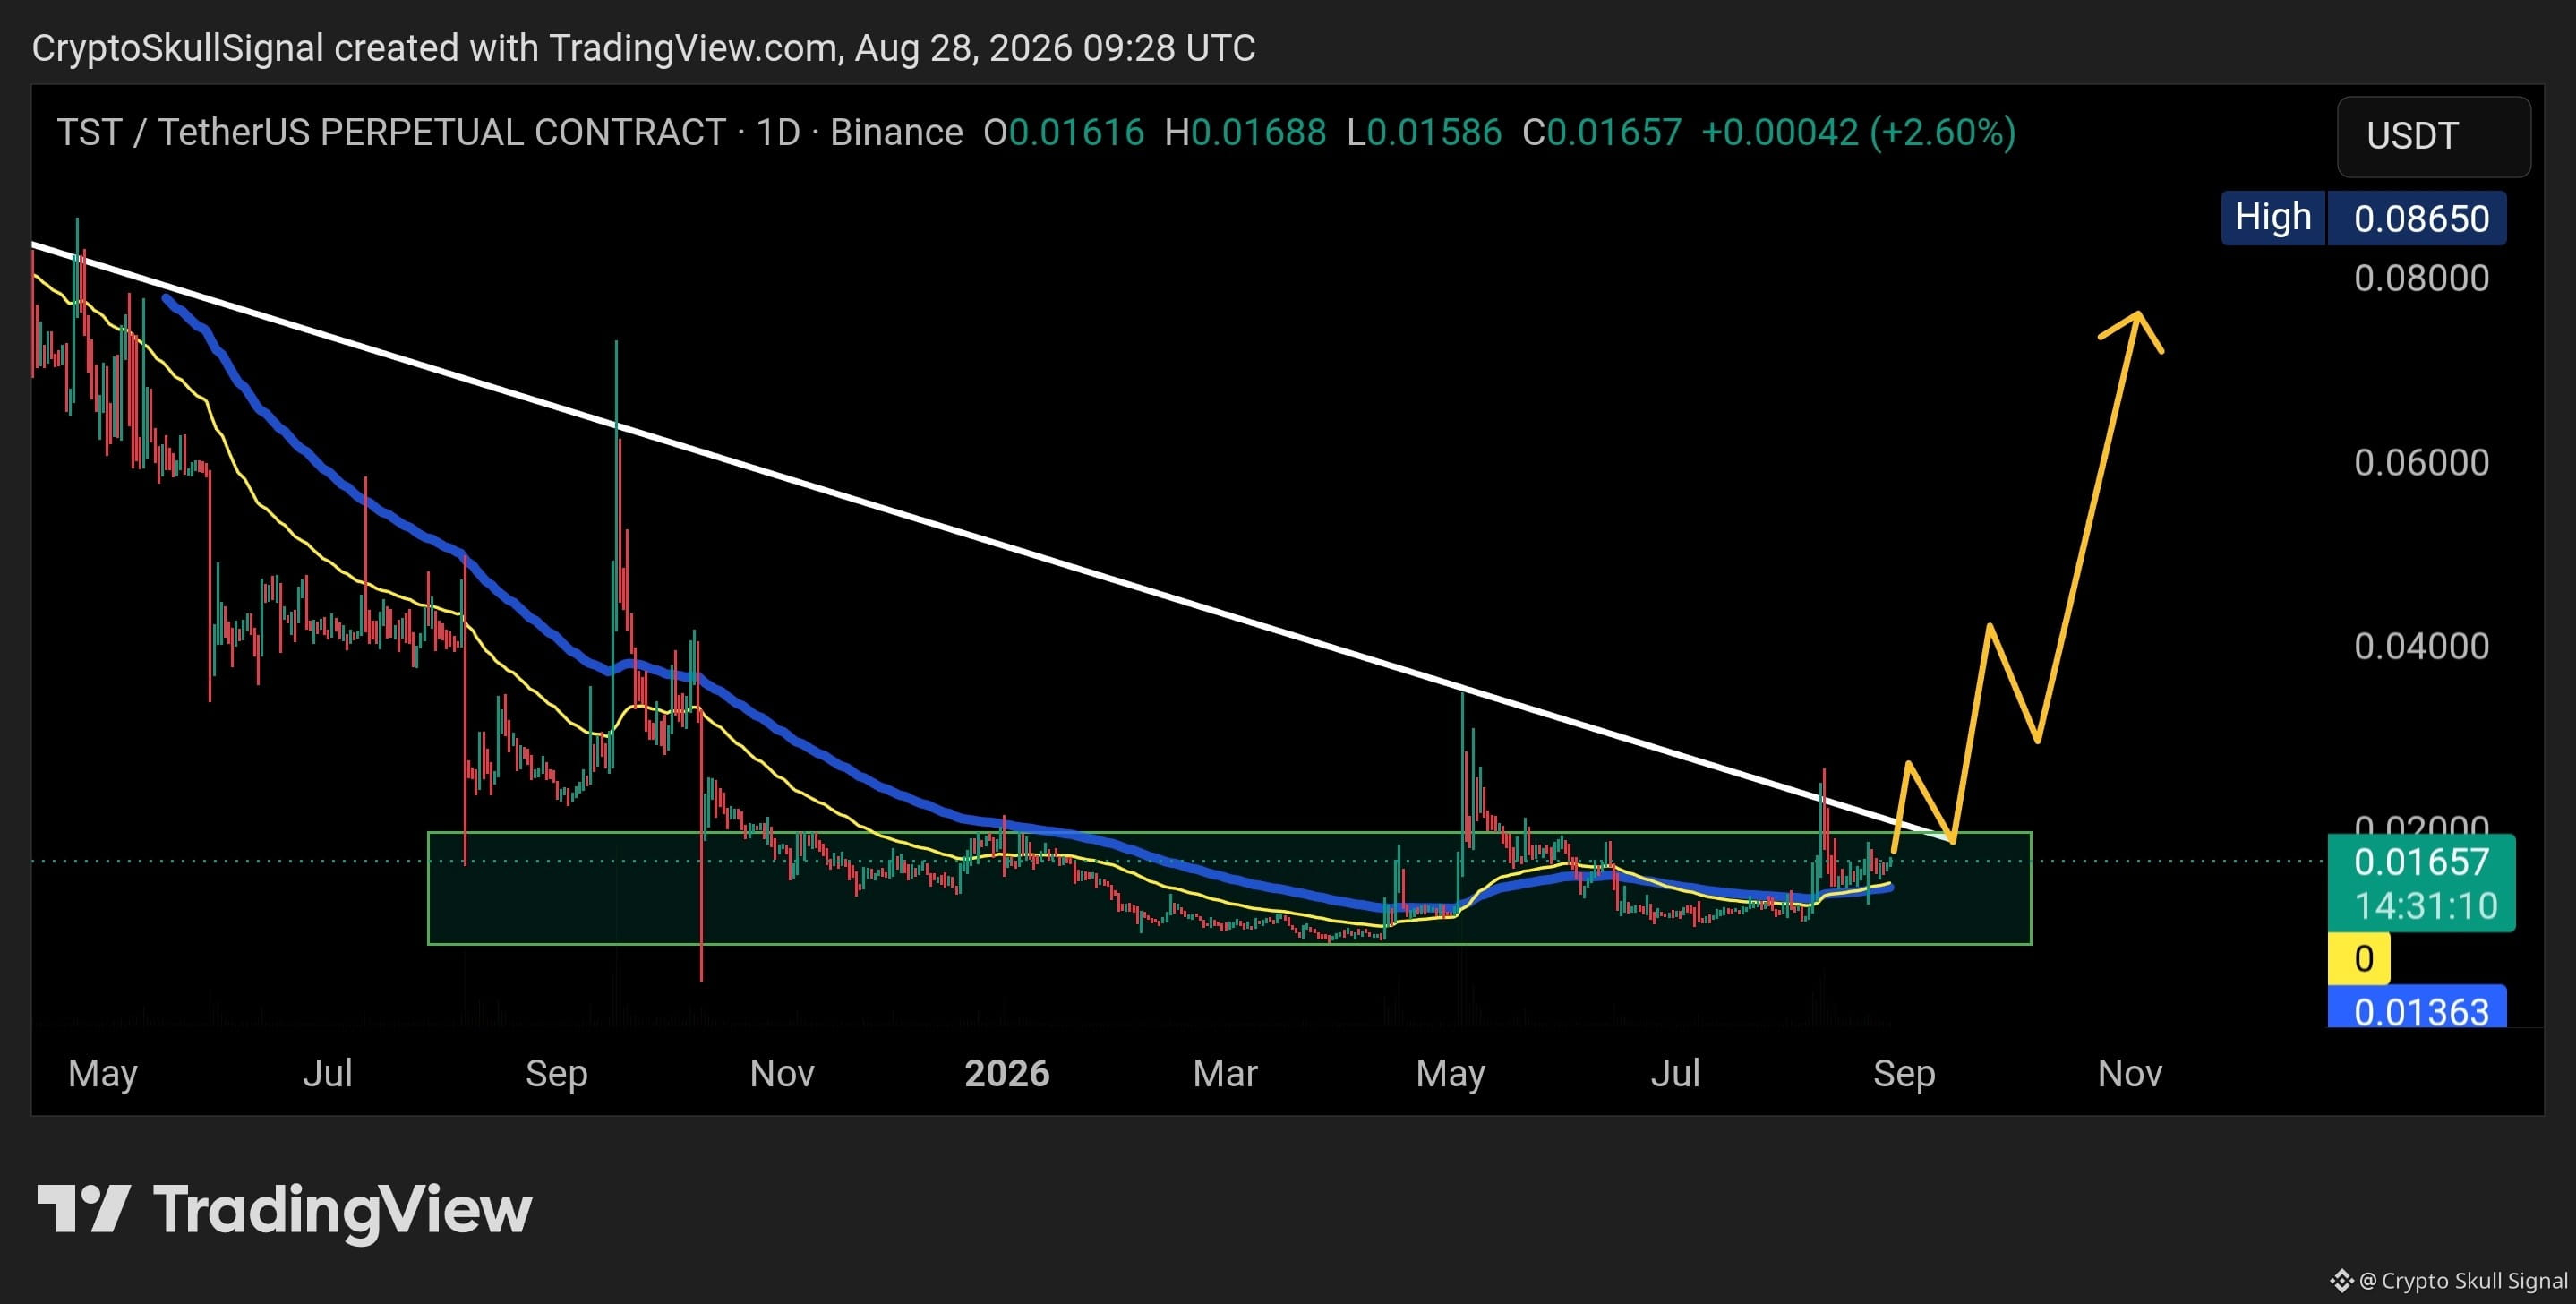
$TST is looking bullish as long as price continues holding above both EMAs around $0.013–$0.014.
We’re seeing a strong base forming after a long correction. The key move now is a clean breakout above the $0.020 resistance and descending trendline. If TST breaks and holds above that area, I expect a higher bounce with upside opening toward $0.040, followed by $0.080+.
As long as the EMA support holds, I’m staying bullish on TST. 🚀
$0.013 = key support | $0.020 = breakout zone | $0.040 → $0.080 = upside targets
We’re seeing a strong base forming after a long correction. The key move now is a clean breakout above the $0.020 resistance and descending trendline. If TST breaks and holds above that area, I expect a higher bounce with upside opening toward $0.040, followed by $0.080+.
As long as the EMA support holds, I’m staying bullish on TST. 🚀
$0.013 = key support | $0.020 = breakout zone | $0.040 → $0.080 = upside targets
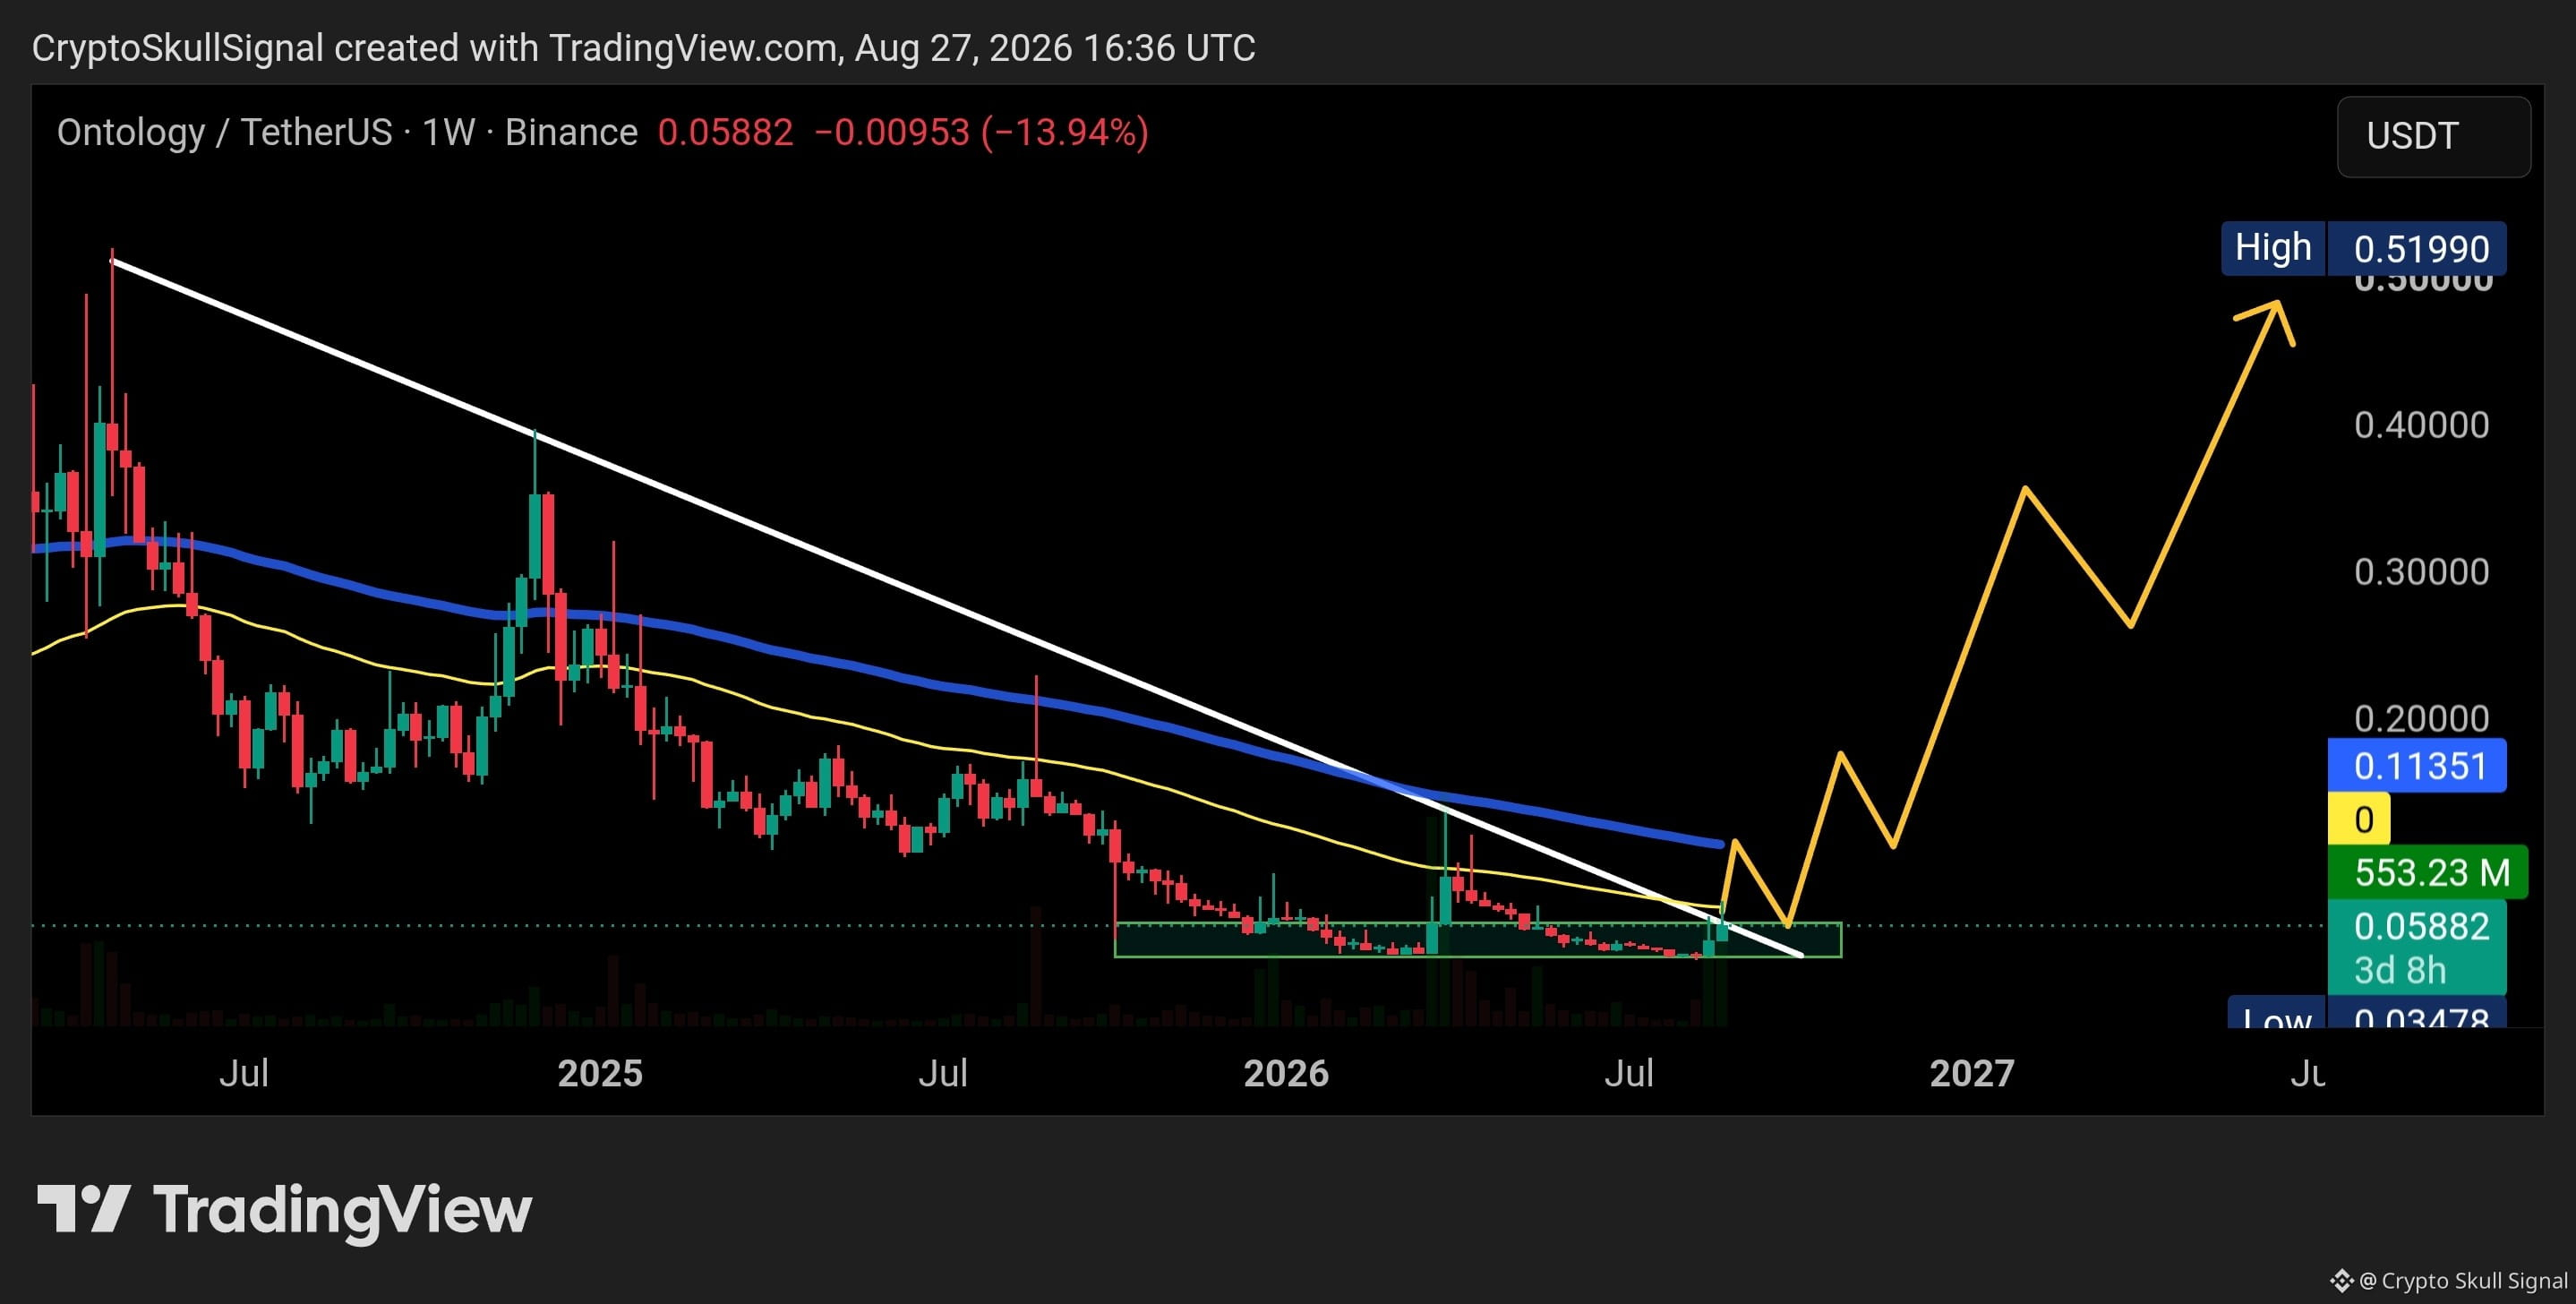
$ONT is looking interesting here.
Price is sitting right around the $0.06 accumulation zone + trendline. As long as we hold this area, I’m still bullish.
First upside targets: $0.07–$0.073
Then $0.11 becomes the next level to watch.
If ONT can reclaim both EMAs, the bigger move could open up — $0.53 is possible in the larger picture. 📈
Price is sitting right around the $0.06 accumulation zone + trendline. As long as we hold this area, I’m still bullish.
First upside targets: $0.07–$0.073
Then $0.11 becomes the next level to watch.
If ONT can reclaim both EMAs, the bigger move could open up — $0.53 is possible in the larger picture. 📈
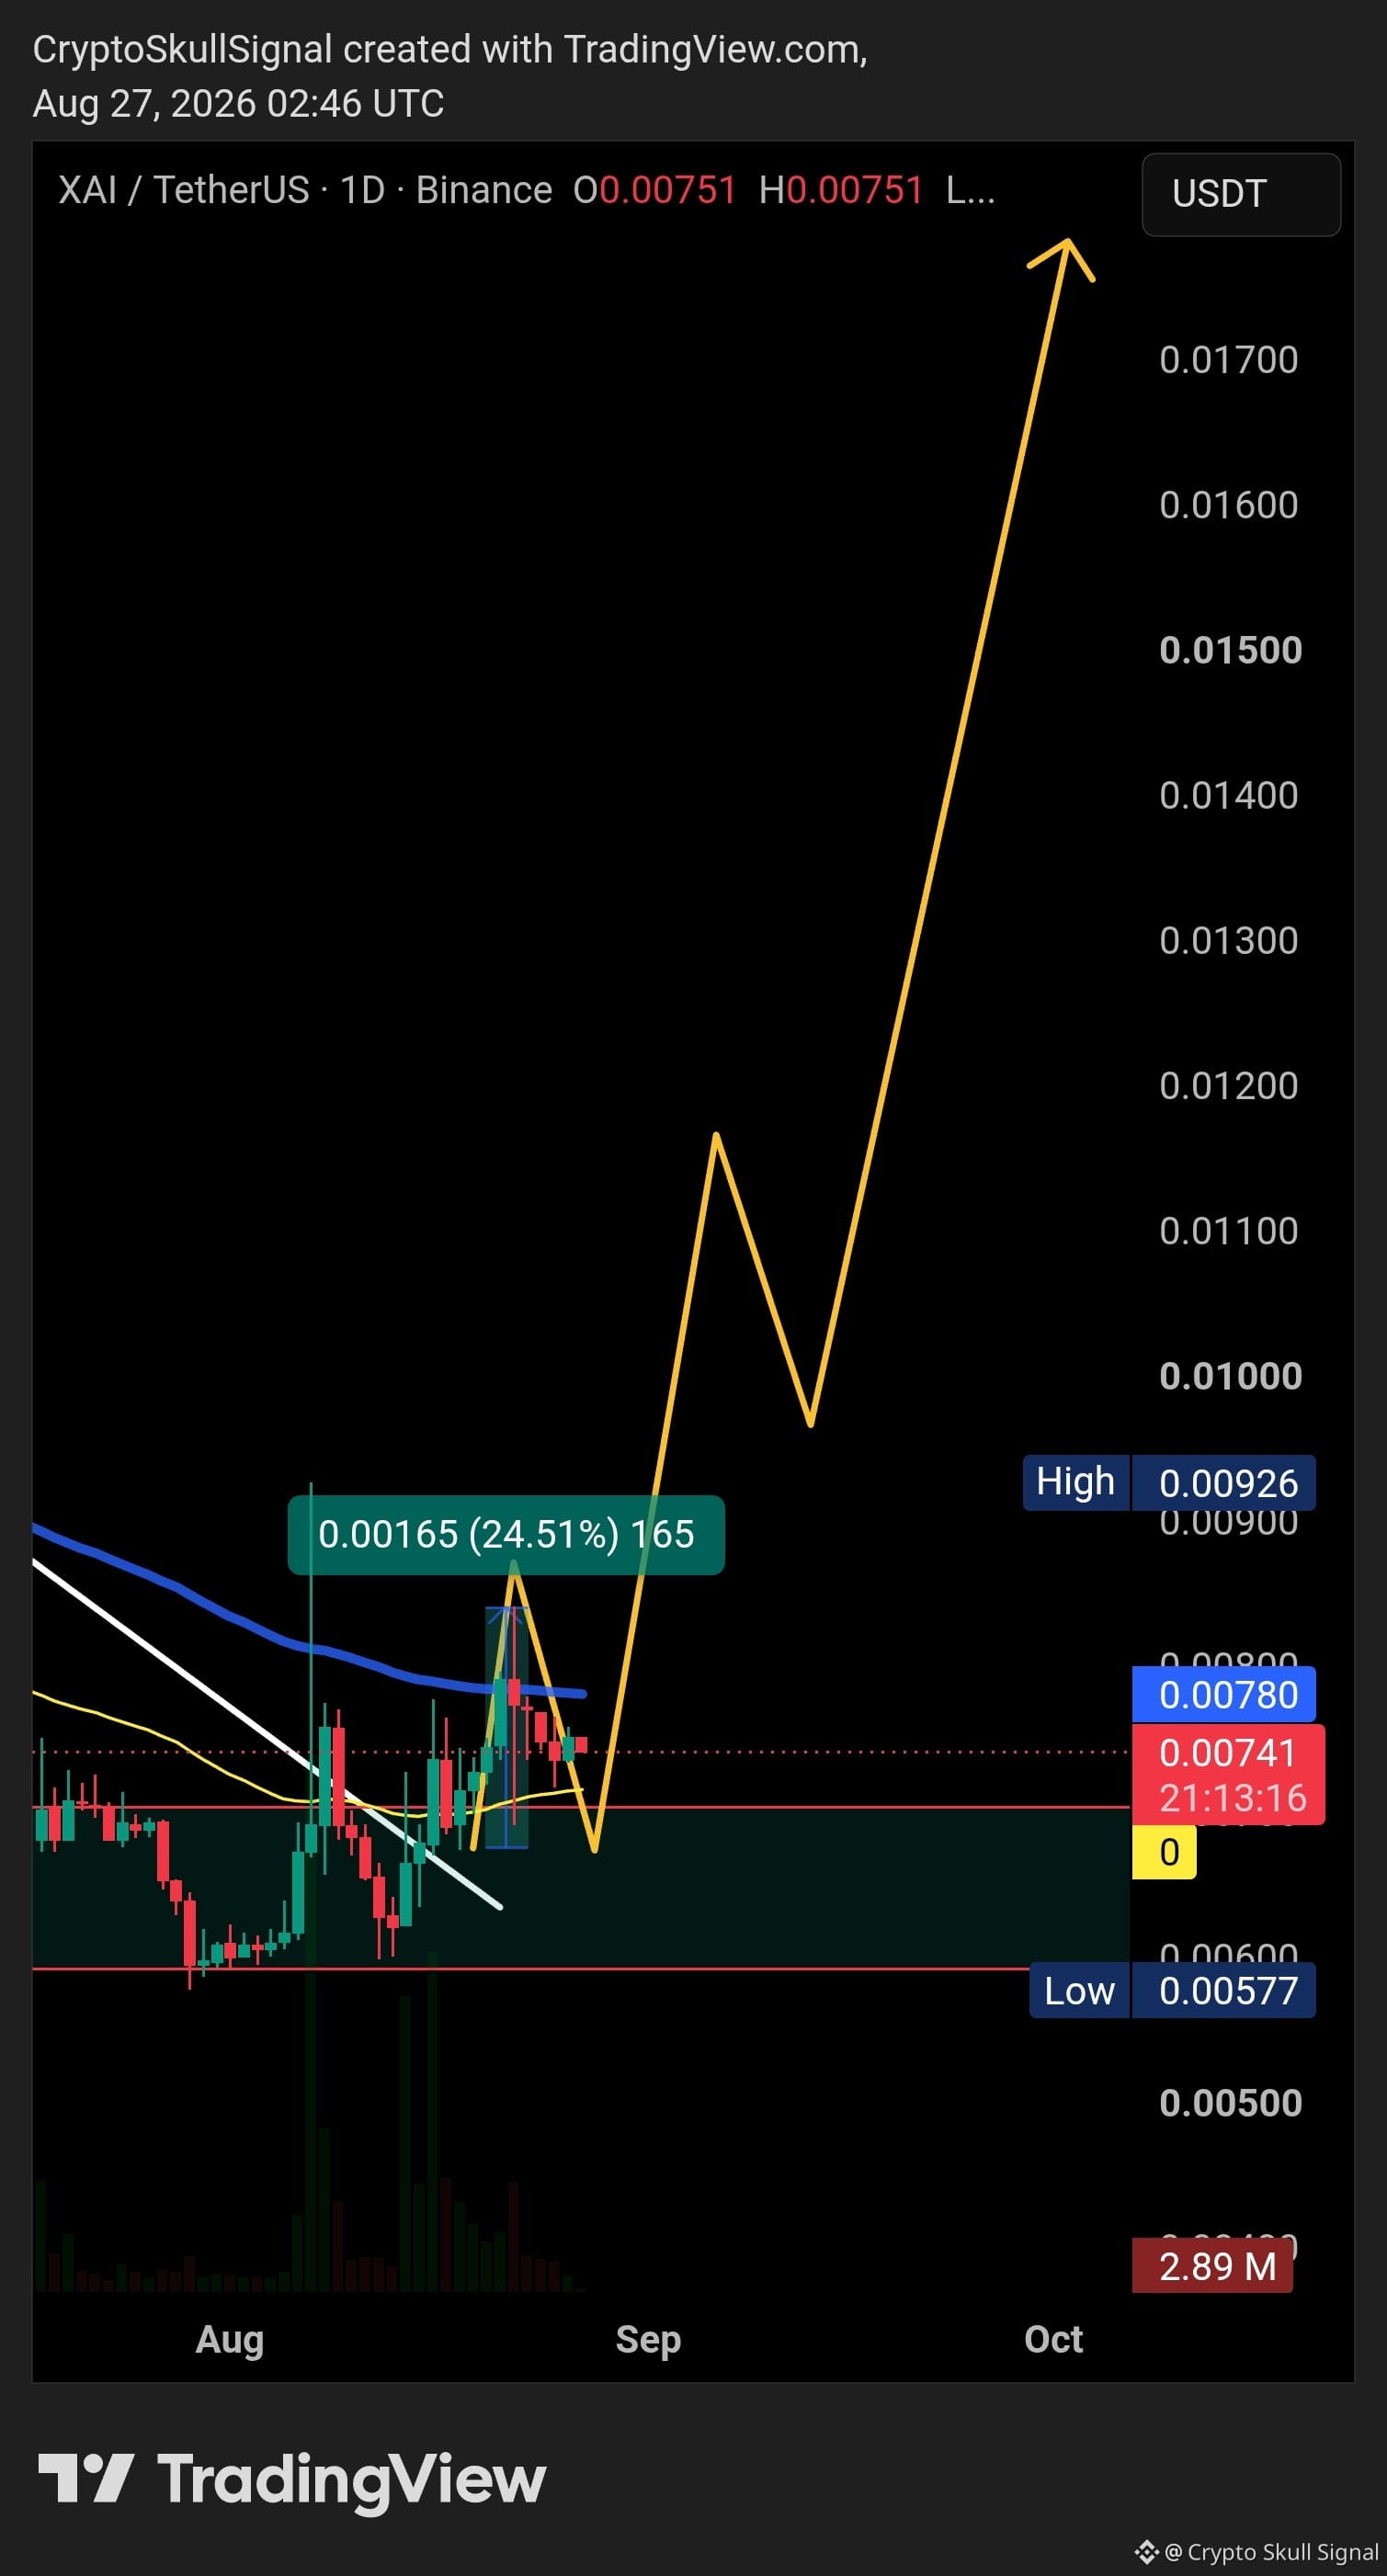
$XAI pulled back around 20% after getting rejected from the 99 EMA.
Still bullish here 👀
If price reclaims and holds above the blue EMA, the upside setup stays valid. We’re also still holding above the accumulation zone, which is a good sign.
From here, I’m watching for another move higher. 📈
Stop-loss: below the accumulation zone on a closing basis.
Still bullish here 👀
If price reclaims and holds above the blue EMA, the upside setup stays valid. We’re also still holding above the accumulation zone, which is a good sign.
From here, I’m watching for another move higher. 📈
Stop-loss: below the accumulation zone on a closing basis.
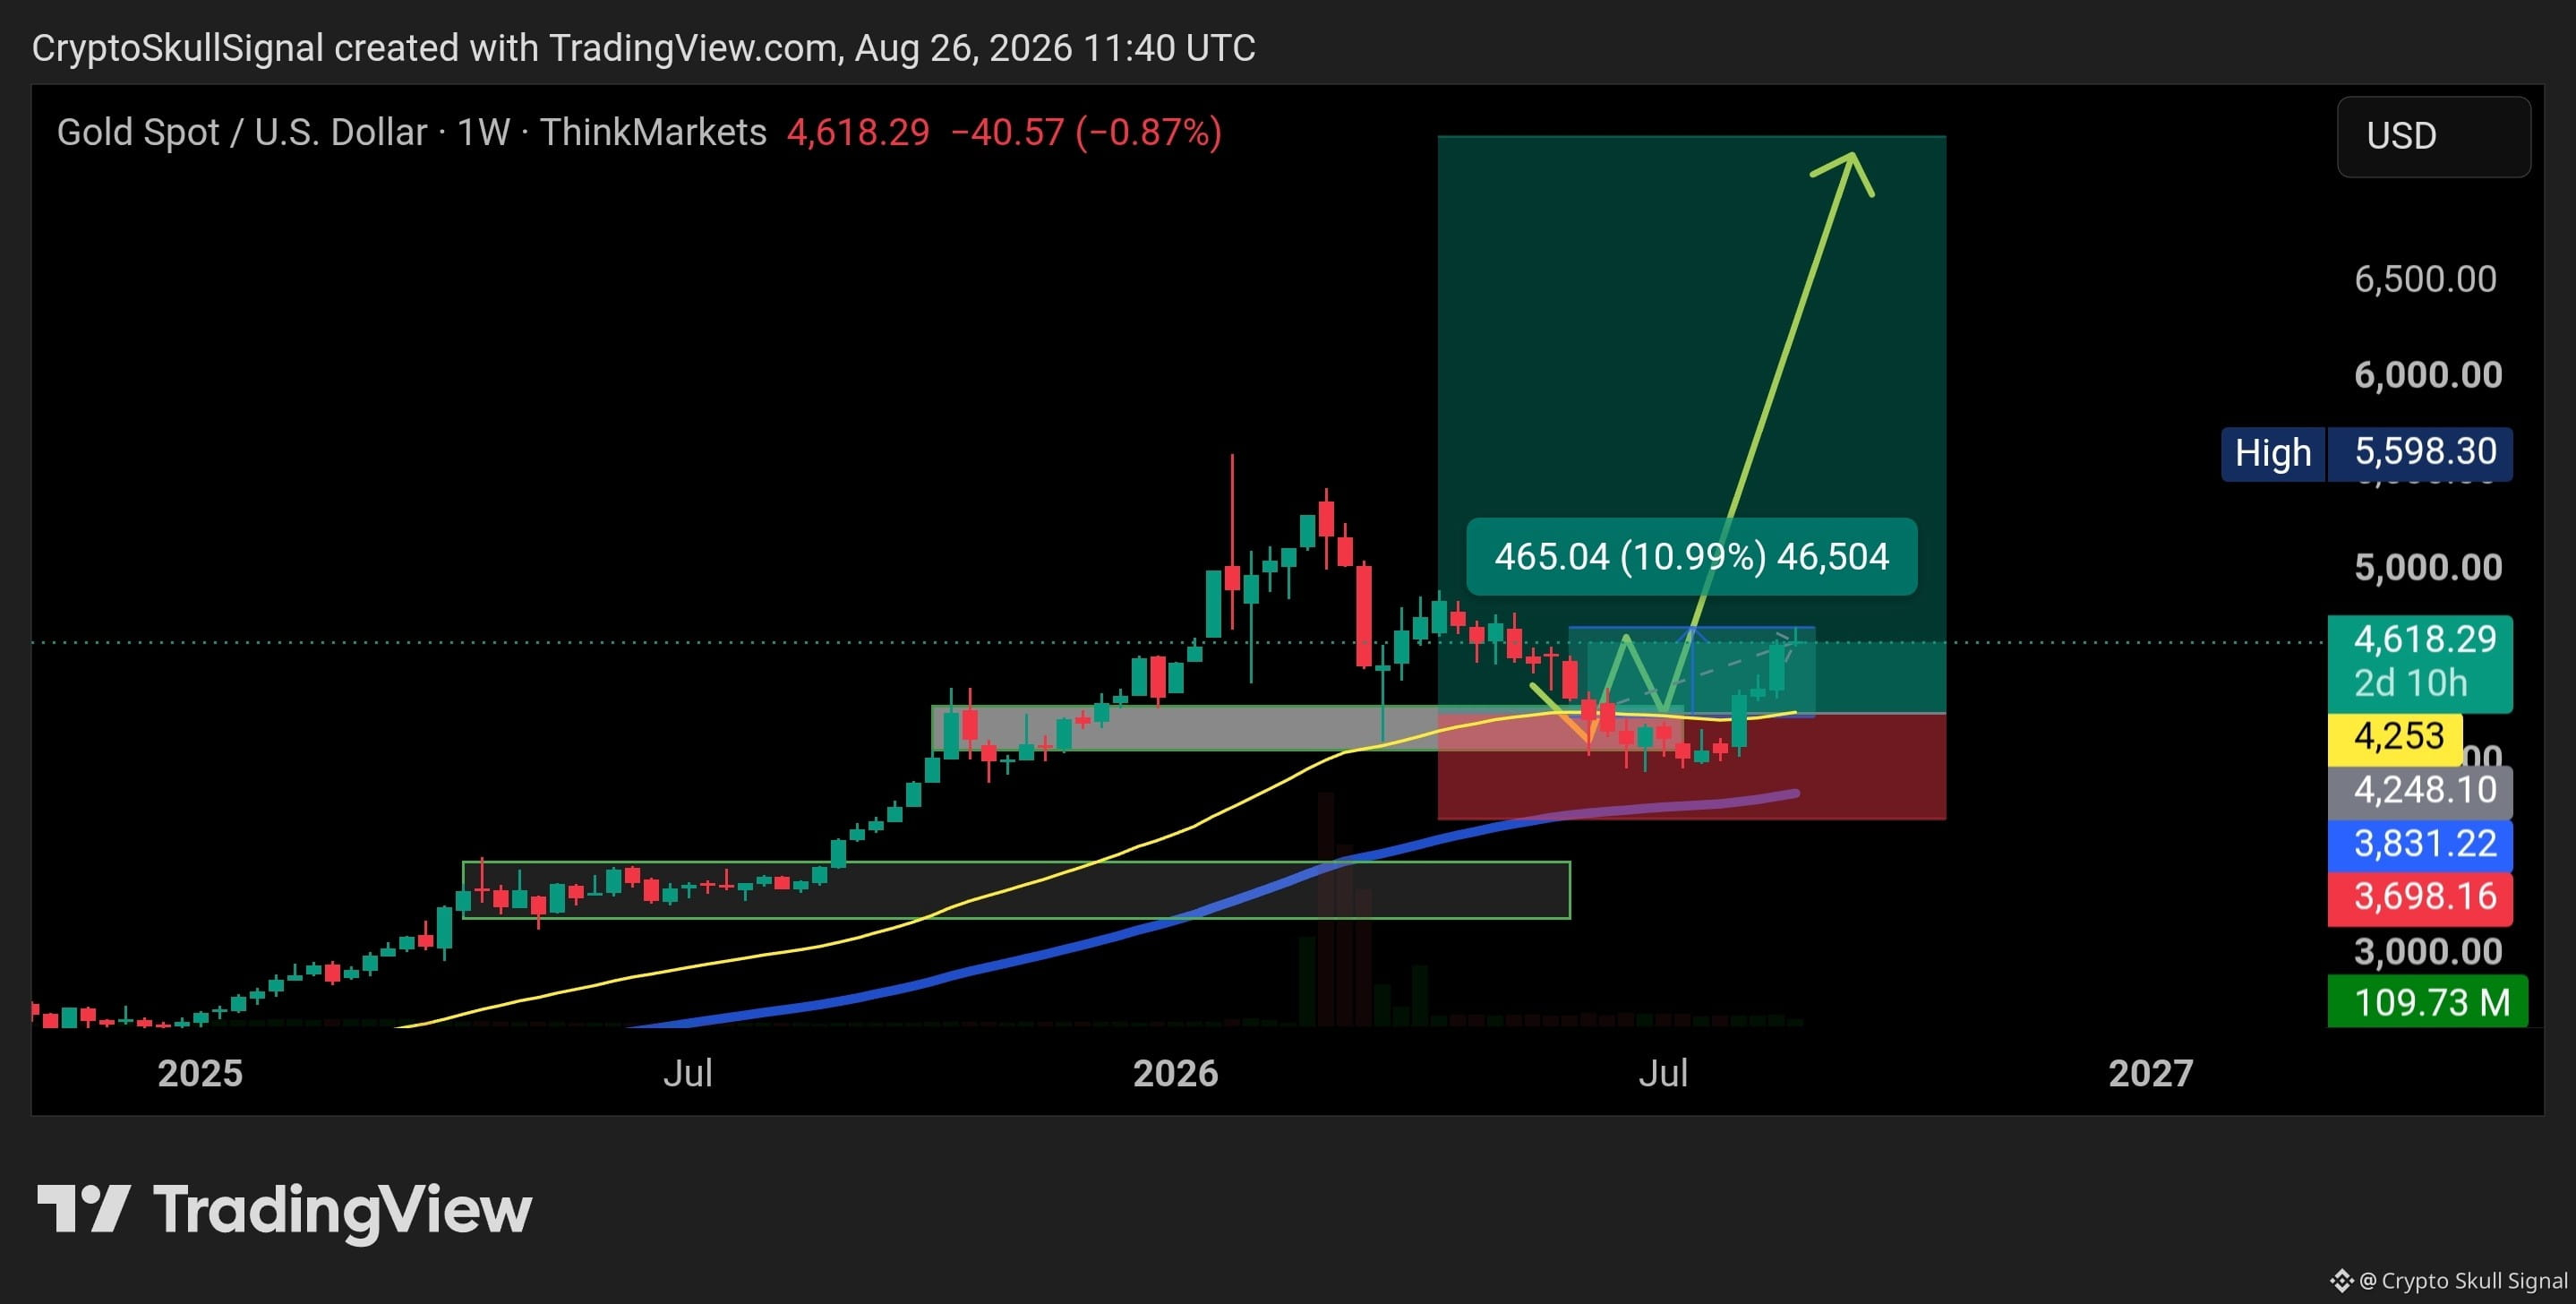
$XAU UPDATE 🔥
Gold is now around +11% from our limit-order entry, and I’m still holding my position waiting for the next major upside move. 📈
The move isn’t over yet. My final target remains $7,200. 🎯🔥
Gold is now around +11% from our limit-order entry, and I’m still holding my position waiting for the next major upside move. 📈
The move isn’t over yet. My final target remains $7,200. 🎯🔥
Crypto Skull Signal
·
--
$XAU #GOLD Limit order filled. ✅
Gold tapped the planned buy zone and is already showing a reaction from support.
Now the focus shifts to holding above the weekly structure. As long as this zone remains defended, the path toward higher targets stays intact. 🚀
#XAUUSD #Gold #TradingView #Forex #goldprice
Gold tapped the planned buy zone and is already showing a reaction from support.
Now the focus shifts to holding above the weekly structure. As long as this zone remains defended, the path toward higher targets stays intact. 🚀
#XAUUSD #Gold #TradingView #Forex #goldprice
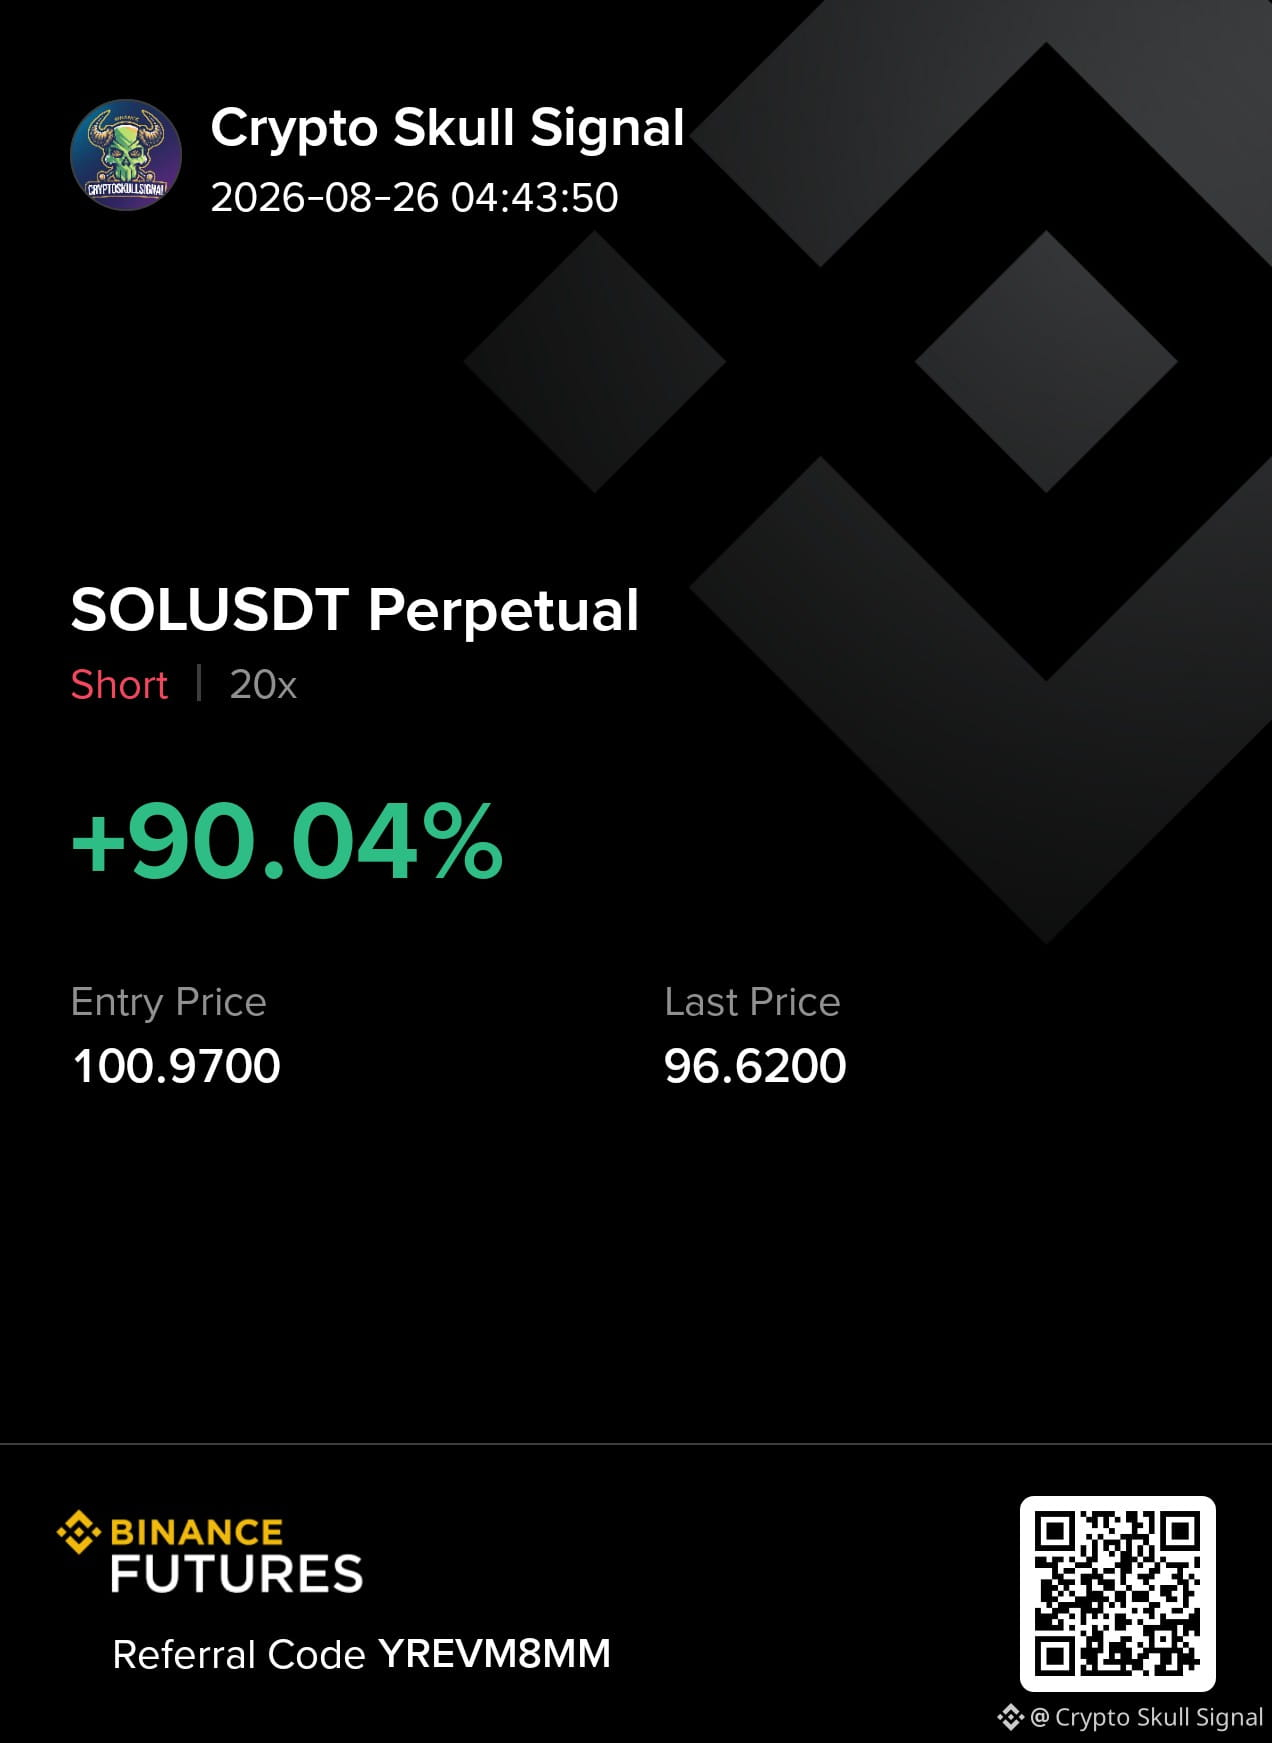
#SOL premium signal 🚀
Crypto Skull Signal
·
--
Bearish$SOL WEEKLY ANALYSIS 🔥
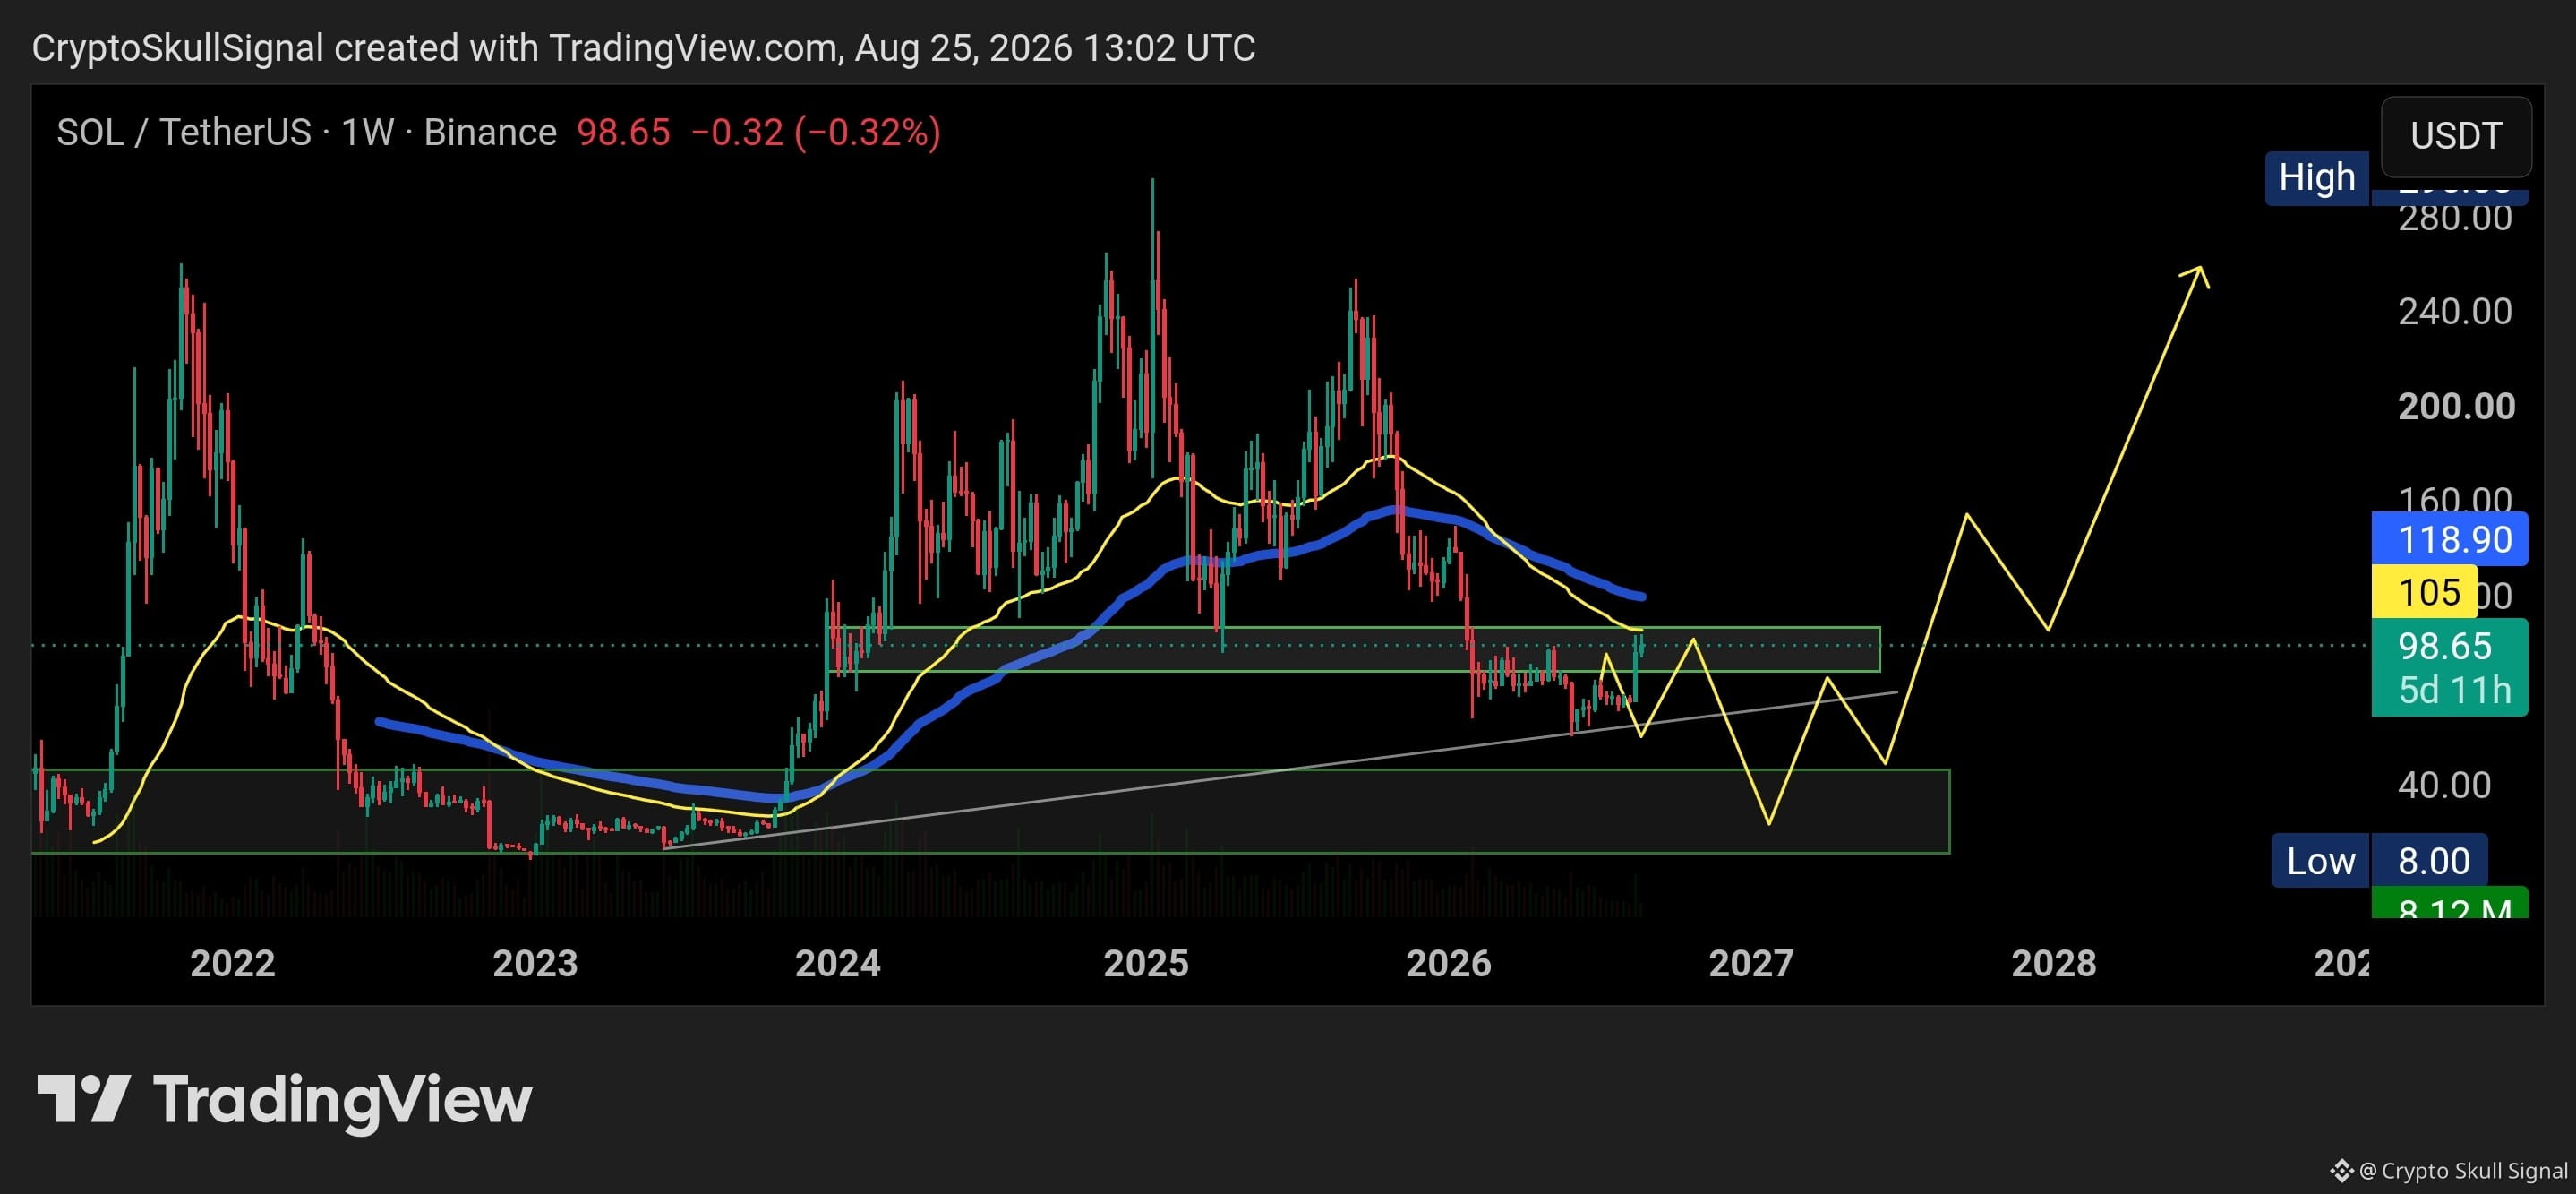
SOL is doing exactly what we expected after holding the long-term trendline.
Now around $98, price is approaching the major resistance levels at $105 and $118, where multiple weekly moving averages are sitting.
I’m expecting a rejection from this zone.
If rejection confirms, SOL could move back toward the lower support and demand zones shown on the chart.
But if SOL breaks and holds above $118 on the weekly, this bearish setup would need to be reconsidered.
For now, I’m watching $105-$118 very closely. 👀
SOL is doing exactly what we expected after holding the long-term trendline.
Now around $98, price is approaching the major resistance levels at $105 and $118, where multiple weekly moving averages are sitting.
I’m expecting a rejection from this zone.
If rejection confirms, SOL could move back toward the lower support and demand zones shown on the chart.
But if SOL breaks and holds above $118 on the weekly, this bearish setup would need to be reconsidered.
For now, I’m watching $105-$118 very closely. 👀
$SOL WEEKLY ANALYSIS 🔥
SOL is doing exactly what we expected after holding the long-term trendline.
Now around $98, price is approaching the major resistance levels at $105 and $118, where multiple weekly moving averages are sitting.
I’m expecting a rejection from this zone.
If rejection confirms, SOL could move back toward the lower support and demand zones shown on the chart.
But if SOL breaks and holds above $118 on the weekly, this bearish setup would need to be reconsidered.
For now, I’m watching $105-$118 very closely. 👀
SOL is doing exactly what we expected after holding the long-term trendline.
Now around $98, price is approaching the major resistance levels at $105 and $118, where multiple weekly moving averages are sitting.
I’m expecting a rejection from this zone.
If rejection confirms, SOL could move back toward the lower support and demand zones shown on the chart.
But if SOL breaks and holds above $118 on the weekly, this bearish setup would need to be reconsidered.
For now, I’m watching $105-$118 very closely. 👀
Crypto Skull Signal
·
--
Bullish$SOL Weekly Analysis
$SOL is trading around $81, sitting at a very important area after a long correction from its highs. Right now, price is still holding above the long term ascending trendline, which tells me buyers are continuing to defend this region. That's exactly what I wanted to see before considering any bullish scenario.
In the short term, Bitcoin's bounce could help SOL push toward the $90 to $95 resistance zone. A move into that area is possible, but I still see it as a relief rally unless the market starts reclaiming key weekly resistance levels.
The broader market structure remains cautious. If SOL fails to hold the $65 weekly support, this bullish outlook would be invalidated, and I would expect a much deeper correction toward the $45 to $30 demand zone.
For now, I'm not chasing the upside. As long as SOL continues holding above support, the structure remains intact, but I'm treating any rally as short term until the overall market confirms a trend reversal.
$SOL is trading around $81, sitting at a very important area after a long correction from its highs. Right now, price is still holding above the long term ascending trendline, which tells me buyers are continuing to defend this region. That's exactly what I wanted to see before considering any bullish scenario.
In the short term, Bitcoin's bounce could help SOL push toward the $90 to $95 resistance zone. A move into that area is possible, but I still see it as a relief rally unless the market starts reclaiming key weekly resistance levels.
The broader market structure remains cautious. If SOL fails to hold the $65 weekly support, this bullish outlook would be invalidated, and I would expect a much deeper correction toward the $45 to $30 demand zone.
For now, I'm not chasing the upside. As long as SOL continues holding above support, the structure remains intact, but I'm treating any rally as short term until the overall market confirms a trend reversal.
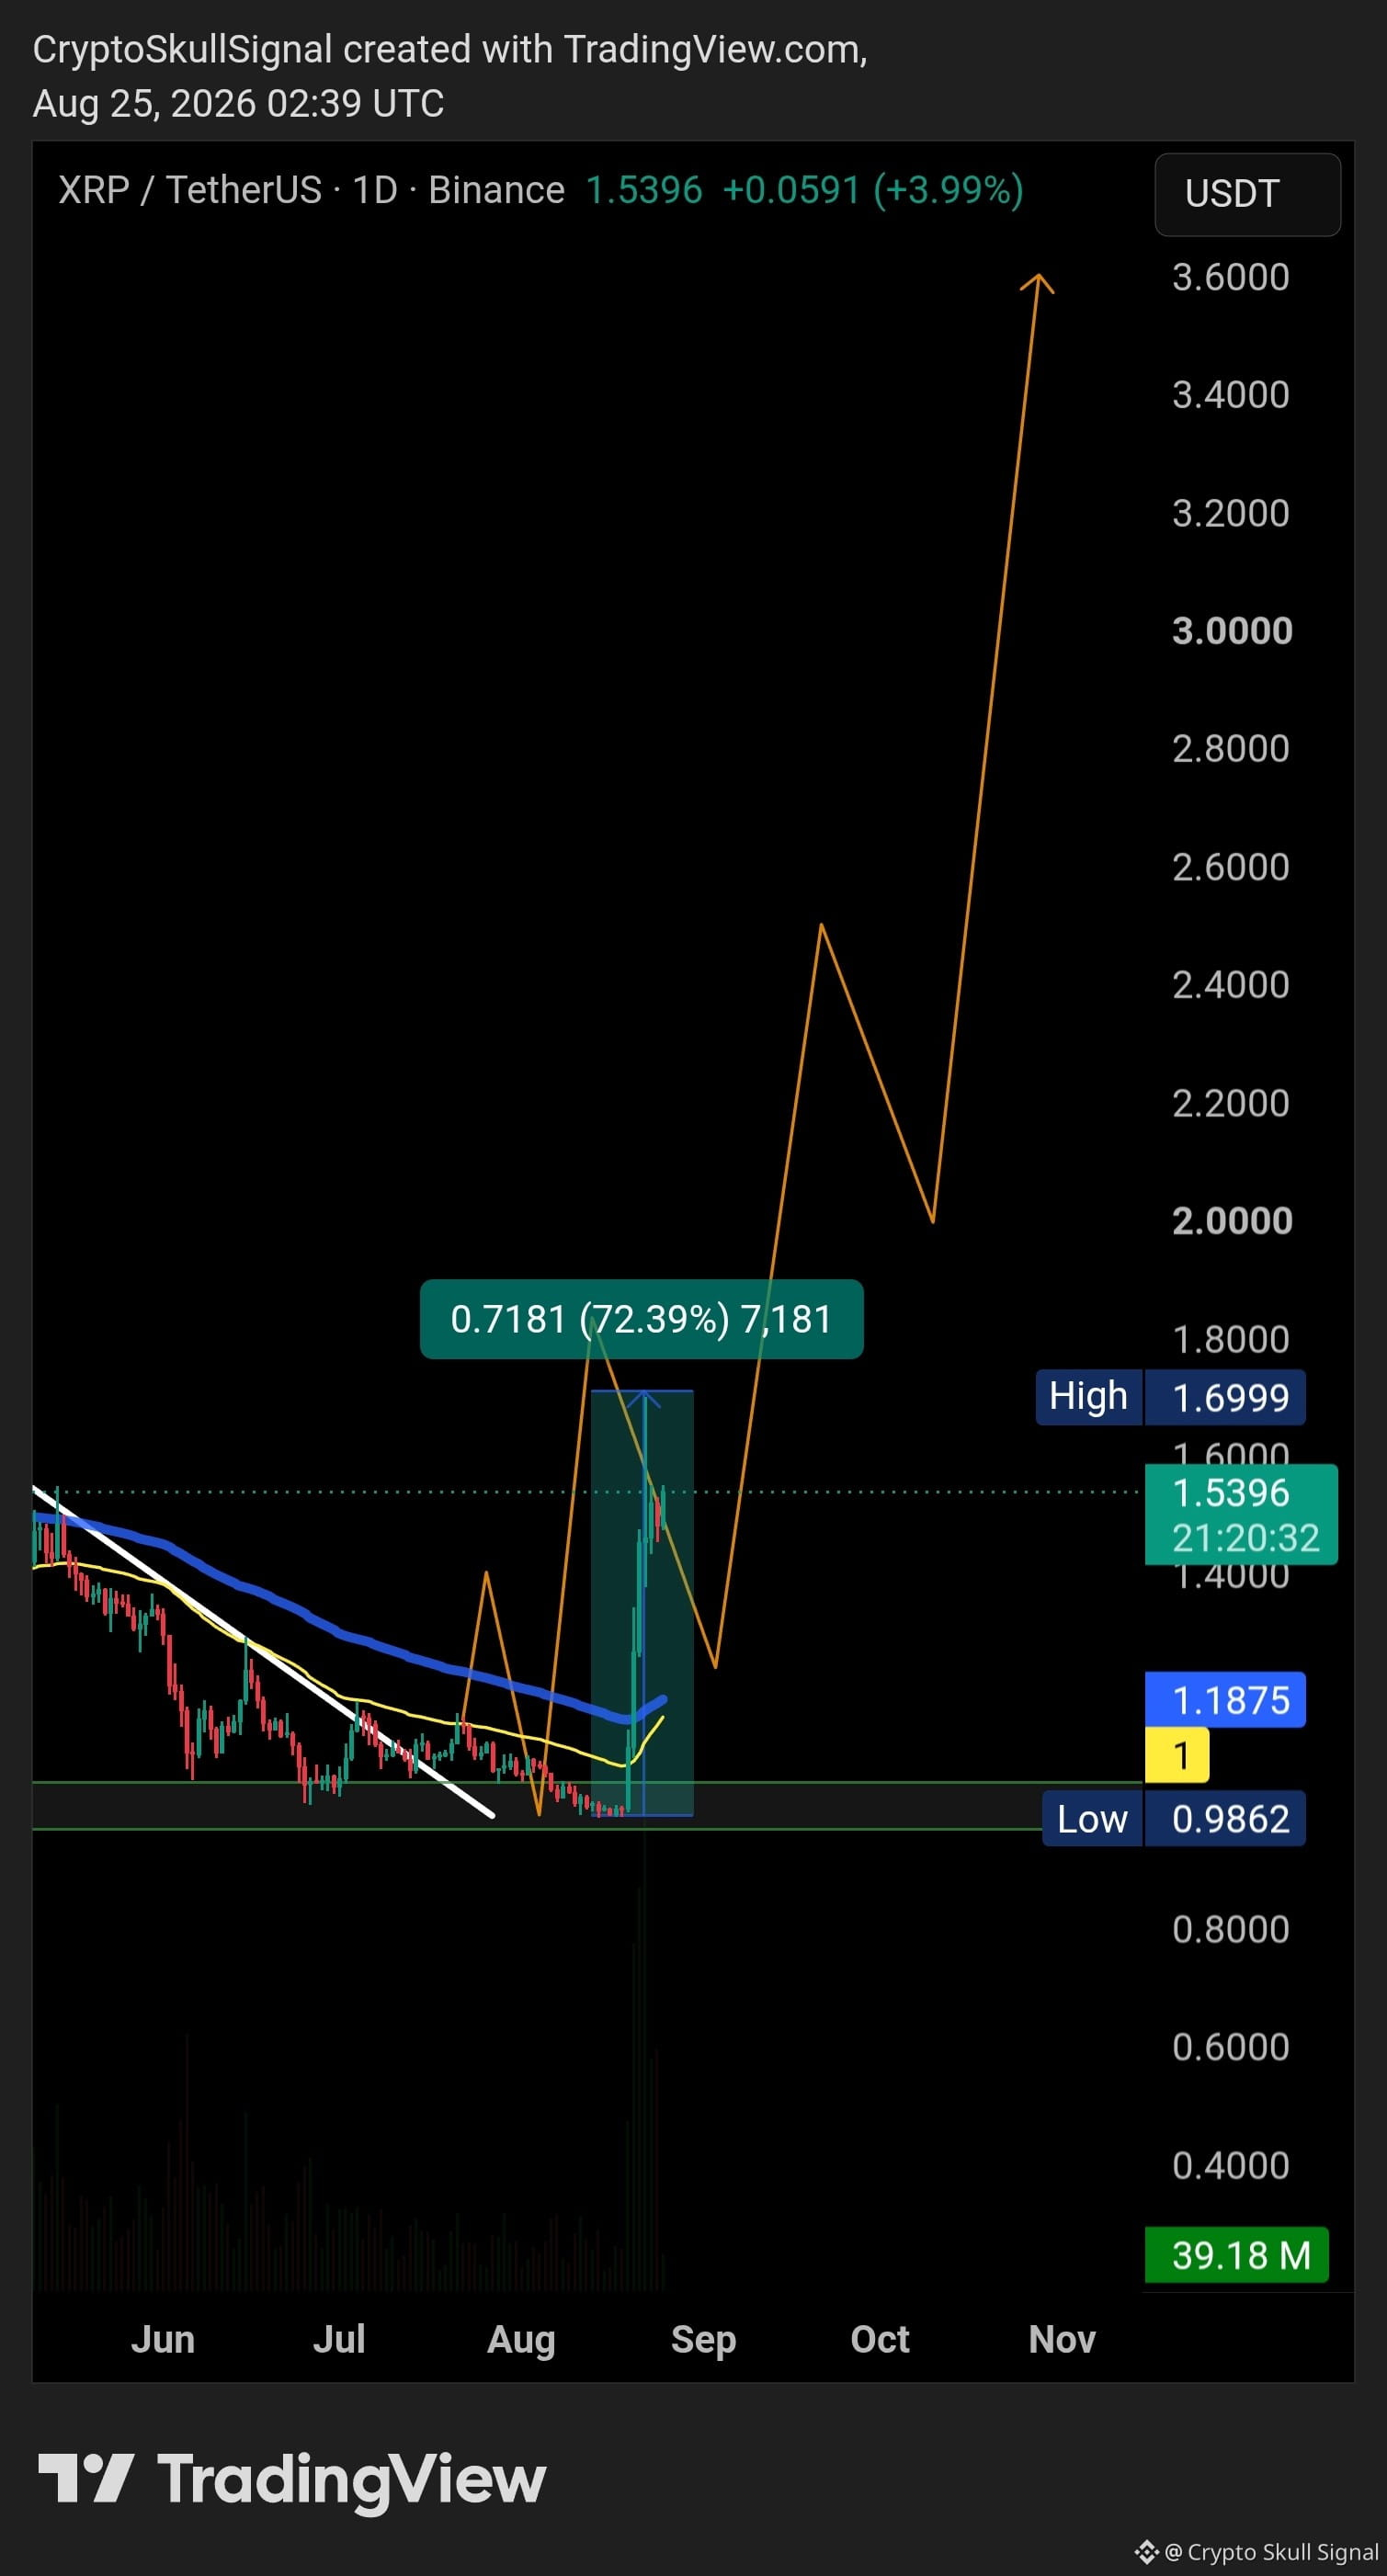
$XRP is now up 70%+ from the setup. 🔥
I shared this chart back on July 21 and told you guys what I was expecting.
Price was sitting in the accumulation zone, and now we’re seeing the move play out.
Still holding? Let it run. 📈
I shared this chart back on July 21 and told you guys what I was expecting.
Price was sitting in the accumulation zone, and now we’re seeing the move play out.
Still holding? Let it run. 📈
Crypto Skull Signal
·
--
Bullish$XRP Update
XRP has finally broken above the descending trendline, which is an encouraging shift after months of weakness.
The next key test is the 50 and 99 EMAs. If buyers can push through those levels and secure a daily close above $1.24, the chart will turn much more bullish and the recovery could accelerate.
For now, the breakout looks solid. As long as XRP stays above the trendline, I'm expecting more upside in the coming days.
XRP has finally broken above the descending trendline, which is an encouraging shift after months of weakness.
The next key test is the 50 and 99 EMAs. If buyers can push through those levels and secure a daily close above $1.24, the chart will turn much more bullish and the recovery could accelerate.
For now, the breakout looks solid. As long as XRP stays above the trendline, I'm expecting more upside in the coming days.
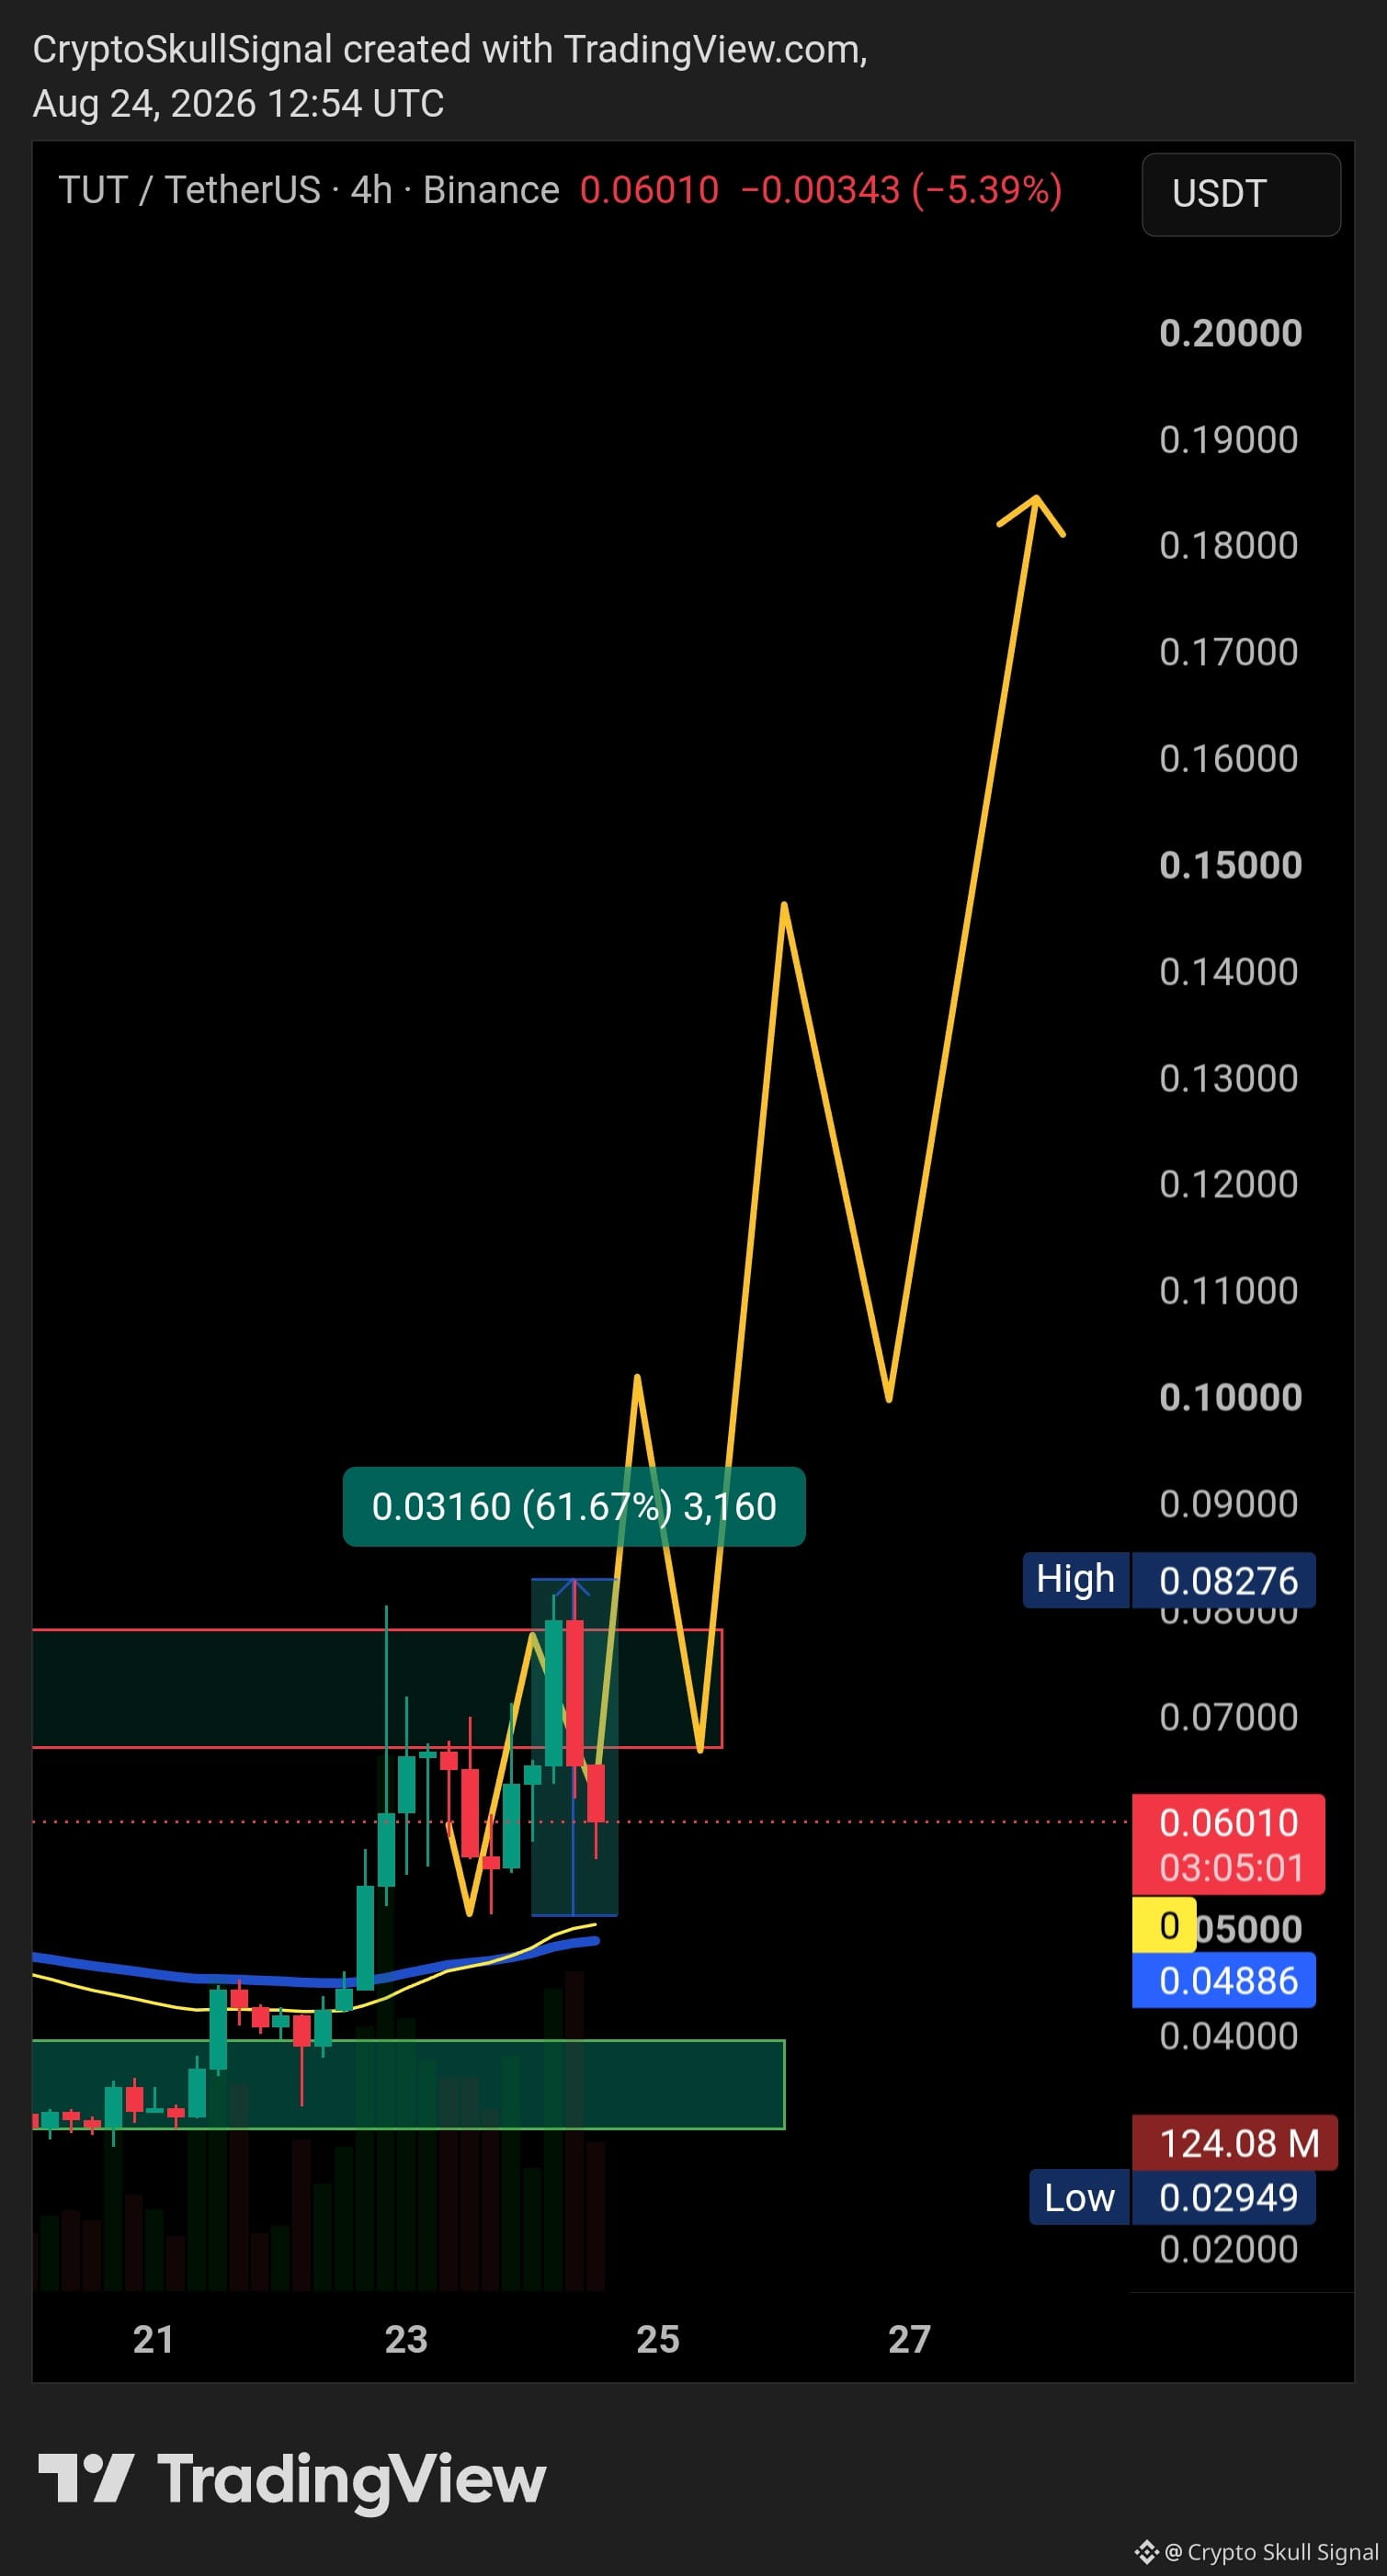
$TUT is doing exactly what I was looking for.
Already delivered **60%+ from the setup** in just a few hours. 🔥
Now price is pulling back, but the structure still looks good as long as we hold the EMA/support area.
The key now is simple: **reclaim the resistance and stay above it.** If we do, I’d expect another upside move to follow. 📈
Already delivered **60%+ from the setup** in just a few hours. 🔥
Now price is pulling back, but the structure still looks good as long as we hold the EMA/support area.
The key now is simple: **reclaim the resistance and stay above it.** If we do, I’d expect another upside move to follow. 📈
Crypto Skull Signal
·
--
Bullish$TUT is still looking bullish here.
As long as price holds above the EMAs and the accumulation zone, I’m comfortable with the upside setup.
There’s some resistance around $0.066–$0.078. Once we clear that area, the path higher should open up nicely. 📈🔥
As long as price holds above the EMAs and the accumulation zone, I’m comfortable with the upside setup.
There’s some resistance around $0.066–$0.078. Once we clear that area, the path higher should open up nicely. 📈🔥
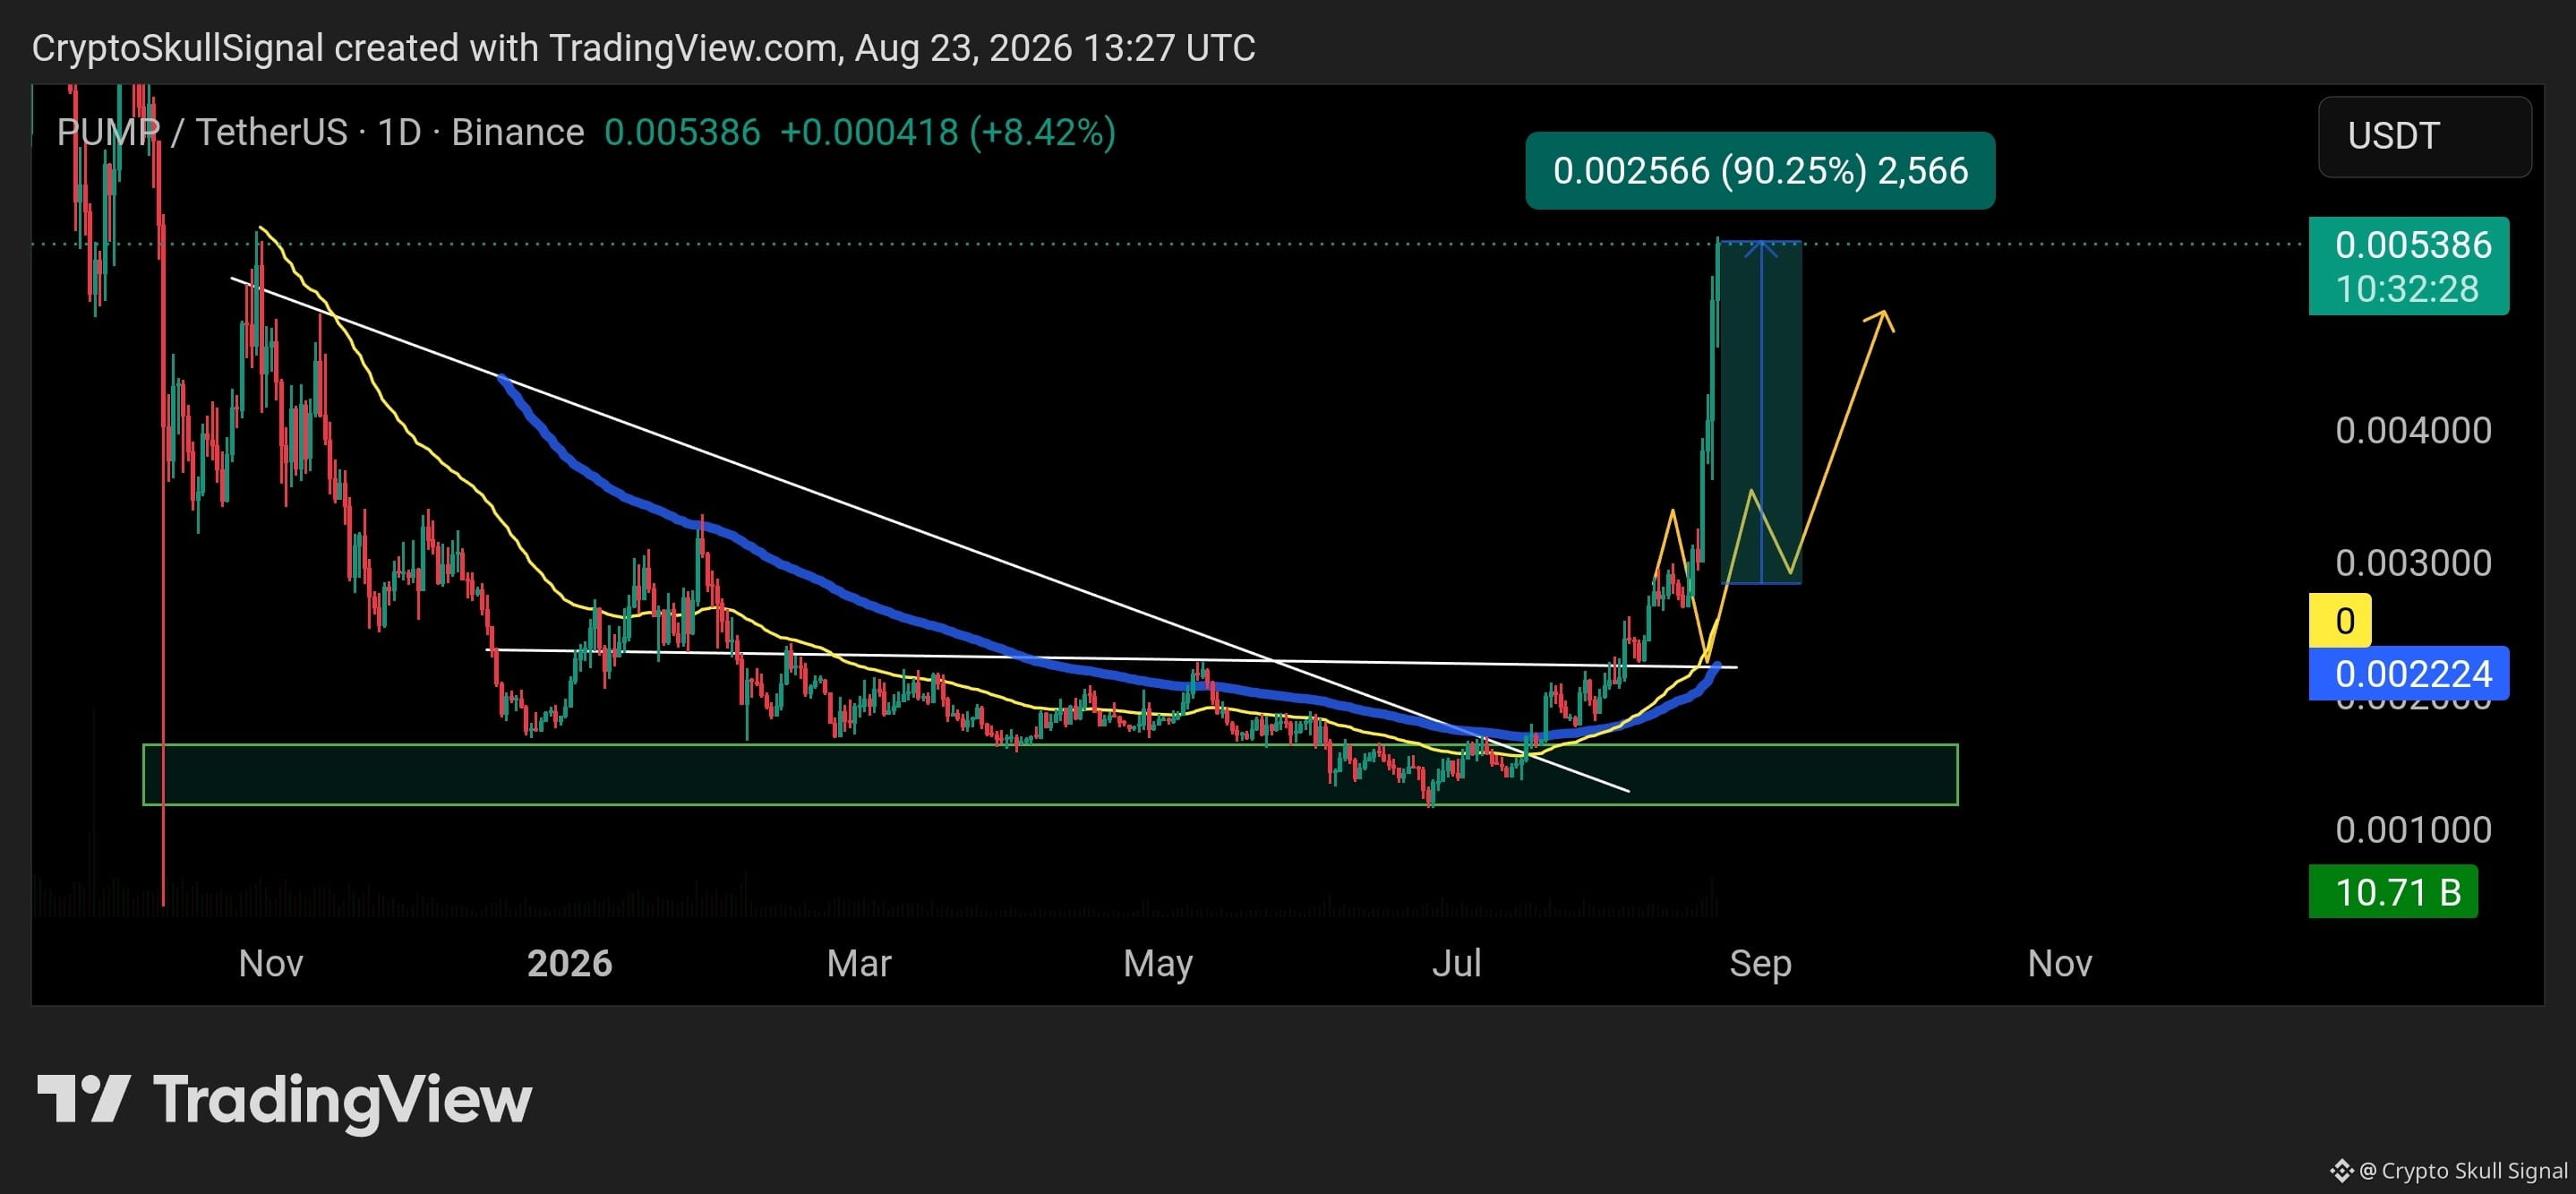
$PUMP just printed a 90%+ move in only 12 days. 🔥
Breakout worked perfectly — and the upside move is still looking strong as long as it holds above the breakout/EMA area. 📈🚀
Breakout worked perfectly — and the upside move is still looking strong as long as it holds above the breakout/EMA area. 📈🚀
Crypto Skull Signal
·
--
Bullish$PUMP looking ready 👀🔥
After months of trading near the bottom, price has finally broken above the major resistance and started moving.
As long as it holds the breakout, I’m watching $0.0035 → $0.0040 → $0.0048 next.
This one could get interesting if the momentum stays strong. 🚀
After months of trading near the bottom, price has finally broken above the major resistance and started moving.
As long as it holds the breakout, I’m watching $0.0035 → $0.0040 → $0.0048 next.
This one could get interesting if the momentum stays strong. 🚀
Log in to explore more content