
Triple K Crypto
1.4k Posts

Triple K Crypto
Empowering the crypto community with insights, strategies, and updates. Your guide to navigating the digital asset revolution. Join me in exploring the world of
22 Following
215 Followers
1.1K+ Liked
Posts
All
Quotes
Live

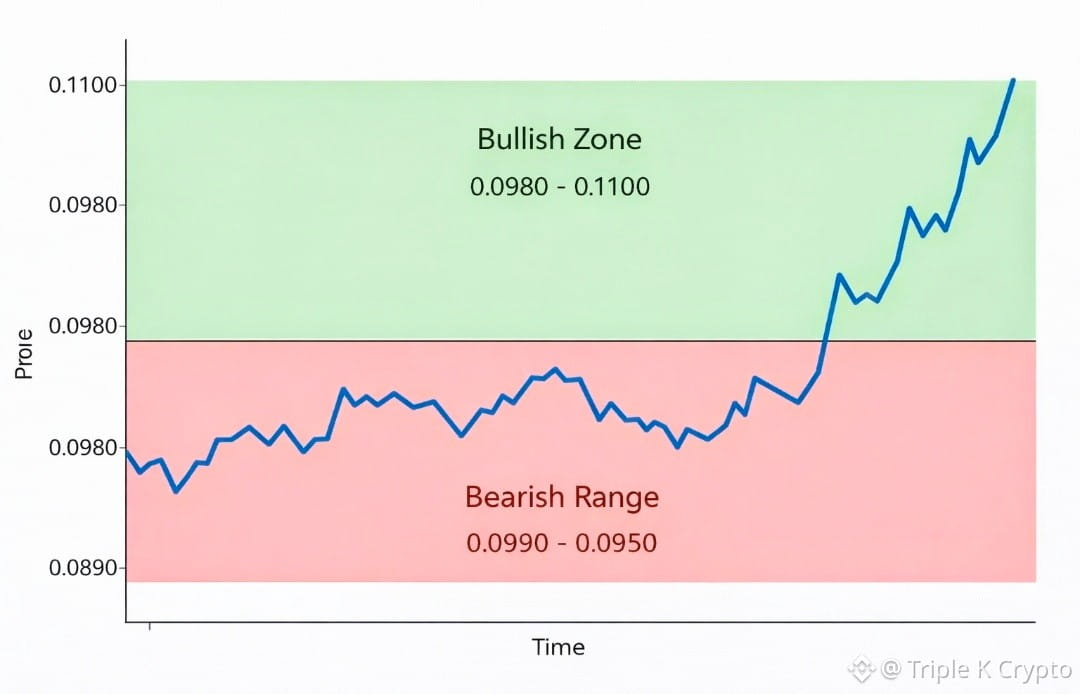
Vertical Move, Hidden Story, $DOGE
Structure Update
Most traders see a strong green candle and think there is a trend.
Professionals see imbalances, liquidity, and reaction zones.
DOGE didn’t pump randomly.
The price moved up from a compression base after a long period of weakness; this is typical volatility cycle behavior.
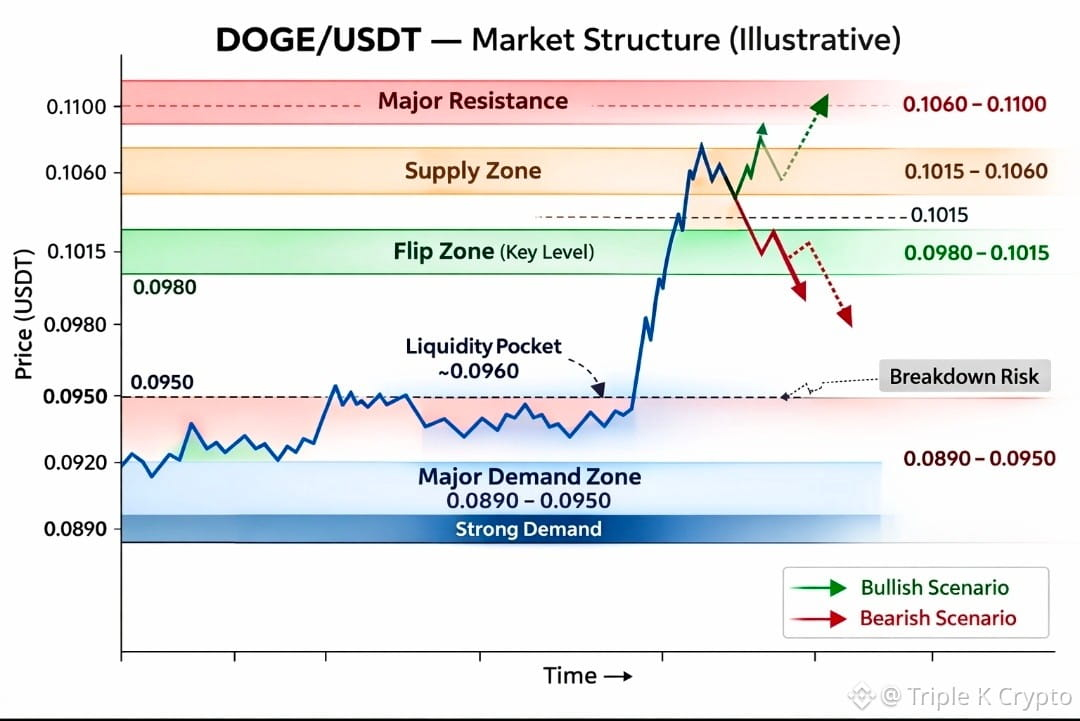
Current Structure Map
Major Resistance Zone: 0.1060 to 0.1100 (seller reaction area)
Supply Region: 0.1015 to 0.1060
Flip Zone: 0.0980 to 0.1015 (decision region)
Breakdown Risk Level: 0.0950
Liquidity Pocket: around 0.0960
Major Demand Zone: 0.0890 to 0.0950 (buyer interest region)
Price Behavior Logic
Compression, Expansion, Reaction, Decision
Fast moves attract late buyers.
Smart money pays attention to how price acts after expansion, not during it.
Bullish Scenario (Structure First)
As long as DOGE holds above 0.0980 to 0.1015:
• Pullbacks stay corrective
• Buyers keep short-term control
• Acceptance above 0.1060 opens up continuation potential
Strength is confirmed when resistance turns into support.
Bearish Scenario (Invalidation Trigger)
If DOGE drops below 0.0980 with momentum:
• Expansion turns into exhaustion
• Liquidity below acts like a magnet
• A move toward 0.0950 to 0.0890 becomes likely
Breakdowns start with failed support, not fear.
Trader’s Reality
Volatility is loud.
Structure is quiet.
Smart traders watch:
• Reactions at key zones
• Acceptance versus rejection
• Momentum versus exhaustion
DOGE is not just about candles.
DOGE is negotiating value.
No predictions—only structured reactions.
Is this expansion building continuation strength, or preparing for a liquidity retracement?
Structure Update
Most traders see a strong green candle and think there is a trend.
Professionals see imbalances, liquidity, and reaction zones.
DOGE didn’t pump randomly.
The price moved up from a compression base after a long period of weakness; this is typical volatility cycle behavior.
Current Structure Map
Major Resistance Zone: 0.1060 to 0.1100 (seller reaction area)
Supply Region: 0.1015 to 0.1060
Flip Zone: 0.0980 to 0.1015 (decision region)
Breakdown Risk Level: 0.0950
Liquidity Pocket: around 0.0960
Major Demand Zone: 0.0890 to 0.0950 (buyer interest region)
Price Behavior Logic
Compression, Expansion, Reaction, Decision
Fast moves attract late buyers.
Smart money pays attention to how price acts after expansion, not during it.
Bullish Scenario (Structure First)
As long as DOGE holds above 0.0980 to 0.1015:
• Pullbacks stay corrective
• Buyers keep short-term control
• Acceptance above 0.1060 opens up continuation potential
Strength is confirmed when resistance turns into support.
Bearish Scenario (Invalidation Trigger)
If DOGE drops below 0.0980 with momentum:
• Expansion turns into exhaustion
• Liquidity below acts like a magnet
• A move toward 0.0950 to 0.0890 becomes likely
Breakdowns start with failed support, not fear.
Trader’s Reality
Volatility is loud.
Structure is quiet.
Smart traders watch:
• Reactions at key zones
• Acceptance versus rejection
• Momentum versus exhaustion
DOGE is not just about candles.
DOGE is negotiating value.
No predictions—only structured reactions.
Is this expansion building continuation strength, or preparing for a liquidity retracement?
$ETH
The Move Speaks, The Crowd Reacts
Most traders focus on candles.
Professionals focus on behavior.
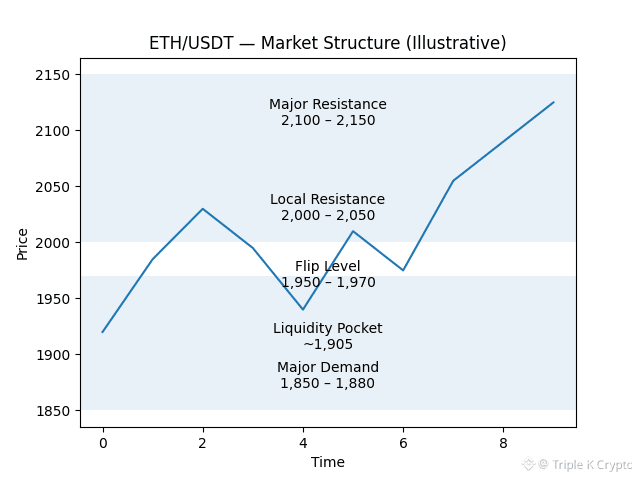
ETH pushed away from the lower reaction zone and is now rotating inside a decision region. Nothing explosive, just structured movement.
Impulse attracts attention.
Structure reveals intention.
Current Structure Snapshot
Major Reaction High: 2,103
Local Resistance Zone: 1,995, 2,010
Flip Level, Decision Area: 1,970, 1,980
Key Support: 1,955, 1,960
Liquidity Pocket Below: ~1,906
Price is not moving randomly; it is negotiating levels.
What Already Happened
Expansion, Rejection, Rotation, Stabilization
No drama, only order flow dynamics.
Bullish Scenario (Structure-Based)
As long as ETH holds above 1,955, 1,960, the structure remains stable.
Acceptance back above 1,995 opens room toward the 2,010, 2,030 region.
Strength comes from reclaiming levels, not predicting moves.
Bearish Scenario (Invalidation)
Failure to defend 1,955 support exposes downside liquidity.
Below that, rotation toward 1,930, 1,906 becomes structurally logical.
Weakness begins where support fails, not where fear starts.
My View
ETH is currently compressing inside a decision zone.
This is where impatient traders get chopped and disciplined traders wait.
The chart is not emotional.
Participants are.
Is this quiet consolidation before continuation, or preparation for another liquidity sweep?
The Move Speaks, The Crowd Reacts
Most traders focus on candles.
Professionals focus on behavior.
ETH pushed away from the lower reaction zone and is now rotating inside a decision region. Nothing explosive, just structured movement.
Impulse attracts attention.
Structure reveals intention.
Current Structure Snapshot
Major Reaction High: 2,103
Local Resistance Zone: 1,995, 2,010
Flip Level, Decision Area: 1,970, 1,980
Key Support: 1,955, 1,960
Liquidity Pocket Below: ~1,906
Price is not moving randomly; it is negotiating levels.
What Already Happened
Expansion, Rejection, Rotation, Stabilization
No drama, only order flow dynamics.
Bullish Scenario (Structure-Based)
As long as ETH holds above 1,955, 1,960, the structure remains stable.
Acceptance back above 1,995 opens room toward the 2,010, 2,030 region.
Strength comes from reclaiming levels, not predicting moves.
Bearish Scenario (Invalidation)
Failure to defend 1,955 support exposes downside liquidity.
Below that, rotation toward 1,930, 1,906 becomes structurally logical.
Weakness begins where support fails, not where fear starts.
My View
ETH is currently compressing inside a decision zone.
This is where impatient traders get chopped and disciplined traders wait.
The chart is not emotional.
Participants are.
Is this quiet consolidation before continuation, or preparation for another liquidity sweep?
Bitcoin Loses $1.2T in Market Value; Saylor Remains Bullish
Key Points:
• Bitcoin market cap is down $1.2 trillion in five months.
• The total crypto market lost $2.02 trillion since October.
• BTC makes up 59% of the total decline.
• Michael Saylor stays very optimistic.
Since October 2025, the global crypto market has lost about $2.02 trillion in value, with Bitcoin responsible for $1.2 trillion of that decline.
This drop emphasizes how closely the overall market sentiment is linked to Bitcoin’s performance. Despite the decline, long-term holders and corporate investors see this downturn as part of a larger cycle rather than a failure of the system.
The strategy has suffered billions in unrealized losses during this downturn. Nevertheless, its chairman, Michael Saylor, said he has “never been so optimistic” about Bitcoin’s future. His view supports a long-term belief—seeing volatility as temporary while concentrating on adoption, scarcity, and macro factors.
Historically, major corrections often test commitment before the next growth phase.
Does this level of decline indicate a deeper weakness, or is it the reset that leads to the next cycle?$BTC
#WhenWillCLARITYActPass
Key Points:
• Bitcoin market cap is down $1.2 trillion in five months.
• The total crypto market lost $2.02 trillion since October.
• BTC makes up 59% of the total decline.
• Michael Saylor stays very optimistic.
Since October 2025, the global crypto market has lost about $2.02 trillion in value, with Bitcoin responsible for $1.2 trillion of that decline.
This drop emphasizes how closely the overall market sentiment is linked to Bitcoin’s performance. Despite the decline, long-term holders and corporate investors see this downturn as part of a larger cycle rather than a failure of the system.
The strategy has suffered billions in unrealized losses during this downturn. Nevertheless, its chairman, Michael Saylor, said he has “never been so optimistic” about Bitcoin’s future. His view supports a long-term belief—seeing volatility as temporary while concentrating on adoption, scarcity, and macro factors.
Historically, major corrections often test commitment before the next growth phase.
Does this level of decline indicate a deeper weakness, or is it the reset that leads to the next cycle?$BTC
#WhenWillCLARITYActPass

$BTC
Weak Hands React, Structure Decides
Red candles create fear. Structure creates opportunity.
SOL is not moving randomly; it is shifting between liquidity and key decision zones. Emotional reactions distort reality, but price action always respects levels.
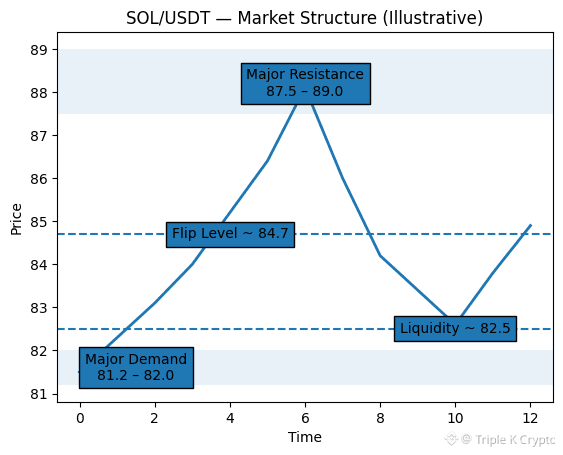
After the strong move upward, SOL faced heavy resistance and could not hold its position. The following pullback is typical market behavior, not a certain trend reversal.
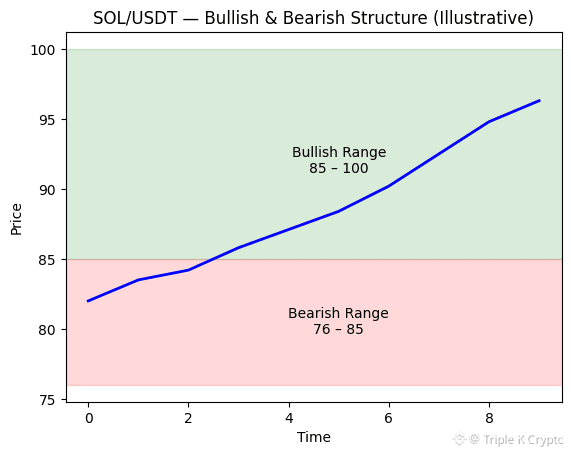
Current Structure Breakdown
Major Resistance Zone: 87.5, 89.0 (rejection area)
Supply Region: 85.5, 86.5
Flip Zone: 84.5, 85.0 (decision region)
Breakdown Level: 83.0 (short-term control point)
Liquidity Pocket: ~82.5
Major Demand Zone: 81.2, 82.0
The market continues its natural cycle:
Push → Reject → Seek Liquidity → Decide
Bullish Scenario (Structure-Based)
As long as SOL stabilizes above 83.0, the downside remains corrective.
Reclaiming and accepting above 84.5, 85.0 shifts momentum back toward supply.
Sustained strength only confirms once resistance turns into support.
No acceptance means no confirmation.
Bearish Scenario (Invalidation)
If SOL accepts below 83.0:
Liquidity becomes the immediate target.
Failing to hold 82.5 raises the chances of a move into the 81.2, 82.0 demand zone.
Breakdowns start quietly; panic follows later.
My View
Most traders respond to candle color. Professionals respond to positioning.
Key observations:
• Clear rejection from higher levels
• Liquidity lying below price
• Ongoing struggle at the flip zone
SOL is negotiating value, not collapsing.
No predictions; only responses to structure.
Has SOL finished its downside liquidity sweep, or is another shakeout coming?
Weak Hands React, Structure Decides
Red candles create fear. Structure creates opportunity.
SOL is not moving randomly; it is shifting between liquidity and key decision zones. Emotional reactions distort reality, but price action always respects levels.
After the strong move upward, SOL faced heavy resistance and could not hold its position. The following pullback is typical market behavior, not a certain trend reversal.
Current Structure Breakdown
Major Resistance Zone: 87.5, 89.0 (rejection area)
Supply Region: 85.5, 86.5
Flip Zone: 84.5, 85.0 (decision region)
Breakdown Level: 83.0 (short-term control point)
Liquidity Pocket: ~82.5
Major Demand Zone: 81.2, 82.0
The market continues its natural cycle:
Push → Reject → Seek Liquidity → Decide
Bullish Scenario (Structure-Based)
As long as SOL stabilizes above 83.0, the downside remains corrective.
Reclaiming and accepting above 84.5, 85.0 shifts momentum back toward supply.
Sustained strength only confirms once resistance turns into support.
No acceptance means no confirmation.
Bearish Scenario (Invalidation)
If SOL accepts below 83.0:
Liquidity becomes the immediate target.
Failing to hold 82.5 raises the chances of a move into the 81.2, 82.0 demand zone.
Breakdowns start quietly; panic follows later.
My View
Most traders respond to candle color. Professionals respond to positioning.
Key observations:
• Clear rejection from higher levels
• Liquidity lying below price
• Ongoing struggle at the flip zone
SOL is negotiating value, not collapsing.
No predictions; only responses to structure.
Has SOL finished its downside liquidity sweep, or is another shakeout coming?
Vitalik’s X Profile Update Draws Attention
Vitalik has updated his X profile, and the crypto community quickly took notice.
His new bio now reads:
“I choose balance. First-level balance. mi pinxe lo crino tcati,”
replacing the old description. His profile banner has also changed, adding to the curiosity.
Key points
- Bio text updated with a message focused on “balance”
- Unusual phrase at the end sparked speculation
- Profile banner updated
- Community discussions are increasing about possible meaning
Changes to Vitalik’s profile often spark conversations. Followers look for signs about his mindset, direction, or upcoming developments. While no official explanation has been provided, the wording suggests themes of balance and foundational principles.
In crypto, even small updates from major figures can influence sentiments and the overall narrative.
Is this simply a personal expression, or could it indicate a larger shift in focus?$ETH
#OpenClawFounderJoinsOpenAI
Vitalik has updated his X profile, and the crypto community quickly took notice.
His new bio now reads:
“I choose balance. First-level balance. mi pinxe lo crino tcati,”
replacing the old description. His profile banner has also changed, adding to the curiosity.
Key points
- Bio text updated with a message focused on “balance”
- Unusual phrase at the end sparked speculation
- Profile banner updated
- Community discussions are increasing about possible meaning
Changes to Vitalik’s profile often spark conversations. Followers look for signs about his mindset, direction, or upcoming developments. While no official explanation has been provided, the wording suggests themes of balance and foundational principles.
In crypto, even small updates from major figures can influence sentiments and the overall narrative.
Is this simply a personal expression, or could it indicate a larger shift in focus?$ETH
#OpenClawFounderJoinsOpenAI
$INIT
Vertical Moves Create Dangerous Emotions
Most traders see opportunity.
Experienced traders see imbalance.
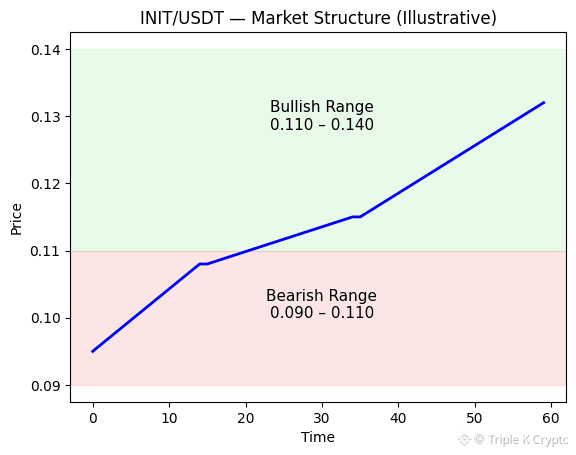
INT didn’t just pump — it went into a near-vertical expansion, the type of move that usually leaves weak positioning, trapped late buyers, and unstable structure behind.
Fast moves excite retail.
Smart money studies reaction zones.
Current Structure Breakdown
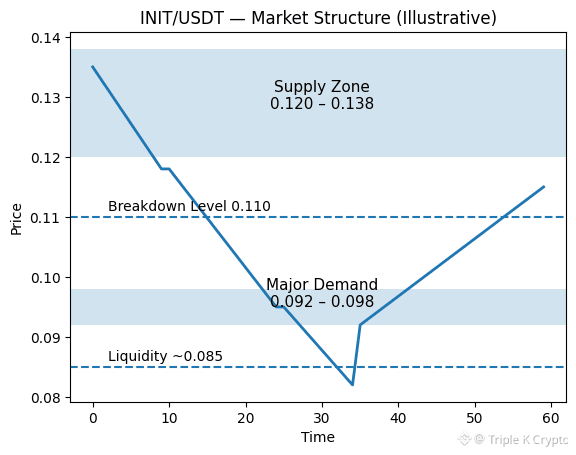
Impulse Top: 0.1376 → exhaustion spike
Expansion Base: ~0.0670 → origin of move
Current Price Area: ~0.1190
Immediate Reaction Zone: 0.1100 – 0.1200
Liquidity Gap: Below 0.1050
Major Support Interest: 0.0920 – 0.0980
Parabolic moves rarely stay calm.
They seek balance.
Bullish Scenario (Structure-Based)
If INT stabilizes above 0.1100 and builds acceptance, continuation toward the prior spike region becomes structurally valid.
Strength must transition from impulse → controlled trend.
Without that, upside becomes fragile.
Bearish Scenario (Invalidation)
Loss of 0.1100 opens the door for a deeper rotation into the liquidity gap.
Failure to react there → price gravitates toward 0.0950 demand.
No panic. No guessing. Just mechanics.
My View
Chasing vertical candles is emotional trading.
Trading reactions is professional behavior.
The market rewards discipline — not excitement.
Is this the start of sustainable expansion…
or the classic post-pump trap phase?
#TradeCryptosOnX
Vertical Moves Create Dangerous Emotions
Most traders see opportunity.
Experienced traders see imbalance.
INT didn’t just pump — it went into a near-vertical expansion, the type of move that usually leaves weak positioning, trapped late buyers, and unstable structure behind.
Fast moves excite retail.
Smart money studies reaction zones.
Current Structure Breakdown
Impulse Top: 0.1376 → exhaustion spike
Expansion Base: ~0.0670 → origin of move
Current Price Area: ~0.1190
Immediate Reaction Zone: 0.1100 – 0.1200
Liquidity Gap: Below 0.1050
Major Support Interest: 0.0920 – 0.0980
Parabolic moves rarely stay calm.
They seek balance.
Bullish Scenario (Structure-Based)
If INT stabilizes above 0.1100 and builds acceptance, continuation toward the prior spike region becomes structurally valid.
Strength must transition from impulse → controlled trend.
Without that, upside becomes fragile.
Bearish Scenario (Invalidation)
Loss of 0.1100 opens the door for a deeper rotation into the liquidity gap.
Failure to react there → price gravitates toward 0.0950 demand.
No panic. No guessing. Just mechanics.
My View
Chasing vertical candles is emotional trading.
Trading reactions is professional behavior.
The market rewards discipline — not excitement.
Is this the start of sustainable expansion…
or the classic post-pump trap phase?
#TradeCryptosOnX
$BNB When the price was at the support zone, I was down 1500%.
Now it’s trying to break through Resistance 1.
If it clears Resistance 1, my loss will shrink to around -315%.
And if it pushes through Resistance 2, I’ll reach my final objective — about +622%.
Support: 570–575 zone
Resistance 1: 640–650 zone
Resistance 2: 760–780 zone
Do you have any questions?
$BNB
Now it’s trying to break through Resistance 1.
If it clears Resistance 1, my loss will shrink to around -315%.
And if it pushes through Resistance 2, I’ll reach my final objective — about +622%.
Support: 570–575 zone
Resistance 1: 640–650 zone
Resistance 2: 760–780 zone
Do you have any questions?
$BNB

XRPUSDT, Vertical Expansion After Compression
Everyone gets excited when the price rises. I’m paying attention to the structure, not the emotion.
XRP spent several sessions building a base before making a strong upward move. This kind of movement is not random; it typically follows shifts in liquidity and releases of imbalance.
Current Structure Breakdown
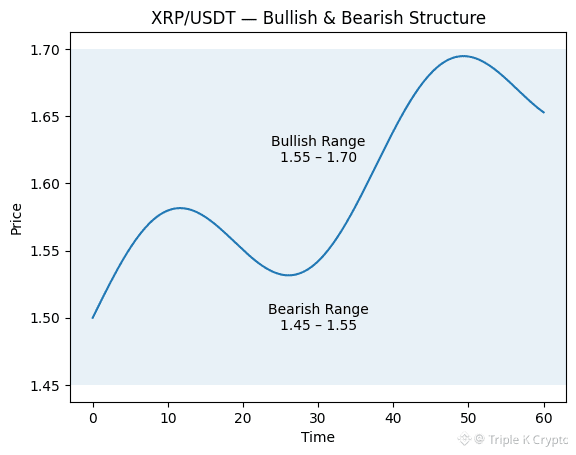
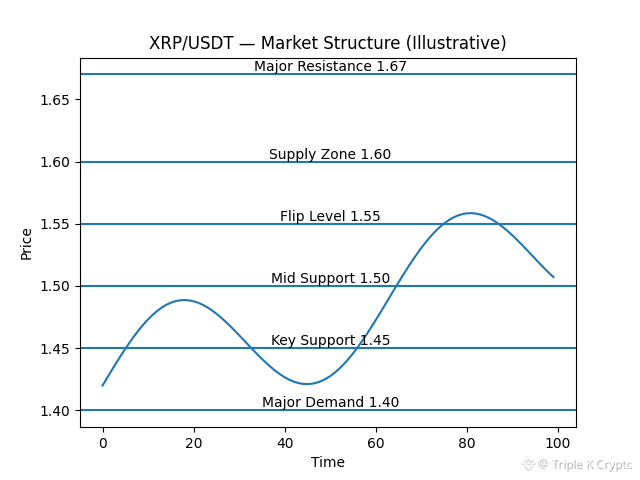
Major High: 1.6710, sharp rejection zone
Local Support: 1.5880, short-term reaction level
Breakout Base: ~1.5000, structure origin
Key Demand: 1.4200 to 1.4500, buyer territory
Liquidity Sweep: Below 1.5000, prior consolidation trap
The market did what it always does:
Compress, expand, trap late entries.
Bullish Scenario (Structure-Based)
As long as XRP stays above 1.5880, attempts to continue toward the 1.67 region remain valid. If it holds above the recent high, it will open the way for another leg of expansion. Momentum traders will look for a higher-low formation instead of chasing spikes.
Bearish Scenario (Invalidation)
If XRP fails to hold 1.5880, the chances of a corrective move toward 1.50 increase. Losing that base will shift control back to the demand area near 1.42 to 1.45. No guessing—only reacting at levels.
My View
Fast moves create emotional bias.
Smart positioning occurs at structure, not candles.
Do you think XRP is getting ready for continuation, or is this expansion leading to a deeper pullback?$XRP
#MarketRebound
Everyone gets excited when the price rises. I’m paying attention to the structure, not the emotion.
XRP spent several sessions building a base before making a strong upward move. This kind of movement is not random; it typically follows shifts in liquidity and releases of imbalance.
Current Structure Breakdown
Major High: 1.6710, sharp rejection zone
Local Support: 1.5880, short-term reaction level
Breakout Base: ~1.5000, structure origin
Key Demand: 1.4200 to 1.4500, buyer territory
Liquidity Sweep: Below 1.5000, prior consolidation trap
The market did what it always does:
Compress, expand, trap late entries.
Bullish Scenario (Structure-Based)
As long as XRP stays above 1.5880, attempts to continue toward the 1.67 region remain valid. If it holds above the recent high, it will open the way for another leg of expansion. Momentum traders will look for a higher-low formation instead of chasing spikes.
Bearish Scenario (Invalidation)
If XRP fails to hold 1.5880, the chances of a corrective move toward 1.50 increase. Losing that base will shift control back to the demand area near 1.42 to 1.45. No guessing—only reacting at levels.
My View
Fast moves create emotional bias.
Smart positioning occurs at structure, not candles.
Do you think XRP is getting ready for continuation, or is this expansion leading to a deeper pullback?$XRP
#MarketRebound
Tom Lee: Heavy Bitcoin Sell-Off May Signal a Bottom
Answer: Yes
Tom Lee said that when users give up on Bitcoin and sell aggressively, it often signals that the market is near a bottom.
He explained that extreme frustration and panic selling usually happen close to the end of a downtrend.
Key points
Aggressive sell-offs can mark emotional exhaustion
Retail capitulation often appears near cycle lows
Market bottoms are usually formed during maximum pessimism
Sentiment plays a major role in turning points
According to Lee, when most participants lose confidence, the selling pressure may already be close to its peak.
Do you think current market sentiment shows signs of a potential bottom?$BTC
#MarketRebound
Answer: Yes
Tom Lee said that when users give up on Bitcoin and sell aggressively, it often signals that the market is near a bottom.
He explained that extreme frustration and panic selling usually happen close to the end of a downtrend.
Key points
Aggressive sell-offs can mark emotional exhaustion
Retail capitulation often appears near cycle lows
Market bottoms are usually formed during maximum pessimism
Sentiment plays a major role in turning points
According to Lee, when most participants lose confidence, the selling pressure may already be close to its peak.
Do you think current market sentiment shows signs of a potential bottom?$BTC
#MarketRebound


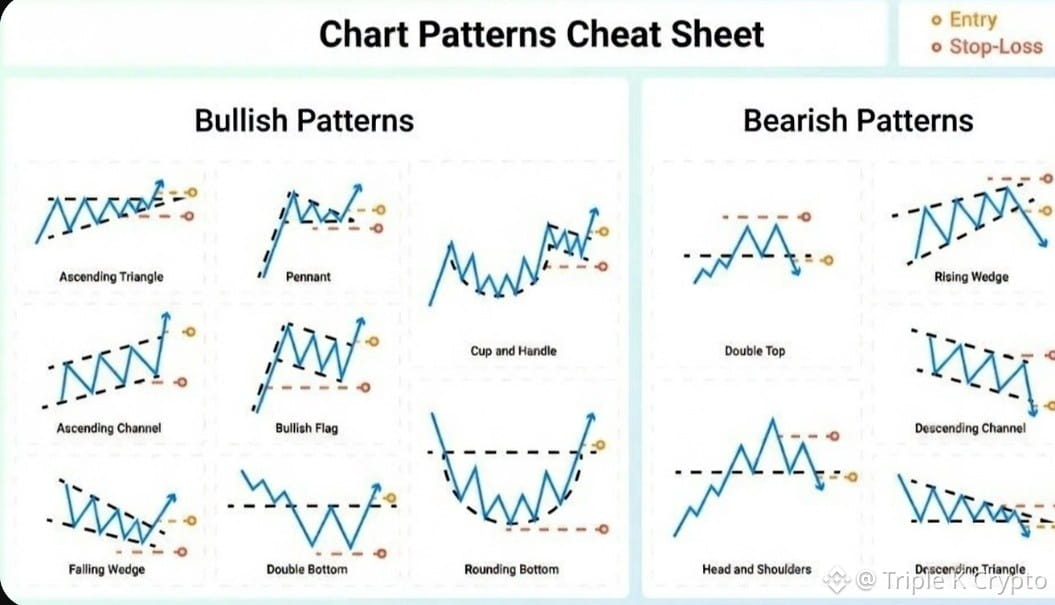
CHART PATTERNS CHEAT SHEET
If you don’t know these, you are trading based on emotion. If you master these, you trade with structure.
BULLISH PATTERNS
Ascending Triangle: Buyers pressing resistance; breakout probability is high.
Pennant: Short consolidation after impulse; continuation is likely.
Cup & Handle: Accumulation plus breakout fuel.
Ascending Channel: Controlled bullish structure.
Bullish Flag: Strong move, small pullback, next leg up.
Falling Wedge: Compression before upside reversal.
Double Bottom: Support defended twice; buyers stepping in.
Rounding Bottom: Slow accumulation; smart money positioning early.
BEARISH PATTERNS
Rising Wedge: Weak upside momentum; breakdown risk is high.
Double Top: Resistance respected twice; reversal zone.
Descending Channel: Structured downtrend continuation.
Head & Shoulders: Classic top formation.
Descending Triangle: Support under pressure; breakdown is likely. $BNB
But understand this clearly:
Entry without confirmation equals gambling.
Pattern without context equals trap.
Always confirm with:
• Volume
• Market structure
• Liquidity zones
• Risk management $ETH
Retail traders draw patterns. Professionals wait for breakout confirmation. The market rewards patience, not prediction. The real edge is not knowing patterns. It’s executing them with discipline.
Now tell me, which pattern do you trade the most?$BTC
#MarketRebound
If you don’t know these, you are trading based on emotion. If you master these, you trade with structure.
BULLISH PATTERNS
Ascending Triangle: Buyers pressing resistance; breakout probability is high.
Pennant: Short consolidation after impulse; continuation is likely.
Cup & Handle: Accumulation plus breakout fuel.
Ascending Channel: Controlled bullish structure.
Bullish Flag: Strong move, small pullback, next leg up.
Falling Wedge: Compression before upside reversal.
Double Bottom: Support defended twice; buyers stepping in.
Rounding Bottom: Slow accumulation; smart money positioning early.
BEARISH PATTERNS
Rising Wedge: Weak upside momentum; breakdown risk is high.
Double Top: Resistance respected twice; reversal zone.
Descending Channel: Structured downtrend continuation.
Head & Shoulders: Classic top formation.
Descending Triangle: Support under pressure; breakdown is likely. $BNB
But understand this clearly:
Entry without confirmation equals gambling.
Pattern without context equals trap.
Always confirm with:
• Volume
• Market structure
• Liquidity zones
• Risk management $ETH
Retail traders draw patterns. Professionals wait for breakout confirmation. The market rewards patience, not prediction. The real edge is not knowing patterns. It’s executing them with discipline.
Now tell me, which pattern do you trade the most?$BTC
#MarketRebound
Whale Move: 261,024 ETH Sent to Exchanges
Garrett Jin has deposited 261,024 ETH, worth about $543 million, into centralized exchanges. This big on-chain movement quickly caught market attention. Earlier, he sold 5,000 BTC, valued at around $348.82 million.
He also withdrew 53.12 million USDT from exchanges. At the same time, he still holds more than 30,000 BTC, worth about $2.09 billion. Large transfers like this often make traders watch closely for possible market impact.
Will this ETH deposit create more selling pressure, or is it part of a larger portfolio adjustment?$ETH
Garrett Jin has deposited 261,024 ETH, worth about $543 million, into centralized exchanges. This big on-chain movement quickly caught market attention. Earlier, he sold 5,000 BTC, valued at around $348.82 million.
He also withdrew 53.12 million USDT from exchanges. At the same time, he still holds more than 30,000 BTC, worth about $2.09 billion. Large transfers like this often make traders watch closely for possible market impact.
Will this ETH deposit create more selling pressure, or is it part of a larger portfolio adjustment?$ETH

Market Reset: Tom Lee Shares a New Buying Logic for Bitcoin and Ethereum
After sharp pullbacks in crypto, many investors focus on one question: Where is the bottom?
According to Tom Lee, that might be the wrong question. At the Hong Kong Consensus 2026 conference, he said investors should stop trying to perfectly predict market bottoms. Instead, he suggested looking for strong entry points when prices drop.
Key points:
- Don’t obsess over calling the exact bottom
- Look for good entry opportunities during corrections
- Focus on long-term value, not short-term fear
- Think about opportunity, not panic selling
Tom Lee emphasized that corrections are a normal part of every market cycle. Instead of reacting emotionally, investors should assess whether the long-term outlook for assets like Bitcoin and Ethereum has changed. If the fundamentals remain strong, pullbacks can offer better positioning.
His message was simple: markets reward patience and strategy more than emotional decisions.
After a crash, fear is high and confidence is low. But historically, strong recoveries often begin when sentiment is weakest.
The real shift in mindset is moving from “How bad can this get?” to “Where is the opportunity?”
After a big crypto drop, do you focus more on fear or on finding your next entry?
$BTC
After sharp pullbacks in crypto, many investors focus on one question: Where is the bottom?
According to Tom Lee, that might be the wrong question. At the Hong Kong Consensus 2026 conference, he said investors should stop trying to perfectly predict market bottoms. Instead, he suggested looking for strong entry points when prices drop.
Key points:
- Don’t obsess over calling the exact bottom
- Look for good entry opportunities during corrections
- Focus on long-term value, not short-term fear
- Think about opportunity, not panic selling
Tom Lee emphasized that corrections are a normal part of every market cycle. Instead of reacting emotionally, investors should assess whether the long-term outlook for assets like Bitcoin and Ethereum has changed. If the fundamentals remain strong, pullbacks can offer better positioning.
His message was simple: markets reward patience and strategy more than emotional decisions.
After a crash, fear is high and confidence is low. But historically, strong recoveries often begin when sentiment is weakest.
The real shift in mindset is moving from “How bad can this get?” to “Where is the opportunity?”
After a big crypto drop, do you focus more on fear or on finding your next entry?
$BTC

$BTC
Market Is Shaking Weak Hands, Structure Is Still in Control
Price is moving, and emotions are loud, but the chart is clear if you take a moment to look closely. Bitcoin didn’t just drop randomly. It followed a pattern, swept liquidity, and is now reacting just as it should. Most people see red candles. I’m focused on where the price must hold or fail.
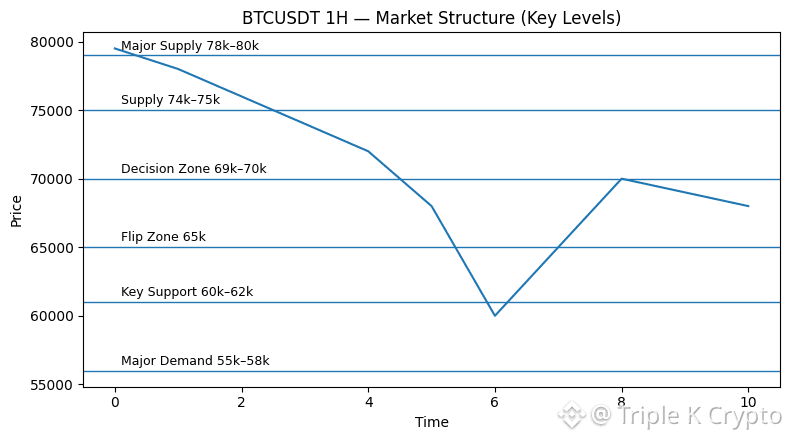
Current Market Structure (1H View)
Major Supply: 78k–80k
→ This is where distribution started. Smart money sold strength here.
Supply Zone: 74k–75k
→ There have been multiple rejections. Every push into this zone faced sellers.
Decision Zone: 69k–70k
→ This is the current battlefield. The market decides its trend direction here.
Flip Zone: ~65k
→ Previously resistance, now major reference support.
Liquidity Sweep: ~60k
→ Stops were taken. Fear peaked. Weak hands exited.
Major Demand: 60k–62k
→ Real buyers stepped in. This is not retail buying—this is defense of the structure.
The market did what it usually does: Run stops, create panic, and test real demand.
Bullish Scenario (Structure-Based, Not Hope-Based)
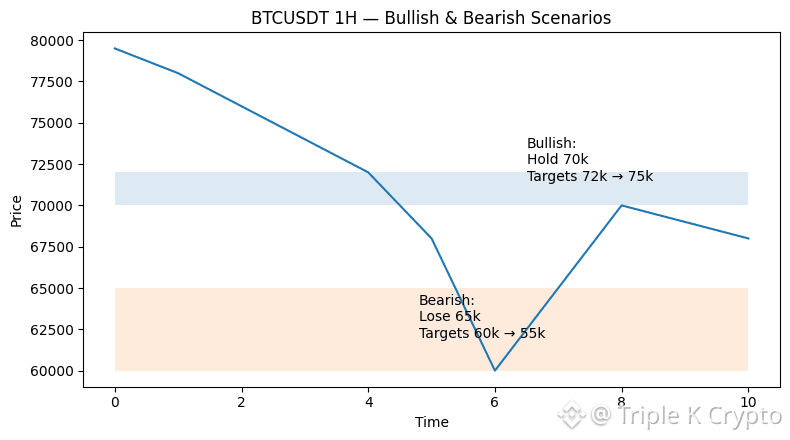
As long as BTC holds above 69k–70k, the structure stays positive.
Acceptance above 70k means stabilization.
Breaking and holding above 72k indicates momentum recovery.
Next upside target zones:
74k–75k
If that flips, 78k+ opens naturally.
This is not a FOMO zone.
This is a recovery structure—slow, controlled, and based on patience.
Bearish Scenario (Invalidation)
If BTC loses 65k with volume, the structure shifts again.
If it drops below 65k, momentum quickly weakens.
Next downside test:
62k
Failing there leads to a retest of 60k demand.
Below 60k, the market becomes fully defensive again.
No guessing—just reacting to levels.
My View
Retail traders react to candles.
Smart money reacts to levels.
I’m not predicting tops or bottoms.
I'm aware of where the price must hold to survive.
BTC has already punished emotional traders.
Now it’s testing patience.
#WhaleDeRiskETH
Market Is Shaking Weak Hands, Structure Is Still in Control
Price is moving, and emotions are loud, but the chart is clear if you take a moment to look closely. Bitcoin didn’t just drop randomly. It followed a pattern, swept liquidity, and is now reacting just as it should. Most people see red candles. I’m focused on where the price must hold or fail.
Current Market Structure (1H View)
Major Supply: 78k–80k
→ This is where distribution started. Smart money sold strength here.
Supply Zone: 74k–75k
→ There have been multiple rejections. Every push into this zone faced sellers.
Decision Zone: 69k–70k
→ This is the current battlefield. The market decides its trend direction here.
Flip Zone: ~65k
→ Previously resistance, now major reference support.
Liquidity Sweep: ~60k
→ Stops were taken. Fear peaked. Weak hands exited.
Major Demand: 60k–62k
→ Real buyers stepped in. This is not retail buying—this is defense of the structure.
The market did what it usually does: Run stops, create panic, and test real demand.
Bullish Scenario (Structure-Based, Not Hope-Based)
As long as BTC holds above 69k–70k, the structure stays positive.
Acceptance above 70k means stabilization.
Breaking and holding above 72k indicates momentum recovery.
Next upside target zones:
74k–75k
If that flips, 78k+ opens naturally.
This is not a FOMO zone.
This is a recovery structure—slow, controlled, and based on patience.
Bearish Scenario (Invalidation)
If BTC loses 65k with volume, the structure shifts again.
If it drops below 65k, momentum quickly weakens.
Next downside test:
62k
Failing there leads to a retest of 60k demand.
Below 60k, the market becomes fully defensive again.
No guessing—just reacting to levels.
My View
Retail traders react to candles.
Smart money reacts to levels.
I’m not predicting tops or bottoms.
I'm aware of where the price must hold to survive.
BTC has already punished emotional traders.
Now it’s testing patience.
#WhaleDeRiskETH
Janet Yellen says the U.S. is closely watching Hong Kong as it explores financial innovations based on digital assets.
The concern is that if Hong Kong creates a new digital asset framework, it could affect how assets like Bitcoin and gold are priced around the world in the long run.
So far, there’s no solid evidence, and the discussion remains at the policy and experimentation stage.
In the short term, markets are still moving mostly based on sentiment, not structure.
Is this just early-stage policy noise, or is it the first sign of a shift in global pricing power away from the dollar system?
$XAU
#RiskAssetsMarketShock
The concern is that if Hong Kong creates a new digital asset framework, it could affect how assets like Bitcoin and gold are priced around the world in the long run.
So far, there’s no solid evidence, and the discussion remains at the policy and experimentation stage.
In the short term, markets are still moving mostly based on sentiment, not structure.
Is this just early-stage policy noise, or is it the first sign of a shift in global pricing power away from the dollar system?
$XAU
#RiskAssetsMarketShock


TD Cowen analyst Lance Vitanza remains optimistic despite the volatility.
Even after a roughly 30% drop in Strategy stock, the belief is that the balance sheet is solid enough to handle any downside pressure.
The prediction is that Bitcoin might reach new highs by Q3 2026. Strategy continues to hold a "Buy" rating due to its cash reserves and manageable debt.
Is this just optimism after a significant pullback, or is it a realistic setup for Bitcoin’s next growth phase?
$BTC
Even after a roughly 30% drop in Strategy stock, the belief is that the balance sheet is solid enough to handle any downside pressure.
The prediction is that Bitcoin might reach new highs by Q3 2026. Strategy continues to hold a "Buy" rating due to its cash reserves and manageable debt.
Is this just optimism after a significant pullback, or is it a realistic setup for Bitcoin’s next growth phase?
$BTC


$SOL
This Level Decides the Next Big Move, SOL at a Critical Zone
SOL has already seen a sharp sell-off and is now in a high-impact area. The rapid drop has stopped. The market must now decide if it will stabilize or keep falling. This is no longer about speed; it's about control.
Market Structure Overview
- Clear sequence of lower highs and lower lows.
- Strong bearish trend confirmed.
- Previous support zones are completely broken.
- Price is now responding near historical demand.
Current Price Behavior
Panic selling drove SOL down to 67.
A sharp bounce indicates buyers are defending lower levels.
Momentum has slowed after the drop.
The market is entering a decision and absorption phase.
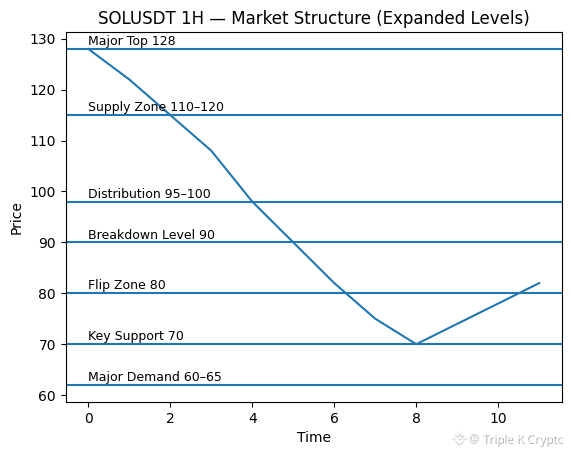
Key Levels to Watch
- Major Supply: 105-115
- Distribution Zone: 95-100
- Breakdown Level: 90
- Flip Zone: 80
- Key Support: 70
- Major Demand: 65-60
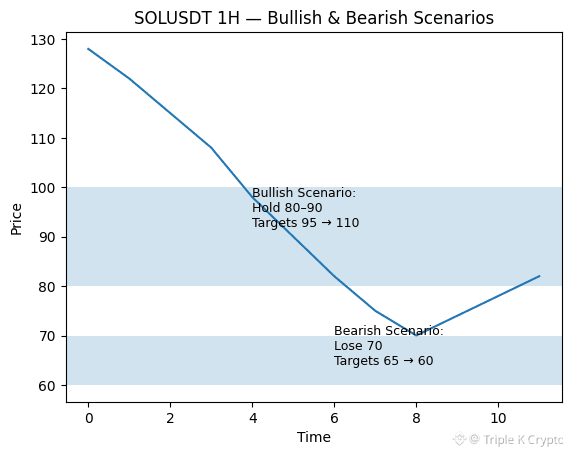
Bullish Scenario
Price stays between 75 and 80.
Reclaims 90 with acceptance.
Upside path:
- 95 → 100
- Extension toward 110.
This would be a relief bounce and a step toward improving the structure, but it wouldn’t mean a complete trend reversal yet.
Bearish Scenario
Price drops below 70 decisively.
Weak or failed bounce.
Downside targets:
- 65
- 60
This would confirm that bears still control the trend.
Final Take
SOL has already made its aggressive move. The market is now pausing to determine who will lead the next leg. This zone will indicate whether smart money is accumulating or if the price is preparing for another liquidity sweep. Will SOL defend this zone and rebuild its structure, or will the downtrend continue toward lower demand?
This Level Decides the Next Big Move, SOL at a Critical Zone
SOL has already seen a sharp sell-off and is now in a high-impact area. The rapid drop has stopped. The market must now decide if it will stabilize or keep falling. This is no longer about speed; it's about control.
Market Structure Overview
- Clear sequence of lower highs and lower lows.
- Strong bearish trend confirmed.
- Previous support zones are completely broken.
- Price is now responding near historical demand.
Current Price Behavior
Panic selling drove SOL down to 67.
A sharp bounce indicates buyers are defending lower levels.
Momentum has slowed after the drop.
The market is entering a decision and absorption phase.
Key Levels to Watch
- Major Supply: 105-115
- Distribution Zone: 95-100
- Breakdown Level: 90
- Flip Zone: 80
- Key Support: 70
- Major Demand: 65-60
Bullish Scenario
Price stays between 75 and 80.
Reclaims 90 with acceptance.
Upside path:
- 95 → 100
- Extension toward 110.
This would be a relief bounce and a step toward improving the structure, but it wouldn’t mean a complete trend reversal yet.
Bearish Scenario
Price drops below 70 decisively.
Weak or failed bounce.
Downside targets:
- 65
- 60
This would confirm that bears still control the trend.
Final Take
SOL has already made its aggressive move. The market is now pausing to determine who will lead the next leg. This zone will indicate whether smart money is accumulating or if the price is preparing for another liquidity sweep. Will SOL defend this zone and rebuild its structure, or will the downtrend continue toward lower demand?
$ETH Whale movement to watch
A wallet connected to Cyber.Fund co-founder Konstantin Lomashuk recently transferred a large amount of ETH.
About 12,458 stETH and 2,566 ETH were sent to Wintermute.
Transfers like this often attract attention because they can relate to liquidity, hedging, or possible selling, but it’s not always straightforward.
Sometimes, it’s simply about managing positions.
At other times, it indicates short-term market pressure.
Do you view this as normal fund activity or a warning sign for ETH in the near future?
A wallet connected to Cyber.Fund co-founder Konstantin Lomashuk recently transferred a large amount of ETH.
About 12,458 stETH and 2,566 ETH were sent to Wintermute.
Transfers like this often attract attention because they can relate to liquidity, hedging, or possible selling, but it’s not always straightforward.
Sometimes, it’s simply about managing positions.
At other times, it indicates short-term market pressure.
Do you view this as normal fund activity or a warning sign for ETH in the near future?

$ETH ETHUSDT 1H. This Level Decides the Next Big Move.
The market is not guessing anymore. ETH is at a decision point.
After a heavy sell-off, the price is now in an important reaction zone. From here, ETH can either build a base or open the door for another drop.
• Market Structure
Clear lower high, lower low sequence.
Strong bearish momentum already released.
Now trading near historical demand.
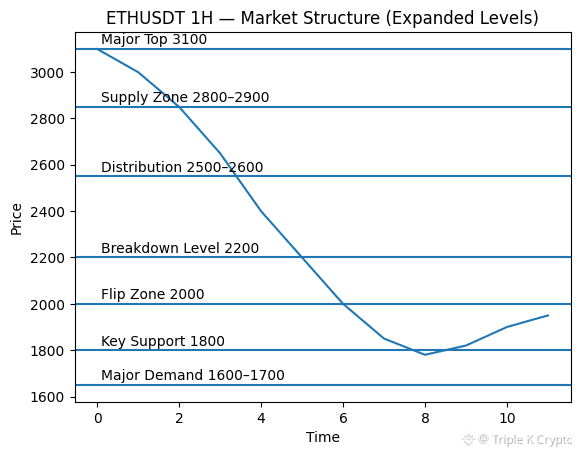
• Key Levels Mapped
Major Supply: 2600–2800
Distribution: 2300–2400
Breakdown Level: 2100–2200
Flip Zone: 2000
Key Support: 1800
Major Demand: 1700–1600
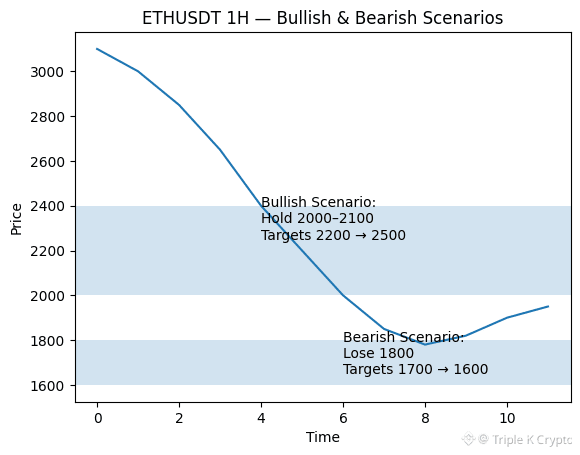
• Bullish Scenario
Hold 2000–2100.
Reclaim 2200.
Upside reaction toward 2400, then 2600.
This would be a relief and structure recovery move.
• Bearish Scenario
Lose 1800 with strong volume.
Next liquidity sits at 1700.
Deeper panic zone near 1600.
This confirms bears still control the trend.
Final Thought
ETH doesn’t need hype here; it needs confirmation. This zone will determine whether smart money is accumulating or distributing again. Which side do you think will win from here?
The market is not guessing anymore. ETH is at a decision point.
After a heavy sell-off, the price is now in an important reaction zone. From here, ETH can either build a base or open the door for another drop.
• Market Structure
Clear lower high, lower low sequence.
Strong bearish momentum already released.
Now trading near historical demand.
• Key Levels Mapped
Major Supply: 2600–2800
Distribution: 2300–2400
Breakdown Level: 2100–2200
Flip Zone: 2000
Key Support: 1800
Major Demand: 1700–1600
• Bullish Scenario
Hold 2000–2100.
Reclaim 2200.
Upside reaction toward 2400, then 2600.
This would be a relief and structure recovery move.
• Bearish Scenario
Lose 1800 with strong volume.
Next liquidity sits at 1700.
Deeper panic zone near 1600.
This confirms bears still control the trend.
Final Thought
ETH doesn’t need hype here; it needs confirmation. This zone will determine whether smart money is accumulating or distributing again. Which side do you think will win from here?
$BTC
BTCUSDT 1H - This Is Capitulation, Not Random Dump
Price looks bad.
Structure looks planned.
BTC just dropped into deep high-time-frame demand. RSI is low, and momentum indicators are extremely oversold. This is when weak hands sell and strong money begins to watch closely.
This is not the time to panic.
This is the time to read levels.
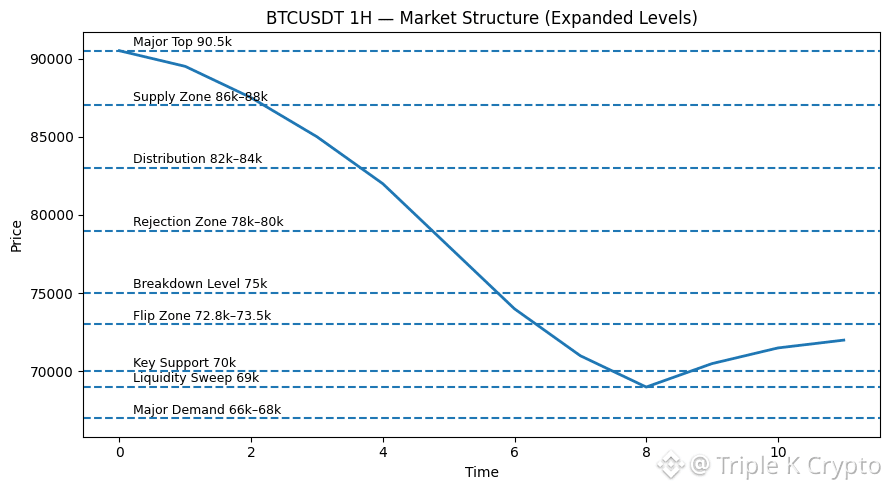
What Just Happened (Structure Read)
Major Distribution: 84k–90k (completed)
Acceleration Breakdown: 75k, free fall
Liquidity Sweep: 62.2k (clean stop-hunt)
Current Price: ~63k (reaction zone)
This move forced out late longs and leveraged positions in one go.
Key Levels That Matter Now
Immediate Demand: 62k–64k (active)
Key Support: 60k–61k (last line before panic)
Flip Zone: 66k–68k (must reclaim)
Major Resistance: 72k–75k
Everything below 64k is driven by fear, not value.
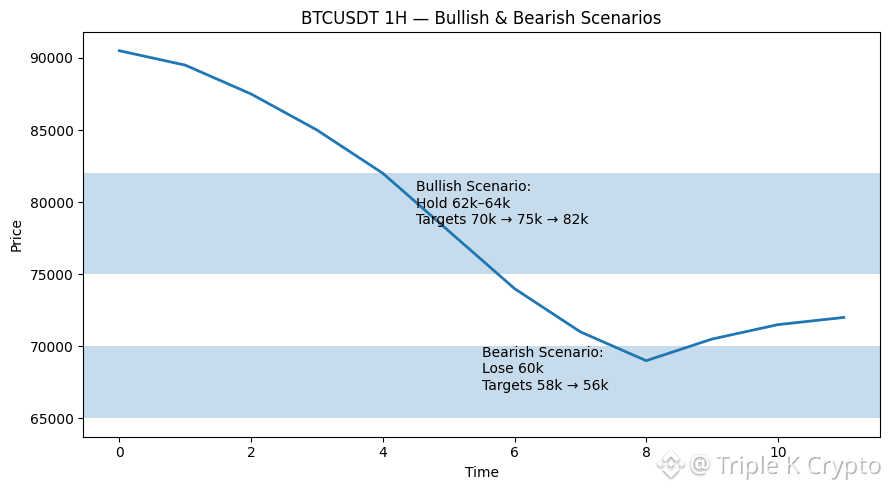
Bullish Recovery Scenario
Hold 62k–64k
Base formation plus absorption
Reclaim 66k
Next targets: 70k, 75k
This would confirm that the drop was a liquidity event, not a trend reversal.
Bearish Continuation Scenario
Lose 60k with acceptance
Next magnet: 56k–58k
That would confirm damage to the macro structure.
No guessing, only confirmation.
My Take
Markets don’t crash when everyone is calm.
They crash when retail is already tired.
This zone will decide if BTC bounces hard or dips once more before the real move.
Do you think this was the final liquidity sweep, or is the market still looking for one more low?
BTCUSDT 1H - This Is Capitulation, Not Random Dump
Price looks bad.
Structure looks planned.
BTC just dropped into deep high-time-frame demand. RSI is low, and momentum indicators are extremely oversold. This is when weak hands sell and strong money begins to watch closely.
This is not the time to panic.
This is the time to read levels.
What Just Happened (Structure Read)
Major Distribution: 84k–90k (completed)
Acceleration Breakdown: 75k, free fall
Liquidity Sweep: 62.2k (clean stop-hunt)
Current Price: ~63k (reaction zone)
This move forced out late longs and leveraged positions in one go.
Key Levels That Matter Now
Immediate Demand: 62k–64k (active)
Key Support: 60k–61k (last line before panic)
Flip Zone: 66k–68k (must reclaim)
Major Resistance: 72k–75k
Everything below 64k is driven by fear, not value.
Bullish Recovery Scenario
Hold 62k–64k
Base formation plus absorption
Reclaim 66k
Next targets: 70k, 75k
This would confirm that the drop was a liquidity event, not a trend reversal.
Bearish Continuation Scenario
Lose 60k with acceptance
Next magnet: 56k–58k
That would confirm damage to the macro structure.
No guessing, only confirmation.
My Take
Markets don’t crash when everyone is calm.
They crash when retail is already tired.
This zone will decide if BTC bounces hard or dips once more before the real move.
Do you think this was the final liquidity sweep, or is the market still looking for one more low?
Log in to explore more content