
Global_Crypto_Research
2.6k Posts

Global_Crypto_Research
Report
Block User
🌍 GlobalCryptoResearch | Daily Crypto Analysis | Spot & Futures Trade Setups | Technical Analysis | Market Insights | Risk Management | DYOR
147 Following
260 Followers
1.2K+ Liked
Posts
All
Quotes
Videos
Live
Short $ARK
{future}(ARKUSDT)
entry is 0.16145
Tp is 0.16032
Tp 0.15903
Dyor.....i am done...
Short $ARK
entry is 0.16145
Tp is 0.16032
Tp 0.15903
Dyor.....i am done...
entry is 0.16145
Tp is 0.16032
Tp 0.15903
Dyor.....i am done...
3
Alhamdolillah all tp hitted 🤣$COAI
{future}(COAIUSDT)
Alhamdolillah all tp hitted 🤣$COAI
Global_Crypto_Research
·
--
Short $COAI
Entry 👉 0.2435
Tp👉 0.24180
Tp👉 $0.23985
Entry 👉 0.2435
Tp👉 0.24180
Tp👉 $0.23985
3
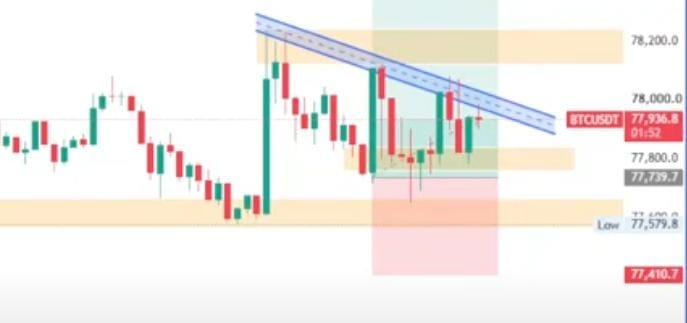
Break the trendline $BTC
{future}(BTCUSDT)
I know you are long 😏😜😜😜😜😜😜 just do it.
Break the trendline $BTC
I know you are long 😏😜😜😜😜😜😜 just do it.
I know you are long 😏😜😜😜😜😜😜 just do it.
4
🔥 $SOL
{future}(SOLUSDT)
/USDT Is Holding Near Support — Can Bulls Push Toward $95.89? 👀
LONG 📈
Enter Between: 93.80 – 94.20 Take Your Money At: 95.50
💡 Pro Tip: $93.69 is the key support. RSI is near neutral, so wait for buyers to confirm a bounce. A breakdown below support could weaken the bullish setup. Avoid chasing near $95.89 resistance.
DYOR
🔥 $SOL
/USDT Is Holding Near Support — Can Bulls Push Toward $95.89? 👀
LONG 📈
Enter Between: 93.80 – 94.20 Take Your Money At: 95.50
💡 Pro Tip: $93.69 is the key support. RSI is near neutral, so wait for buyers to confirm a bounce. A breakdown below support could weaken the bullish setup. Avoid chasing near $95.89 resistance.
DYOR
/USDT Is Holding Near Support — Can Bulls Push Toward $95.89? 👀
LONG 📈
Enter Between: 93.80 – 94.20 Take Your Money At: 95.50
💡 Pro Tip: $93.69 is the key support. RSI is near neutral, so wait for buyers to confirm a bounce. A breakdown below support could weaken the bullish setup. Avoid chasing near $95.89 resistance.
DYOR
6
🔥 $LYN
{future}(LYNUSDT)
/USDT Is Up 34% Can Buyers Break $0.02086? 🚀
LONG 📈
Enter Between: 0.01930 – 0.01970 Take Your Money At: 0.02080
💡 Pro Tip: RSI is near 53, showing balanced momentum. Watch 0.01820 as key support and 0.02086 as resistance. A confirmed breakout with strong volume could extend the move, but avoid chasing the recent pump.
DYOR
🔥 $LYN
/USDT Is Up 34% Can Buyers Break $0.02086? 🚀
LONG 📈
Enter Between: 0.01930 – 0.01970 Take Your Money At: 0.02080
💡 Pro Tip: RSI is near 53, showing balanced momentum. Watch 0.01820 as key support and 0.02086 as resistance. A confirmed breakout with strong volume could extend the move, but avoid chasing the recent pump.
DYOR
/USDT Is Up 34% Can Buyers Break $0.02086? 🚀
LONG 📈
Enter Between: 0.01930 – 0.01970 Take Your Money At: 0.02080
💡 Pro Tip: RSI is near 53, showing balanced momentum. Watch 0.01820 as key support and 0.02086 as resistance. A confirmed breakout with strong volume could extend the move, but avoid chasing the recent pump.
DYOR
5
🔥 BTC/USDT Is Testing $77,600 Support..Is a Short-Term Bounce Coming? 👀
LONG 📈
Enter Between: 77,650 – 77,850 Take Your Money At: 78,300
💡 Pro Tip: RSI(6) near 33 shows selling pressure is elevated. Watch $77,600 closely for a confirmed bounce. If BTC breaks below this support, avoid the long setup and wait for a new signal.
DYOR
$BTC
{future}(BTCUSDT)
🔥 BTC/USDT Is Testing $77,600 Support..Is a Short-Term Bounce Coming? 👀
LONG 📈
Enter Between: 77,650 – 77,850 Take Your Money At: 78,300
💡 Pro Tip: RSI(6) near 33 shows selling pressure is elevated. Watch $77,600 closely for a confirmed bounce. If BTC breaks below this support, avoid the long setup and wait for a new signal.
DYOR
$BTC
LONG 📈
Enter Between: 77,650 – 77,850 Take Your Money At: 78,300
💡 Pro Tip: RSI(6) near 33 shows selling pressure is elevated. Watch $77,600 closely for a confirmed bounce. If BTC breaks below this support, avoid the long setup and wait for a new signal.
DYOR
$BTC
6
🔥 $DOS
{future}(DOSUSDT)
/USDT Tests Key Support — Can Buyers Prevent Another Drop?
$DOS is trading near $0.1984, down 5.70% in 24 hours. Sellers remain in control on the 1-hour chart, with price making lower highs and gradually moving toward the $0.1966 support. This is a critical area for buyers to defend. 📊
If buyers hold $0.1966, a relief bounce toward $0.2007 could develop. However, a recovery above $0.2037 would provide stronger bullish confirmation. A clear breakdown below support could open the door to further downside. 🤝💎
RSI(6) is around 38.2, RSI(12) near 41.0, and RSI(24) around 44.2, showing weak momentum. The market is under selling pressure, but RSI has not reached deeply oversold territory. Watch for a confirmed bounce from support or a breakdown below it before anticipating the next move. Avoid entering blindly near support. 🚀
🔥 $DOS
/USDT Tests Key Support — Can Buyers Prevent Another Drop?
$DOS is trading near $0.1984, down 5.70% in 24 hours. Sellers remain in control on the 1-hour chart, with price making lower highs and gradually moving toward the $0.1966 support. This is a critical area for buyers to defend. 📊
If buyers hold $0.1966, a relief bounce toward $0.2007 could develop. However, a recovery above $0.2037 would provide stronger bullish confirmation. A clear breakdown below support could open the door to further downside. 🤝💎
RSI(6) is around 38.2, RSI(12) near 41.0, and RSI(24) around 44.2, showing weak momentum. The market is under selling pressure, but RSI has not reached deeply oversold territory. Watch for a confirmed bounce from support or a breakdown below it before anticipating the next move. Avoid entering blindly near support. 🚀
/USDT Tests Key Support — Can Buyers Prevent Another Drop?
$DOS is trading near $0.1984, down 5.70% in 24 hours. Sellers remain in control on the 1-hour chart, with price making lower highs and gradually moving toward the $0.1966 support. This is a critical area for buyers to defend. 📊
If buyers hold $0.1966, a relief bounce toward $0.2007 could develop. However, a recovery above $0.2037 would provide stronger bullish confirmation. A clear breakdown below support could open the door to further downside. 🤝💎
RSI(6) is around 38.2, RSI(12) near 41.0, and RSI(24) around 44.2, showing weak momentum. The market is under selling pressure, but RSI has not reached deeply oversold territory. Watch for a confirmed bounce from support or a breakdown below it before anticipating the next move. Avoid entering blindly near support. 🚀
50
🔥 $CT
{future}(CTUSDT)
/USDT Drops Over 12% Can Buyers Defend the $0.12815 Support?
$CT is trading near $0.12988, down 12.30% in 24 hours. Sellers have maintained strong pressure, pushing price into the $0.12815 support zone after a series of lower highs and lower lows on the 1-hour chart. 📊
If buyers defend $0.12815, a short-term relief bounce toward $0.13470 could develop. However, a recovery above $0.14359 would provide stronger bullish confirmation. A breakdown below support could open the way for further downside. 🤝💎
RSI(6) is around 28.8, RSI(12) near 28.8, and RSI(24) around 36.6, showing oversold short-term conditions. A bounce is possible, but oversold RSI alone does not confirm a reversal. Watch for a strong bullish candle and follow-through buying before expecting a recovery. Avoid catching a falling market without confirmation. 🚀
🔥 $CT
/USDT Drops Over 12% Can Buyers Defend the $0.12815 Support?
$CT is trading near $0.12988, down 12.30% in 24 hours. Sellers have maintained strong pressure, pushing price into the $0.12815 support zone after a series of lower highs and lower lows on the 1-hour chart. 📊
If buyers defend $0.12815, a short-term relief bounce toward $0.13470 could develop. However, a recovery above $0.14359 would provide stronger bullish confirmation. A breakdown below support could open the way for further downside. 🤝💎
RSI(6) is around 28.8, RSI(12) near 28.8, and RSI(24) around 36.6, showing oversold short-term conditions. A bounce is possible, but oversold RSI alone does not confirm a reversal. Watch for a strong bullish candle and follow-through buying before expecting a recovery. Avoid catching a falling market without confirmation. 🚀
/USDT Drops Over 12% Can Buyers Defend the $0.12815 Support?
$CT is trading near $0.12988, down 12.30% in 24 hours. Sellers have maintained strong pressure, pushing price into the $0.12815 support zone after a series of lower highs and lower lows on the 1-hour chart. 📊
If buyers defend $0.12815, a short-term relief bounce toward $0.13470 could develop. However, a recovery above $0.14359 would provide stronger bullish confirmation. A breakdown below support could open the way for further downside. 🤝💎
RSI(6) is around 28.8, RSI(12) near 28.8, and RSI(24) around 36.6, showing oversold short-term conditions. A bounce is possible, but oversold RSI alone does not confirm a reversal. Watch for a strong bullish candle and follow-through buying before expecting a recovery. Avoid catching a falling market without confirmation. 🚀
52
Tp one hitted alhamdolillah $COAI
{future}(COAIUSDT)
Tp one hitted alhamdolillah $COAI
Global_Crypto_Research
·
--
Short $COAI
Entry 👉 0.2435
Tp👉 0.24180
Tp👉 $0.23985
Entry 👉 0.2435
Tp👉 0.24180
Tp👉 $0.23985
1
116
Short $COAI
{future}(COAIUSDT)
Entry 👉 0.2435
Tp👉 0.24180
Tp👉 $0.23985
Short $COAI
Entry 👉 0.2435
Tp👉 0.24180
Tp👉 $0.23985
Entry 👉 0.2435
Tp👉 0.24180
Tp👉 $0.23985
2
11
Coin $EVAA
{future}(EVAAUSDT)
/USDT
Position: LONG
Leverage: Cross 20×
Entries: 1.40 - 1.35
Targets: 🎯 1.46, 1.54, 1.66
Stop Loss: 1.30. Below
Coin $EVAA
/USDT
Position: LONG
Leverage: Cross 20×
Entries: 1.40 - 1.35
Targets: 🎯 1.46, 1.54, 1.66
Stop Loss: 1.30. Below
/USDT
Position: LONG
Leverage: Cross 20×
Entries: 1.40 - 1.35
Targets: 🎯 1.46, 1.54, 1.66
Stop Loss: 1.30. Below
59
$SOPH
{future}(SOPHUSDT)
🔥 SOPH/USDT Gains Over 16% — Can Buyers Recover After Rejection Near $0.001808?
$SOPH is trading near $0.001594, up 16.10% in 24 hours. After a strong upward move, price faced rejection near the $0.001808 resistance and pulled back. Buyers are now trying to stabilize around the current level. 📊
A recovery above $0.001742 could bring the $0.001808 resistance back into focus. If selling pressure continues, the $0.001459 area is worth monitoring, followed by support near $0.001433. 🤝💎
RSI(6) is around 43.0, while RSI(12) and RSI(24) are near 51.8 and 51.6. This suggests short-term momentum has cooled after the rally, while the broader readings remain near neutral. Watch whether buyers can reclaim nearby resistance or whether price loses support. A confirmed candle close is more reliable than chasing a quick bounce. 🚀
#BinanceRestores28FiatWithdrawals
$SOPH
🔥 SOPH/USDT Gains Over 16% — Can Buyers Recover After Rejection Near $0.001808?
$SOPH is trading near $0.001594, up 16.10% in 24 hours. After a strong upward move, price faced rejection near the $0.001808 resistance and pulled back. Buyers are now trying to stabilize around the current level. 📊
A recovery above $0.001742 could bring the $0.001808 resistance back into focus. If selling pressure continues, the $0.001459 area is worth monitoring, followed by support near $0.001433. 🤝💎
RSI(6) is around 43.0, while RSI(12) and RSI(24) are near 51.8 and 51.6. This suggests short-term momentum has cooled after the rally, while the broader readings remain near neutral. Watch whether buyers can reclaim nearby resistance or whether price loses support. A confirmed candle close is more reliable than chasing a quick bounce. 🚀
#BinanceRestores28FiatWithdrawals
🔥 SOPH/USDT Gains Over 16% — Can Buyers Recover After Rejection Near $0.001808?
$SOPH is trading near $0.001594, up 16.10% in 24 hours. After a strong upward move, price faced rejection near the $0.001808 resistance and pulled back. Buyers are now trying to stabilize around the current level. 📊
A recovery above $0.001742 could bring the $0.001808 resistance back into focus. If selling pressure continues, the $0.001459 area is worth monitoring, followed by support near $0.001433. 🤝💎
RSI(6) is around 43.0, while RSI(12) and RSI(24) are near 51.8 and 51.6. This suggests short-term momentum has cooled after the rally, while the broader readings remain near neutral. Watch whether buyers can reclaim nearby resistance or whether price loses support. A confirmed candle close is more reliable than chasing a quick bounce. 🚀
#BinanceRestores28FiatWithdrawals
61
Short $CP now tp is 0.00783 second is 0.00777
Sl 0.00828
Short $CP now tp is 0.00783 second is 0.00777
Sl 0.00828
Sl 0.00828
9
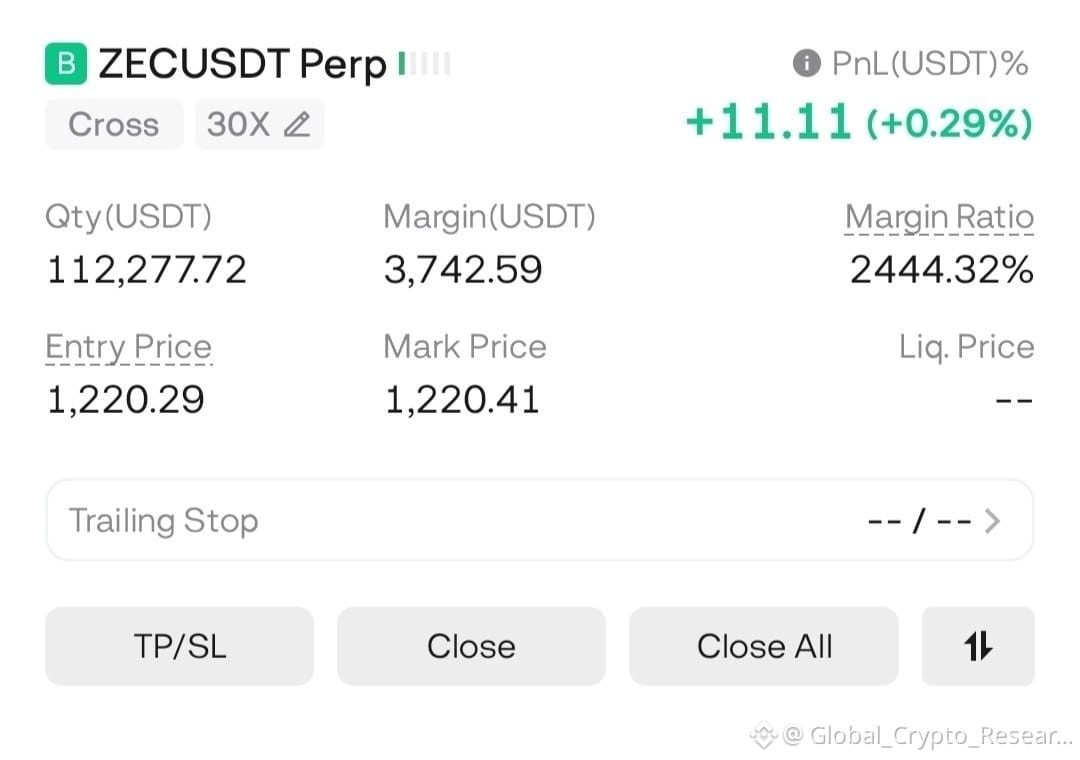
🟢 LONG $ZEC
{future}(ZECUSDT)
✅ Entry: now
🎯 TP: 1250 - 1280 - 1320 - 2350
🛑 SL: 1160 below...
🟢 LONG $ZEC
✅ Entry: now
🎯 TP: 1250 - 1280 - 1320 - 2350
🛑 SL: 1160 below...
✅ Entry: now
🎯 TP: 1250 - 1280 - 1320 - 2350
🛑 SL: 1160 below...
15
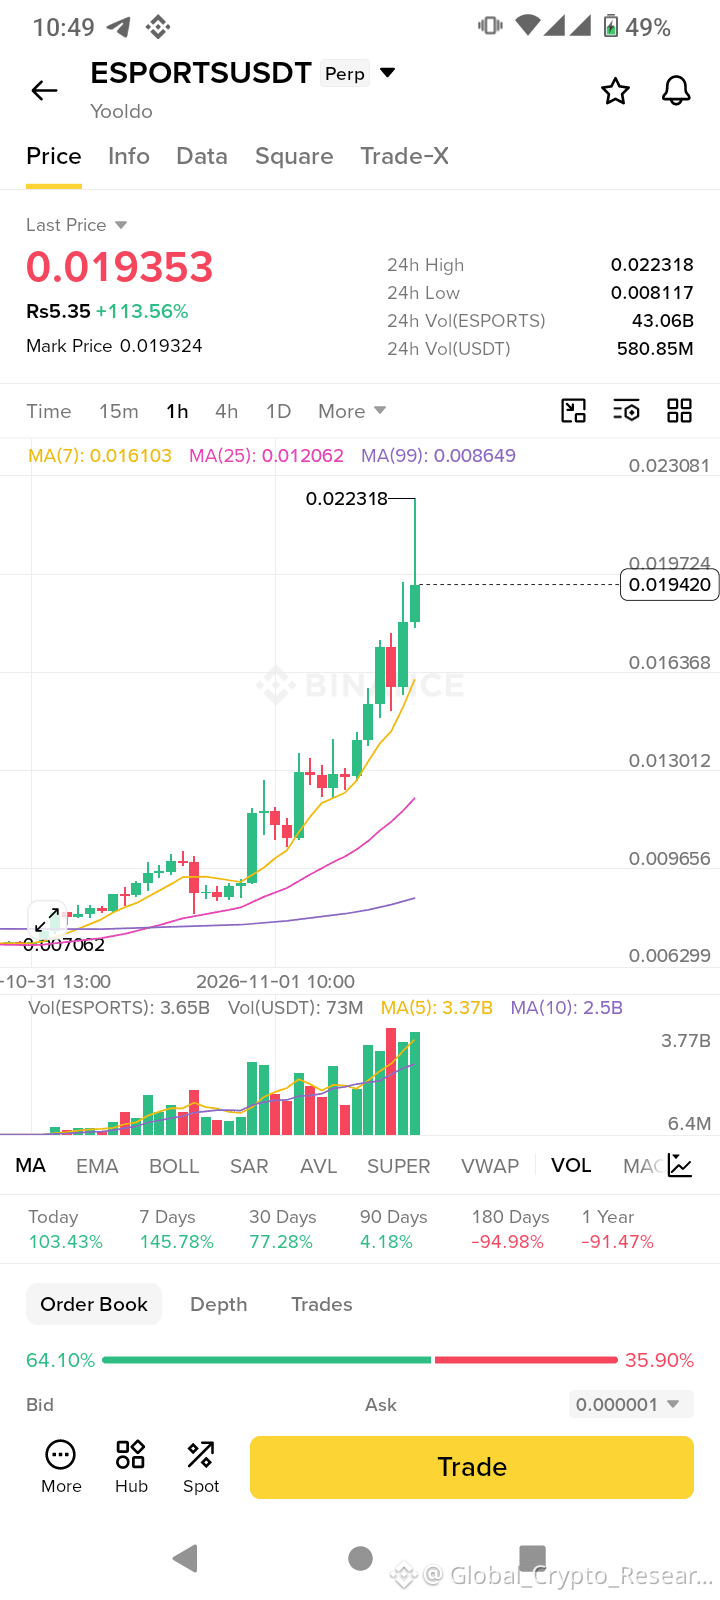
As i mentioned 😉 $ESPORTS
{future}(ESPORTSUSDT)
Not bala bala bala just proof. Plz follow me. For updated
As i mentioned 😉 $ESPORTS
Not bala bala bala just proof. Plz follow me. For updated
Not bala bala bala just proof. Plz follow me. For updated
Global_Crypto_Research
·
--
#ESPORTS $ESPORTS
👉 is showing strong bullish momentum after a long consolidation phase. Price is testing a major resistance zone around $0.016–$0.018 📊
A strong daily candle close above this zone could confirm a bullish breakout and open the door for a potential rally.🐂
🎯 Upside Target: $0.040 – $0.065
📈 Potential Gain: Around 250%
🔥 Key Level: $0.018 resistance#BinanceUpdatesProofofReservesAddresses
👉 is showing strong bullish momentum after a long consolidation phase. Price is testing a major resistance zone around $0.016–$0.018 📊
A strong daily candle close above this zone could confirm a bullish breakout and open the door for a potential rally.🐂
🎯 Upside Target: $0.040 – $0.065
📈 Potential Gain: Around 250%
🔥 Key Level: $0.018 resistance#BinanceUpdatesProofofReservesAddresses
340
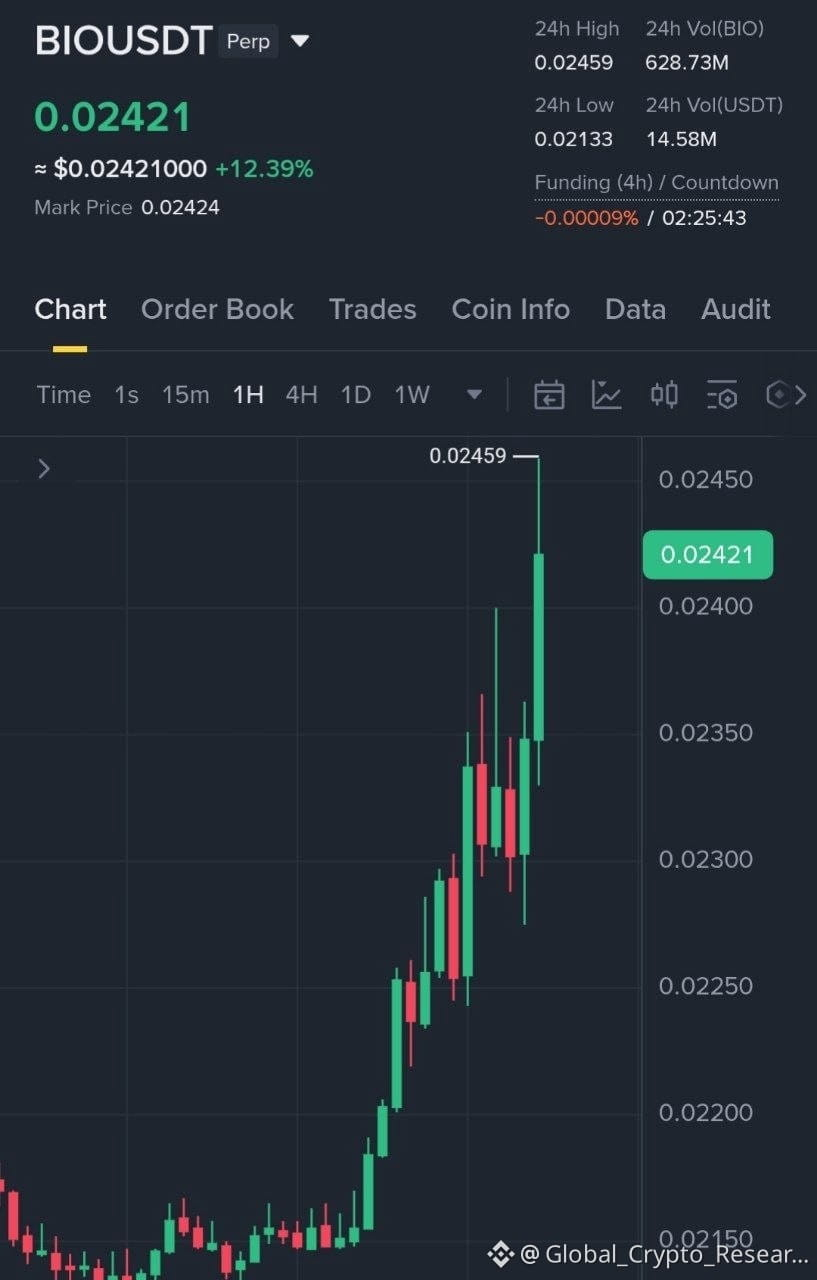
Congratulations fam... Thank you so much $BIO
{future}(BIOUSDT)
Congratulations fam... Thank you so much $BIO
Global_Crypto_Research
·
--
$BIO me long jana chahye 🤌🫢
111
$BOME welcone to my world. 😏
{future}(BOMEUSDT)
$BOME welcone to my world. 😏
Global_Crypto_Research
·
--
Maine $BOME
Ko short kia hy. Mera tp jo rahe ga wo 0.00060 hy... Plz apna account mange kren agar ap trade lene ka soch rahe hain..... Dyor
Ko short kia hy. Mera tp jo rahe ga wo 0.00060 hy... Plz apna account mange kren agar ap trade lene ka soch rahe hain..... Dyor
212
$LYN
{future}(LYNUSDT)
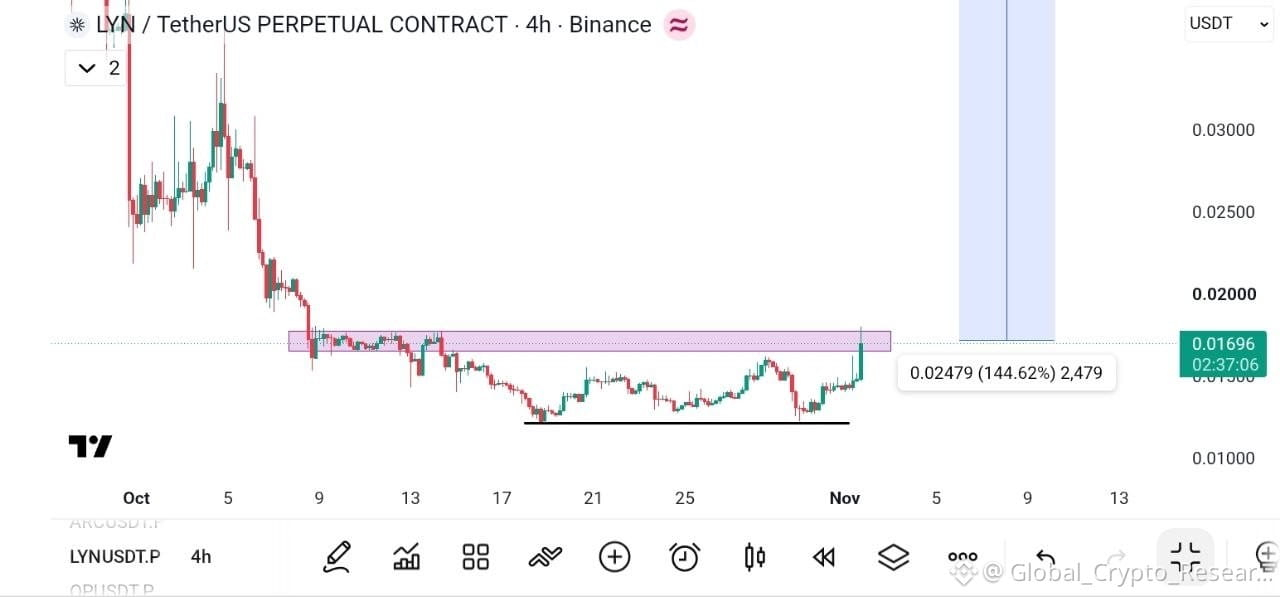
#is showing strong bullish momentum on the 4H timeframe! 🔥 Price is pushing through a major resistance zone after a long consolidation phase.🕘
🎯 Potential Targets: 0.0420+
📊 Key Resistance: 0.0175–0.0180
📈 Expected Move: +144%#BinanceUpdatesProofofReservesAddresses
$LYN
#is showing strong bullish momentum on the 4H timeframe! 🔥 Price is pushing through a major resistance zone after a long consolidation phase.🕘
🎯 Potential Targets: 0.0420+
📊 Key Resistance: 0.0175–0.0180
📈 Expected Move: +144%#BinanceUpdatesProofofReservesAddresses
#is showing strong bullish momentum on the 4H timeframe! 🔥 Price is pushing through a major resistance zone after a long consolidation phase.🕘
🎯 Potential Targets: 0.0420+
📊 Key Resistance: 0.0175–0.0180
📈 Expected Move: +144%#BinanceUpdatesProofofReservesAddresses
8
#ESPORTS $ESPORTS
{future}(ESPORTSUSDT)
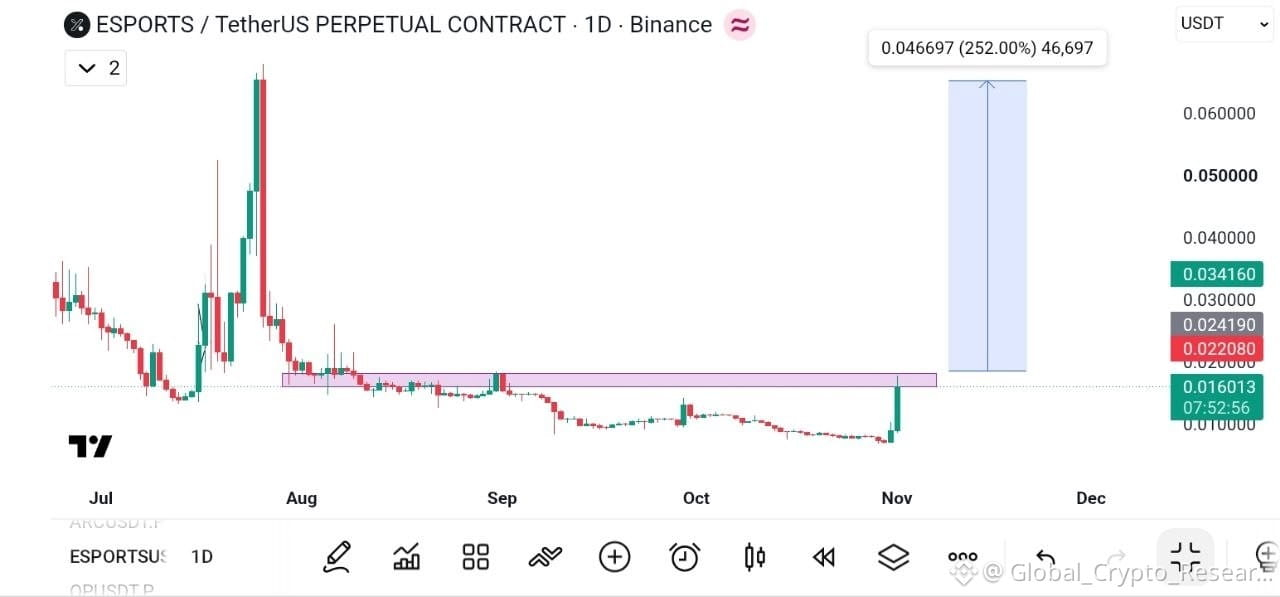
👉 is showing strong bullish momentum after a long consolidation phase. Price is testing a major resistance zone around $0.016–$0.018 📊
A strong daily candle close above this zone could confirm a bullish breakout and open the door for a potential rally.🐂
🎯 Upside Target: $0.040 – $0.065
📈 Potential Gain: Around 250%
🔥 Key Level: $0.018 resistance#BinanceUpdatesProofofReservesAddresses
#ESPORTS $ESPORTS
👉 is showing strong bullish momentum after a long consolidation phase. Price is testing a major resistance zone around $0.016–$0.018 📊
A strong daily candle close above this zone could confirm a bullish breakout and open the door for a potential rally.🐂
🎯 Upside Target: $0.040 – $0.065
📈 Potential Gain: Around 250%
🔥 Key Level: $0.018 resistance#BinanceUpdatesProofofReservesAddresses
👉 is showing strong bullish momentum after a long consolidation phase. Price is testing a major resistance zone around $0.016–$0.018 📊
A strong daily candle close above this zone could confirm a bullish breakout and open the door for a potential rally.🐂
🎯 Upside Target: $0.040 – $0.065
📈 Potential Gain: Around 250%
🔥 Key Level: $0.018 resistance#BinanceUpdatesProofofReservesAddresses
1
4
Log in to explore more content
Join global crypto users on Binance Square
⚡️ Get latest and useful information about crypto.
💬 Trusted by the world’s largest crypto exchange.
👍 Discover real insights from verified creators.
Email / Phone number
Trending Topics
BinanceReopensWithdrawalsForMoreAssets
953,393 views
4,892 Discussing
Security Incident | Recovery Update #8: Withdrawals for More Assets to Reopen (2026-11-05)
Binance Announcement
·447 Likes
·2.1M views
USStocksSlipandCryptoMarketUnderBroadPressure
40,927 views
364 Discussing
StrategySTRCResumesIssuanceAfterOver170Days
34,604 views
489 Discussing