
Wiсk
475 Posts

Wiсk
Report
Block User
Market Structure • Liquidity • Cycles, Crypto trader & analyst since 2019
Frequent Trader
5.3 Years
7 Following
157 Followers
531 Liked
Posts
All
Quotes
·
--
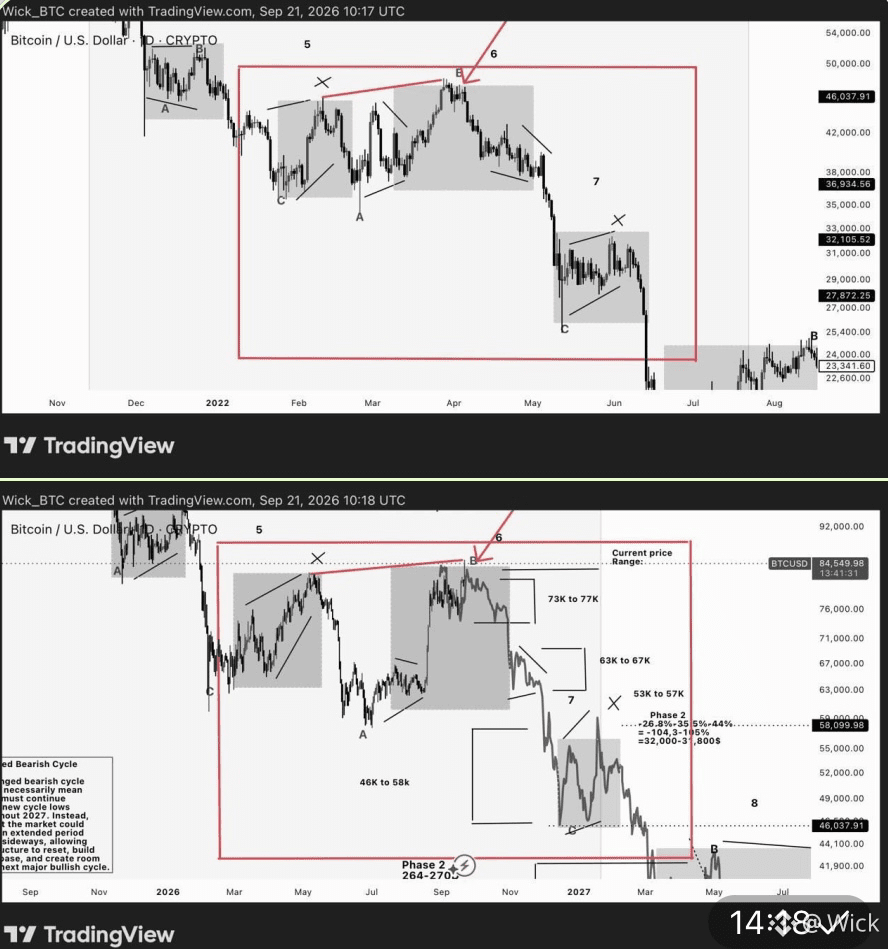
$BTC follow structure:
A slight sweep above the previous high could be potential confirmation that the current structure is rhythmically aligning with the 2022 structure.
Price is now at a similar point in the structure where, in 2022, Bitcoin entered the final breakdown and eventually crashed roughly 67% from that level.
I’m currently expecting a roughly 62–63% decline from the corresponding level in the 2026 structure.
$BTC follow structure:
A slight sweep above the previous high could be potential confirmation that the current structure is rhythmically aligning with the 2022 structure.
Price is now at a similar point in the structure where, in 2022, Bitcoin entered the final breakdown and eventually crashed roughly 67% from that level.
I’m currently expecting a roughly 62–63% decline from the corresponding level in the 2026 structure.
A slight sweep above the previous high could be potential confirmation that the current structure is rhythmically aligning with the 2022 structure.
Price is now at a similar point in the structure where, in 2022, Bitcoin entered the final breakdown and eventually crashed roughly 67% from that level.
I’m currently expecting a roughly 62–63% decline from the corresponding level in the 2026 structure.
1
1
1.3k
·
--
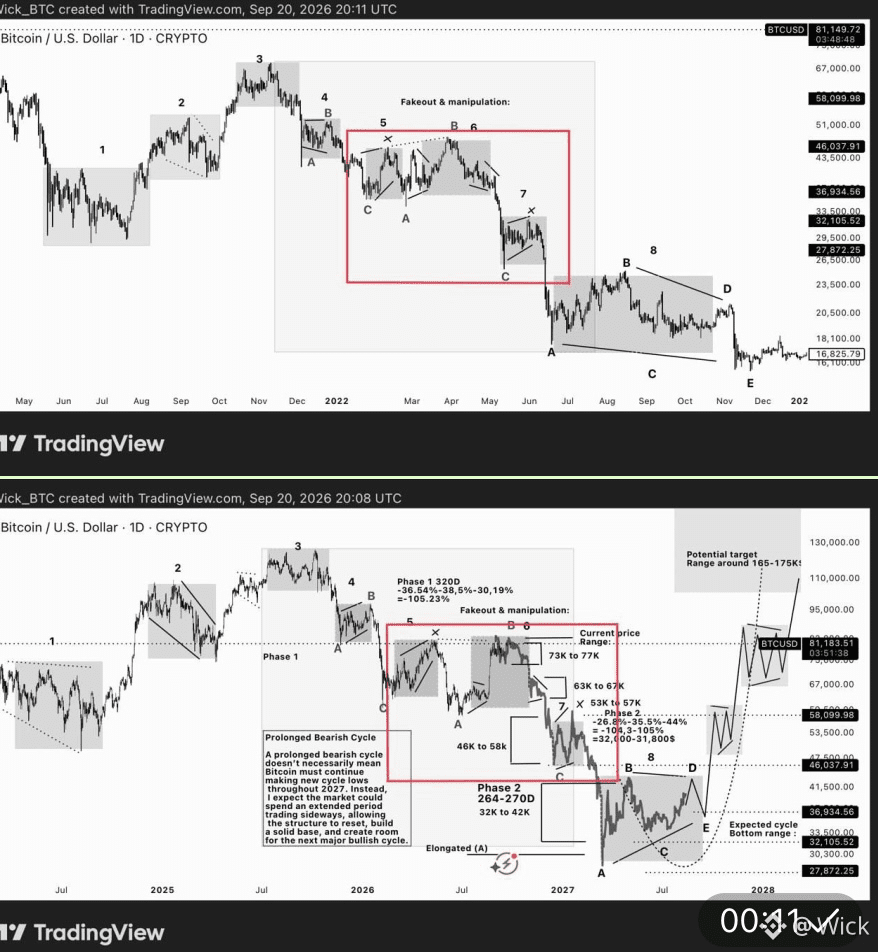
$BTC
Don’t let the green candles distract you.
Your focus should now be on the red box I’ve highlighted on the chart. This structure is the key to understanding where Bitcoin currently sits within the larger cycle — and, more importantly, what we should expect next.
The short-term price action can be misleading, but when you step back and compare the current structure with the historical cycles , the bigger picture becomes much clearer.
Keep your focus on the structure, not the green candles.
$BTC
Don’t let the green candles distract you.
Your focus should now be on the red box I’ve highlighted on the chart. This structure is the key to understanding where Bitcoin currently sits within the larger cycle — and, more importantly, what we should expect next.
The short-term price action can be misleading, but when you step back and compare the current structure with the historical cycles , the bigger picture becomes much clearer.
Keep your focus on the structure, not the green candles.
Don’t let the green candles distract you.
Your focus should now be on the red box I’ve highlighted on the chart. This structure is the key to understanding where Bitcoin currently sits within the larger cycle — and, more importantly, what we should expect next.
The short-term price action can be misleading, but when you step back and compare the current structure with the historical cycles , the bigger picture becomes much clearer.
Keep your focus on the structure, not the green candles.
128
·
--
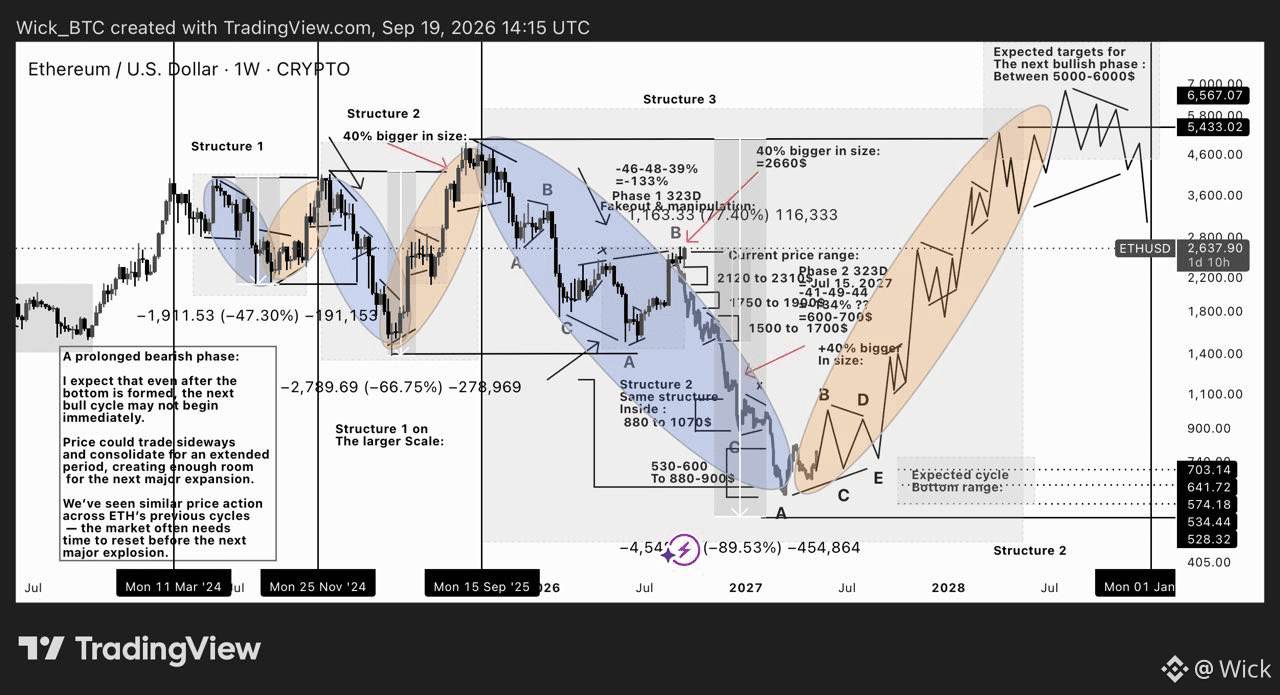
$ETH : Structure 1 → Structure 2 → Structure 3
If you look closely at ETH’s historical price action, you can see the same structure repeating on progressively larger scales.
Structure 1 → Structure 2 → Structure 3
Each new structure is larger than the previous one:
Structure 2 is larger than Structure 1
Structure 3 is larger than Structure 2
And at this point, price has already entered Structure 3 — the largest structure in this sequence.
This also provides another explanation for why the current bearish phase is developing more like the prolonged 2013–2015 bear market rather than a typical one-year cycle.
The current Structure 3 is simply too large to fully develop and complete within a standard one-year bearish cycle. The market therefore needs a much longer period to develop the entire structure and complete all of its phases.
In other words, the prolonged bearish phase isn’t necessarily something random or unexpected. The structure itself requires more time.
What we are seeing today may simply be the next stage of a structure that has been developing for years.
$ETH : Structure 1 → Structure 2 → Structure 3
If you look closely at ETH’s historical price action, you can see the same structure repeating on progressively larger scales.
Structure 1 → Structure 2 → Structure 3
Each new structure is larger than the previous one:
Structure 2 is larger than Structure 1
Structure 3 is larger than Structure 2
And at this point, price has already entered Structure 3 — the largest structure in this sequence.
This also provides another explanation for why the current bearish phase is developing more like the prolonged 2013–2015 bear market rather than a typical one-year cycle.
The current Structure 3 is simply too large to fully develop and complete within a standard one-year bearish cycle. The market therefore needs a much longer period to develop the entire structure and complete all of its phases.
In other words, the prolonged bearish phase isn’t necessarily something random or unexpected. The structure itself requires more time.
What we are seeing today may simply be the next stage of a structure that has been developing for years.
If you look closely at ETH’s historical price action, you can see the same structure repeating on progressively larger scales.
Structure 1 → Structure 2 → Structure 3
Each new structure is larger than the previous one:
Structure 2 is larger than Structure 1
Structure 3 is larger than Structure 2
And at this point, price has already entered Structure 3 — the largest structure in this sequence.
This also provides another explanation for why the current bearish phase is developing more like the prolonged 2013–2015 bear market rather than a typical one-year cycle.
The current Structure 3 is simply too large to fully develop and complete within a standard one-year bearish cycle. The market therefore needs a much longer period to develop the entire structure and complete all of its phases.
In other words, the prolonged bearish phase isn’t necessarily something random or unexpected. The structure itself requires more time.
What we are seeing today may simply be the next stage of a structure that has been developing for years.
7
1
6
8.7k
·
--
$BTC
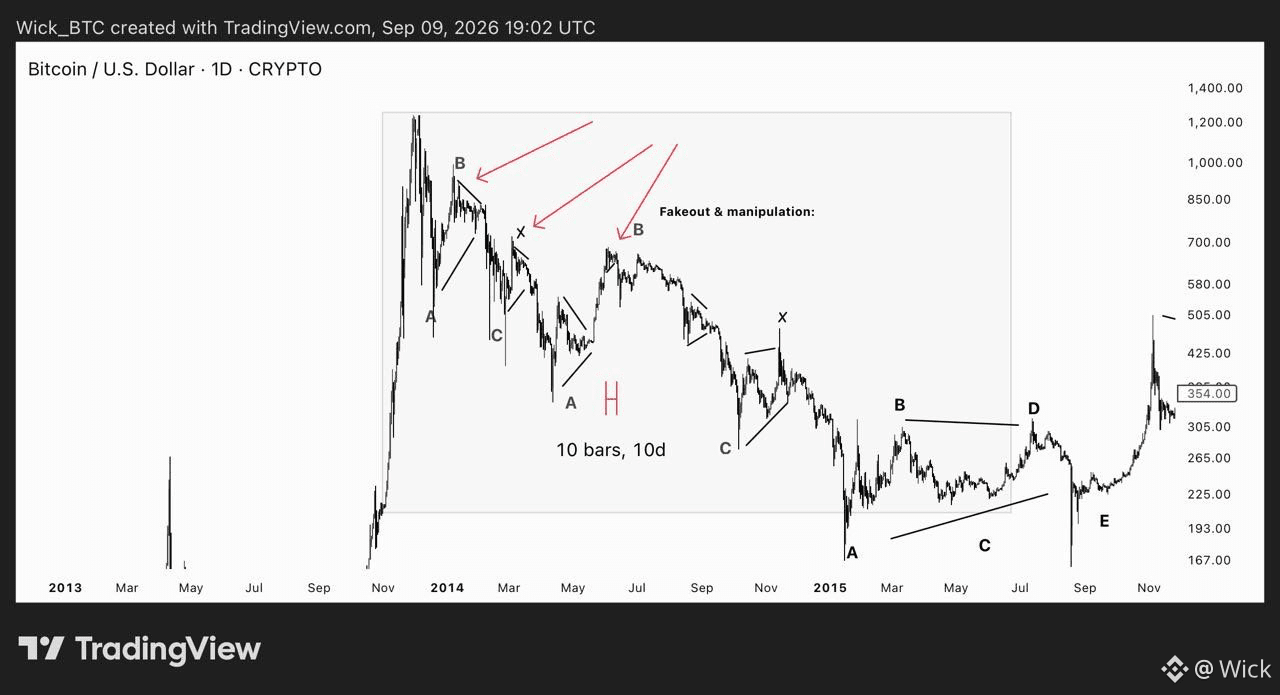
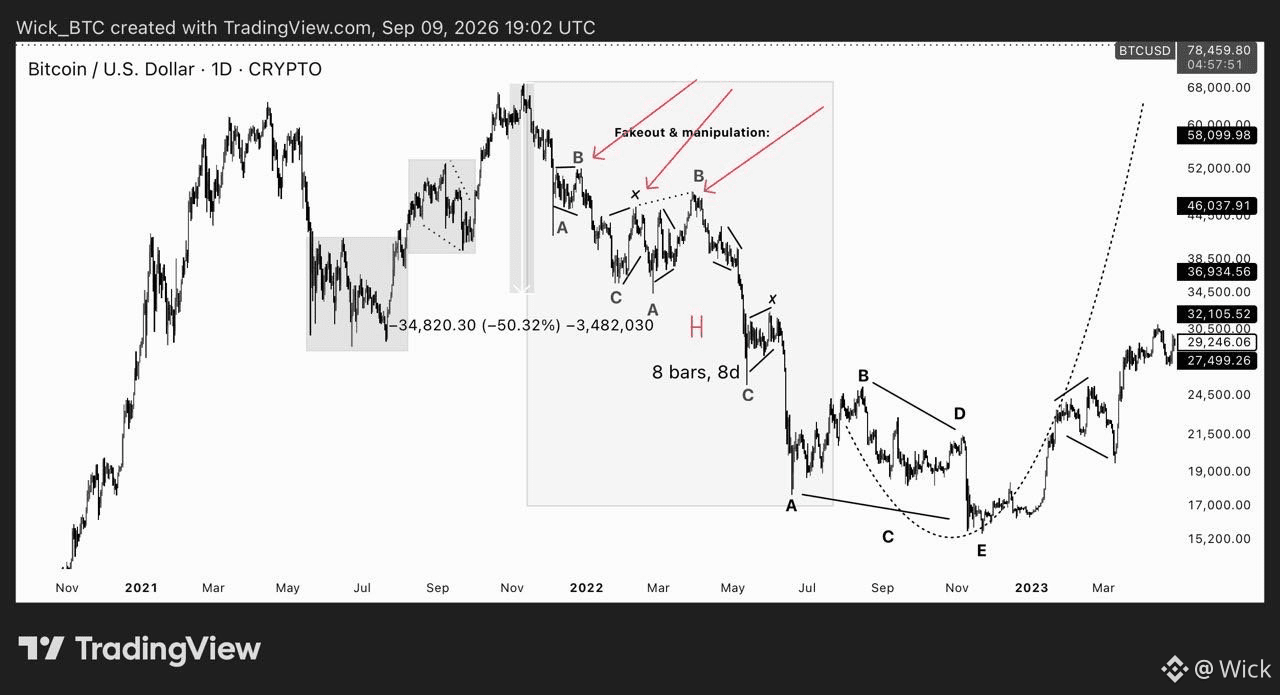
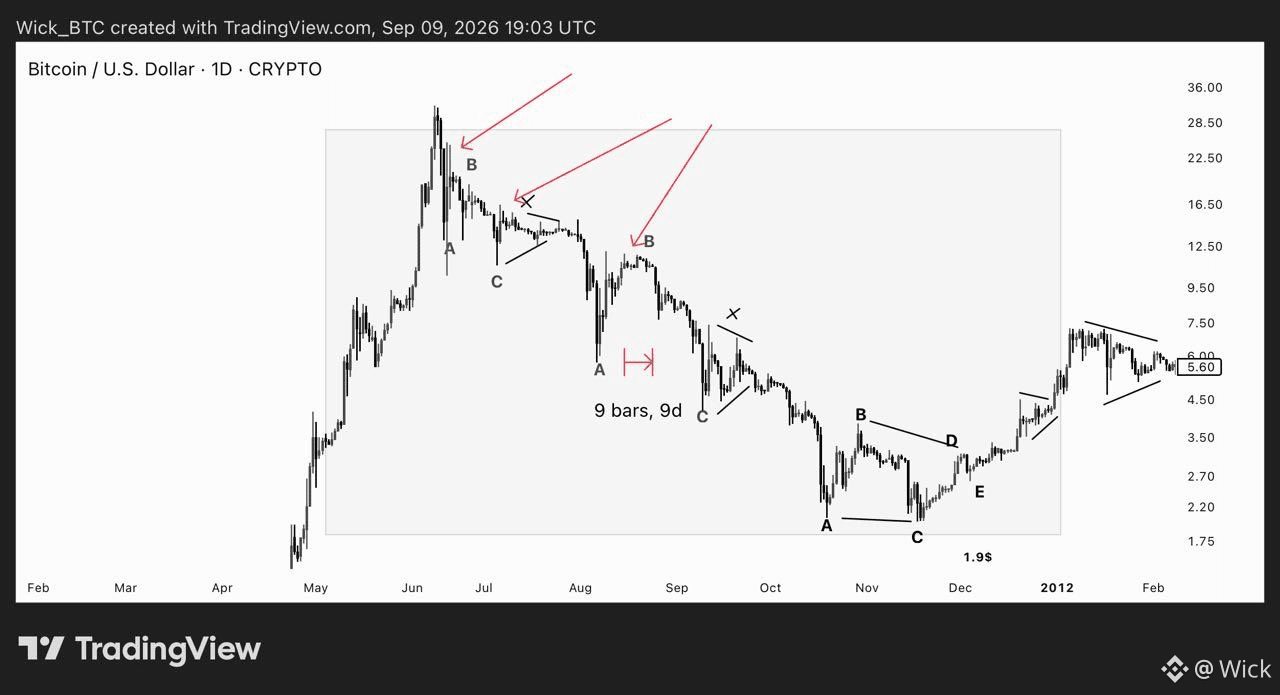
Following up on my previous post about the three relief rallies within major Bitcoin bear-market structures, I want to highlight another interesting detail.
When we measure these rallies, there is often a clear progression in their magnitude: the first is smaller, the second becomes stronger, and the third tends to be the strongest relief rally before the major bearish continuation.
Looking across the major structures:
2011: +45% → +70% → +79%
2013–15: +55% → +60% → +84%
2017–18: +30% → +40% → +68%
2021–22: +25.0% → +30.1% → +40.0%
Current: +21.3% → +37.5% → +42.2%
The percentages are obviously not identical from cycle to cycle, but the character of the progression is what matters:
smaller → stronger → strongest → bearish continuation.
This is also why I don’t automatically interpret a strong recovery inside a bear structure as the beginning of a new bull market. Historically, the largest relief rally can appear very close to the transition into the next major bearish phase.
$BTC
Following up on my previous post about the three relief rallies within major Bitcoin bear-market structures, I want to highlight another interesting detail.
When we measure these rallies, there is often a clear progression in their magnitude: the first is smaller, the second becomes stronger, and the third tends to be the strongest relief rally before the major bearish continuation.
Looking across the major structures:
2011: +45% → +70% → +79%
2013–15: +55% → +60% → +84%
2017–18: +30% → +40% → +68%
2021–22: +25.0% → +30.1% → +40.0%
Current: +21.3% → +37.5% → +42.2%
The percentages are obviously not identical from cycle to cycle, but the character of the progression is what matters:
smaller → stronger → strongest → bearish continuation.
This is also why I don’t automatically interpret a strong recovery inside a bear structure as the beginning of a new bull market. Historically, the largest relief rally can appear very close to the transition into the next major bearish phase.
Following up on my previous post about the three relief rallies within major Bitcoin bear-market structures, I want to highlight another interesting detail.
When we measure these rallies, there is often a clear progression in their magnitude: the first is smaller, the second becomes stronger, and the third tends to be the strongest relief rally before the major bearish continuation.
Looking across the major structures:
2011: +45% → +70% → +79%
2013–15: +55% → +60% → +84%
2017–18: +30% → +40% → +68%
2021–22: +25.0% → +30.1% → +40.0%
Current: +21.3% → +37.5% → +42.2%
The percentages are obviously not identical from cycle to cycle, but the character of the progression is what matters:
smaller → stronger → strongest → bearish continuation.
This is also why I don’t automatically interpret a strong recovery inside a bear structure as the beginning of a new bull market. Historically, the largest relief rally can appear very close to the transition into the next major bearish phase.
598
·
--
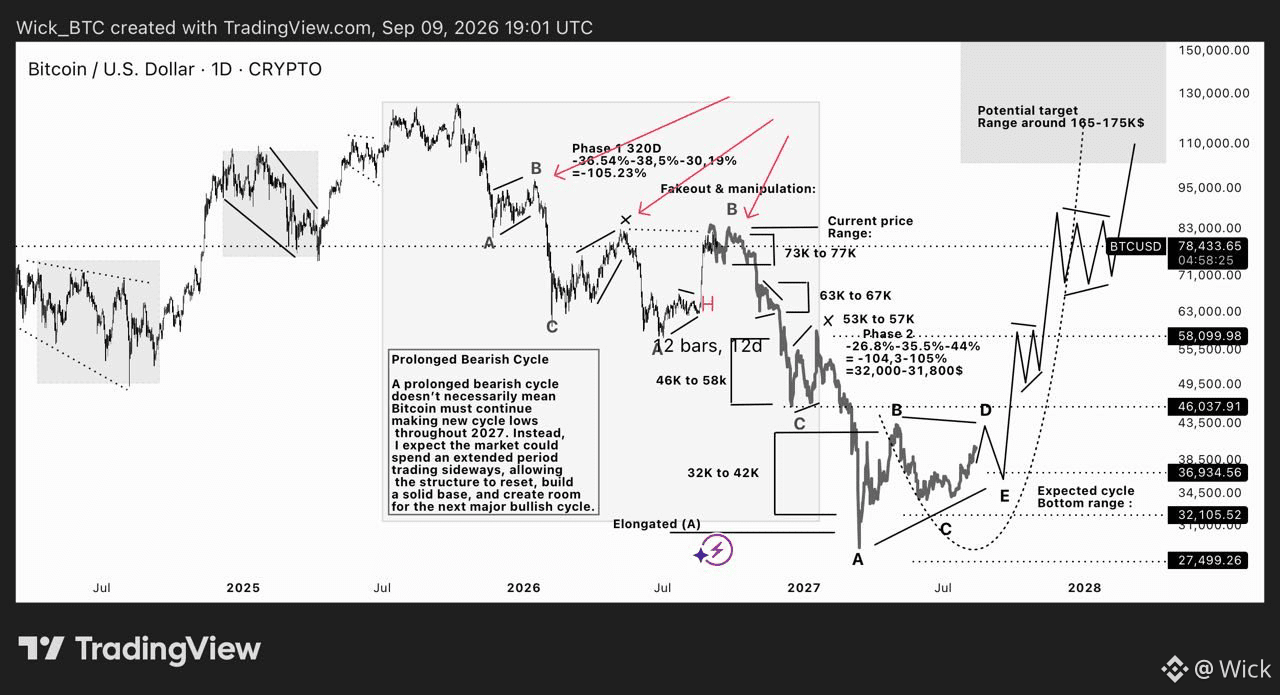
$BTC
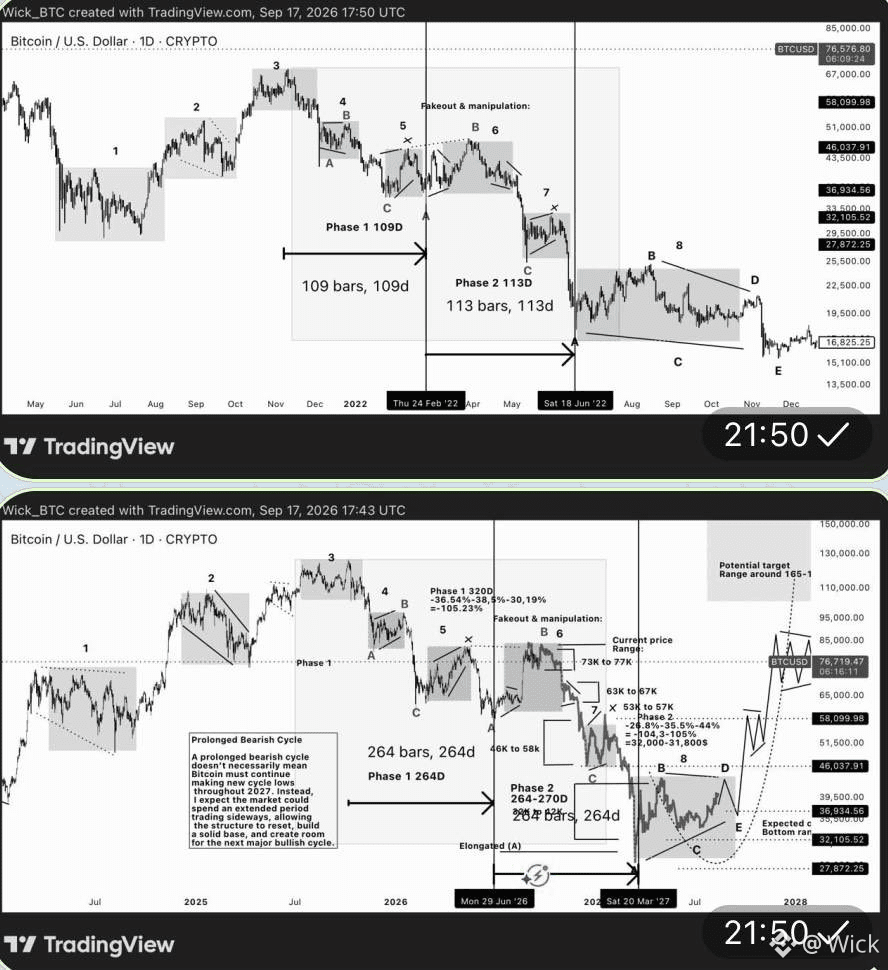
The real chaos will begin when Bitcoin has spent 1 year in this bear market — and then still makes a new cycle low.
Why?
Because at that point, many people will realize they have no clear historical reference left for when this prolonged bear market could finally end.
They were expecting a typical 1-year bearish cycle.
But if Bitcoin makes a new cycle low after completing that 1-year timeframe, that assumption is broken.
There are only ~2 weeks left until the typical 1-year bear cycle is completed.
And I’ll repeat this once again for those who still don’t know:
Since the beginning, I’ve been expecting the current cycle to follow the prolonged 2013–2015 bearish cycle — lasting well over one year. ( explained on quoted post )
The real confusion starts when the timeline everyone expected no longer works.
$BTC
The real chaos will begin when Bitcoin has spent 1 year in this bear market — and then still makes a new cycle low.
Why?
Because at that point, many people will realize they have no clear historical reference left for when this prolonged bear market could finally end.
They were expecting a typical 1-year bearish cycle.
But if Bitcoin makes a new cycle low after completing that 1-year timeframe, that assumption is broken.
There are only ~2 weeks left until the typical 1-year bear cycle is completed.
And I’ll repeat this once again for those who still don’t know:
Since the beginning, I’ve been expecting the current cycle to follow the prolonged 2013–2015 bearish cycle — lasting well over one year. ( explained on quoted post )
The real confusion starts when the timeline everyone expected no longer works.
The real chaos will begin when Bitcoin has spent 1 year in this bear market — and then still makes a new cycle low.
Why?
Because at that point, many people will realize they have no clear historical reference left for when this prolonged bear market could finally end.
They were expecting a typical 1-year bearish cycle.
But if Bitcoin makes a new cycle low after completing that 1-year timeframe, that assumption is broken.
There are only ~2 weeks left until the typical 1-year bear cycle is completed.
And I’ll repeat this once again for those who still don’t know:
Since the beginning, I’ve been expecting the current cycle to follow the prolonged 2013–2015 bearish cycle — lasting well over one year. ( explained on quoted post )
The real confusion starts when the timeline everyone expected no longer works.
1.9k
·
--
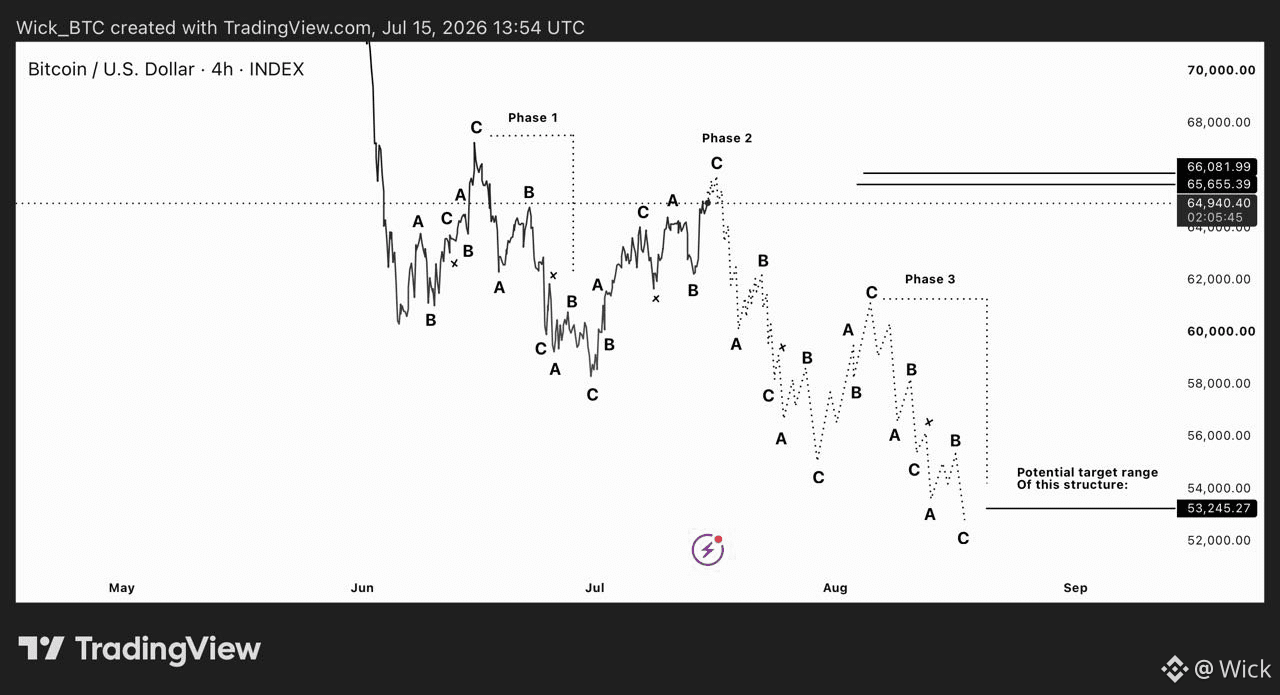
$BTC Update:
Bitcoin continues to repeat a very similar market structure, with price action closely following the same sequence of swings.
The current move appears to be approaching the end of Phase 2. If this fractal continues to play out, the next stage could be Phase 3, where the market may form another series of A-B-C swings before reaching the projected target area around $53,000–54,000.
$BTC Update:
Bitcoin continues to repeat a very similar market structure, with price action closely following the same sequence of swings.
The current move appears to be approaching the end of Phase 2. If this fractal continues to play out, the next stage could be Phase 3, where the market may form another series of A-B-C swings before reaching the projected target area around $53,000–54,000.
Bitcoin continues to repeat a very similar market structure, with price action closely following the same sequence of swings.
The current move appears to be approaching the end of Phase 2. If this fractal continues to play out, the next stage could be Phase 3, where the market may form another series of A-B-C swings before reaching the projected target area around $53,000–54,000.
134
·
--
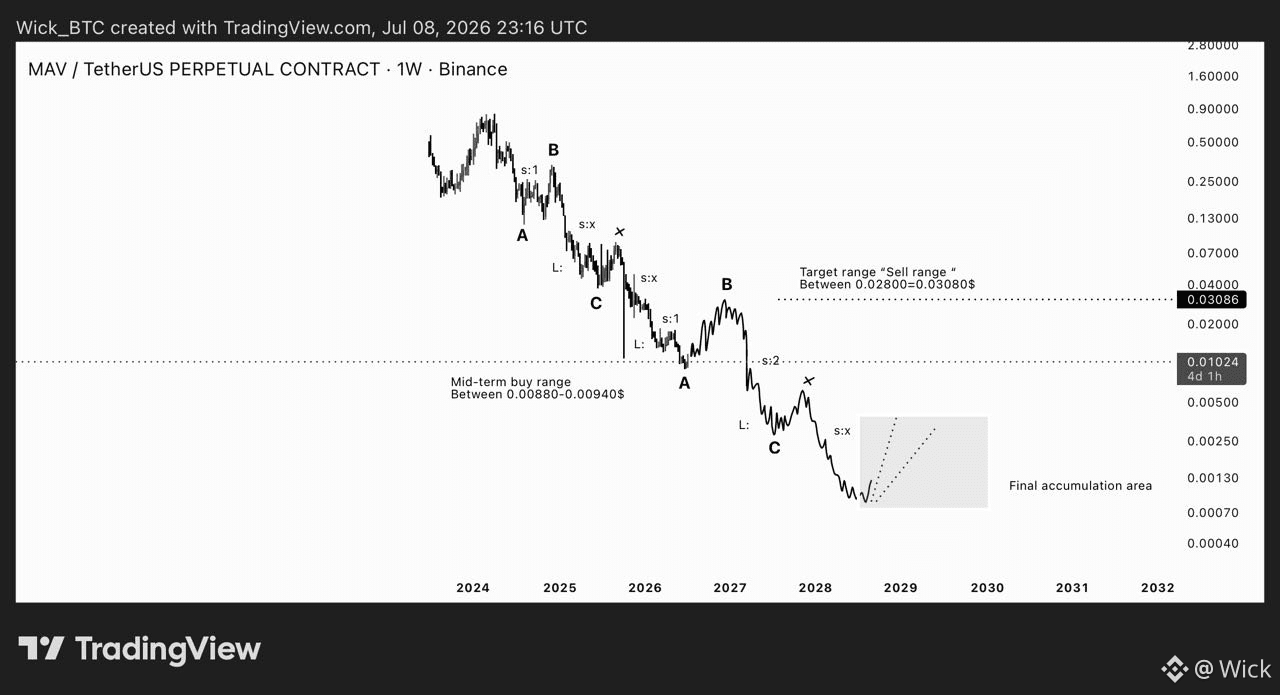
$MAV Buy & Sell Setup (Mid-term)
Current market structure continues to point toward a prolonged corrective cycle. While short-term relief rallies remain possible, the broader trend still favors another leg lower before a major accumulation phase begins.
• Buy Zone: $0.00880 – $0.00940
• Relief Rally Target: $0.02800 – $0.03080
If price finds support inside the buy zone, a strong relief rally toward the $0.02800–$0.03080 resistance area becomes possible. However, I view this move as a corrective bounce rather than the start of a new bull trend.
Once price reaches the sell range, I expect the rally to lose momentum and complete another ABC corrective structure, opening the door for the next major decline.
• Sell Zone: $0.02800 – $0.03080
• Final Downside Target: $0.01800
0.01130-0.00880$
$MAV Buy & Sell Setup (Mid-term)
Current market structure continues to point toward a prolonged corrective cycle. While short-term relief rallies remain possible, the broader trend still favors another leg lower before a major accumulation phase begins.
• Buy Zone: $0.00880 – $0.00940
• Relief Rally Target: $0.02800 – $0.03080
If price finds support inside the buy zone, a strong relief rally toward the $0.02800–$0.03080 resistance area becomes possible. However, I view this move as a corrective bounce rather than the start of a new bull trend.
Once price reaches the sell range, I expect the rally to lose momentum and complete another ABC corrective structure, opening the door for the next major decline.
• Sell Zone: $0.02800 – $0.03080
• Final Downside Target: $0.01800
0.01130-0.00880$
Current market structure continues to point toward a prolonged corrective cycle. While short-term relief rallies remain possible, the broader trend still favors another leg lower before a major accumulation phase begins.
• Buy Zone: $0.00880 – $0.00940
• Relief Rally Target: $0.02800 – $0.03080
If price finds support inside the buy zone, a strong relief rally toward the $0.02800–$0.03080 resistance area becomes possible. However, I view this move as a corrective bounce rather than the start of a new bull trend.
Once price reaches the sell range, I expect the rally to lose momentum and complete another ABC corrective structure, opening the door for the next major decline.
• Sell Zone: $0.02800 – $0.03080
• Final Downside Target: $0.01800
0.01130-0.00880$
108
·
--
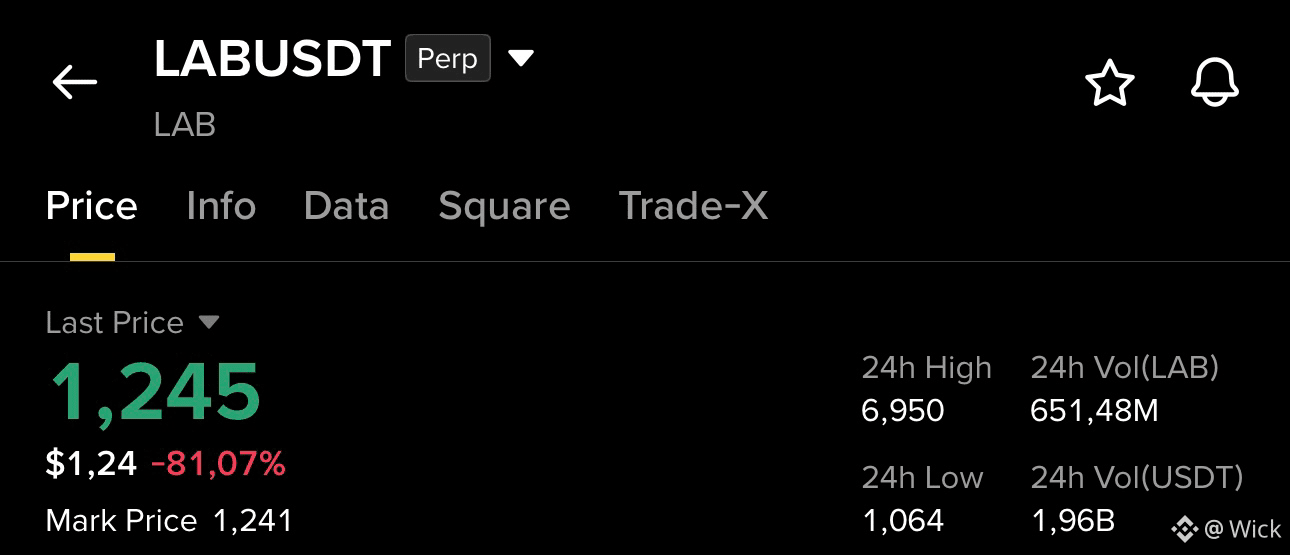
$LAB
Be careful trying to buy this dip. I believe LAB still has significant downside, with $0.20 or lower remaining the target.
$LAB
Be careful trying to buy this dip. I believe LAB still has significant downside, with $0.20 or lower remaining the target.
Be careful trying to buy this dip. I believe LAB still has significant downside, with $0.20 or lower remaining the target.
460
·
--
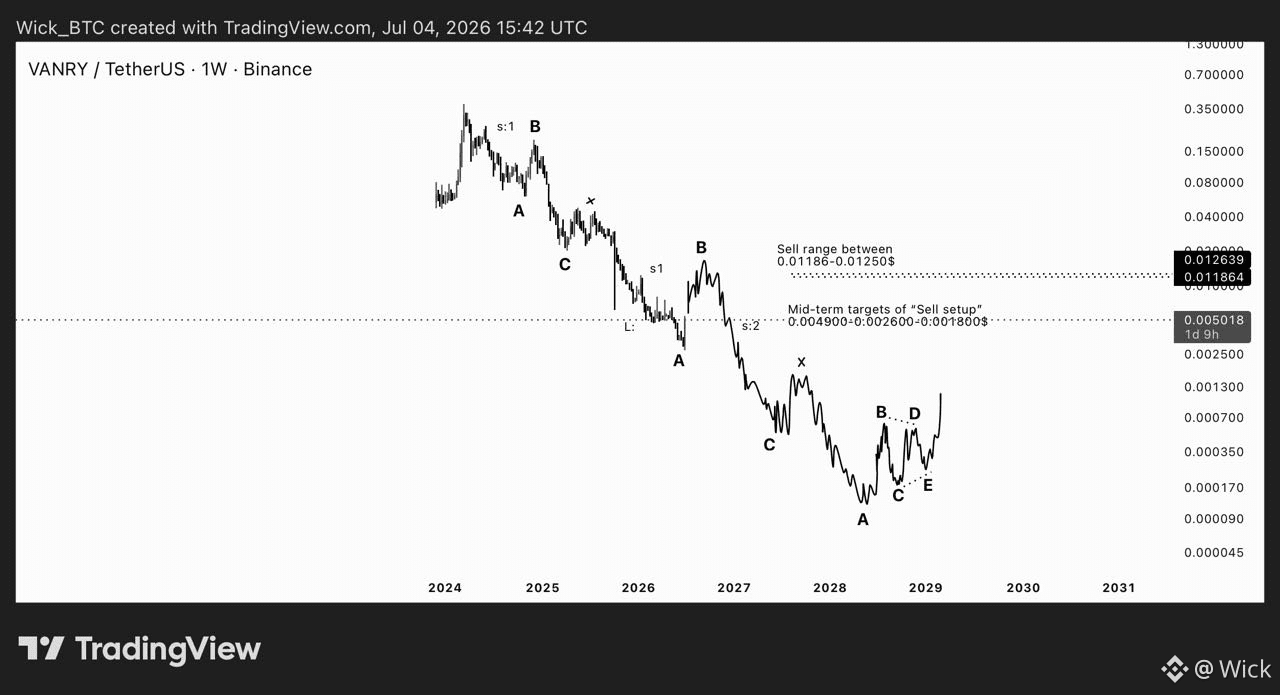
$VANRY Mid-Term Sell Setup
The current recovery looks like nothing more than a relief rally within the broader bearish structure. Unless price invalidates the count, I’m expecting this bounce to complete before the next impulsive leg lower begins.
•Sell Range: $0.01186 – $0.01250
•Mid-Term Targets:
• $0.00490
• $0.00260
• $0.00180
The larger bearish wave structure still appears incomplete. This rally is expected to be a temporary correction rather than the start of a new bull trend. If the projected wave count remains valid, the next bearish phase should follow after the relief rally reaches the sell zone.
$VANRY Mid-Term Sell Setup
The current recovery looks like nothing more than a relief rally within the broader bearish structure. Unless price invalidates the count, I’m expecting this bounce to complete before the next impulsive leg lower begins.
•Sell Range: $0.01186 – $0.01250
•Mid-Term Targets:
• $0.00490
• $0.00260
• $0.00180
The larger bearish wave structure still appears incomplete. This rally is expected to be a temporary correction rather than the start of a new bull trend. If the projected wave count remains valid, the next bearish phase should follow after the relief rally reaches the sell zone.
The current recovery looks like nothing more than a relief rally within the broader bearish structure. Unless price invalidates the count, I’m expecting this bounce to complete before the next impulsive leg lower begins.
•Sell Range: $0.01186 – $0.01250
•Mid-Term Targets:
• $0.00490
• $0.00260
• $0.00180
The larger bearish wave structure still appears incomplete. This rally is expected to be a temporary correction rather than the start of a new bull trend. If the projected wave count remains valid, the next bearish phase should follow after the relief rally reaches the sell zone.
154
·
--
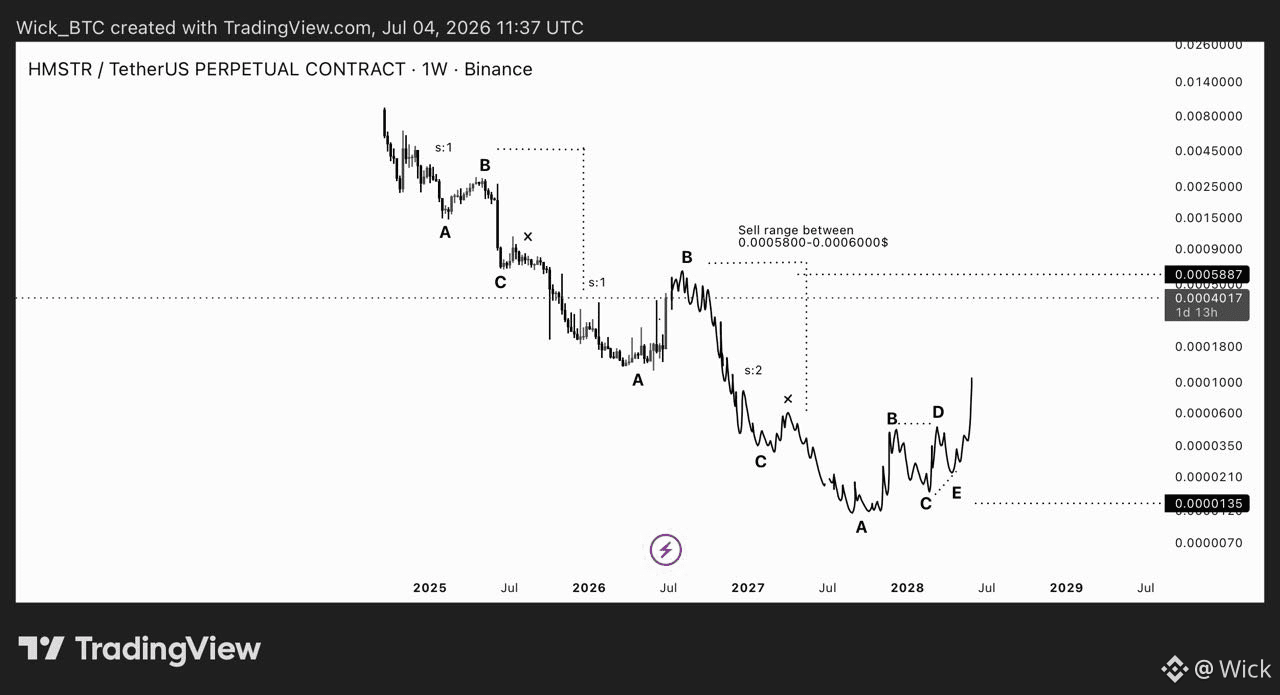
$HMSTR Mid-Term Sell Setup
The current upside move is expected to be a relief rally within the broader bearish structure. As long as the overall wave count remains valid, I’m treating this rally as an opportunity to position for the next leg lower rather than the start of a new bull trend.
•Sell Zone: $0.0005800 – $0.0006000
Plan:
Wait for price to reach the sell range.
Look for rejection and signs of exhaustion before entering a short.
This rally is expected to be temporary, followed by a continuation of the larger bearish trend.
Targets:
TP1: Previous local lows.
TP2: Around $0.00021 support.
TP3: New cycle lows below the current bottom if bearish momentum continues.
$HMSTR Mid-Term Sell Setup
The current upside move is expected to be a relief rally within the broader bearish structure. As long as the overall wave count remains valid, I’m treating this rally as an opportunity to position for the next leg lower rather than the start of a new bull trend.
•Sell Zone: $0.0005800 – $0.0006000
Plan:
Wait for price to reach the sell range.
Look for rejection and signs of exhaustion before entering a short.
This rally is expected to be temporary, followed by a continuation of the larger bearish trend.
Targets:
TP1: Previous local lows.
TP2: Around $0.00021 support.
TP3: New cycle lows below the current bottom if bearish momentum continues.
The current upside move is expected to be a relief rally within the broader bearish structure. As long as the overall wave count remains valid, I’m treating this rally as an opportunity to position for the next leg lower rather than the start of a new bull trend.
•Sell Zone: $0.0005800 – $0.0006000
Plan:
Wait for price to reach the sell range.
Look for rejection and signs of exhaustion before entering a short.
This rally is expected to be temporary, followed by a continuation of the larger bearish trend.
Targets:
TP1: Previous local lows.
TP2: Around $0.00021 support.
TP3: New cycle lows below the current bottom if bearish momentum continues.
341
·
--
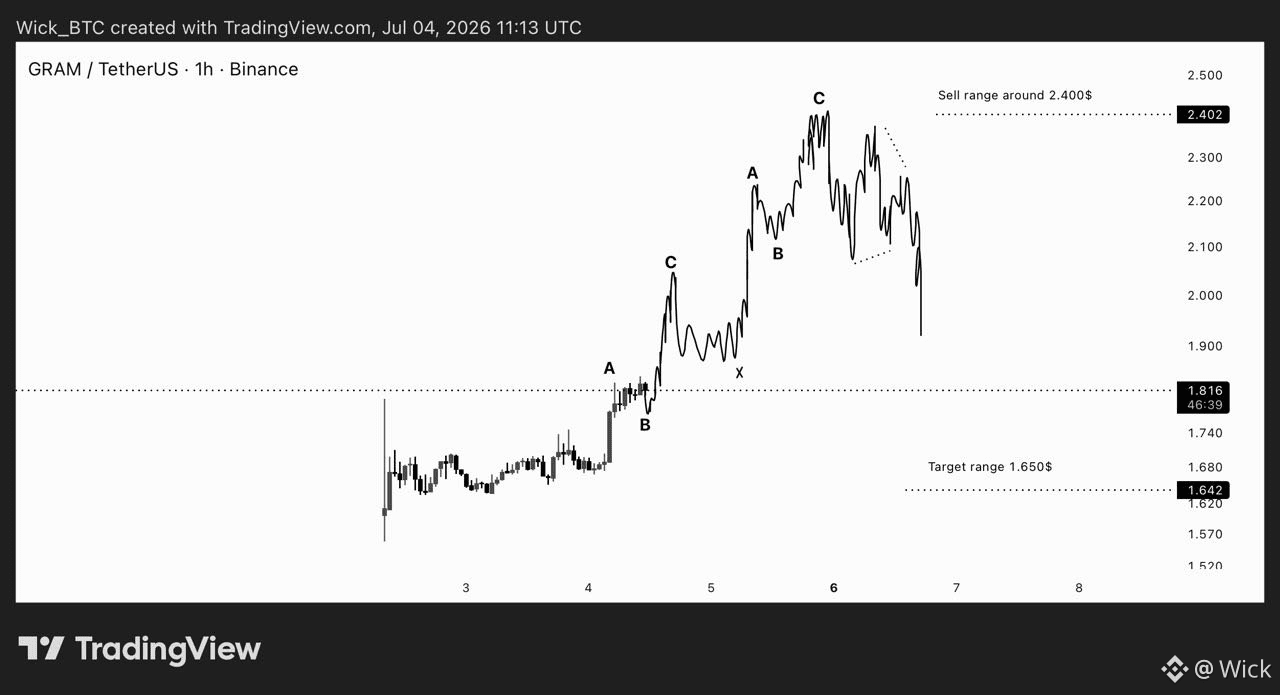
$GRAM /USDT — Sell Setup
The current rally is still unfolding and hasn’t entered its final bullish phase yet. I expect further upside as the corrective structure continues to develop before the major bearish continuation begins.
•Sell Zone: $2.35 – $2.40
Wait for price to reach the sell zone and form a clear rejection before considering a short position.
•Initial Bearish Target: $1.65
This is expected to be the first major bearish leg, with the overall structure likely remaining bearish after relief rallies. Until then, I remain focused on the $2.35–2.40 area as the preferred short-entry zone.
$GRAM /USDT — Sell Setup
The current rally is still unfolding and hasn’t entered its final bullish phase yet. I expect further upside as the corrective structure continues to develop before the major bearish continuation begins.
•Sell Zone: $2.35 – $2.40
Wait for price to reach the sell zone and form a clear rejection before considering a short position.
•Initial Bearish Target: $1.65
This is expected to be the first major bearish leg, with the overall structure likely remaining bearish after relief rallies. Until then, I remain focused on the $2.35–2.40 area as the preferred short-entry zone.
The current rally is still unfolding and hasn’t entered its final bullish phase yet. I expect further upside as the corrective structure continues to develop before the major bearish continuation begins.
•Sell Zone: $2.35 – $2.40
Wait for price to reach the sell zone and form a clear rejection before considering a short position.
•Initial Bearish Target: $1.65
This is expected to be the first major bearish leg, with the overall structure likely remaining bearish after relief rallies. Until then, I remain focused on the $2.35–2.40 area as the preferred short-entry zone.
208
·
--
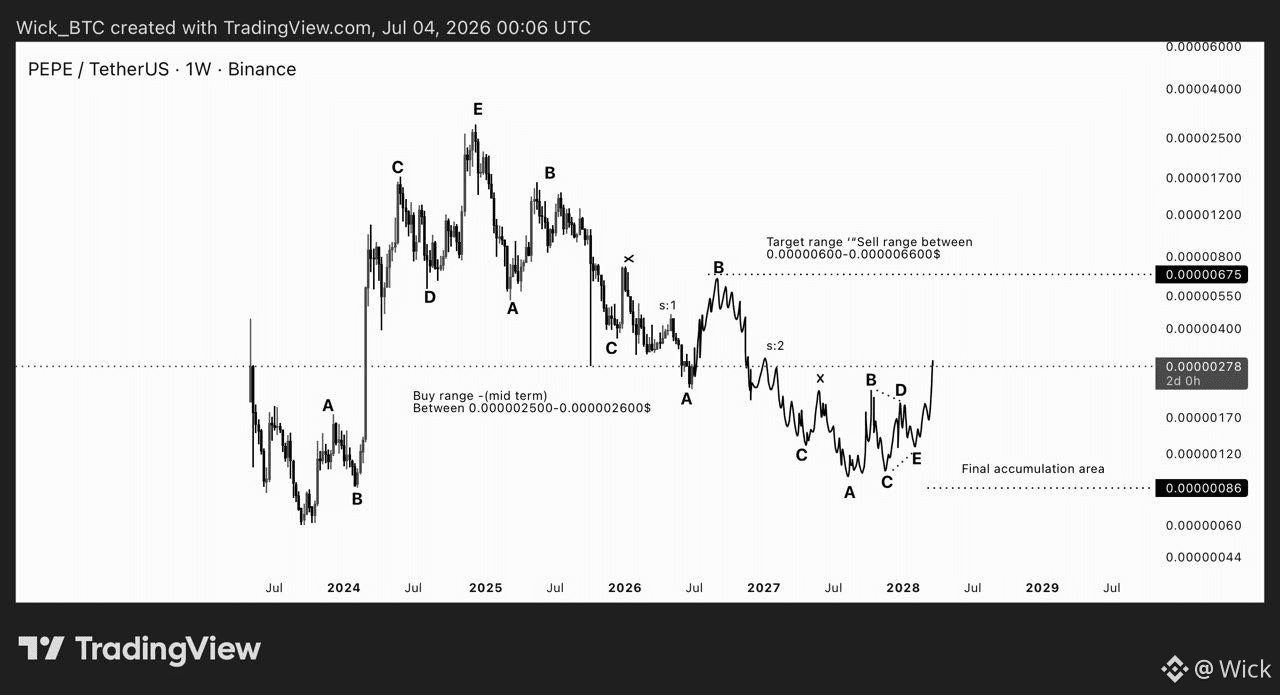
$PEPE Buy & Sell Setups (Mid-term)
Current structure continues to follow my projected wave path. I expect a relief rally before the next major bearish leg. As long as PEPE holds the 0.00000230–0.00000250 support zone, a move toward the 0.00000600–0.00000660 resistance area remains the primary scenario.
• Buy Zone: 0.00000250 – 0.00000260
• Target: 0.00000600 – 0.00000660
Once price reaches the sell range, I expect the relief rally to lose momentum and complete the corrective structure. From there, the next bearish phase should begin, with lower highs and lower lows.
• Sell Zone: 0.00000600 – 0.00000660
• Downside Target: Final accumulation area around 0.00000086
$PEPE Buy & Sell Setups (Mid-term)
Current structure continues to follow my projected wave path. I expect a relief rally before the next major bearish leg. As long as PEPE holds the 0.00000230–0.00000250 support zone, a move toward the 0.00000600–0.00000660 resistance area remains the primary scenario.
• Buy Zone: 0.00000250 – 0.00000260
• Target: 0.00000600 – 0.00000660
Once price reaches the sell range, I expect the relief rally to lose momentum and complete the corrective structure. From there, the next bearish phase should begin, with lower highs and lower lows.
• Sell Zone: 0.00000600 – 0.00000660
• Downside Target: Final accumulation area around 0.00000086
Current structure continues to follow my projected wave path. I expect a relief rally before the next major bearish leg. As long as PEPE holds the 0.00000230–0.00000250 support zone, a move toward the 0.00000600–0.00000660 resistance area remains the primary scenario.
• Buy Zone: 0.00000250 – 0.00000260
• Target: 0.00000600 – 0.00000660
Once price reaches the sell range, I expect the relief rally to lose momentum and complete the corrective structure. From there, the next bearish phase should begin, with lower highs and lower lows.
• Sell Zone: 0.00000600 – 0.00000660
• Downside Target: Final accumulation area around 0.00000086
153
·
--
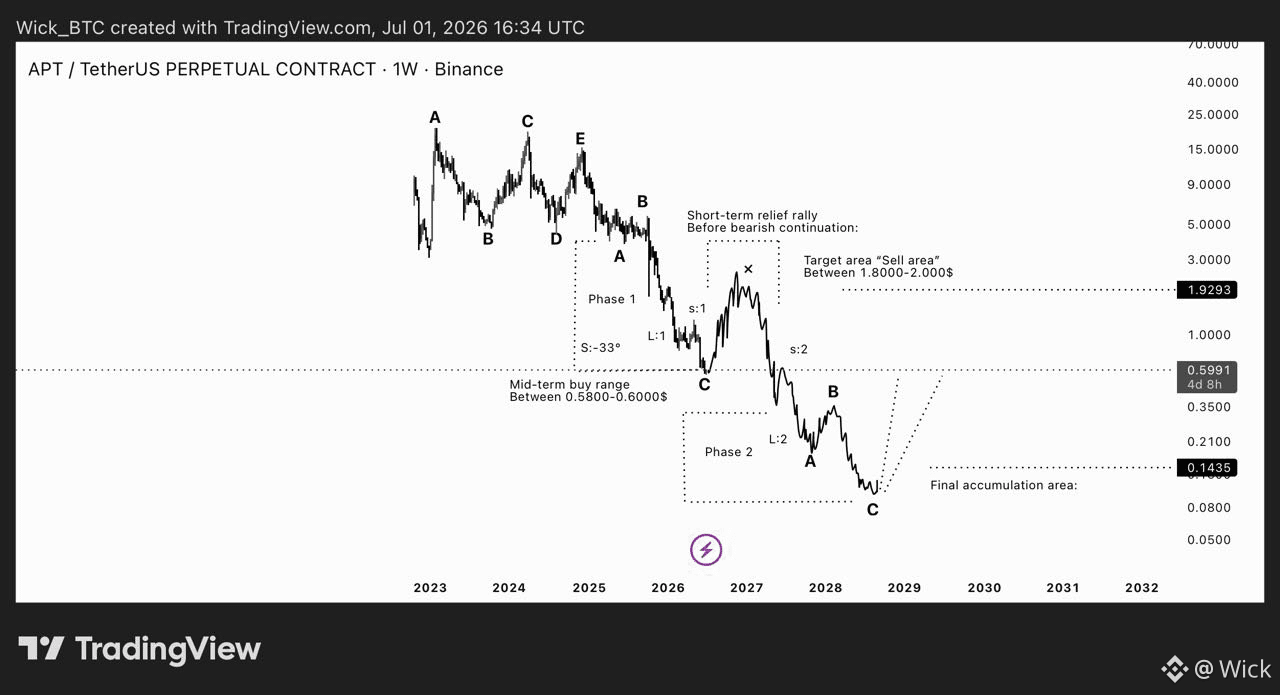
$APT Buy & Sell Setup (Mid-term)
Current market structure suggests a potential relief rally before the next major bearish continuation. As long as APT holds the $0.58–$0.60 support zone, a mid-term recovery toward the $1.80–$2.00 resistance area remains possible.
• Buy Zone: $0.58 – $0.60
• Target: $1.80 – $2.00
Once price reaches the target area, I expect the relief rally to lose momentum and complete an ABC corrective structure, creating a high-probability setup for the next bearish leg.
• Sell Zone: $1.80 – $2.00
• Downside Target: Final accumulation area below $0.15
$APT Buy & Sell Setup (Mid-term)
Current market structure suggests a potential relief rally before the next major bearish continuation. As long as APT holds the $0.58–$0.60 support zone, a mid-term recovery toward the $1.80–$2.00 resistance area remains possible.
• Buy Zone: $0.58 – $0.60
• Target: $1.80 – $2.00
Once price reaches the target area, I expect the relief rally to lose momentum and complete an ABC corrective structure, creating a high-probability setup for the next bearish leg.
• Sell Zone: $1.80 – $2.00
• Downside Target: Final accumulation area below $0.15
Current market structure suggests a potential relief rally before the next major bearish continuation. As long as APT holds the $0.58–$0.60 support zone, a mid-term recovery toward the $1.80–$2.00 resistance area remains possible.
• Buy Zone: $0.58 – $0.60
• Target: $1.80 – $2.00
Once price reaches the target area, I expect the relief rally to lose momentum and complete an ABC corrective structure, creating a high-probability setup for the next bearish leg.
• Sell Zone: $1.80 – $2.00
• Downside Target: Final accumulation area below $0.15
166
·
--
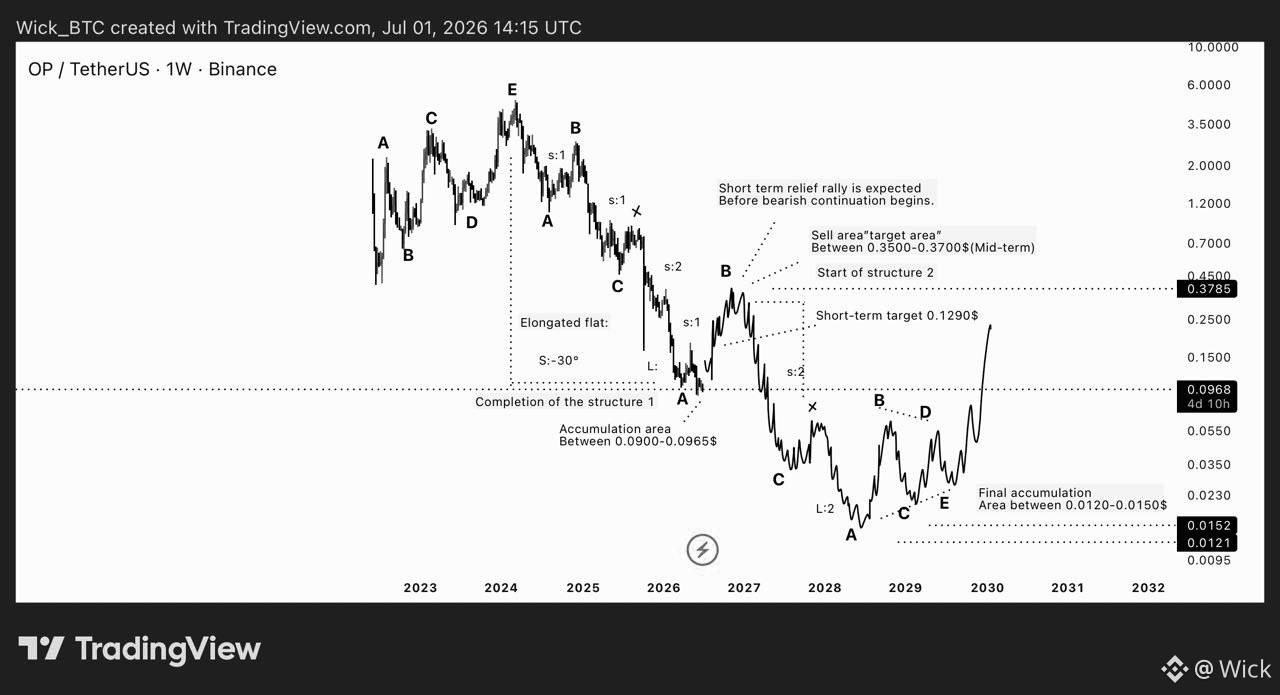
$OP Buy & Sell Setups (Mid-term)
Current structure suggests that OP has entered an accumulation zone, where I expect a mid-term relief rally to begin. As long as price holds the $0.0900–$0.0965 support area, the primary outlook remains bullish toward the $0.3500–$0.3700 resistance zone.
The first short-term target is $0.1290, but I do not expect the rally to end there. Instead, I expect the uptrend to continue, with $0.1290 acting as an intermediate milestone on the way to the main target.
Buy Zone: $0.0900–$0.0965
Short-Term Target: $0.1290
Main Sell Zone: $0.3500–$0.3700
Once price reaches the $0.3500–$0.3700 resistance area, I expect the relief rally to complete, followed by a bearish continuation into the $0.0120–$0.0150 final accumulation zone.
Final Accumulation Area: $0.0120–$0.0150
$OP Buy & Sell Setups (Mid-term)
Current structure suggests that OP has entered an accumulation zone, where I expect a mid-term relief rally to begin. As long as price holds the $0.0900–$0.0965 support area, the primary outlook remains bullish toward the $0.3500–$0.3700 resistance zone.
The first short-term target is $0.1290, but I do not expect the rally to end there. Instead, I expect the uptrend to continue, with $0.1290 acting as an intermediate milestone on the way to the main target.
Buy Zone: $0.0900–$0.0965
Short-Term Target: $0.1290
Main Sell Zone: $0.3500–$0.3700
Once price reaches the $0.3500–$0.3700 resistance area, I expect the relief rally to complete, followed by a bearish continuation into the $0.0120–$0.0150 final accumulation zone.
Final Accumulation Area: $0.0120–$0.0150
Current structure suggests that OP has entered an accumulation zone, where I expect a mid-term relief rally to begin. As long as price holds the $0.0900–$0.0965 support area, the primary outlook remains bullish toward the $0.3500–$0.3700 resistance zone.
The first short-term target is $0.1290, but I do not expect the rally to end there. Instead, I expect the uptrend to continue, with $0.1290 acting as an intermediate milestone on the way to the main target.
Buy Zone: $0.0900–$0.0965
Short-Term Target: $0.1290
Main Sell Zone: $0.3500–$0.3700
Once price reaches the $0.3500–$0.3700 resistance area, I expect the relief rally to complete, followed by a bearish continuation into the $0.0120–$0.0150 final accumulation zone.
Final Accumulation Area: $0.0120–$0.0150
284
·
--
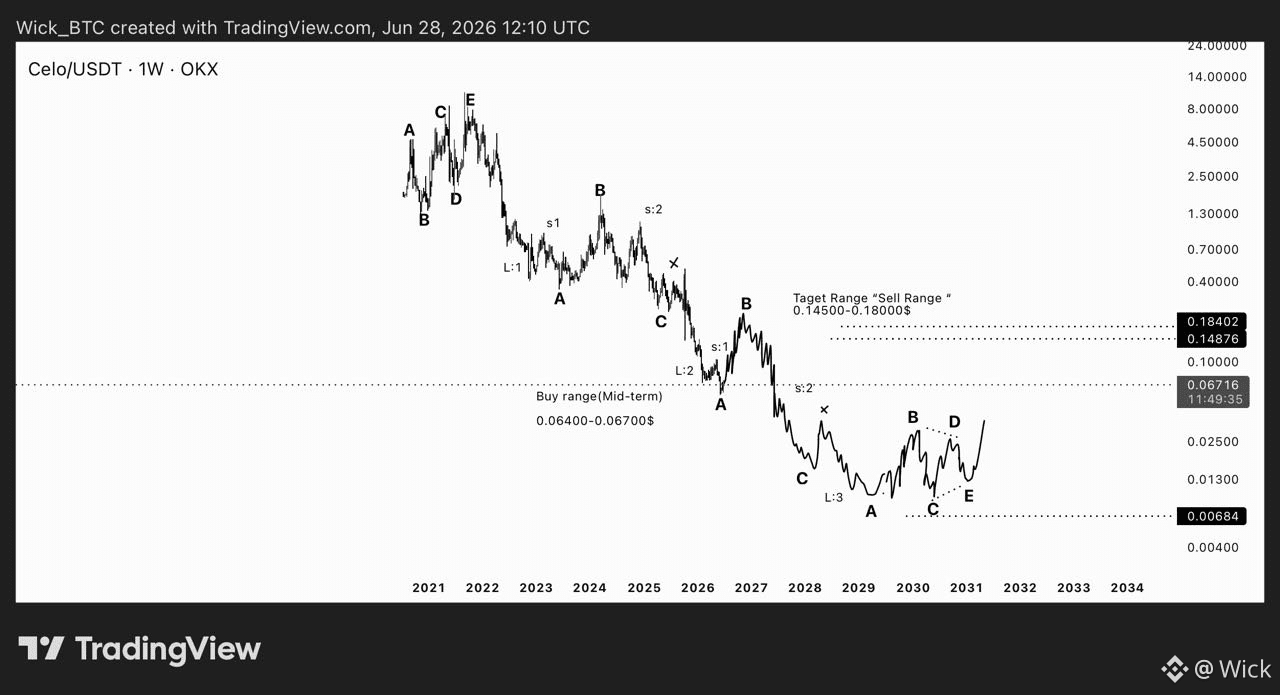
$CELO (1W)
The current structure suggests a potential relief rally before the broader bearish trend resumes.
•Buy Range (Mid-Term): $0.0640 – $0.0670
•Target / Sell Range: $0.1450 – $0.1800
Once price reaches the target zone, I’ll be looking to close longs and open short positions. In my view, this move is likely to be a relief rally, not the beginning of a new bull market.
The $0.1450–$0.1800 region is expected to act as strong resistance, where the next major bearish continuation could begin.
$CELO (1W)
The current structure suggests a potential relief rally before the broader bearish trend resumes.
•Buy Range (Mid-Term): $0.0640 – $0.0670
•Target / Sell Range: $0.1450 – $0.1800
Once price reaches the target zone, I’ll be looking to close longs and open short positions. In my view, this move is likely to be a relief rally, not the beginning of a new bull market.
The $0.1450–$0.1800 region is expected to act as strong resistance, where the next major bearish continuation could begin.
The current structure suggests a potential relief rally before the broader bearish trend resumes.
•Buy Range (Mid-Term): $0.0640 – $0.0670
•Target / Sell Range: $0.1450 – $0.1800
Once price reaches the target zone, I’ll be looking to close longs and open short positions. In my view, this move is likely to be a relief rally, not the beginning of a new bull market.
The $0.1450–$0.1800 region is expected to act as strong resistance, where the next major bearish continuation could begin.
125
·
--
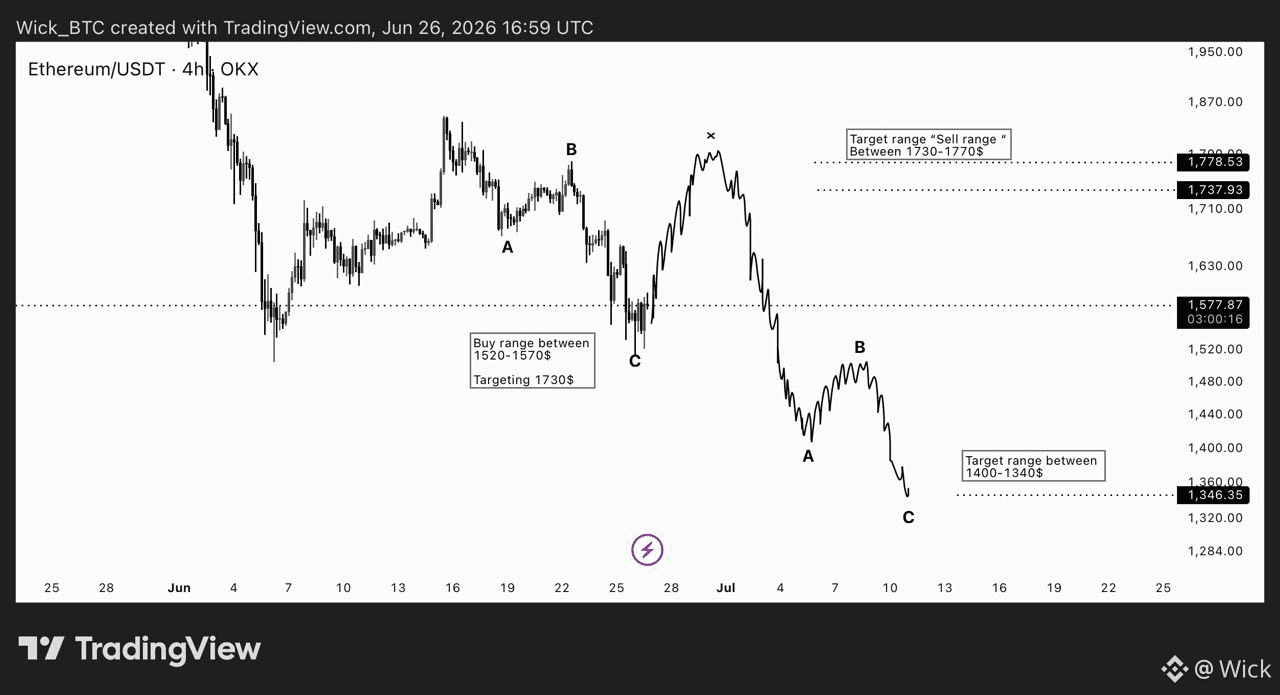
$ETH Buy & Sell Setups (Mid-term)
Current structure suggests a potential relief rally before the next corrective leg. As long as Ethereum holds the $1,520–$1,570 support zone, a short-term recovery toward the $1,730–$1,770 resistance area remains likely.
• Buy Zone: $1,520 – $1,570
• Target: $1,730 – $1,770
Once price reaches the sell range, I expect the rally to lose momentum and complete an ABC corrective structure, increasing the probability of another leg lower.
• Sell Zone: $1,730 – $1,770
• Downside Target: $1,400 – $1,340
$ETH Buy & Sell Setups (Mid-term)
Current structure suggests a potential relief rally before the next corrective leg. As long as Ethereum holds the $1,520–$1,570 support zone, a short-term recovery toward the $1,730–$1,770 resistance area remains likely.
• Buy Zone: $1,520 – $1,570
• Target: $1,730 – $1,770
Once price reaches the sell range, I expect the rally to lose momentum and complete an ABC corrective structure, increasing the probability of another leg lower.
• Sell Zone: $1,730 – $1,770
• Downside Target: $1,400 – $1,340
Current structure suggests a potential relief rally before the next corrective leg. As long as Ethereum holds the $1,520–$1,570 support zone, a short-term recovery toward the $1,730–$1,770 resistance area remains likely.
• Buy Zone: $1,520 – $1,570
• Target: $1,730 – $1,770
Once price reaches the sell range, I expect the rally to lose momentum and complete an ABC corrective structure, increasing the probability of another leg lower.
• Sell Zone: $1,730 – $1,770
• Downside Target: $1,400 – $1,340
79
·
--
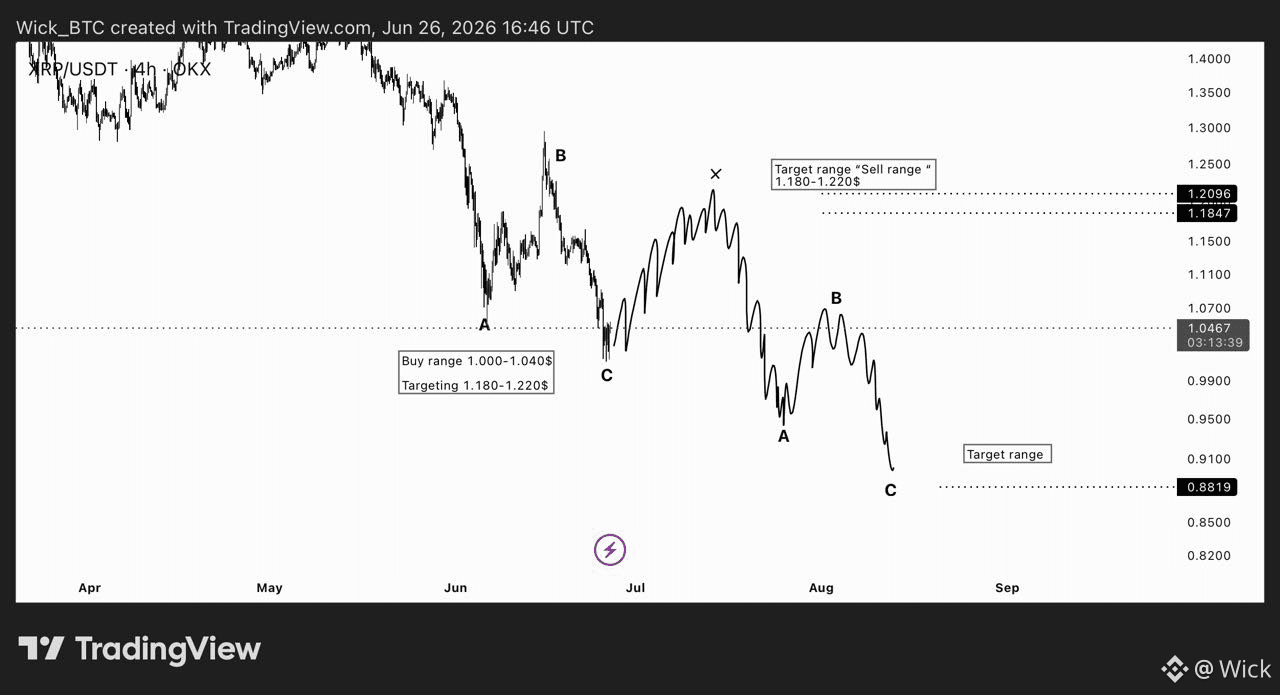
$XRP Buy & Sell Setups (Mid-term)
Current structure suggests a potential relief rally before the next corrective leg. As long as XRP holds the $1.00–$1.04 support zone, a short-term move toward the $1.18–$1.22 resistance area remains likely.
• Buy Zone: $1.00 – $1.04
• Target: $1.18 – $1.22
Once price reaches the sell range, I expect the rally to lose momentum and complete an ABC corrective structure, increasing the probability of another decline.
• Sell Zone: $1.18 – $1.22
• Downside Target: ~$0.88
$XRP Buy & Sell Setups (Mid-term)
Current structure suggests a potential relief rally before the next corrective leg. As long as XRP holds the $1.00–$1.04 support zone, a short-term move toward the $1.18–$1.22 resistance area remains likely.
• Buy Zone: $1.00 – $1.04
• Target: $1.18 – $1.22
Once price reaches the sell range, I expect the rally to lose momentum and complete an ABC corrective structure, increasing the probability of another decline.
• Sell Zone: $1.18 – $1.22
• Downside Target: ~$0.88
Current structure suggests a potential relief rally before the next corrective leg. As long as XRP holds the $1.00–$1.04 support zone, a short-term move toward the $1.18–$1.22 resistance area remains likely.
• Buy Zone: $1.00 – $1.04
• Target: $1.18 – $1.22
Once price reaches the sell range, I expect the rally to lose momentum and complete an ABC corrective structure, increasing the probability of another decline.
• Sell Zone: $1.18 – $1.22
• Downside Target: ~$0.88
102
·
--
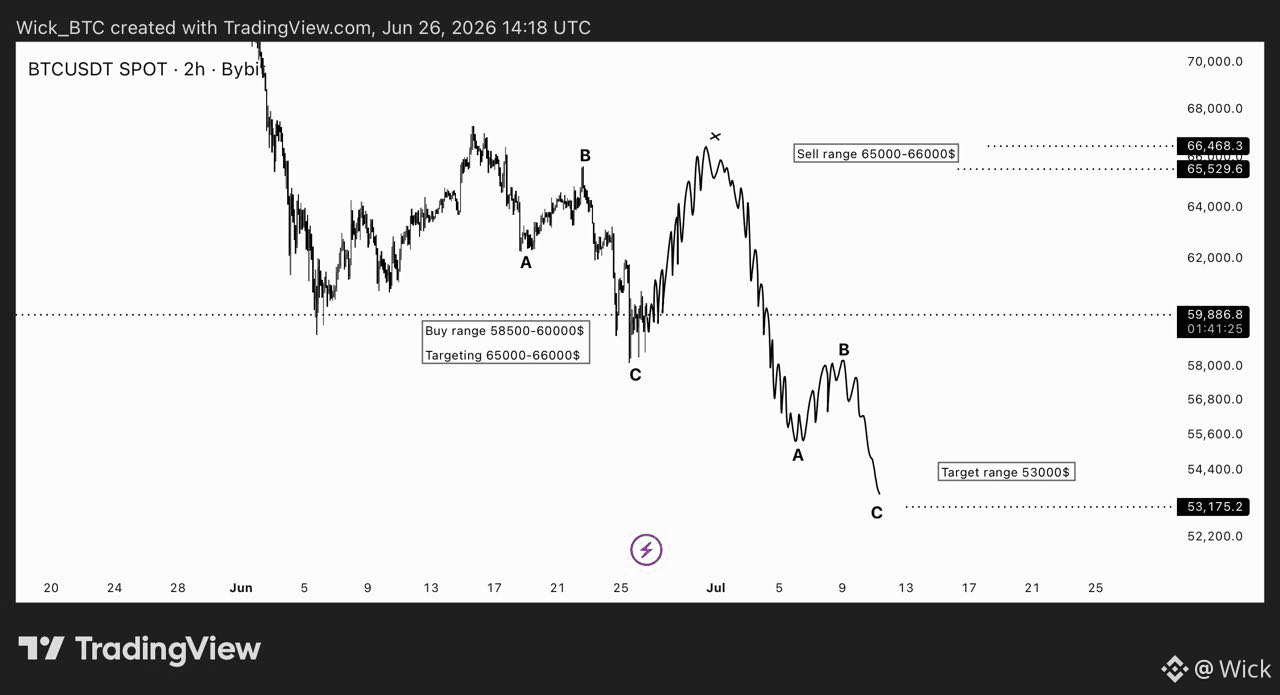
$BTC buy & Sell setups ( Mid-term)
Current structure suggests a potential relief rally before the next leg down. As long as Bitcoin holds the $58.5K–$60K support zone, a short-term bounce toward the $65K–$66K resistance area remains possible.
•Buy Zone: $58,500 – $60,000
•Target: $65,000 – $66,000
Once price reaches the sell range, I expect the rally to exhaust and form an ABC corrective structure, opening the door for a deeper decline.
•Sell Zone: $65,000 – $66,000
•Downside Target: ~$53,000
$BTC buy & Sell setups ( Mid-term)
Current structure suggests a potential relief rally before the next leg down. As long as Bitcoin holds the $58.5K–$60K support zone, a short-term bounce toward the $65K–$66K resistance area remains possible.
•Buy Zone: $58,500 – $60,000
•Target: $65,000 – $66,000
Once price reaches the sell range, I expect the rally to exhaust and form an ABC corrective structure, opening the door for a deeper decline.
•Sell Zone: $65,000 – $66,000
•Downside Target: ~$53,000
Current structure suggests a potential relief rally before the next leg down. As long as Bitcoin holds the $58.5K–$60K support zone, a short-term bounce toward the $65K–$66K resistance area remains possible.
•Buy Zone: $58,500 – $60,000
•Target: $65,000 – $66,000
Once price reaches the sell range, I expect the rally to exhaust and form an ABC corrective structure, opening the door for a deeper decline.
•Sell Zone: $65,000 – $66,000
•Downside Target: ~$53,000
103
·
--
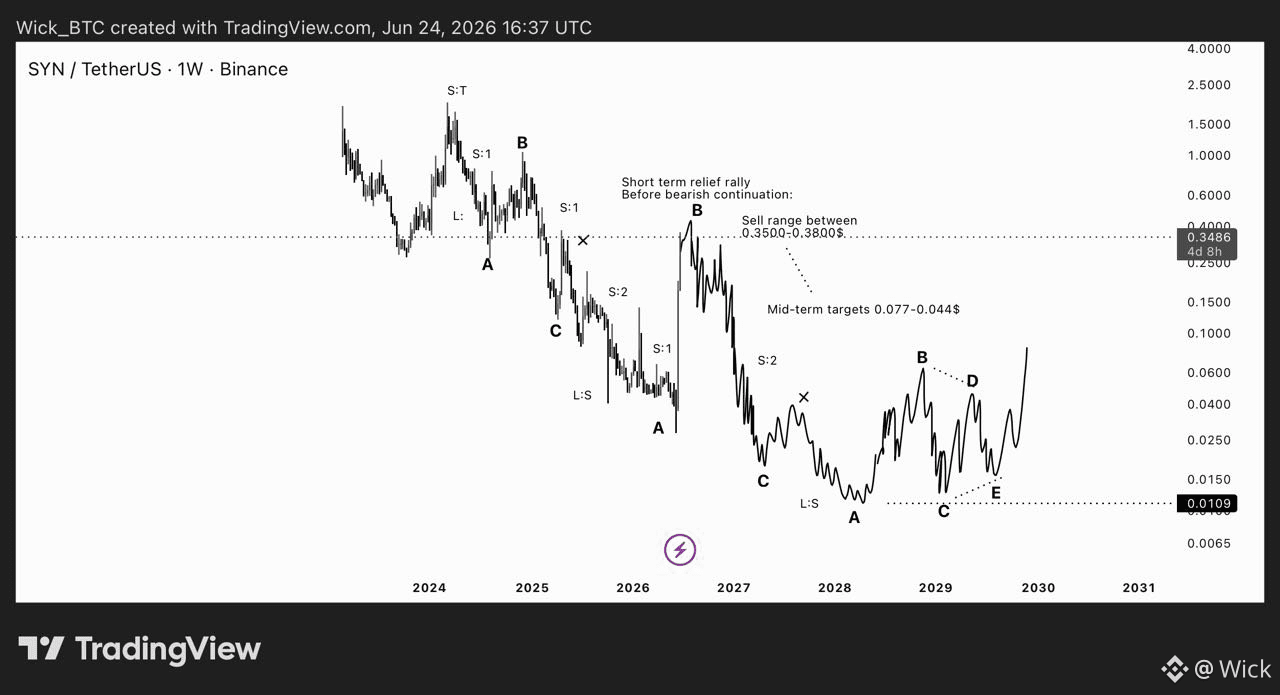
$SYN update:
The projected relief rally into the $0.35–$0.38 sell zone has now been completed, with price currently trading within the resistance area.
I’m expecting this region to act as a distribution zone before the next bearish leg begins.
Current Sell Setup: $0.35–$0.38
Downside Targets: $0.077–$0.044
As long as the market remains below major resistance and the bearish structure stays intact, this move is being treated as a corrective rally rather than the start of a new uptrend. The focus now is on watching for weakness and confirmation of trend continuation toward the target zone.
$SYN update:
The projected relief rally into the $0.35–$0.38 sell zone has now been completed, with price currently trading within the resistance area.
I’m expecting this region to act as a distribution zone before the next bearish leg begins.
Current Sell Setup: $0.35–$0.38
Downside Targets: $0.077–$0.044
As long as the market remains below major resistance and the bearish structure stays intact, this move is being treated as a corrective rally rather than the start of a new uptrend. The focus now is on watching for weakness and confirmation of trend continuation toward the target zone.
The projected relief rally into the $0.35–$0.38 sell zone has now been completed, with price currently trading within the resistance area.
I’m expecting this region to act as a distribution zone before the next bearish leg begins.
Current Sell Setup: $0.35–$0.38
Downside Targets: $0.077–$0.044
As long as the market remains below major resistance and the bearish structure stays intact, this move is being treated as a corrective rally rather than the start of a new uptrend. The focus now is on watching for weakness and confirmation of trend continuation toward the target zone.
229
·
--
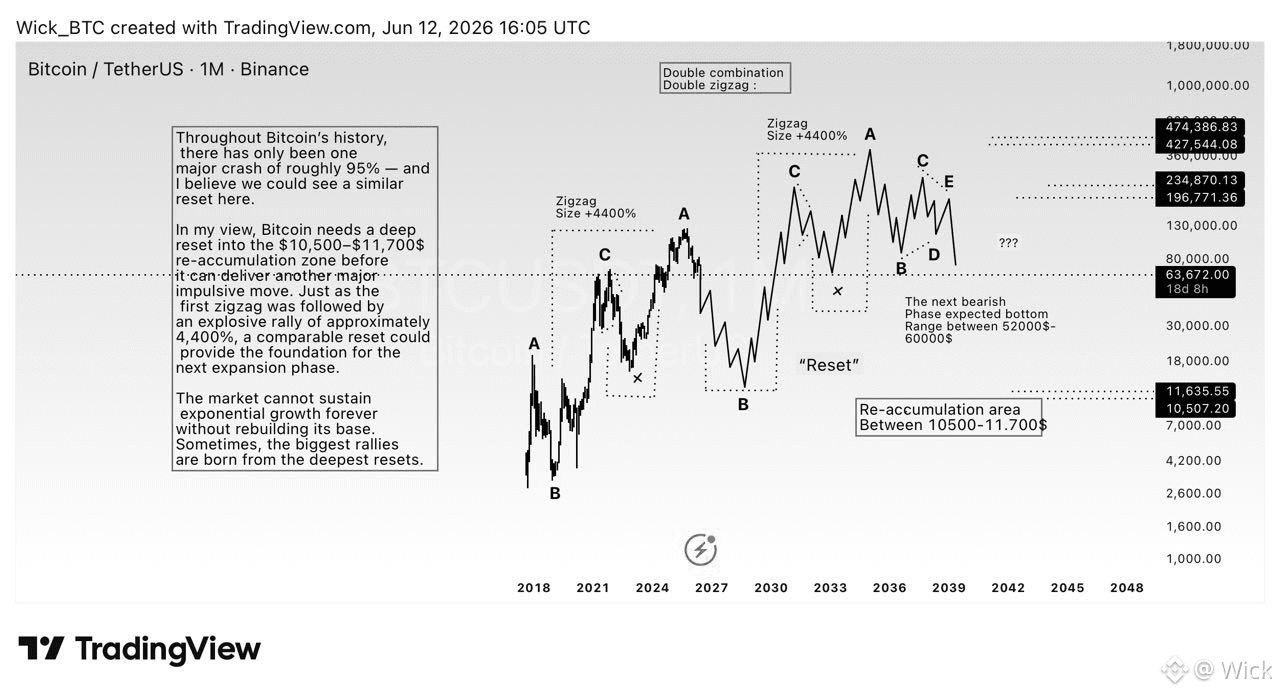
$BTC Cycle’s is broken:
As many of you have noticed, Bitcoin’s returns have been decreasing with each cycle. The first major expansion delivered extraordinary gains, then the next cycle produced roughly half of that, and the pattern has continued.
But few people ask the obvious question: if this trend continues indefinitely, where does it lead?
Following the same rate of decline, cycle returns would eventually shrink from 7x to 3.5x, then 1.7x, then 0.85x, ultimately reaching a point where Bitcoin can no longer produce meaningful expansion. The cycle would effectively be exhausted.
This is why I believe a major reset is necessary.
A deep correction into the $10,500–11,700$ re-accumulation zone would allow the market to rebuild its foundation, reset expectations, remove excess leverage, and create the conditions for a new growth cycle.
Throughout Bitcoin’s history, there has only been one crash of approximately 95%, and I believe a similar reset could be required here. Only after such a reset can Bitcoin potentially repeat the type of explosive move seen during the first major zigzag, which delivered gains of roughly 4,400%. Since being listed on exchanges.
My thesis is simple: without a reset, each cycle continues to weaken. With a reset, Bitcoin has the opportunity to restart the cycle and generate another powerful impulsive expansion.
$BTC Cycle’s is broken:
As many of you have noticed, Bitcoin’s returns have been decreasing with each cycle. The first major expansion delivered extraordinary gains, then the next cycle produced roughly half of that, and the pattern has continued.
But few people ask the obvious question: if this trend continues indefinitely, where does it lead?
Following the same rate of decline, cycle returns would eventually shrink from 7x to 3.5x, then 1.7x, then 0.85x, ultimately reaching a point where Bitcoin can no longer produce meaningful expansion. The cycle would effectively be exhausted.
This is why I believe a major reset is necessary.
A deep correction into the $10,500–11,700$ re-accumulation zone would allow the market to rebuild its foundation, reset expectations, remove excess leverage, and create the conditions for a new growth cycle.
Throughout Bitcoin’s history, there has only been one crash of approximately 95%, and I believe a similar reset could be required here. Only after such a reset can Bitcoin potentially repeat the type of explosive move seen during the first major zigzag, which delivered gains of roughly 4,400%. Since being listed on exchanges.
My thesis is simple: without a reset, each cycle continues to weaken. With a reset, Bitcoin has the opportunity to restart the cycle and generate another powerful impulsive expansion.
As many of you have noticed, Bitcoin’s returns have been decreasing with each cycle. The first major expansion delivered extraordinary gains, then the next cycle produced roughly half of that, and the pattern has continued.
But few people ask the obvious question: if this trend continues indefinitely, where does it lead?
Following the same rate of decline, cycle returns would eventually shrink from 7x to 3.5x, then 1.7x, then 0.85x, ultimately reaching a point where Bitcoin can no longer produce meaningful expansion. The cycle would effectively be exhausted.
This is why I believe a major reset is necessary.
A deep correction into the $10,500–11,700$ re-accumulation zone would allow the market to rebuild its foundation, reset expectations, remove excess leverage, and create the conditions for a new growth cycle.
Throughout Bitcoin’s history, there has only been one crash of approximately 95%, and I believe a similar reset could be required here. Only after such a reset can Bitcoin potentially repeat the type of explosive move seen during the first major zigzag, which delivered gains of roughly 4,400%. Since being listed on exchanges.
My thesis is simple: without a reset, each cycle continues to weaken. With a reset, Bitcoin has the opportunity to restart the cycle and generate another powerful impulsive expansion.
225
Log in to explore more content
Join global crypto users on Binance Square
⚡️ Get latest and useful information about crypto.
💬 Trusted by the world’s largest crypto exchange.
👍 Discover real insights from verified creators.
Email / Phone number
Trending Topics
BitcoinHits$85K
1,528 views
86 Discussing
Roughly $5B in visible $BTC short liquidations stacked between $83K–$85K. In an uptrend, that's fuel.
When shorts liquidate, they're forced to market-buy. That buying pressure drives price higher, triggering the next layer of liquidations above — a cascade of demand feeding itself.
We saw this exact dynamic on the run from $67K to $80K. The setup looks identical now. Expect the next leg to follow the same playbook: liquidation-driven momentum, systematic buying pressure, and continuation until the fuel runs out.
This is how bull markets accelerate. The chart is setting up clean, and the mechanics are in place. Watch for the break above $83K — that's where the cascade starts.
QuantFreedom
·4 Likes
·2.5k views
ECBStartsBlockchainEuroSettlement
1,548 views
167 Discussing
SouthAfricaProposesCryptoExchangeControls
11,001 views
402 Discussing