

Ade_Krypt
1.8k Posts

Ade_Krypt
Report
Block User
17 Following
2.3K+ Followers
4.2K+ Liked
Posts
All
Quotes
PINNED
·
--
Verified
Last week, a friend asked me where our medical records actually live. That simple question led me to research data privacy and discover #nillion .
What caught my attention was its approach to processing sensitive information without exposing the original data in readable form. By distributing information across multiple nodes, Nillion aims to enable privacy,focused computation.
With Covenants coming to Ethereum mainnet, it will be interesting to see how this development contributes to the broader conversation around privacy, programmable applications, and protecting sensitive data.
This technology could be valuable for hospitals, banks, insurance companies, and other organizations handling sensitive information daily.
However, an interesting concept is not automatically a proven solution. Security audits, transparency, real world testing, and responsible implementation matter just as much as the underlying technology.
There are still important questions about accountability, regulatory compliance, and how vulnerabilities would be handled if something went wrong.
I believe the best approach is to stay curious, read the technical documentation, and look for independent evidence rather than relying entirely on promotional claims.
Privacy matters, but proving that protection works matters equally.
#BinancePick $NIL @nillionnetwork #NIL $BTW $JCT
Last week, a friend asked me where our medical records actually live. That simple question led me to research data privacy and discover #nillion .
What caught my attention was its approach to processing sensitive information without exposing the original data in readable form. By distributing information across multiple nodes, Nillion aims to enable privacy,focused computation.
With Covenants coming to Ethereum mainnet, it will be interesting to see how this development contributes to the broader conversation around privacy, programmable applications, and protecting sensitive data.
This technology could be valuable for hospitals, banks, insurance companies, and other organizations handling sensitive information daily.
However, an interesting concept is not automatically a proven solution. Security audits, transparency, real world testing, and responsible implementation matter just as much as the underlying technology.
There are still important questions about accountability, regulatory compliance, and how vulnerabilities would be handled if something went wrong.
I believe the best approach is to stay curious, read the technical documentation, and look for independent evidence rather than relying entirely on promotional claims.
Privacy matters, but proving that protection works matters equally.
#BinancePick $NIL @Nillion #NIL $BTW $JCT
What caught my attention was its approach to processing sensitive information without exposing the original data in readable form. By distributing information across multiple nodes, Nillion aims to enable privacy,focused computation.
With Covenants coming to Ethereum mainnet, it will be interesting to see how this development contributes to the broader conversation around privacy, programmable applications, and protecting sensitive data.
This technology could be valuable for hospitals, banks, insurance companies, and other organizations handling sensitive information daily.
However, an interesting concept is not automatically a proven solution. Security audits, transparency, real world testing, and responsible implementation matter just as much as the underlying technology.
There are still important questions about accountability, regulatory compliance, and how vulnerabilities would be handled if something went wrong.
I believe the best approach is to stay curious, read the technical documentation, and look for independent evidence rather than relying entirely on promotional claims.
Privacy matters, but proving that protection works matters equally.
#BinancePick $NIL @Nillion #NIL $BTW $JCT

9
13
20.6k
PINNED
·
--
Verified
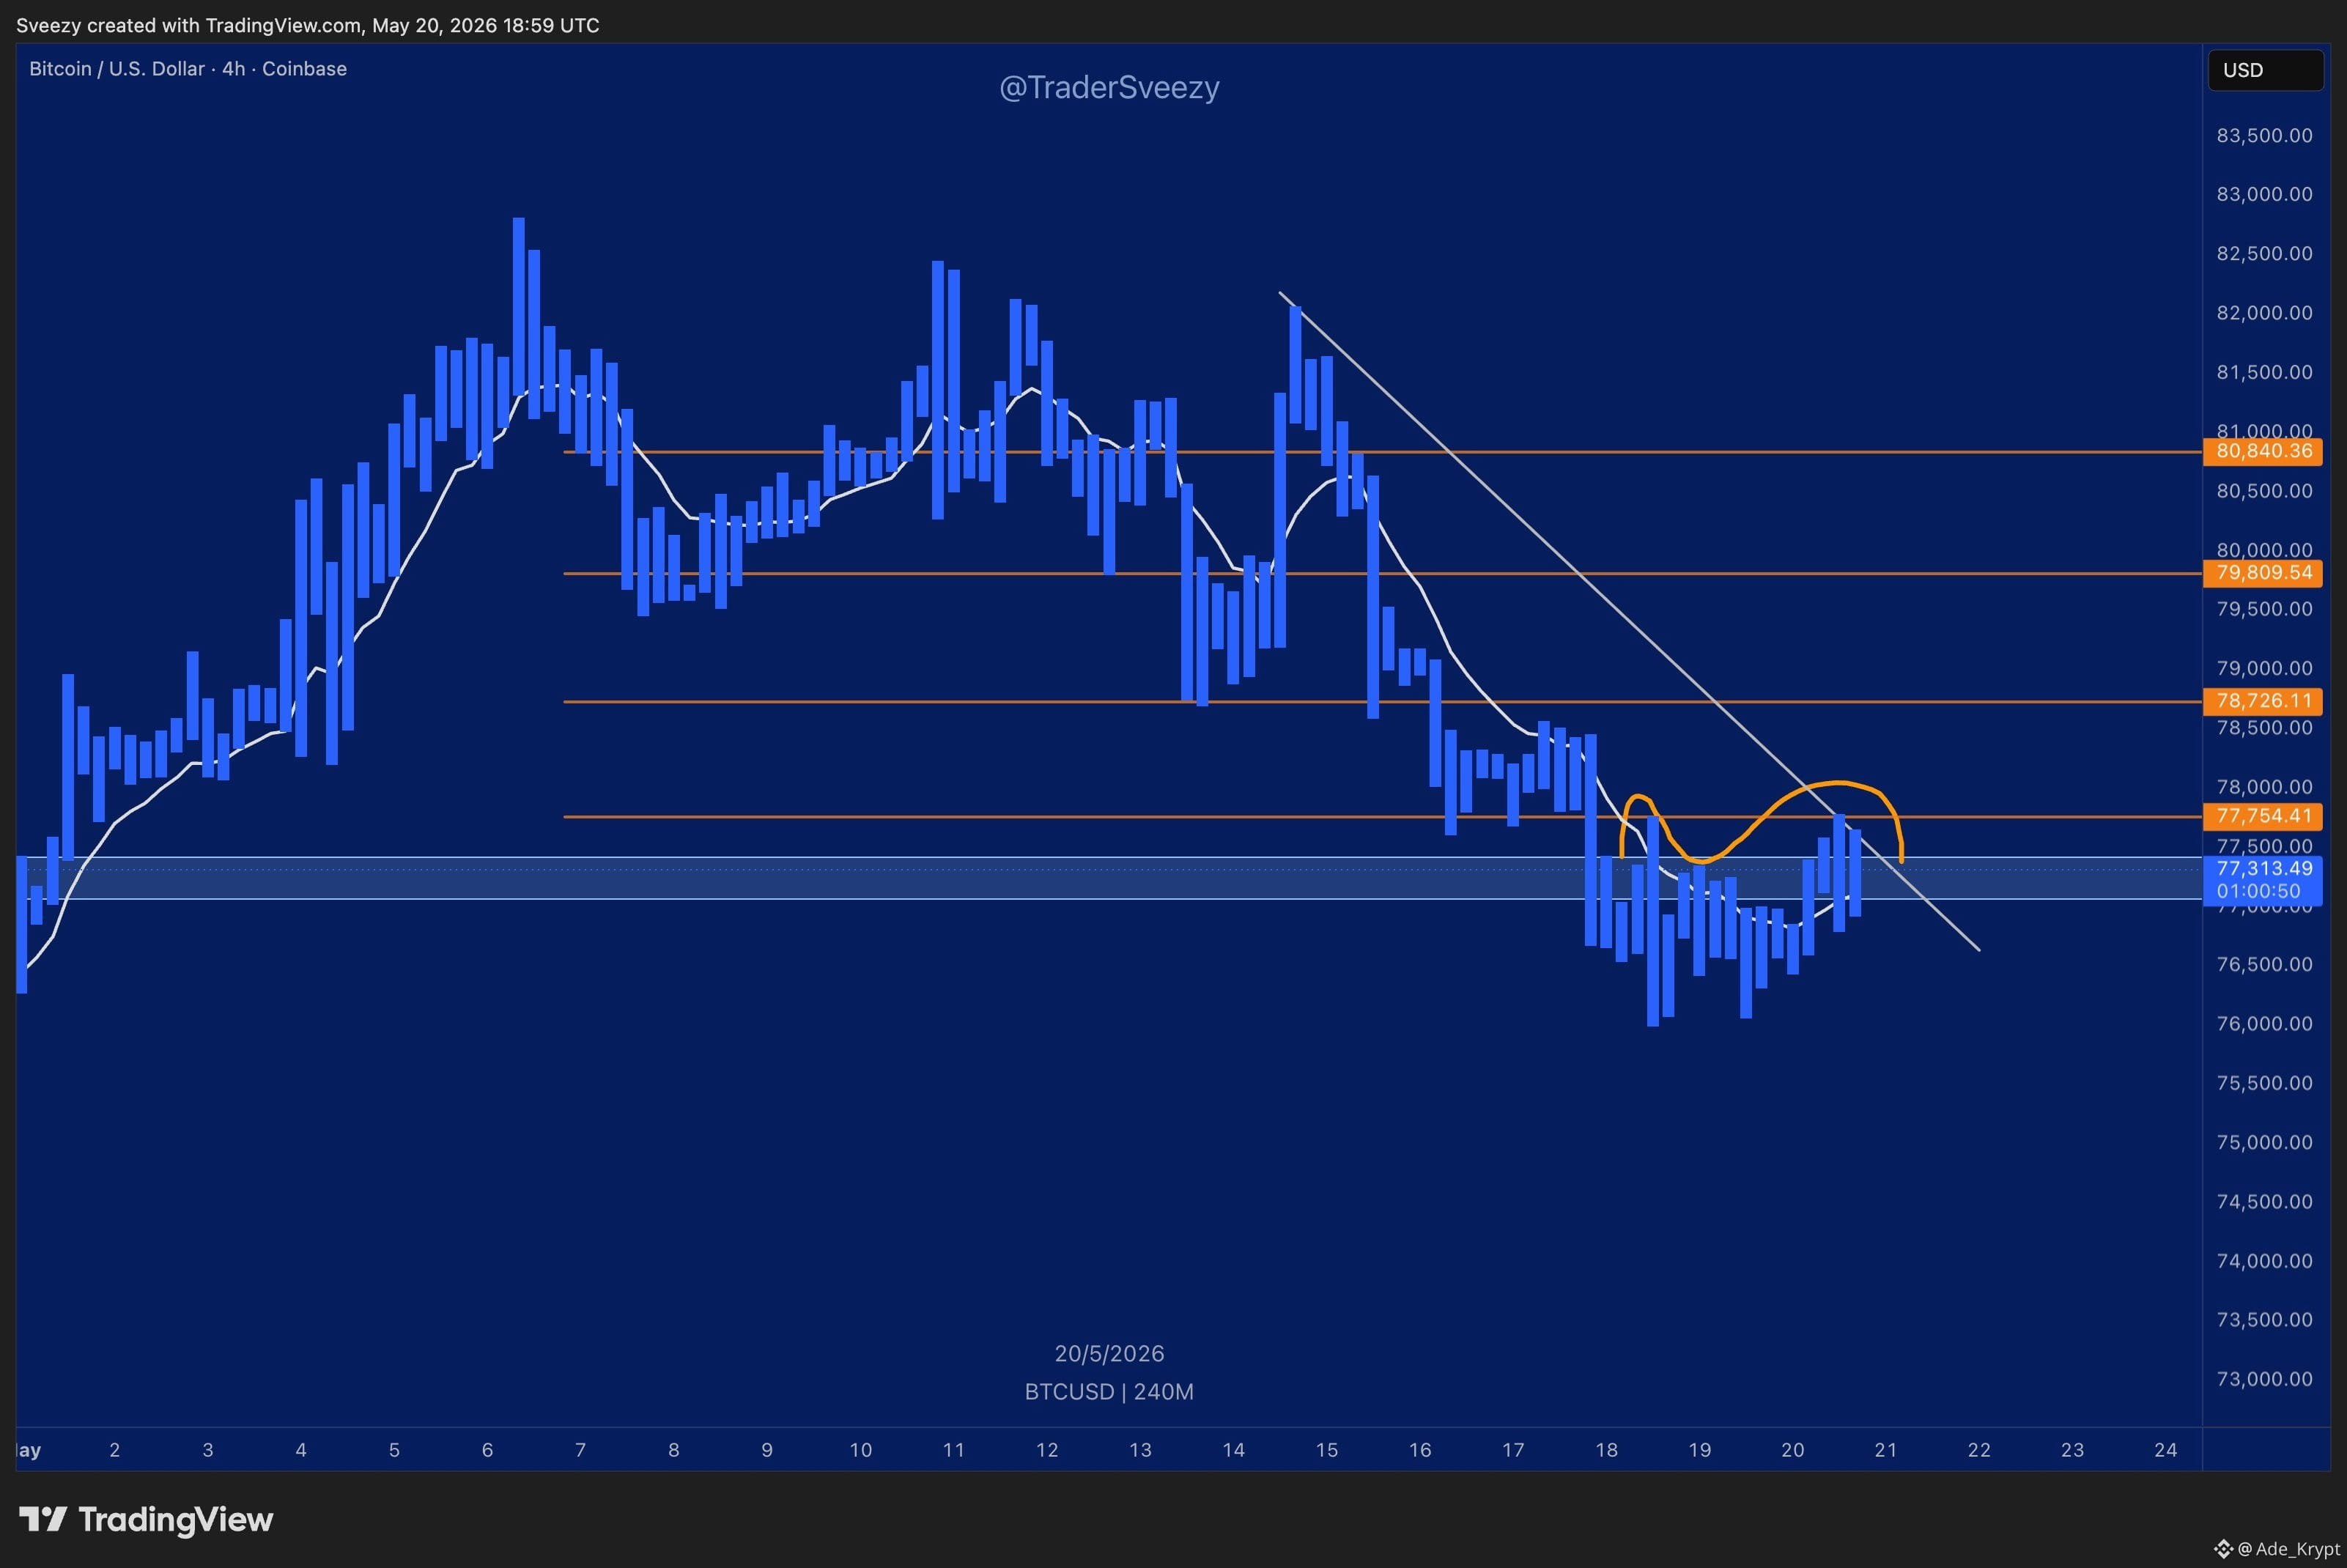
$BTC is still struggling around the $77.75k resistance zone.
At the moment, it’s limiting upside momentum, but what stands out is that sellers still haven’t managed to force a real pullback.
Price has been consolidating just below resistance for hours now.
Usually, when price keeps pressing under a resistance level without a strong rejection, it suggests momentum is building for a potential breakout.
If $BTC gets a clean move above $77.75k, there’s a good chance price accelerates into the liquidity sitting higher up.
For now, resistance remains intact, but with this kind of compression, it’s not a level I’d confidently short against.
#GoogleLaunchesGemini3.5Flash #Trump'sIranAttackDelayed
$BTC is still struggling around the $77.75k resistance zone.
At the moment, it’s limiting upside momentum, but what stands out is that sellers still haven’t managed to force a real pullback.
Price has been consolidating just below resistance for hours now.
Usually, when price keeps pressing under a resistance level without a strong rejection, it suggests momentum is building for a potential breakout.
If $BTC gets a clean move above $77.75k, there’s a good chance price accelerates into the liquidity sitting higher up.
For now, resistance remains intact, but with this kind of compression, it’s not a level I’d confidently short against.
#GoogleLaunchesGemini3.5Flash #Trump'sIranAttackDelayed
At the moment, it’s limiting upside momentum, but what stands out is that sellers still haven’t managed to force a real pullback.
Price has been consolidating just below resistance for hours now.
Usually, when price keeps pressing under a resistance level without a strong rejection, it suggests momentum is building for a potential breakout.
If $BTC gets a clean move above $77.75k, there’s a good chance price accelerates into the liquidity sitting higher up.
For now, resistance remains intact, but with this kind of compression, it’s not a level I’d confidently short against.
#GoogleLaunchesGemini3.5Flash #Trump'sIranAttackDelayed
41
18
195
746.4k
·
--
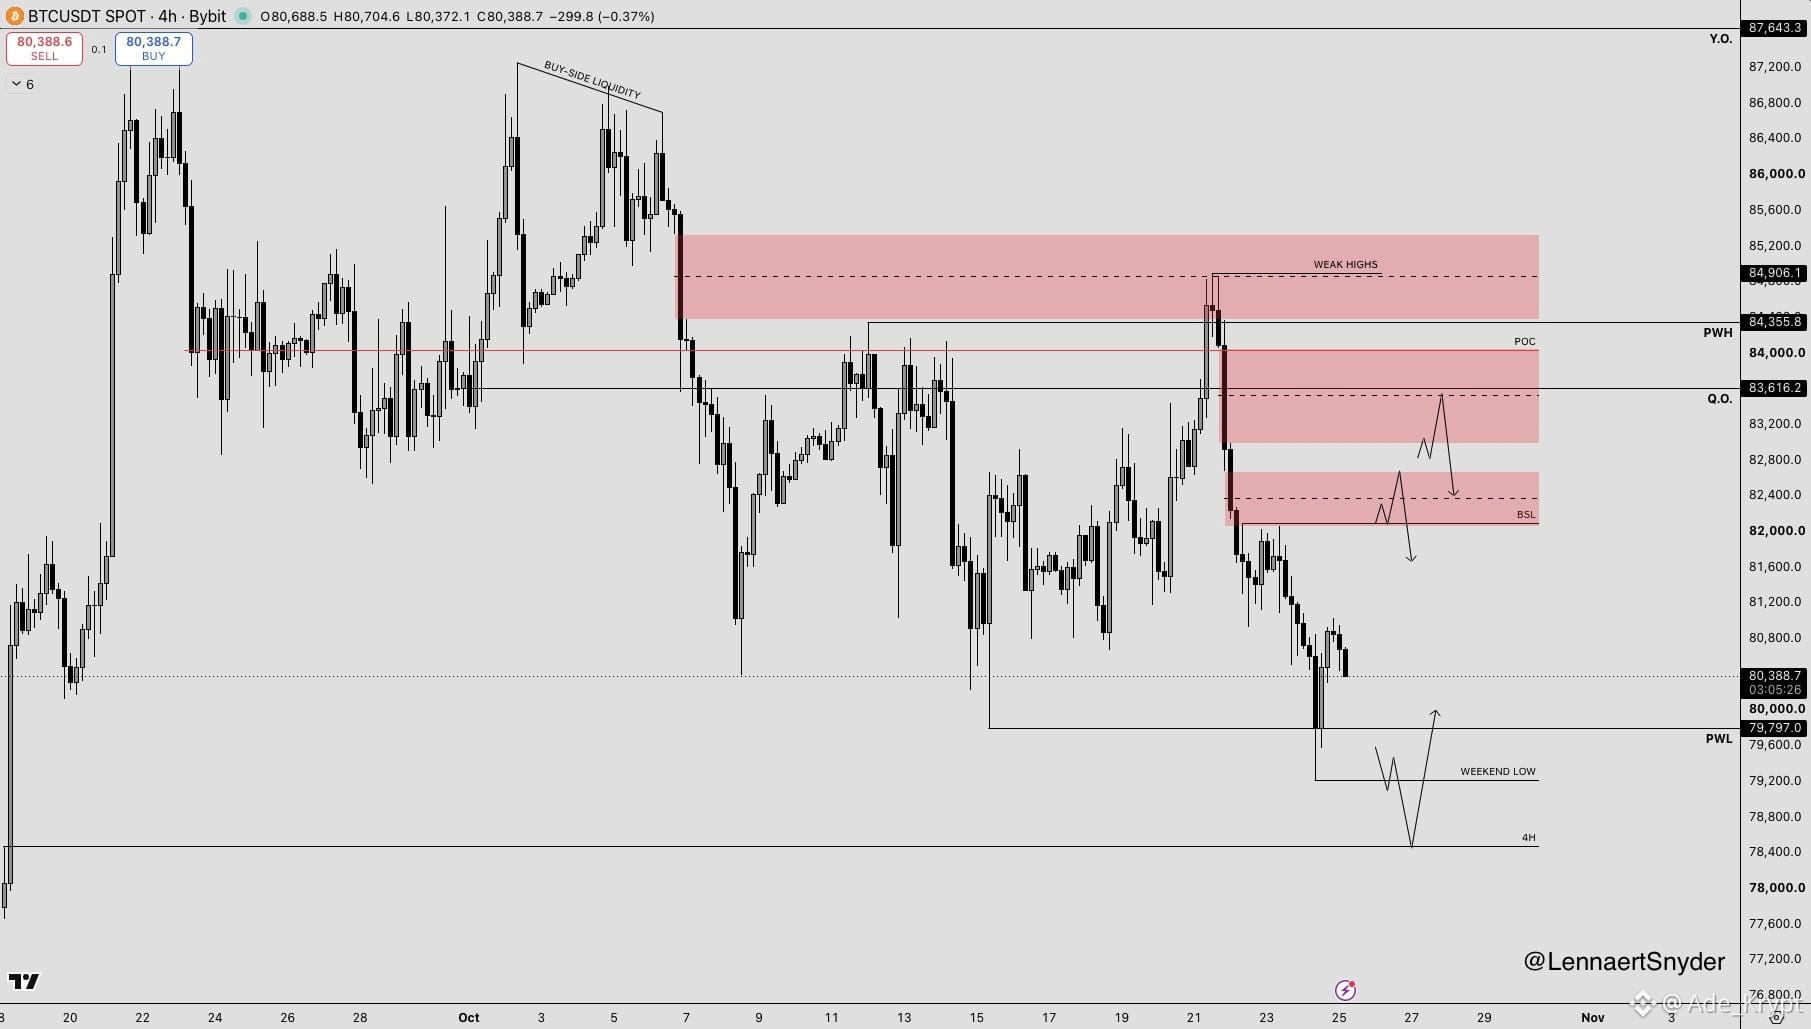
$BTC swept the $79.8K PWL and closed back above it.
It was a decent move, but since it happened on a Saturday, I give it less weight.
I don't trade weekends myself, although I know many traders who do. For those who understand weekend liquidity, this was a solid long opportunity.
The sweep has opened up new possibilities for next week after the sideways price action we've experienced.
Weekend highs and lows are often taken out during the following week.
If Bitcoin moves higher from here without sweeping the $79.2K weekend low, looking for shorts targeting that low remains a valid setup.
My short POIs sit above the $82K BSL, where price has left two significant 4H imbalances.
The first imbalance aligns with a daily imbalance, making the $82.5K area an interesting zone to watch for potential shorts after a trigger.
If price reaches the upper imbalance around $83.5K, I'll apply the same approach.
My target will be the weekend low, provided it remains unswept going into next week.
However, if BTC sweeps the current weekend low next week, I'll look for long opportunities following lower-timeframe shifts.
I'm particularly interested in the $78K–$78.4K liquidation cluster for potential longs, which also aligns with the 100% fill of the 4H imbalance.
We can never know how deep a liquidity sweep will go, so I'll wait for confirmation before entering, as usual.
If the low gets swept first, shorts can still be valid, but I'll approach them as a hedge.
#BinancePick #EarningsSeason
$BTC swept the $79.8K PWL and closed back above it.
It was a decent move, but since it happened on a Saturday, I give it less weight.
I don't trade weekends myself, although I know many traders who do. For those who understand weekend liquidity, this was a solid long opportunity.
The sweep has opened up new possibilities for next week after the sideways price action we've experienced.
Weekend highs and lows are often taken out during the following week.
If Bitcoin moves higher from here without sweeping the $79.2K weekend low, looking for shorts targeting that low remains a valid setup.
My short POIs sit above the $82K BSL, where price has left two significant 4H imbalances.
The first imbalance aligns with a daily imbalance, making the $82.5K area an interesting zone to watch for potential shorts after a trigger.
If price reaches the upper imbalance around $83.5K, I'll apply the same approach.
My target will be the weekend low, provided it remains unswept going into next week.
However, if BTC sweeps the current weekend low next week, I'll look for long opportunities following lower-timeframe shifts.
I'm particularly interested in the $78K–$78.4K liquidation cluster for potential longs, which also aligns with the 100% fill of the 4H imbalance.
We can never know how deep a liquidity sweep will go, so I'll wait for confirmation before entering, as usual.
If the low gets swept first, shorts can still be valid, but I'll approach them as a hedge.
#BinancePick #EarningsSeason
It was a decent move, but since it happened on a Saturday, I give it less weight.
I don't trade weekends myself, although I know many traders who do. For those who understand weekend liquidity, this was a solid long opportunity.
The sweep has opened up new possibilities for next week after the sideways price action we've experienced.
Weekend highs and lows are often taken out during the following week.
If Bitcoin moves higher from here without sweeping the $79.2K weekend low, looking for shorts targeting that low remains a valid setup.
My short POIs sit above the $82K BSL, where price has left two significant 4H imbalances.
The first imbalance aligns with a daily imbalance, making the $82.5K area an interesting zone to watch for potential shorts after a trigger.
If price reaches the upper imbalance around $83.5K, I'll apply the same approach.
My target will be the weekend low, provided it remains unswept going into next week.
However, if BTC sweeps the current weekend low next week, I'll look for long opportunities following lower-timeframe shifts.
I'm particularly interested in the $78K–$78.4K liquidation cluster for potential longs, which also aligns with the 100% fill of the 4H imbalance.
We can never know how deep a liquidity sweep will go, so I'll wait for confirmation before entering, as usual.
If the low gets swept first, shorts can still be valid, but I'll approach them as a hedge.
#BinancePick #EarningsSeason
107
·
--
Switzerland Approves Its First Spot $BTC ETF
Swiss regulator FINMA has approved the country’s first Bitcoin-only ETF for public offering.
BIT Asset Management’s BBIT will allow retail investors to gain direct exposure to $BTC through a regulated investment fund.
The ETF is set to trade on the SIX Swiss Exchange, with a launch expected in November.
However, FINMA cautions that Bitcoin remains highly volatile, even when accessed through a regulated investment product.
#EarningsSeason #BitcoinHashrateHitsSevenMonthHigh
Switzerland Approves Its First Spot $BTC ETF
Swiss regulator FINMA has approved the country’s first Bitcoin-only ETF for public offering.
BIT Asset Management’s BBIT will allow retail investors to gain direct exposure to $BTC through a regulated investment fund.
The ETF is set to trade on the SIX Swiss Exchange, with a launch expected in November.
However, FINMA cautions that Bitcoin remains highly volatile, even when accessed through a regulated investment product.
#EarningsSeason #BitcoinHashrateHitsSevenMonthHigh
Swiss regulator FINMA has approved the country’s first Bitcoin-only ETF for public offering.
BIT Asset Management’s BBIT will allow retail investors to gain direct exposure to $BTC through a regulated investment fund.
The ETF is set to trade on the SIX Swiss Exchange, with a launch expected in November.
However, FINMA cautions that Bitcoin remains highly volatile, even when accessed through a regulated investment product.
#EarningsSeason #BitcoinHashrateHitsSevenMonthHigh

188
·
--
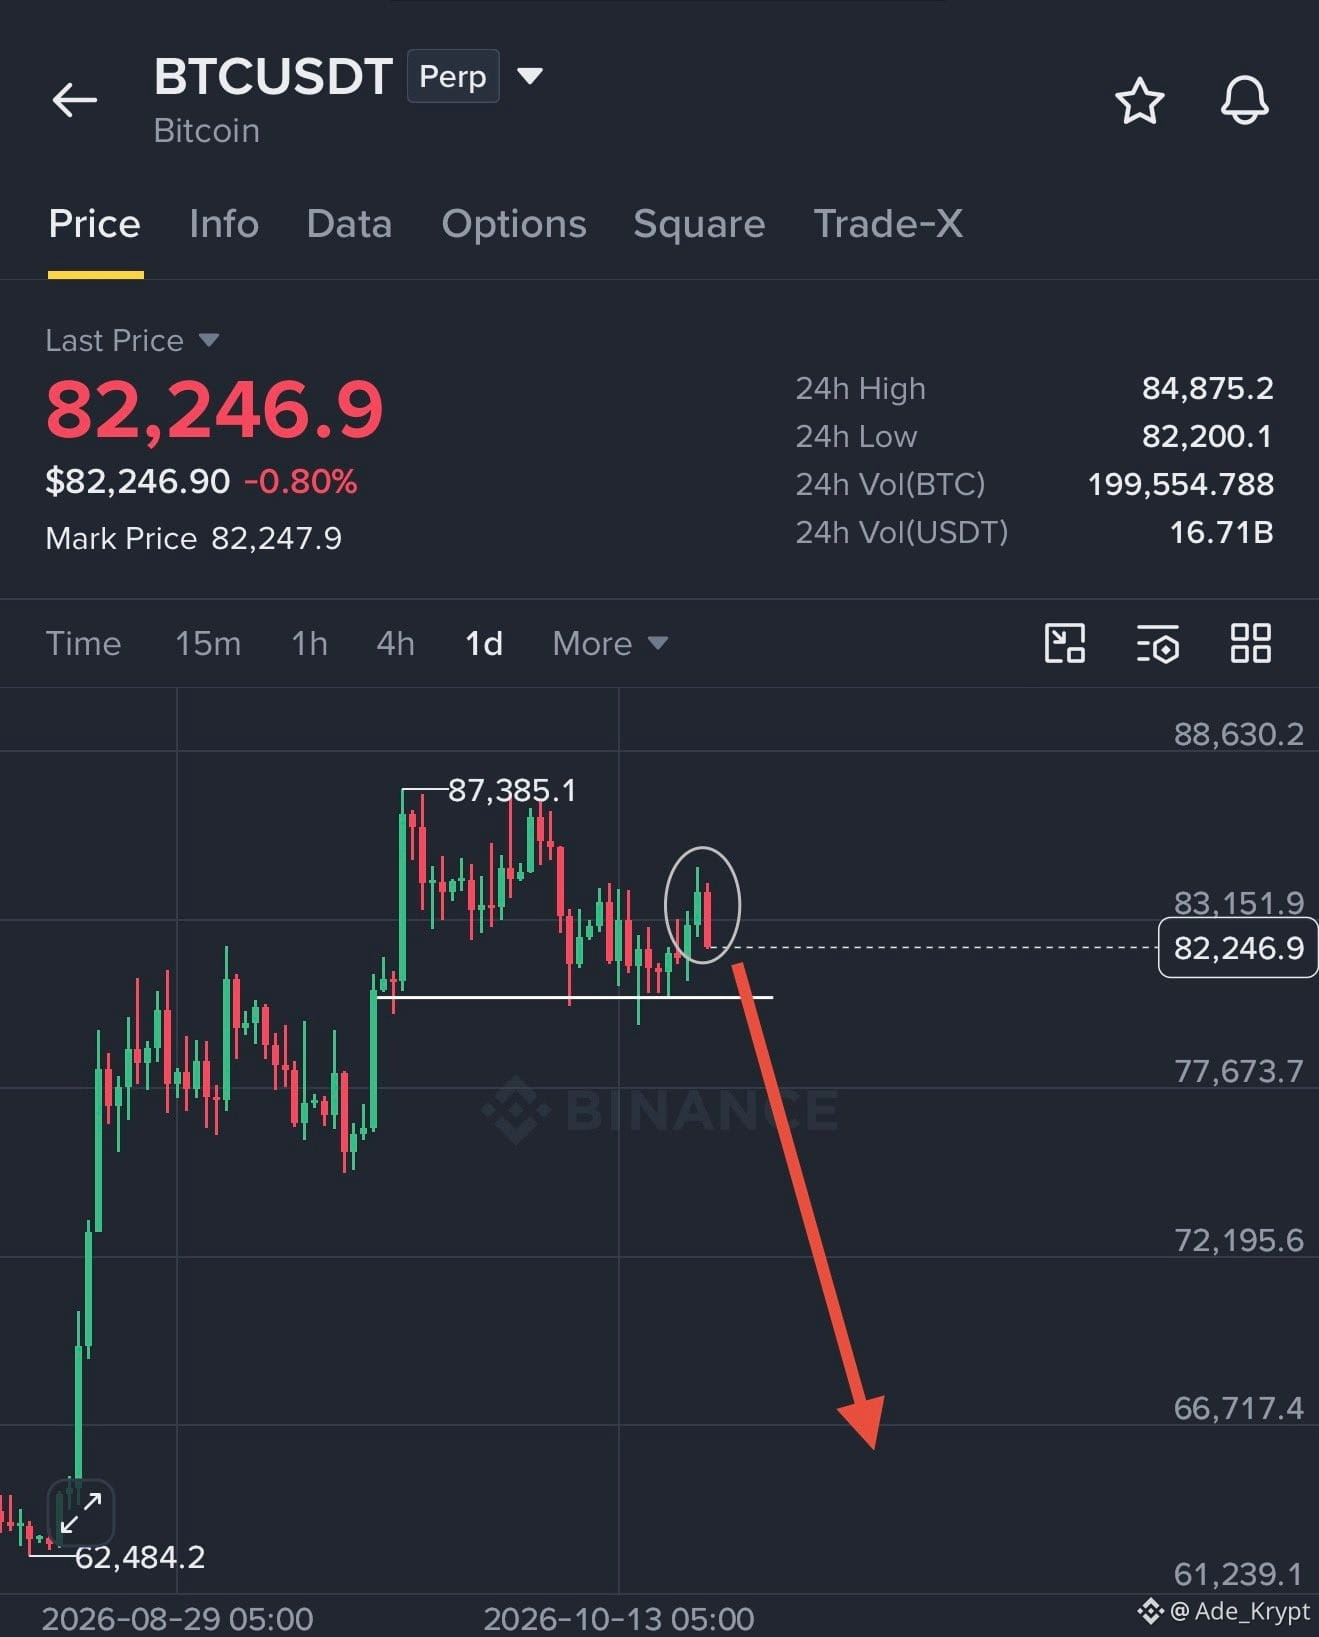
$BTC daily candle closed with yet another fakeout.
Bitcoin swept both the lows and highs but still ended up closing within the same range.
The $82K–$82.8K zone is the key area to watch now. Bulls need to defend this support. If it breaks decisively, downside momentum could accelerate quickly.
Don’t get caught chasing short-term pumps. The bigger market structure remains weak, so stay patient and manage risk carefully.
#BinancePick #TeslaSlides5%PreMarket
$BTC daily candle closed with yet another fakeout.
Bitcoin swept both the lows and highs but still ended up closing within the same range.
The $82K–$82.8K zone is the key area to watch now. Bulls need to defend this support. If it breaks decisively, downside momentum could accelerate quickly.
Don’t get caught chasing short-term pumps. The bigger market structure remains weak, so stay patient and manage risk carefully.
#BinancePick #TeslaSlides5%PreMarket
Bitcoin swept both the lows and highs but still ended up closing within the same range.
The $82K–$82.8K zone is the key area to watch now. Bulls need to defend this support. If it breaks decisively, downside momentum could accelerate quickly.
Don’t get caught chasing short-term pumps. The bigger market structure remains weak, so stay patient and manage risk carefully.
#BinancePick #TeslaSlides5%PreMarket
1
171
·
--
What Makes Liberdus Different From Traditional Messaging Apps?
Most messaging apps require personal information, such as a phone number or email, to get started. But should sharing private information be the price of online communication?
Liberdus takes a different approach by focusing on privacy, decentralization, and user control.
🔹 Private messaging
🔹 Group chats and file sharing
🔹 Voice and video calls
🔹 No phone number or email required for registration
🔹 A decentralized alternative to traditional messaging platforms
As the Web3 ecosystem grows on Binance Square, projects like Liberdus bring important conversations about digital privacy and user control into focus.
Of course, usability, security, and wider adoption will play important roles in its long-term success.
🔐 Privacy should be a choice, not an afterthought.
Would you try a decentralized messaging app like Liberdus? Share your thoughts below! 👇
$BNB $BTC $XRP #EarningsSeason #EliceReboundsToDailyLimit
What Makes Liberdus Different From Traditional Messaging Apps?
Most messaging apps require personal information, such as a phone number or email, to get started. But should sharing private information be the price of online communication?
Liberdus takes a different approach by focusing on privacy, decentralization, and user control.
🔹 Private messaging
🔹 Group chats and file sharing
🔹 Voice and video calls
🔹 No phone number or email required for registration
🔹 A decentralized alternative to traditional messaging platforms
As the Web3 ecosystem grows on Binance Square, projects like Liberdus bring important conversations about digital privacy and user control into focus.
Of course, usability, security, and wider adoption will play important roles in its long-term success.
🔐 Privacy should be a choice, not an afterthought.
Would you try a decentralized messaging app like Liberdus? Share your thoughts below! 👇
$BNB $BTC $XRP #EarningsSeason #EliceReboundsToDailyLimit
Most messaging apps require personal information, such as a phone number or email, to get started. But should sharing private information be the price of online communication?
Liberdus takes a different approach by focusing on privacy, decentralization, and user control.
🔹 Private messaging
🔹 Group chats and file sharing
🔹 Voice and video calls
🔹 No phone number or email required for registration
🔹 A decentralized alternative to traditional messaging platforms
As the Web3 ecosystem grows on Binance Square, projects like Liberdus bring important conversations about digital privacy and user control into focus.
Of course, usability, security, and wider adoption will play important roles in its long-term success.
🔐 Privacy should be a choice, not an afterthought.
Would you try a decentralized messaging app like Liberdus? Share your thoughts below! 👇
$BNB $BTC $XRP #EarningsSeason #EliceReboundsToDailyLimit

137
·
--
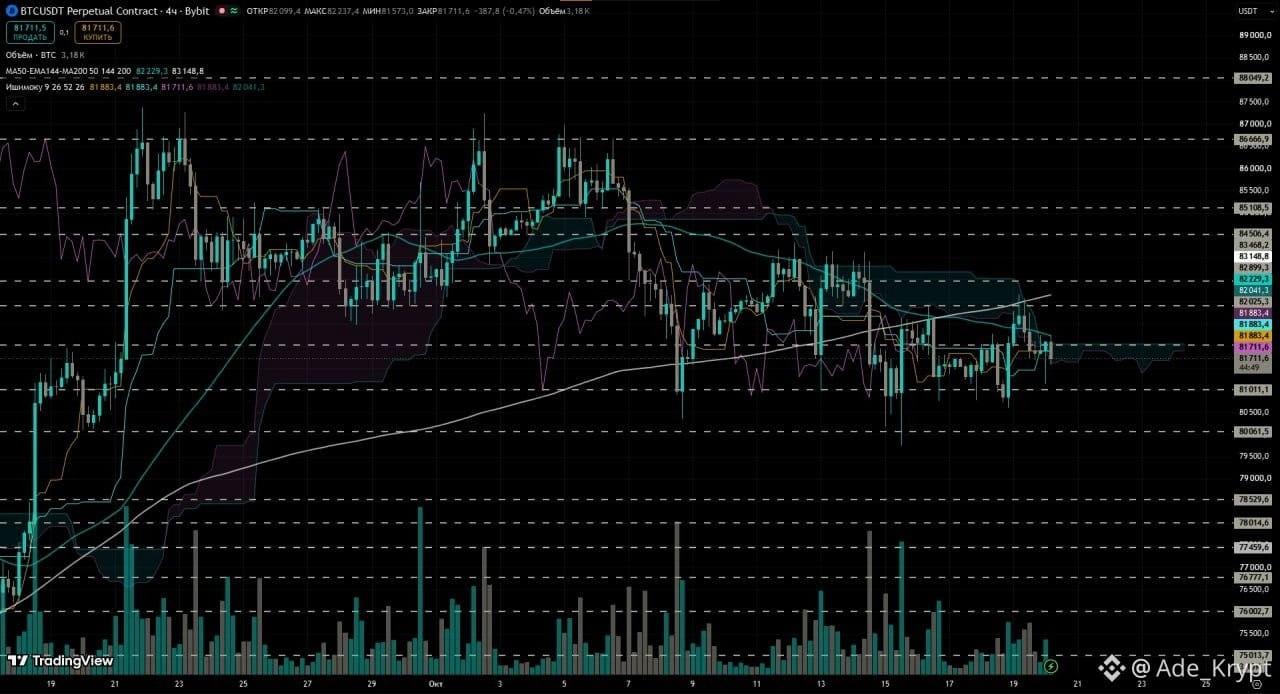
$BTC buyers are showing signs of weakness.
The attempt to reclaim the 200 MA failed, triggering another pullback. Price is now testing the lower boundary of the cloud, and holding this area is crucial for maintaining the bullish outlook.
If $BTC breaks lower, we could see a move toward $80,000, where support may also come under pressure. Without renewed buying strength, the downside scenario becomes increasingly likely.
However, the bullish scenario is still alive. BTC could consolidate between $81,000 and $83,000 before making another attempt to move higher. For now, the key is to watch how price reacts at these levels.
#GoogleSetsUAELicensingRulesForCryptoAds #BitMineAdds12535ETH
$BTC buyers are showing signs of weakness.
The attempt to reclaim the 200 MA failed, triggering another pullback. Price is now testing the lower boundary of the cloud, and holding this area is crucial for maintaining the bullish outlook.
If $BTC breaks lower, we could see a move toward $80,000, where support may also come under pressure. Without renewed buying strength, the downside scenario becomes increasingly likely.
However, the bullish scenario is still alive. BTC could consolidate between $81,000 and $83,000 before making another attempt to move higher. For now, the key is to watch how price reacts at these levels.
#GoogleSetsUAELicensingRulesForCryptoAds #BitMineAdds12535ETH
The attempt to reclaim the 200 MA failed, triggering another pullback. Price is now testing the lower boundary of the cloud, and holding this area is crucial for maintaining the bullish outlook.
If $BTC breaks lower, we could see a move toward $80,000, where support may also come under pressure. Without renewed buying strength, the downside scenario becomes increasingly likely.
However, the bullish scenario is still alive. BTC could consolidate between $81,000 and $83,000 before making another attempt to move higher. For now, the key is to watch how price reacts at these levels.
#GoogleSetsUAELicensingRulesForCryptoAds #BitMineAdds12535ETH
218
·
--
Green Monday, everyone!
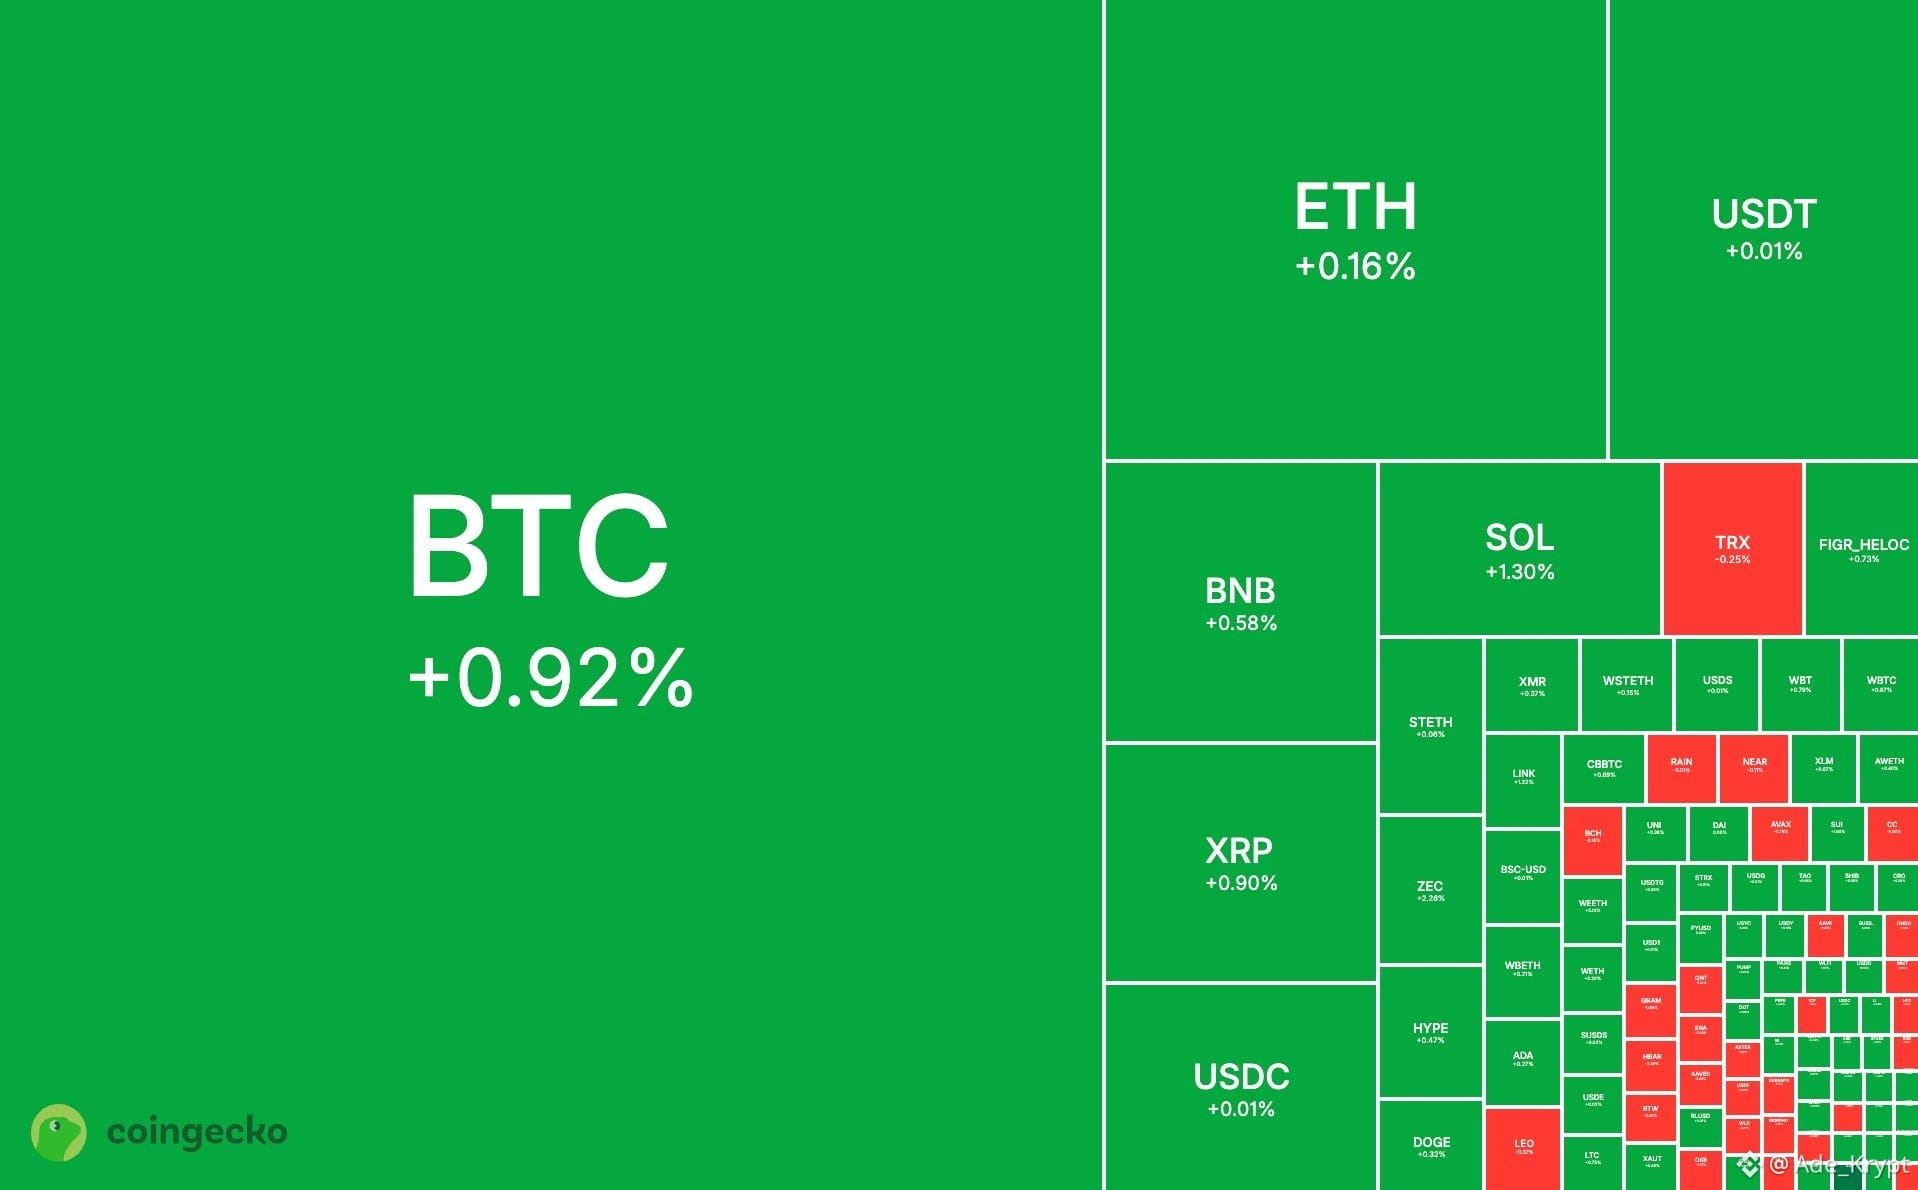
$BTC and $ETH are showing modest gains as fears surrounding Black Monday fade on the 39th anniversary of the 1987 market crash.
The recovery looks promising, but the real test is whether buyers can maintain momentum through the US market open.
Will panic sellers give way to stronger hands stepping in?
If Bitcoin and Ethereum hold their gains into the daily close, it could set a more bullish tone for the rest of the week.
Let's see if the bulls can deliver.
#KOSPIOpens3.17%Lower #ChinaQ3GDPGrowthQuickensTo4.5%
Green Monday, everyone!
$BTC and $ETH are showing modest gains as fears surrounding Black Monday fade on the 39th anniversary of the 1987 market crash.
The recovery looks promising, but the real test is whether buyers can maintain momentum through the US market open.
Will panic sellers give way to stronger hands stepping in?
If Bitcoin and Ethereum hold their gains into the daily close, it could set a more bullish tone for the rest of the week.
Let's see if the bulls can deliver.
#KOSPIOpens3.17%Lower #ChinaQ3GDPGrowthQuickensTo4.5%
$BTC and $ETH are showing modest gains as fears surrounding Black Monday fade on the 39th anniversary of the 1987 market crash.
The recovery looks promising, but the real test is whether buyers can maintain momentum through the US market open.
Will panic sellers give way to stronger hands stepping in?
If Bitcoin and Ethereum hold their gains into the daily close, it could set a more bullish tone for the rest of the week.
Let's see if the bulls can deliver.
#KOSPIOpens3.17%Lower #ChinaQ3GDPGrowthQuickensTo4.5%
174
·
--
Messaging is an important part of our daily lives, but privacy and control over our conversations matter just as much.
Liberdus is building a different approach to digital communication, putting privacy, decentralization, and user control at the center.
Unlike traditional messaging apps that depend on centralized infrastructure, Liberdus is designed to offer private messaging, file sharing, voice and video calls, and payments within one ecosystem.
With no phone number or email required for registration, users can enjoy greater privacy and more control over their digital identities.
For me, the future of messaging should be about freedom, security, and ownership. That's why Liberdus deserves attention.
$BTC $XRP #NEARRisesNearly10% #USSeptemberPPIRisesTo6.3%
Messaging is an important part of our daily lives, but privacy and control over our conversations matter just as much.
Liberdus is building a different approach to digital communication, putting privacy, decentralization, and user control at the center.
Unlike traditional messaging apps that depend on centralized infrastructure, Liberdus is designed to offer private messaging, file sharing, voice and video calls, and payments within one ecosystem.
With no phone number or email required for registration, users can enjoy greater privacy and more control over their digital identities.
For me, the future of messaging should be about freedom, security, and ownership. That's why Liberdus deserves attention.
$BTC $XRP #NEARRisesNearly10% #USSeptemberPPIRisesTo6.3%
Liberdus is building a different approach to digital communication, putting privacy, decentralization, and user control at the center.
Unlike traditional messaging apps that depend on centralized infrastructure, Liberdus is designed to offer private messaging, file sharing, voice and video calls, and payments within one ecosystem.
With no phone number or email required for registration, users can enjoy greater privacy and more control over their digital identities.
For me, the future of messaging should be about freedom, security, and ownership. That's why Liberdus deserves attention.
$BTC $XRP #NEARRisesNearly10% #USSeptemberPPIRisesTo6.3%

204
·
--
$BTC Update: Holding the Bounce, Testing $81.2K
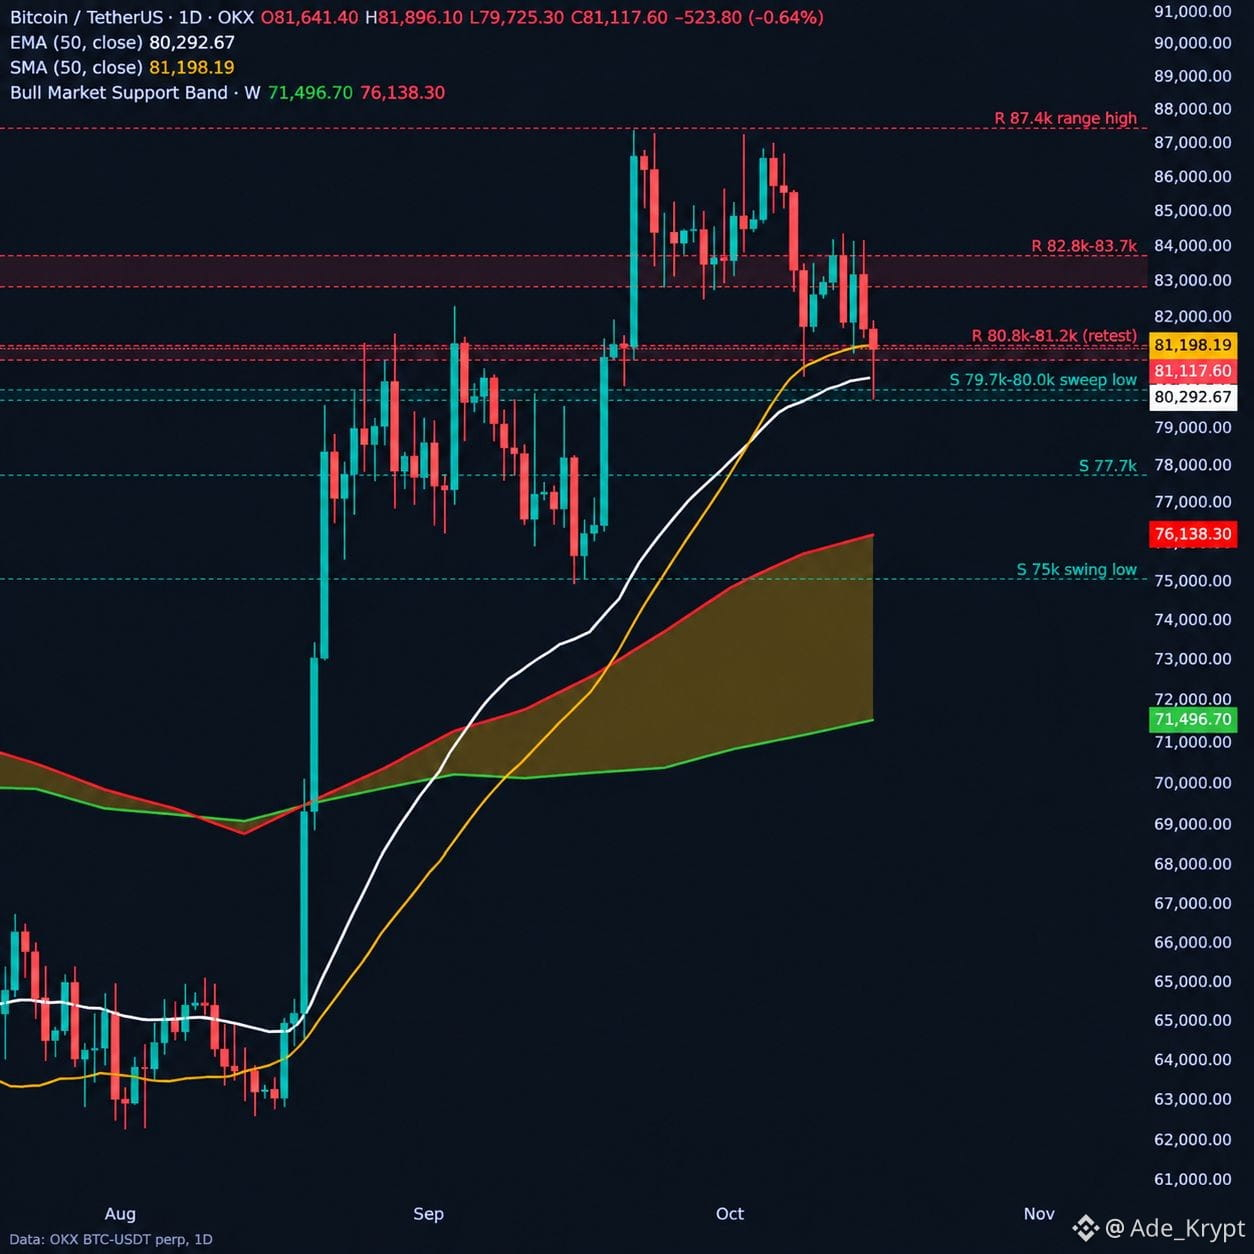
Bitcoin is holding its bounce after sweeping the $80K level.
$BTC rebounded from $79,725 to $81,390 and has since consolidated around $80.9K–$81.1K. Price is now testing the $81.2K area, where the SMA50 sits, alongside the zone that broke down earlier today.
So far, there’s no strong follow-through, just consolidation.
RSI is around 45, while price is trading near the lower Bollinger Band. Open interest has gradually recovered, with roughly $300M returning after the flush. Funding remains flat.
Retail long/short is at 1.80, while top traders remain slightly net short at 0.94.
Meanwhile, QQQ is down 1.3%, adding pressure to the broader market.
Key Levels to Watch:
. Resistance: $80.8K–$81.2K, $82.8K–$83.7K, then $87.4K.
. Support: $80.3K (EMA50), $79.7K–$80K, followed by $77.7K and $75K.
My Take:
A daily close above $81.2K would strengthen the sweep,and,reclaim setup and suggest buyers are regaining control.
However, rejection at this level could send BTC back toward $80.3K, with the $79.7K sweep low becoming the next critical level.
For now, confirmation matters more than the bounce itself.
#CPIWatch #EtherTook60%OfCryptoLiquidations
$BTC Update: Holding the Bounce, Testing $81.2K
Bitcoin is holding its bounce after sweeping the $80K level.
$BTC rebounded from $79,725 to $81,390 and has since consolidated around $80.9K–$81.1K. Price is now testing the $81.2K area, where the SMA50 sits, alongside the zone that broke down earlier today.
So far, there’s no strong follow-through, just consolidation.
RSI is around 45, while price is trading near the lower Bollinger Band. Open interest has gradually recovered, with roughly $300M returning after the flush. Funding remains flat.
Retail long/short is at 1.80, while top traders remain slightly net short at 0.94.
Meanwhile, QQQ is down 1.3%, adding pressure to the broader market.
Key Levels to Watch:
. Resistance: $80.8K–$81.2K, $82.8K–$83.7K, then $87.4K.
. Support: $80.3K (EMA50), $79.7K–$80K, followed by $77.7K and $75K.
My Take:
A daily close above $81.2K would strengthen the sweep,and,reclaim setup and suggest buyers are regaining control.
However, rejection at this level could send BTC back toward $80.3K, with the $79.7K sweep low becoming the next critical level.
For now, confirmation matters more than the bounce itself.
#CPIWatch #EtherTook60%OfCryptoLiquidations
Bitcoin is holding its bounce after sweeping the $80K level.
$BTC rebounded from $79,725 to $81,390 and has since consolidated around $80.9K–$81.1K. Price is now testing the $81.2K area, where the SMA50 sits, alongside the zone that broke down earlier today.
So far, there’s no strong follow-through, just consolidation.
RSI is around 45, while price is trading near the lower Bollinger Band. Open interest has gradually recovered, with roughly $300M returning after the flush. Funding remains flat.
Retail long/short is at 1.80, while top traders remain slightly net short at 0.94.
Meanwhile, QQQ is down 1.3%, adding pressure to the broader market.
Key Levels to Watch:
. Resistance: $80.8K–$81.2K, $82.8K–$83.7K, then $87.4K.
. Support: $80.3K (EMA50), $79.7K–$80K, followed by $77.7K and $75K.
My Take:
A daily close above $81.2K would strengthen the sweep,and,reclaim setup and suggest buyers are regaining control.
However, rejection at this level could send BTC back toward $80.3K, with the $79.7K sweep low becoming the next critical level.
For now, confirmation matters more than the bounce itself.
#CPIWatch #EtherTook60%OfCryptoLiquidations
1
668
·
--
Bitcoin didn’t react well to today’s inflation data.
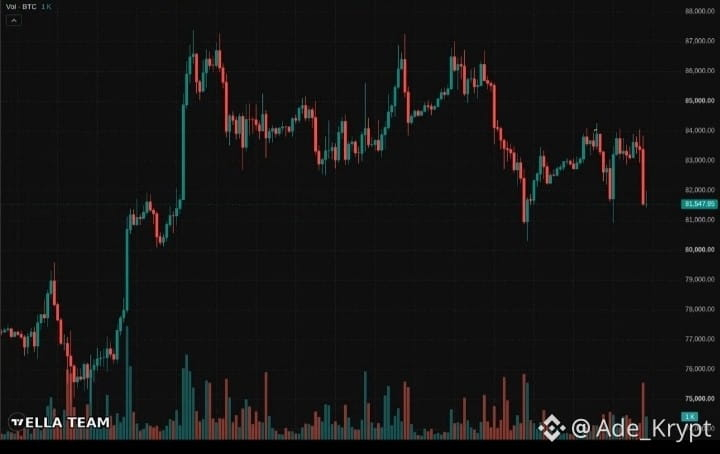
$BTC initially tried to stay around $84K, but the recovery lost momentum. Once $83K gave way, selling pressure picked up quickly, pushing price back toward $81.5K.
That’s the key level to watch now.
A reclaim of $83K could help ease the bearish pressure. But if $81.5K fails to hold, the next downside area sits around $80K–$80.5K.
The market still looks weak, but the structure isn’t completely broken yet. Buyers need to step in soon to prevent further downside.
#CPIWatch #BastionPressesSkyAIOverSOLSales
Bitcoin didn’t react well to today’s inflation data.
$BTC initially tried to stay around $84K, but the recovery lost momentum. Once $83K gave way, selling pressure picked up quickly, pushing price back toward $81.5K.
That’s the key level to watch now.
A reclaim of $83K could help ease the bearish pressure. But if $81.5K fails to hold, the next downside area sits around $80K–$80.5K.
The market still looks weak, but the structure isn’t completely broken yet. Buyers need to step in soon to prevent further downside.
#CPIWatch #BastionPressesSkyAIOverSOLSales
$BTC initially tried to stay around $84K, but the recovery lost momentum. Once $83K gave way, selling pressure picked up quickly, pushing price back toward $81.5K.
That’s the key level to watch now.
A reclaim of $83K could help ease the bearish pressure. But if $81.5K fails to hold, the next downside area sits around $80K–$80.5K.
The market still looks weak, but the structure isn’t completely broken yet. Buyers need to step in soon to prevent further downside.
#CPIWatch #BastionPressesSkyAIOverSOLSales
237
·
--
$BTC is making small moves to the upside again, and people are turning bullish way too soon
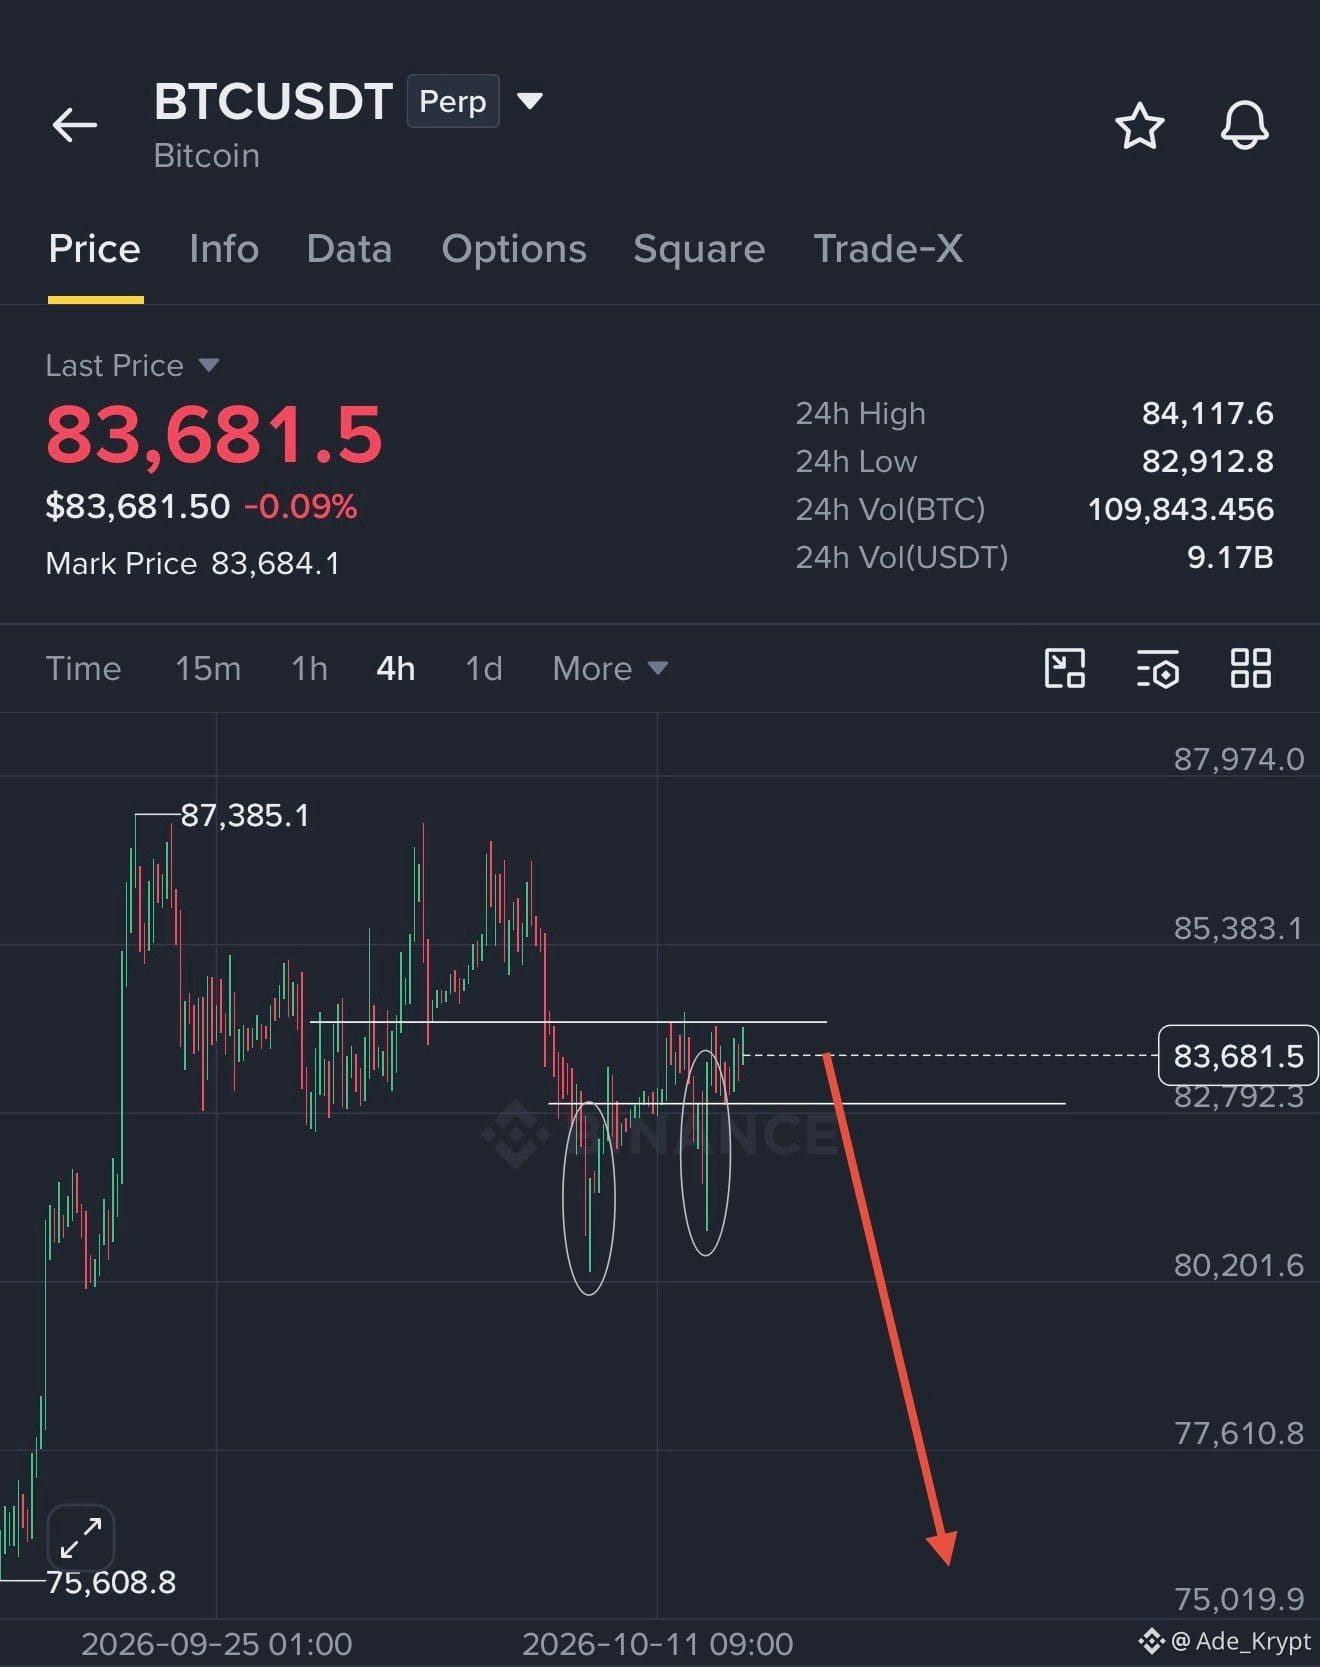
Bitcoin got rejected at $87.3K and is now struggling to reclaim $85K on the 4H timeframe.
Those two long wicks around $80K suggest there’s still plenty of liquidity sitting below.
My key level is $82K–$82.5K. If that support breaks, I’m watching $80K first, followed by the $77K–$78K zone.
These little pumps haven’t changed the bigger picture for me.
I’m still bearish on $BTC.
Don’t get caught becoming exit liquidity.
#OptimismOPRises19.98% #CPIWatch
$BTC is making small moves to the upside again, and people are turning bullish way too soon
Bitcoin got rejected at $87.3K and is now struggling to reclaim $85K on the 4H timeframe.
Those two long wicks around $80K suggest there’s still plenty of liquidity sitting below.
My key level is $82K–$82.5K. If that support breaks, I’m watching $80K first, followed by the $77K–$78K zone.
These little pumps haven’t changed the bigger picture for me.
I’m still bearish on $BTC .
Don’t get caught becoming exit liquidity.
#OptimismOPRises19.98% #CPIWatch
Bitcoin got rejected at $87.3K and is now struggling to reclaim $85K on the 4H timeframe.
Those two long wicks around $80K suggest there’s still plenty of liquidity sitting below.
My key level is $82K–$82.5K. If that support breaks, I’m watching $80K first, followed by the $77K–$78K zone.
These little pumps haven’t changed the bigger picture for me.
I’m still bearish on $BTC .
Don’t get caught becoming exit liquidity.
#OptimismOPRises19.98% #CPIWatch
2
165
·
--

Article
Liberdus: Building a More Private and Decentralized Digital FutureIn today's digital world, communication has become easier than ever, but protecting our privacy is becoming increasingly important. Many messaging platforms depend on centralized infrastructure and require users to share personal information during registration. This raises important questions about data ownership, digital freedom, and how much control people truly have over their online identities. This is where Liberdus stands out.
What Makes Liberdus Different?
Liberdus is building a decentralized communication ecosystem designed to give users greater privacy, freedom, and control over their digital interactions. Rather than relying entirely on traditional centralized systems, its approach focuses on decentralization and reducing unnecessary dependence on personal information.
One of its key features is the ability to create identities without requiring a phone number or email address. This offers an alternative for people who value privacy and want to communicate without unnecessarily exposing their personal details.
Liberdus also supports private messaging, group conversations, file sharing, voice and video communication, and multiple identities. With end-to-end encryption and a focus on quantum-resistant security, the project aims to strengthen how people communicate in an increasingly connected world.
Why Is Liberdus Important?
Digital privacy is not just about hiding information. It is about having the freedom to communicate, maintain control over personal data, and decide how our digital identities are used.
As concerns about data breaches, surveillance, and unauthorized access continue to grow, decentralized platforms offer an alternative worth exploring. Liberdus seeks to address these challenges by combining communication and payments within a broader ecosystem.
Its native token, LIB, adds another dimension by connecting the project's economic activity with its decentralized network.
Looking Ahead
I believe projects like Liberdus deserve attention because the future of technology should not focus only on speed and convenience. Privacy, security, accessibility, and user ownership matter just as much.
Liberdus is working toward a future where people can communicate with greater independence and control.
For me, the real value of Liberdus lies in its vision: putting users, privacy, and digital freedom at the center of online communication.
As the ecosystem develops, adoption, usability, security, and real,world utility will be important factors to watch.
Explore more: liberdus.com
Always do your own research before making investment decisions involving LIB.
$BTC $XRP #EvernorthNasdaqDebutClosesDown1.05% #SKHynixSharesDrop7.1%
Liberdus: Building a More Private and Decentralized Digital Future
In today's digital world, communication has become easier than ever, but protecting our privacy is becoming increasingly important. Many messaging platforms depend on centralized infrastructure and require users to share personal information during registration. This raises important questions about data ownership, digital freedom, and how much control people truly have over their online identities. This is where Liberdus stands out.
What Makes Liberdus Different?
Liberdus is building a decentralized communication ecosystem designed to give users greater privacy, freedom, and control over their digital interactions. Rather than relying entirely on traditional centralized systems, its approach focuses on decentralization and reducing unnecessary dependence on personal information.
One of its key features is the ability to create identities without requiring a phone number or email address. This offers an alternative for people who value privacy and want to communicate without unnecessarily exposing their personal details.
Liberdus also supports private messaging, group conversations, file sharing, voice and video communication, and multiple identities. With end-to-end encryption and a focus on quantum-resistant security, the project aims to strengthen how people communicate in an increasingly connected world.
Why Is Liberdus Important?
Digital privacy is not just about hiding information. It is about having the freedom to communicate, maintain control over personal data, and decide how our digital identities are used.
As concerns about data breaches, surveillance, and unauthorized access continue to grow, decentralized platforms offer an alternative worth exploring. Liberdus seeks to address these challenges by combining communication and payments within a broader ecosystem.
Its native token, LIB, adds another dimension by connecting the project's economic activity with its decentralized network.
Looking Ahead
I believe projects like Liberdus deserve attention because the future of technology should not focus only on speed and convenience. Privacy, security, accessibility, and user ownership matter just as much.
Liberdus is working toward a future where people can communicate with greater independence and control.
For me, the real value of Liberdus lies in its vision: putting users, privacy, and digital freedom at the center of online communication.
As the ecosystem develops, adoption, usability, security, and real,world utility will be important factors to watch.
Explore more: liberdus.com
Always do your own research before making investment decisions involving LIB.
$BTC $XRP #EvernorthNasdaqDebutClosesDown1.05% #SKHynixSharesDrop7.1%
What Makes Liberdus Different?
Liberdus is building a decentralized communication ecosystem designed to give users greater privacy, freedom, and control over their digital interactions. Rather than relying entirely on traditional centralized systems, its approach focuses on decentralization and reducing unnecessary dependence on personal information.
One of its key features is the ability to create identities without requiring a phone number or email address. This offers an alternative for people who value privacy and want to communicate without unnecessarily exposing their personal details.
Liberdus also supports private messaging, group conversations, file sharing, voice and video communication, and multiple identities. With end-to-end encryption and a focus on quantum-resistant security, the project aims to strengthen how people communicate in an increasingly connected world.
Why Is Liberdus Important?
Digital privacy is not just about hiding information. It is about having the freedom to communicate, maintain control over personal data, and decide how our digital identities are used.
As concerns about data breaches, surveillance, and unauthorized access continue to grow, decentralized platforms offer an alternative worth exploring. Liberdus seeks to address these challenges by combining communication and payments within a broader ecosystem.
Its native token, LIB, adds another dimension by connecting the project's economic activity with its decentralized network.
Looking Ahead
I believe projects like Liberdus deserve attention because the future of technology should not focus only on speed and convenience. Privacy, security, accessibility, and user ownership matter just as much.
Liberdus is working toward a future where people can communicate with greater independence and control.
For me, the real value of Liberdus lies in its vision: putting users, privacy, and digital freedom at the center of online communication.
As the ecosystem develops, adoption, usability, security, and real,world utility will be important factors to watch.
Explore more: liberdus.com
Always do your own research before making investment decisions involving LIB.
$BTC $XRP #EvernorthNasdaqDebutClosesDown1.05% #SKHynixSharesDrop7.1%
1
284
·
--
Something interesting is happening beneath the crypto market.
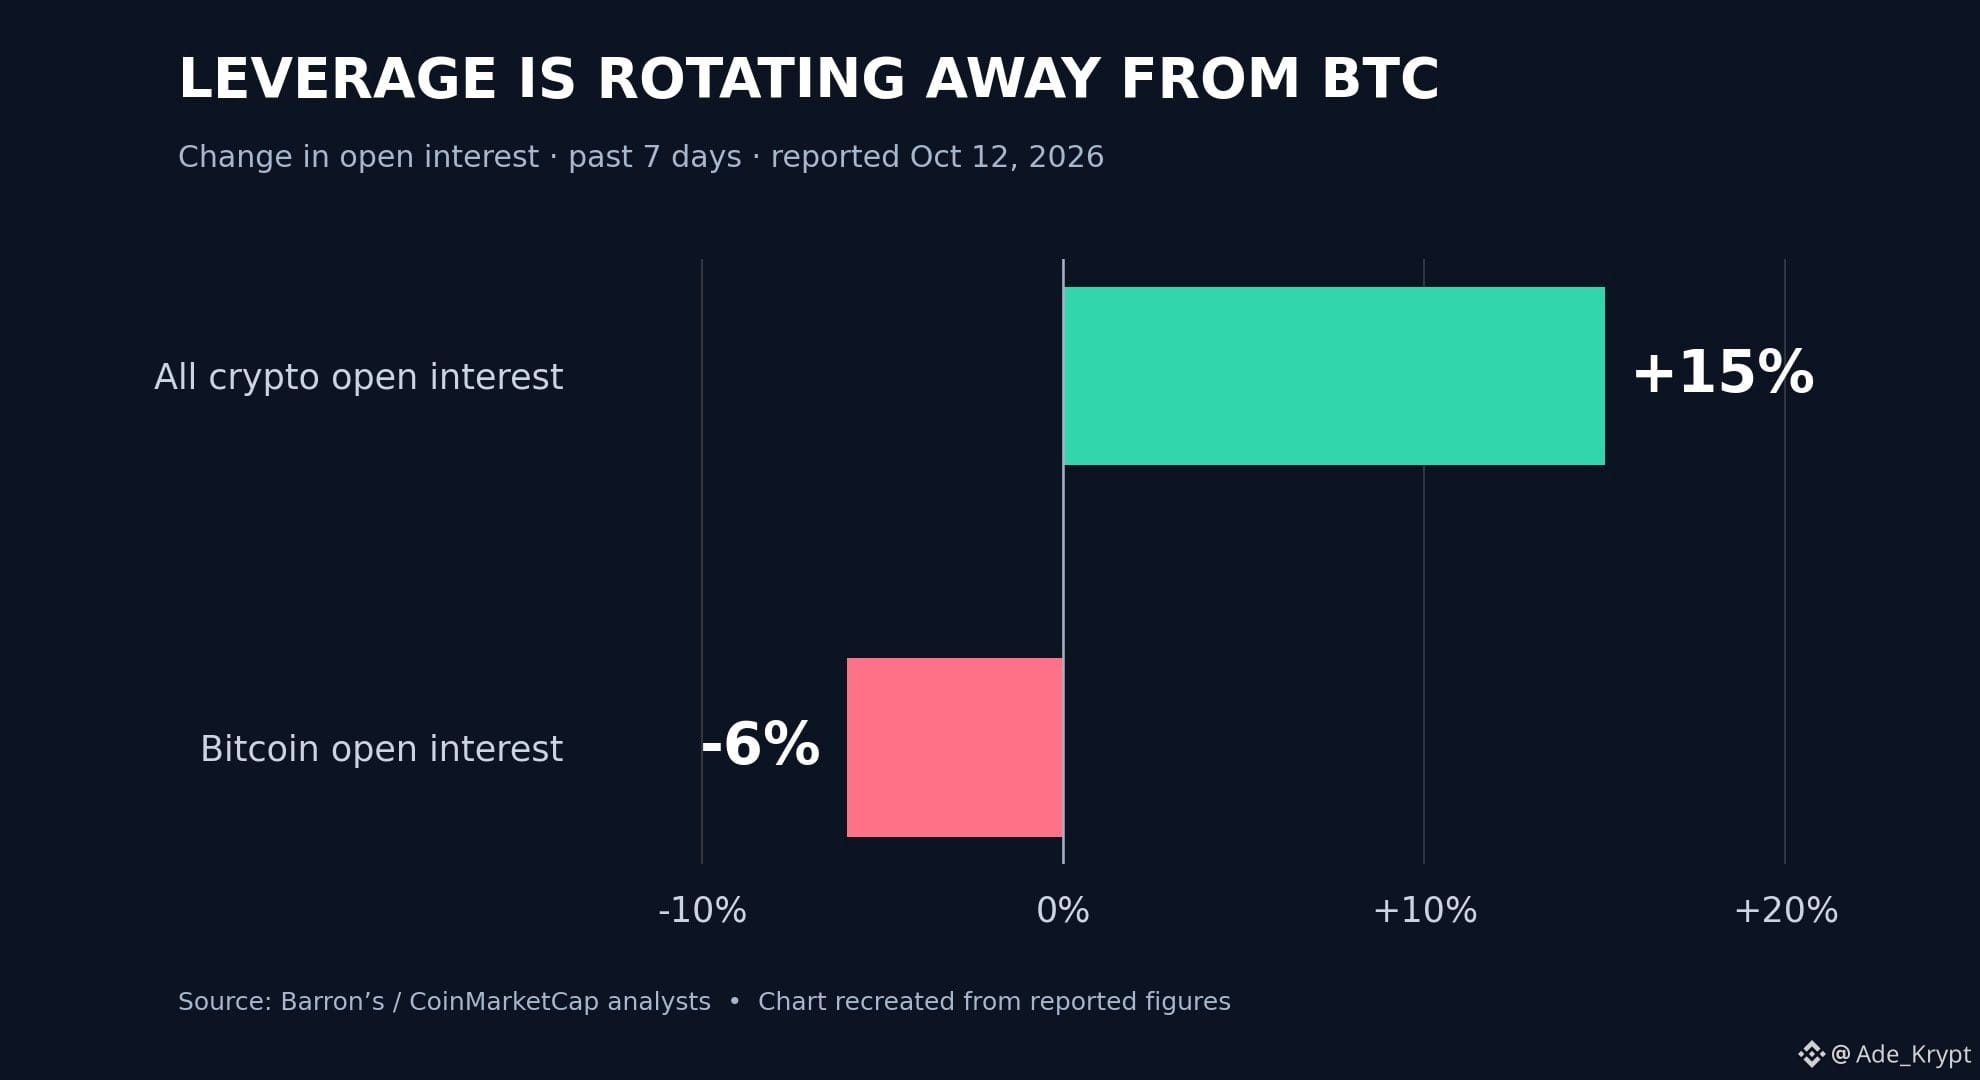
Total crypto open interest has surged 15% over the past week, while $BTC open interest fell 6%.
That divergence is worth paying attention to.
Leverage is increasing across the market, but Bitcoin isn't driving the trend. Traders seem to be taking on more risk in altcoins.
My take? This looks more like risk rotating within crypto than capital leaving the market.
The big question is whether this leverage fuels a sustained rally or sets the stage for another liquidation flush.
What do you think?
Something interesting is happening beneath the crypto market.
Total crypto open interest has surged 15% over the past week, while $BTC open interest fell 6%.
That divergence is worth paying attention to.
Leverage is increasing across the market, but Bitcoin isn't driving the trend. Traders seem to be taking on more risk in altcoins.
My take? This looks more like risk rotating within crypto than capital leaving the market.
The big question is whether this leverage fuels a sustained rally or sets the stage for another liquidation flush.
What do you think?
Total crypto open interest has surged 15% over the past week, while $BTC open interest fell 6%.
That divergence is worth paying attention to.
Leverage is increasing across the market, but Bitcoin isn't driving the trend. Traders seem to be taking on more risk in altcoins.
My take? This looks more like risk rotating within crypto than capital leaving the market.
The big question is whether this leverage fuels a sustained rally or sets the stage for another liquidation flush.
What do you think?
2
226
·
--
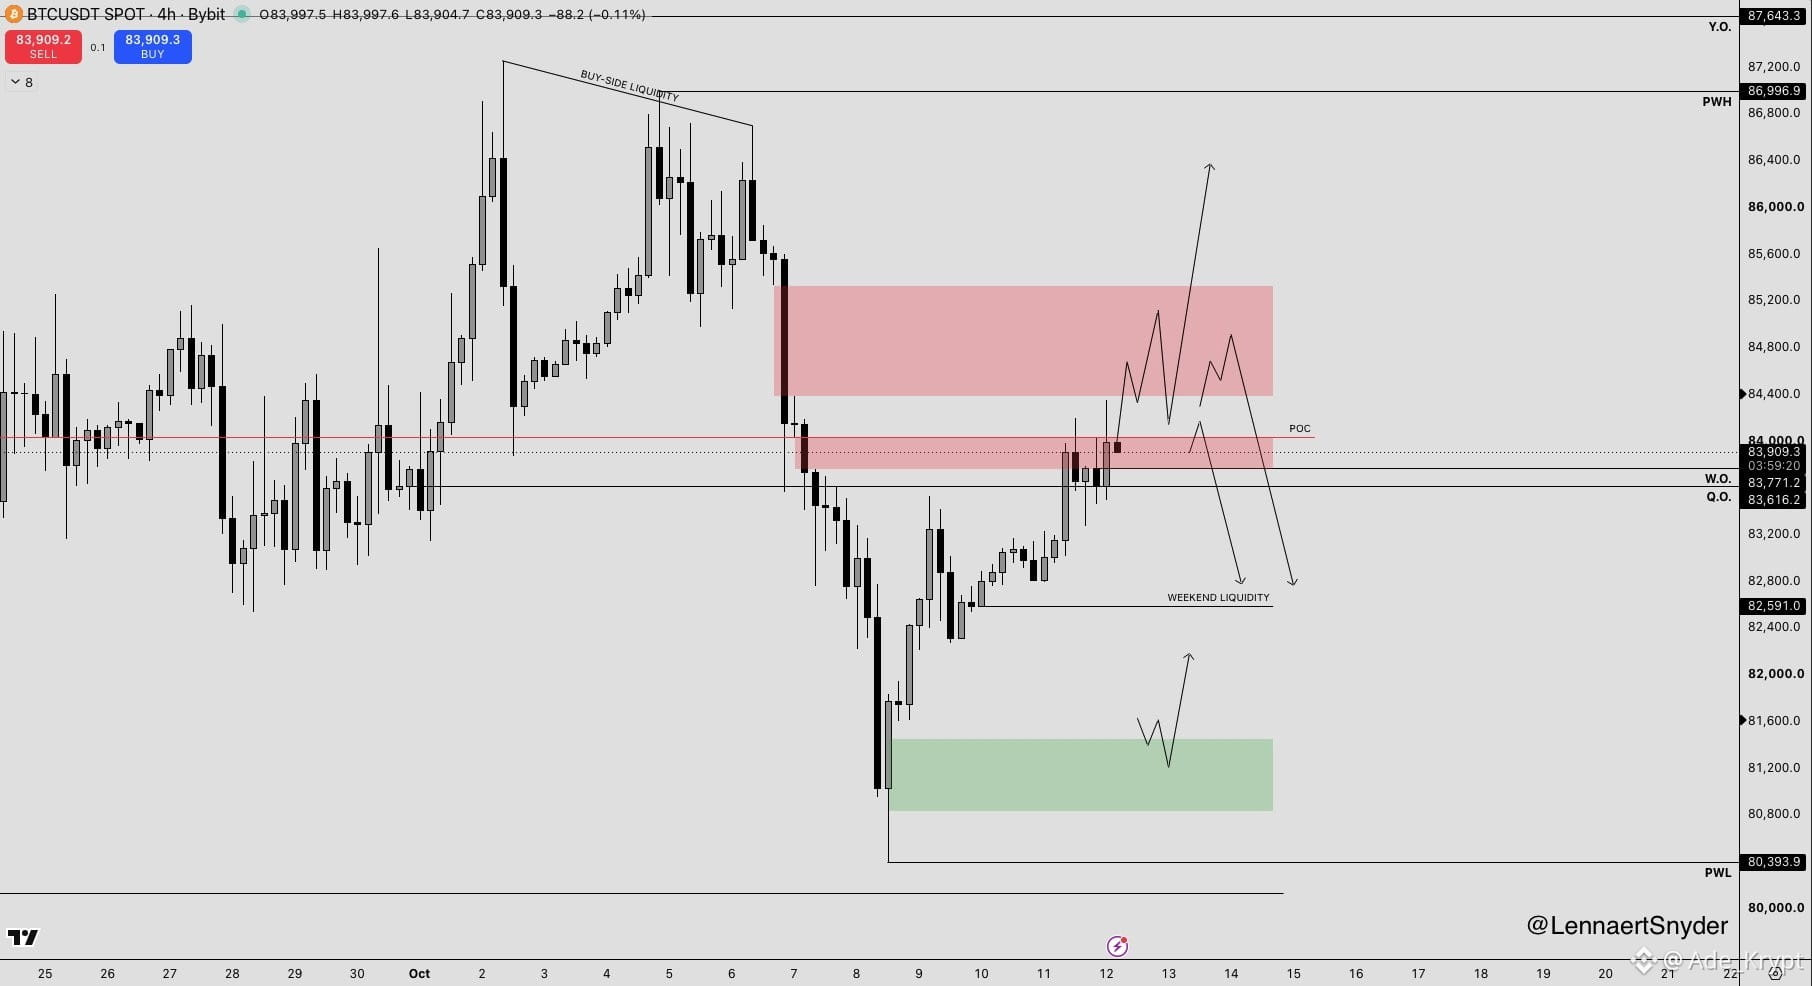
$BTC is battling the $84K POC as we kick off a new week.
As long as the $82.6K weekend liquidity remains intact, short positions targeting that liquidity are still valid.
I opened a scalp short during the London session after the second sweep of the POC, targeting the liquidity below.
My higher-timeframe bias on Bitcoin remains bullish, so I’m using these shorts to hedge my long exposure from $81K.
The $85K region is another potential short POI, but the setup would have a higher probability if we test it before sweeping the $82.6K liquidity.
My $81K long has already hit two take-profit targets, making the position risk-free from here. I’m open to adding again after the weekend liquidity gets swept, ideally around $81.1K.
A second long setup could emerge later this week if we see strong acceptance above the $84K POC.
For $BTC to make a run toward the $87K PWH this week, holding and defending the $80.4K PWL would be important.
It's a U.S. bank holiday today, so personally, I’m sticking to the London session and calling it a day afterward.
CPI is also scheduled for Wednesday, so expect potentially choppy price action today and tomorrow as the market prepares for the data.
Trade carefully, manage risk, and avoid forcing setups.
#BitcoinOptionsVolatilityHitsFiveYearLow
$BTC is battling the $84K POC as we kick off a new week.
As long as the $82.6K weekend liquidity remains intact, short positions targeting that liquidity are still valid.
I opened a scalp short during the London session after the second sweep of the POC, targeting the liquidity below.
My higher-timeframe bias on Bitcoin remains bullish, so I’m using these shorts to hedge my long exposure from $81K.
The $85K region is another potential short POI, but the setup would have a higher probability if we test it before sweeping the $82.6K liquidity.
My $81K long has already hit two take-profit targets, making the position risk-free from here. I’m open to adding again after the weekend liquidity gets swept, ideally around $81.1K.
A second long setup could emerge later this week if we see strong acceptance above the $84K POC.
For $BTC to make a run toward the $87K PWH this week, holding and defending the $80.4K PWL would be important.
It's a U.S. bank holiday today, so personally, I’m sticking to the London session and calling it a day afterward.
CPI is also scheduled for Wednesday, so expect potentially choppy price action today and tomorrow as the market prepares for the data.
Trade carefully, manage risk, and avoid forcing setups.
#BitcoinOptionsVolatilityHitsFiveYearLow
As long as the $82.6K weekend liquidity remains intact, short positions targeting that liquidity are still valid.
I opened a scalp short during the London session after the second sweep of the POC, targeting the liquidity below.
My higher-timeframe bias on Bitcoin remains bullish, so I’m using these shorts to hedge my long exposure from $81K.
The $85K region is another potential short POI, but the setup would have a higher probability if we test it before sweeping the $82.6K liquidity.
My $81K long has already hit two take-profit targets, making the position risk-free from here. I’m open to adding again after the weekend liquidity gets swept, ideally around $81.1K.
A second long setup could emerge later this week if we see strong acceptance above the $84K POC.
For $BTC to make a run toward the $87K PWH this week, holding and defending the $80.4K PWL would be important.
It's a U.S. bank holiday today, so personally, I’m sticking to the London session and calling it a day afterward.
CPI is also scheduled for Wednesday, so expect potentially choppy price action today and tomorrow as the market prepares for the data.
Trade carefully, manage risk, and avoid forcing setups.
#BitcoinOptionsVolatilityHitsFiveYearLow
1
182
·
--
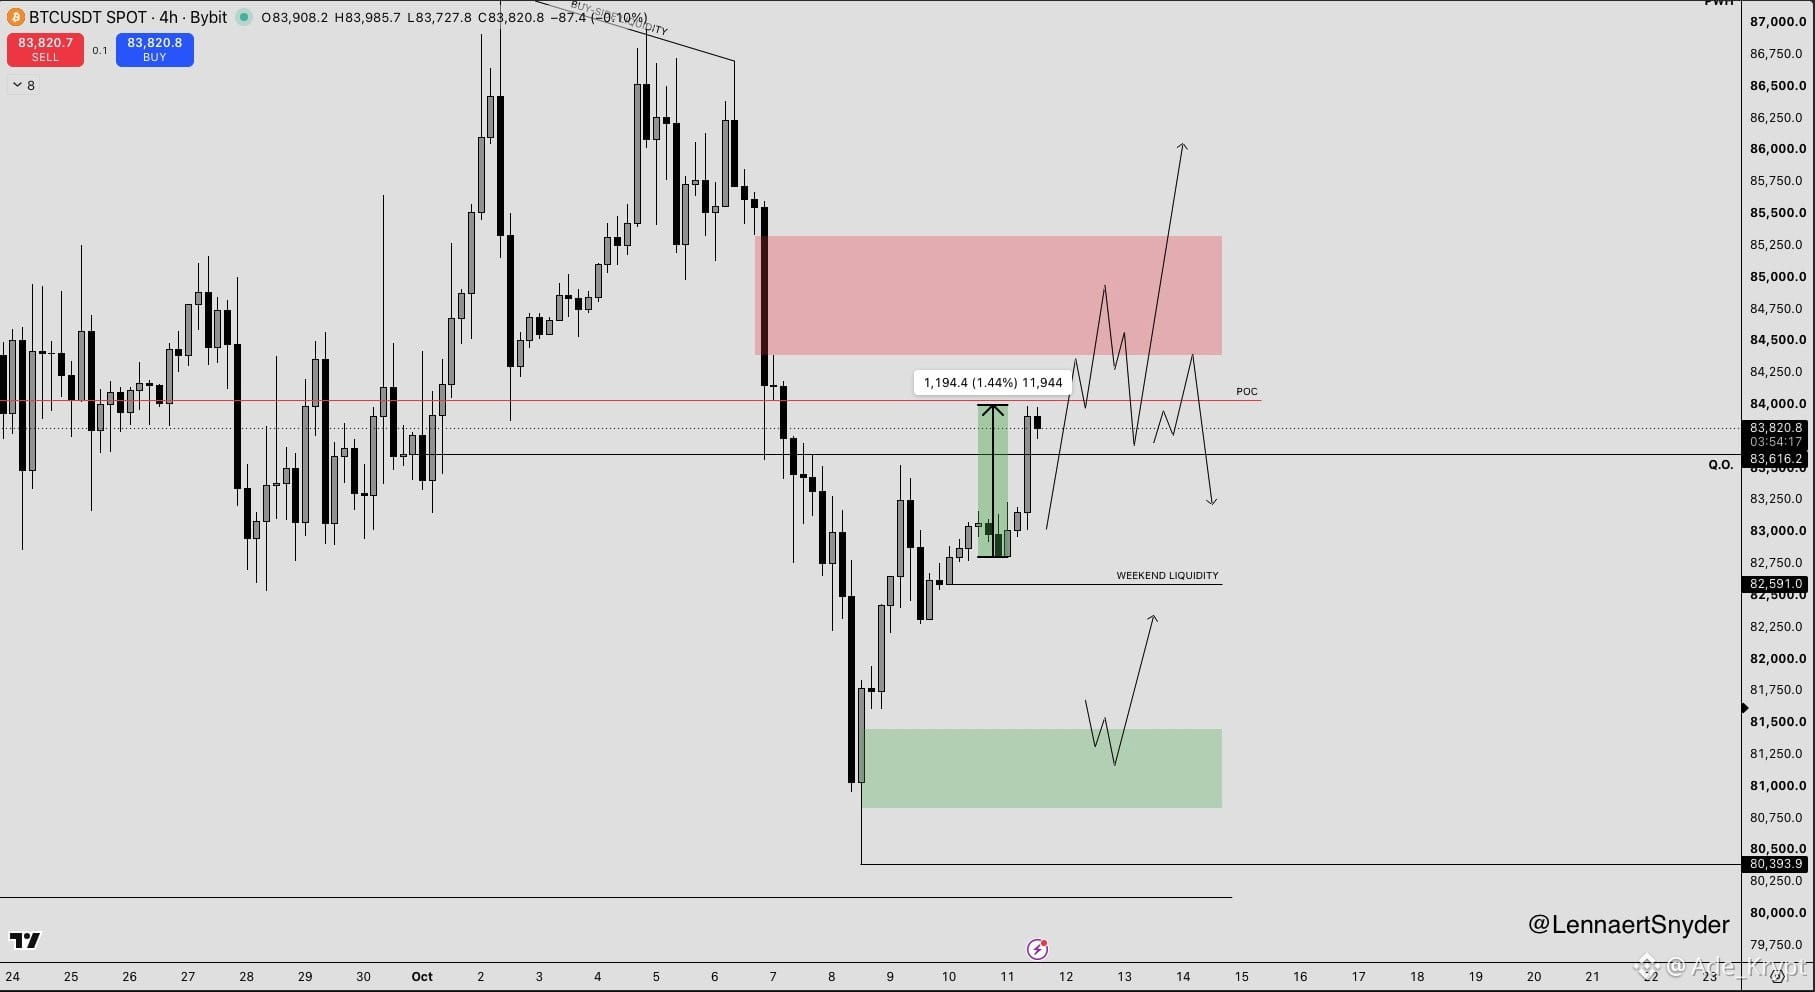
$BTC Sunday pump is playing out as expected.
I've taken another 20a% profit from my long opened at $81K.
Weekend liquidity is sitting around $82.6K. Last week, that liquidity was swept on Tuesday, and it often gets taken early in the week. It'll be interesting to see how things develop this time.
My Bitcoin trading scenarios remain unchanged from this morning.
Remember, weekend price action doesn't carry the same significance. These scenarios and levels become valid when price tests the POI at the right time.
#EthereumSurpasses2500USDT #XRPLedgerPatchesXRPCreationBug
$BTC Sunday pump is playing out as expected.
I've taken another 20a% profit from my long opened at $81K.
Weekend liquidity is sitting around $82.6K. Last week, that liquidity was swept on Tuesday, and it often gets taken early in the week. It'll be interesting to see how things develop this time.
My Bitcoin trading scenarios remain unchanged from this morning.
Remember, weekend price action doesn't carry the same significance. These scenarios and levels become valid when price tests the POI at the right time.
#EthereumSurpasses2500USDT #XRPLedgerPatchesXRPCreationBug
I've taken another 20a% profit from my long opened at $81K.
Weekend liquidity is sitting around $82.6K. Last week, that liquidity was swept on Tuesday, and it often gets taken early in the week. It'll be interesting to see how things develop this time.
My Bitcoin trading scenarios remain unchanged from this morning.
Remember, weekend price action doesn't carry the same significance. These scenarios and levels become valid when price tests the POI at the right time.
#EthereumSurpasses2500USDT #XRPLedgerPatchesXRPCreationBug
208
·
--
$BTC
My Current Market Thesis 📉
Price action has been slow and uneventful heading into the weekend.
Since it's Sunday, we could still see some movement later this evening, but my overall thesis remains unchanged: a drop toward $75K before the next move higher.
Looking at current market sentiment, many traders seem convinced that the dump is over and that we're ready to pump from here.
That kind of confidence could create more liquidity on the downside, giving price another reason to move lower and sweep those levels before the next leg up begins.
There's not much to update right now, given the weekend price action.
For now, I'm just chilling, staying patient, and sticking to our original plan. No need to force trades or change the thesis without a valid reason.
$BTC #EtherETFsExtendOutflowsToNineDays #STRKRisesAbout20%In24Hours
$BTC
My Current Market Thesis 📉
Price action has been slow and uneventful heading into the weekend.
Since it's Sunday, we could still see some movement later this evening, but my overall thesis remains unchanged: a drop toward $75K before the next move higher.
Looking at current market sentiment, many traders seem convinced that the dump is over and that we're ready to pump from here.
That kind of confidence could create more liquidity on the downside, giving price another reason to move lower and sweep those levels before the next leg up begins.
There's not much to update right now, given the weekend price action.
For now, I'm just chilling, staying patient, and sticking to our original plan. No need to force trades or change the thesis without a valid reason.
$BTC #EtherETFsExtendOutflowsToNineDays #STRKRisesAbout20%In24Hours
My Current Market Thesis 📉
Price action has been slow and uneventful heading into the weekend.
Since it's Sunday, we could still see some movement later this evening, but my overall thesis remains unchanged: a drop toward $75K before the next move higher.
Looking at current market sentiment, many traders seem convinced that the dump is over and that we're ready to pump from here.
That kind of confidence could create more liquidity on the downside, giving price another reason to move lower and sweep those levels before the next leg up begins.
There's not much to update right now, given the weekend price action.
For now, I'm just chilling, staying patient, and sticking to our original plan. No need to force trades or change the thesis without a valid reason.
$BTC #EtherETFsExtendOutflowsToNineDays #STRKRisesAbout20%In24Hours
155
·
--
$BTC State of the Market & My View
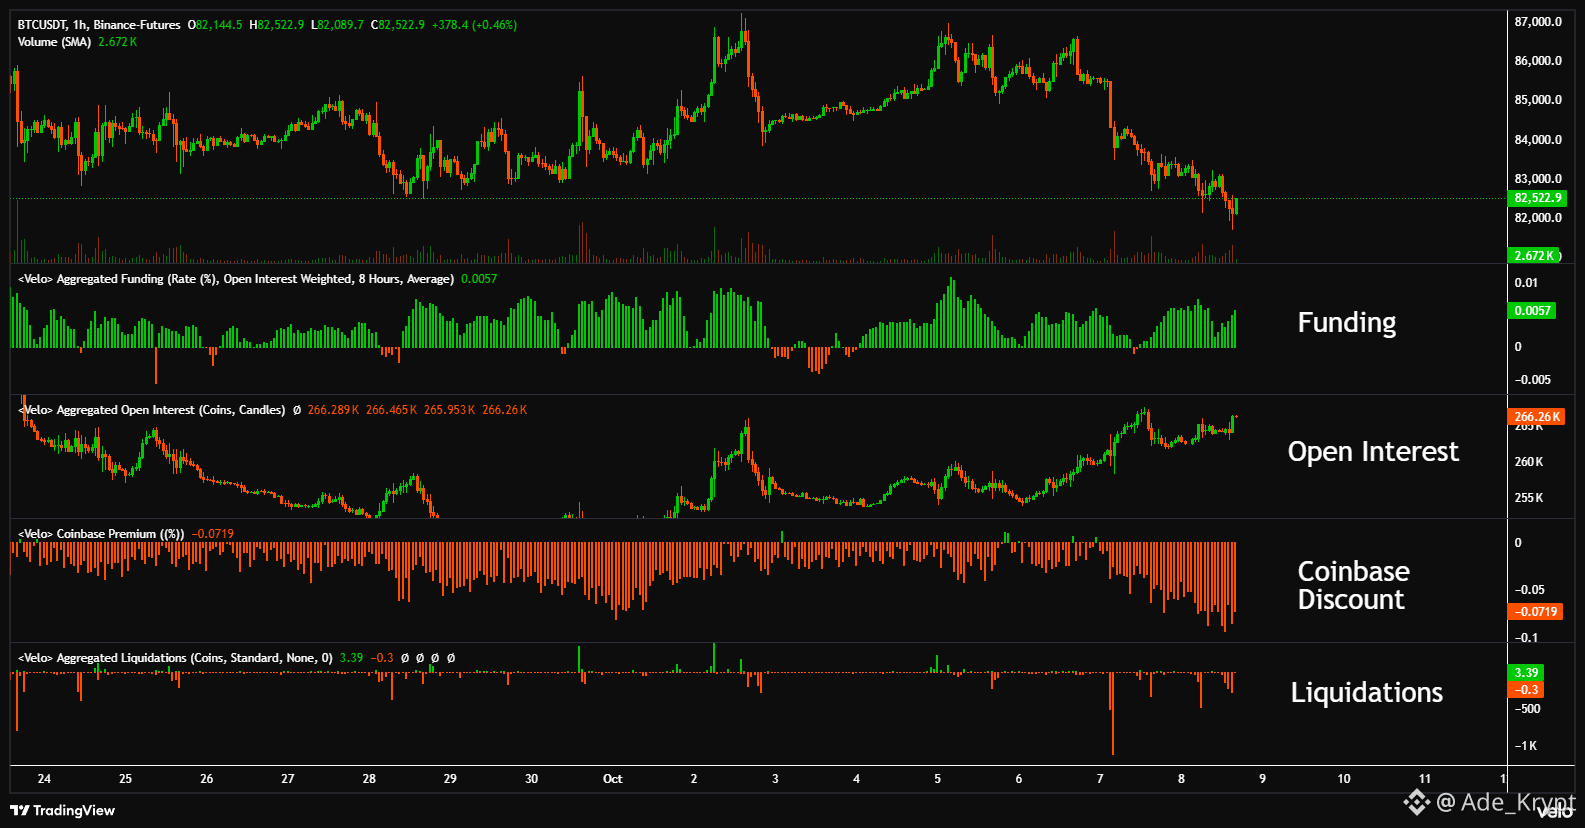
Funding rates remain positive, while Coinbase is seeing heavy spot selling and its deepest discount in roughly two months. At the same time, Open Interest continues to rise.
Price is slowly bleeding lower as dip-buying longs continue getting squeezed.
For a short-term reversal, I’d want to see a proper long flush first , Open Interest dropping significantly and shorts beginning to cover.
ETF outflows also hit their highest level in weeks yesterday, and today looks like it could bring more selling pressure. That spot selling needs to slow down as well.
Right now, I’m seeing none of those conditions. So I’m staying patient and avoiding the long side until the market clears some of this leverage or gives us a proper liquidation candle.
For the bulls, $83K remains the key level to reclaim. Getting back above it could squeeze late shorts and trigger some relief. Daily closes above $83K would be especially important.
On the downside, $75K and $72K remain the main high-timeframe levels. The Daily 200MA/EMA and Bull Market Support Band are also sitting around that area, making it a region worth watching if this turns into a broader market reversal.
There’s nothing wrong with taking it easy after the incredible months we’ve had. Protecting your gains matters.
The biggest mistake is giving back what the market has already given you when conditions shift from easy mode to hard mode.
Sometimes the best trade is simply waiting.
#IMFSaysTokenizedMarketsSmall #FedMinutesFocusOnOctoberPause
$BTC State of the Market & My View
Funding rates remain positive, while Coinbase is seeing heavy spot selling and its deepest discount in roughly two months. At the same time, Open Interest continues to rise.
Price is slowly bleeding lower as dip-buying longs continue getting squeezed.
For a short-term reversal, I’d want to see a proper long flush first , Open Interest dropping significantly and shorts beginning to cover.
ETF outflows also hit their highest level in weeks yesterday, and today looks like it could bring more selling pressure. That spot selling needs to slow down as well.
Right now, I’m seeing none of those conditions. So I’m staying patient and avoiding the long side until the market clears some of this leverage or gives us a proper liquidation candle.
For the bulls, $83K remains the key level to reclaim. Getting back above it could squeeze late shorts and trigger some relief. Daily closes above $83K would be especially important.
On the downside, $75K and $72K remain the main high-timeframe levels. The Daily 200MA/EMA and Bull Market Support Band are also sitting around that area, making it a region worth watching if this turns into a broader market reversal.
There’s nothing wrong with taking it easy after the incredible months we’ve had. Protecting your gains matters.
The biggest mistake is giving back what the market has already given you when conditions shift from easy mode to hard mode.
Sometimes the best trade is simply waiting.
#IMFSaysTokenizedMarketsSmall #FedMinutesFocusOnOctoberPause
Funding rates remain positive, while Coinbase is seeing heavy spot selling and its deepest discount in roughly two months. At the same time, Open Interest continues to rise.
Price is slowly bleeding lower as dip-buying longs continue getting squeezed.
For a short-term reversal, I’d want to see a proper long flush first , Open Interest dropping significantly and shorts beginning to cover.
ETF outflows also hit their highest level in weeks yesterday, and today looks like it could bring more selling pressure. That spot selling needs to slow down as well.
Right now, I’m seeing none of those conditions. So I’m staying patient and avoiding the long side until the market clears some of this leverage or gives us a proper liquidation candle.
For the bulls, $83K remains the key level to reclaim. Getting back above it could squeeze late shorts and trigger some relief. Daily closes above $83K would be especially important.
On the downside, $75K and $72K remain the main high-timeframe levels. The Daily 200MA/EMA and Bull Market Support Band are also sitting around that area, making it a region worth watching if this turns into a broader market reversal.
There’s nothing wrong with taking it easy after the incredible months we’ve had. Protecting your gains matters.
The biggest mistake is giving back what the market has already given you when conditions shift from easy mode to hard mode.
Sometimes the best trade is simply waiting.
#IMFSaysTokenizedMarketsSmall #FedMinutesFocusOnOctoberPause
2
2
186
·
--

Article
Liberdus: Building a More Private Digital FutureLiberdus: Building a More Private Digital Future
The more I use different Web3 applications, the more I appreciate projects that focus on solving practical problems rather than simply adding another token to the market.
That’s one reason Liberdus stands out to me.
Liberdus is building a decentralized communication ecosystem where privacy and usability can work together. Getting started doesn’t require a phone number or email, giving users more control over how their digital identity is created and used.
Inside the Liberdus app, users can communicate through private 1-to-1 chats and groups, share files, make voice and video calls, manage multiple identities, and use $LIB for payments. The platform also uses end-to-end and quantum-resistant encryption to strengthen communication privacy.
What I find interesting is that Liberdus doesn’t treat privacy as something that should make an application difficult to use. The goal is to make private communication feel simple while reducing the amount of personal information users need to provide.
In a digital world where more conversations, identities, and transactions are happening online, having greater control over personal information matters.
For me, Liberdus represents a different approach: less unnecessary data, more user control, and privacy built into the experience from the beginning.
$BNB $BTC $XRP #VitalikWarnsAICouldWeakenCryptographySecurity #XRPSpotETFsHold$1.7BWeeklyInflowsSlow
Liberdus: Building a More Private Digital Future
Liberdus: Building a More Private Digital Future
The more I use different Web3 applications, the more I appreciate projects that focus on solving practical problems rather than simply adding another token to the market.
That’s one reason Liberdus stands out to me.
Liberdus is building a decentralized communication ecosystem where privacy and usability can work together. Getting started doesn’t require a phone number or email, giving users more control over how their digital identity is created and used.
Inside the Liberdus app, users can communicate through private 1-to-1 chats and groups, share files, make voice and video calls, manage multiple identities, and use $LIB for payments. The platform also uses end-to-end and quantum-resistant encryption to strengthen communication privacy.
What I find interesting is that Liberdus doesn’t treat privacy as something that should make an application difficult to use. The goal is to make private communication feel simple while reducing the amount of personal information users need to provide.
In a digital world where more conversations, identities, and transactions are happening online, having greater control over personal information matters.
For me, Liberdus represents a different approach: less unnecessary data, more user control, and privacy built into the experience from the beginning.
$BNB $BTC $XRP #VitalikWarnsAICouldWeakenCryptographySecurity #XRPSpotETFsHold$1.7BWeeklyInflowsSlow
The more I use different Web3 applications, the more I appreciate projects that focus on solving practical problems rather than simply adding another token to the market.
That’s one reason Liberdus stands out to me.
Liberdus is building a decentralized communication ecosystem where privacy and usability can work together. Getting started doesn’t require a phone number or email, giving users more control over how their digital identity is created and used.
Inside the Liberdus app, users can communicate through private 1-to-1 chats and groups, share files, make voice and video calls, manage multiple identities, and use $LIB for payments. The platform also uses end-to-end and quantum-resistant encryption to strengthen communication privacy.
What I find interesting is that Liberdus doesn’t treat privacy as something that should make an application difficult to use. The goal is to make private communication feel simple while reducing the amount of personal information users need to provide.
In a digital world where more conversations, identities, and transactions are happening online, having greater control over personal information matters.
For me, Liberdus represents a different approach: less unnecessary data, more user control, and privacy built into the experience from the beginning.
$BNB $BTC $XRP #VitalikWarnsAICouldWeakenCryptographySecurity #XRPSpotETFsHold$1.7BWeeklyInflowsSlow
243
·
--
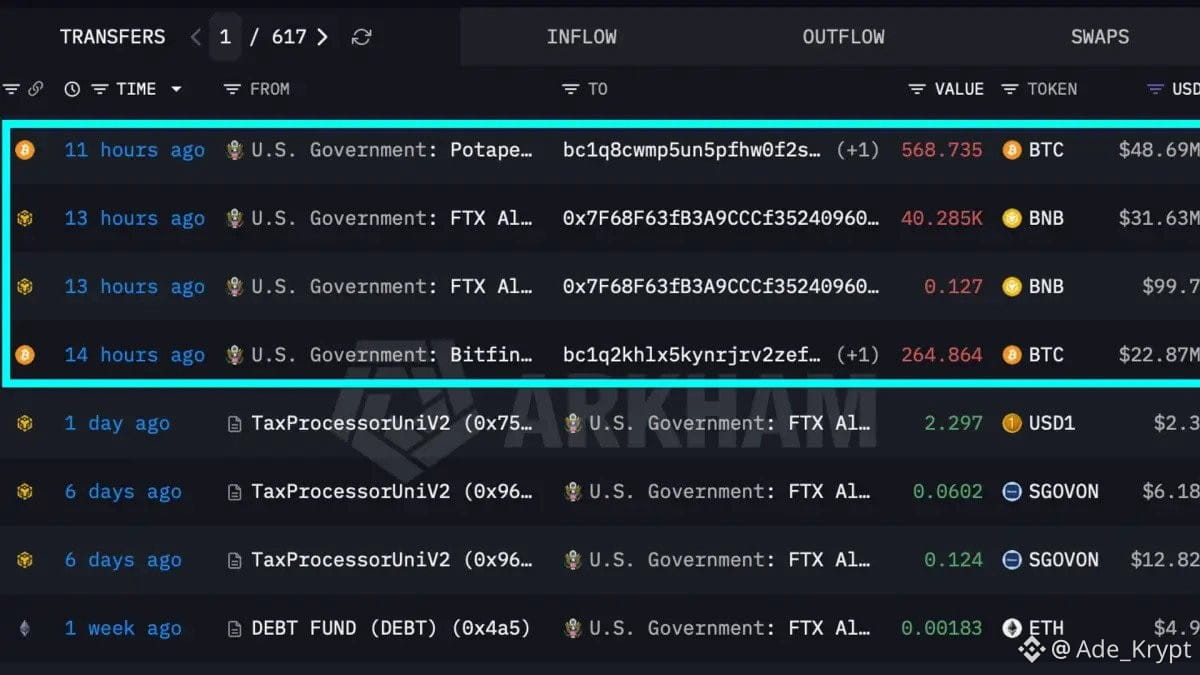
$71.6M worth of U.S. government-linked $BTC just moved into Coinbase Prime addresses.
Naturally, the market immediately jumped to “sell.”
But the only thing we can confirm is that 833.6 BTC moved from government-linked wallets to two Coinbase Prime addresses.
Separately, $31.6M in seized $BNB also moved between unlabeled wallets.
I wouldn’t call either transaction confirmed selling pressure yet.
With current policy stating that forfeited BTC should remain in the Strategic Bitcoin Reserve, wallet movements alone don’t tell us the full story.
We can see where the assets went onchain. But how much can we really infer about the intent behind the move?
#BinanceLaunchesBinanceIntelligence #WinklevossFilesSpotZcashETFApplication
$71.6M worth of U.S. government-linked $BTC just moved into Coinbase Prime addresses.
Naturally, the market immediately jumped to “sell.”
But the only thing we can confirm is that 833.6 BTC moved from government-linked wallets to two Coinbase Prime addresses.
Separately, $31.6M in seized $BNB also moved between unlabeled wallets.
I wouldn’t call either transaction confirmed selling pressure yet.
With current policy stating that forfeited BTC should remain in the Strategic Bitcoin Reserve, wallet movements alone don’t tell us the full story.
We can see where the assets went onchain. But how much can we really infer about the intent behind the move?
#BinanceLaunchesBinanceIntelligence #WinklevossFilesSpotZcashETFApplication
Naturally, the market immediately jumped to “sell.”
But the only thing we can confirm is that 833.6 BTC moved from government-linked wallets to two Coinbase Prime addresses.
Separately, $31.6M in seized $BNB also moved between unlabeled wallets.
I wouldn’t call either transaction confirmed selling pressure yet.
With current policy stating that forfeited BTC should remain in the Strategic Bitcoin Reserve, wallet movements alone don’t tell us the full story.
We can see where the assets went onchain. But how much can we really infer about the intent behind the move?
#BinanceLaunchesBinanceIntelligence #WinklevossFilesSpotZcashETFApplication
940
Log in to explore more content
Join global crypto users on Binance Square
⚡️ Get latest and useful information about crypto.
💬 Trusted by the world’s largest crypto exchange.
👍 Discover real insights from verified creators.
Email / Phone number
Trending Topics
BinancePick
2.5M views
137,115 Discussing
Join #EarningsSeason: Predict Earnings on Binance Pick, Share Your Take on Binance Square!
Binance Square Official
·399 Likes
·336.7k views
EarningsSeason
4.9M views
23,808 Discussing
ElectrumWalletBugLetRogueServersStealFunds
1,292 views
101 Discussing