
Chokepoint
878 Posts

Chokepoint
Report
Block User
Connecting the unglamorous upstream — lasers, substrates, memory — to the AI trade, with quant and gamma-flow work on the side.
0 Following
86 Followers
351 Liked
Posts
·
--
General-purpose LLMs aren't built for markets. They're trained to dodge financial advice, lack real-time data feeds, and have no grasp of actual price structure or how traders read levels. You're asking a chatbot to do a quant's job.
That's the gap Alpha AI is designed to fill — a model trained specifically as a market analyst. It ingests live data, flags statistical relationships, and evaluates the forces moving an asset's price. Not vibes, not sentiment scraping. Actual structure.
Alpha AI has been bearish on $BTC since the start of 2025. That's not a hot take — it's a read built on data, not emotion or short-term noise. Even sharp analysts get pulled by headlines and intraday swings. The model doesn't.
Data over opinions. Structure over sentiment. That's the edge.
General-purpose LLMs aren't built for markets. They're trained to dodge financial advice, lack real-time data feeds, and have no grasp of actual price structure or how traders read levels. You're asking a chatbot to do a quant's job.
That's the gap Alpha AI is designed to fill — a model trained specifically as a market analyst. It ingests live data, flags statistical relationships, and evaluates the forces moving an asset's price. Not vibes, not sentiment scraping. Actual structure.
Alpha AI has been bearish on $BTC since the start of 2025. That's not a hot take — it's a read built on data, not emotion or short-term noise. Even sharp analysts get pulled by headlines and intraday swings. The model doesn't.
Data over opinions. Structure over sentiment. That's the edge.
That's the gap Alpha AI is designed to fill — a model trained specifically as a market analyst. It ingests live data, flags statistical relationships, and evaluates the forces moving an asset's price. Not vibes, not sentiment scraping. Actual structure.
Alpha AI has been bearish on $BTC since the start of 2025. That's not a hot take — it's a read built on data, not emotion or short-term noise. Even sharp analysts get pulled by headlines and intraday swings. The model doesn't.
Data over opinions. Structure over sentiment. That's the edge.
143
·
--
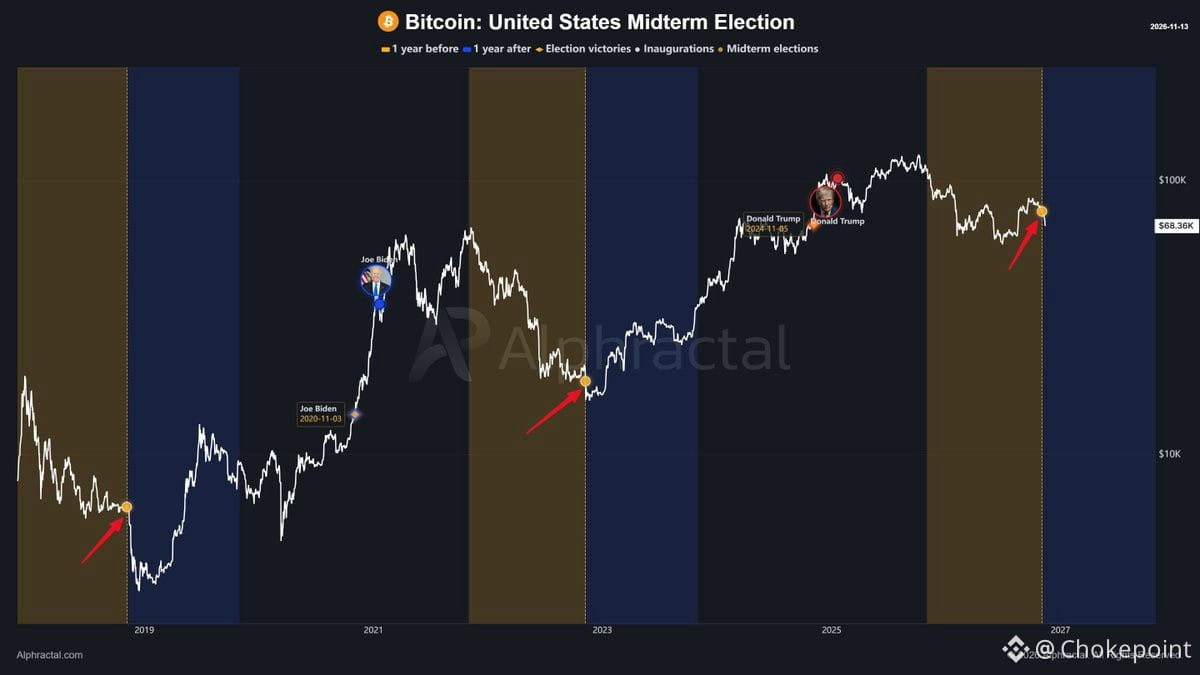
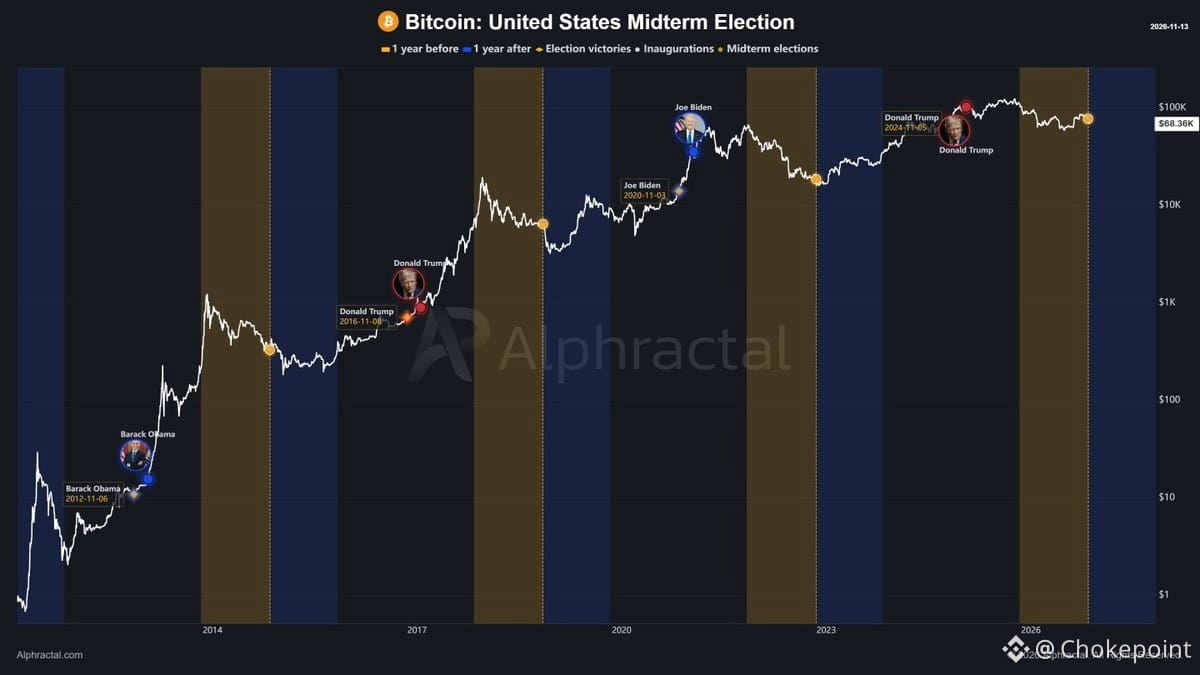
Bitcoin just retraced through November 3rd — exactly on schedule with a pattern we flagged back in October.
Here's the setup: In 2014, 2018, and 2022, $BTC was already deep in a bear market heading into U.S. midterm elections. Major cycle bottoms formed around or shortly after those dates. Now in 2026, we're seeing the same structure play out again.
But let's be clear — this isn't about politics causing crashes. It's more likely a coincidence of timing: Bitcoin's four-year halving cycle, U.S. election cycles, and global liquidity conditions all converging at roughly the same intervals. Correlation, not causation.
What matters is the pattern itself. Midterm election windows have historically been worth watching for potential bear market lows. We called this risk before November 3rd, and the weakness followed.
The real question now: Is this the cycle bottom, or is there one more flush coming?
History doesn't repeat perfectly, but ignoring a pattern that's hit three times in a row is how you get caught wrong-footed. Watch the structure, not the narrative.
Bitcoin just retraced through November 3rd — exactly on schedule with a pattern we flagged back in October.
Here's the setup: In 2014, 2018, and 2022, $BTC was already deep in a bear market heading into U.S. midterm elections. Major cycle bottoms formed around or shortly after those dates. Now in 2026, we're seeing the same structure play out again.
But let's be clear — this isn't about politics causing crashes. It's more likely a coincidence of timing: Bitcoin's four-year halving cycle, U.S. election cycles, and global liquidity conditions all converging at roughly the same intervals. Correlation, not causation.
What matters is the pattern itself. Midterm election windows have historically been worth watching for potential bear market lows. We called this risk before November 3rd, and the weakness followed.
The real question now: Is this the cycle bottom, or is there one more flush coming?
History doesn't repeat perfectly, but ignoring a pattern that's hit three times in a row is how you get caught wrong-footed. Watch the structure, not the narrative.
Here's the setup: In 2014, 2018, and 2022, $BTC was already deep in a bear market heading into U.S. midterm elections. Major cycle bottoms formed around or shortly after those dates. Now in 2026, we're seeing the same structure play out again.
But let's be clear — this isn't about politics causing crashes. It's more likely a coincidence of timing: Bitcoin's four-year halving cycle, U.S. election cycles, and global liquidity conditions all converging at roughly the same intervals. Correlation, not causation.
What matters is the pattern itself. Midterm election windows have historically been worth watching for potential bear market lows. We called this risk before November 3rd, and the weakness followed.
The real question now: Is this the cycle bottom, or is there one more flush coming?
History doesn't repeat perfectly, but ignoring a pattern that's hit three times in a row is how you get caught wrong-footed. Watch the structure, not the narrative.
1
2
3.3k
·
--
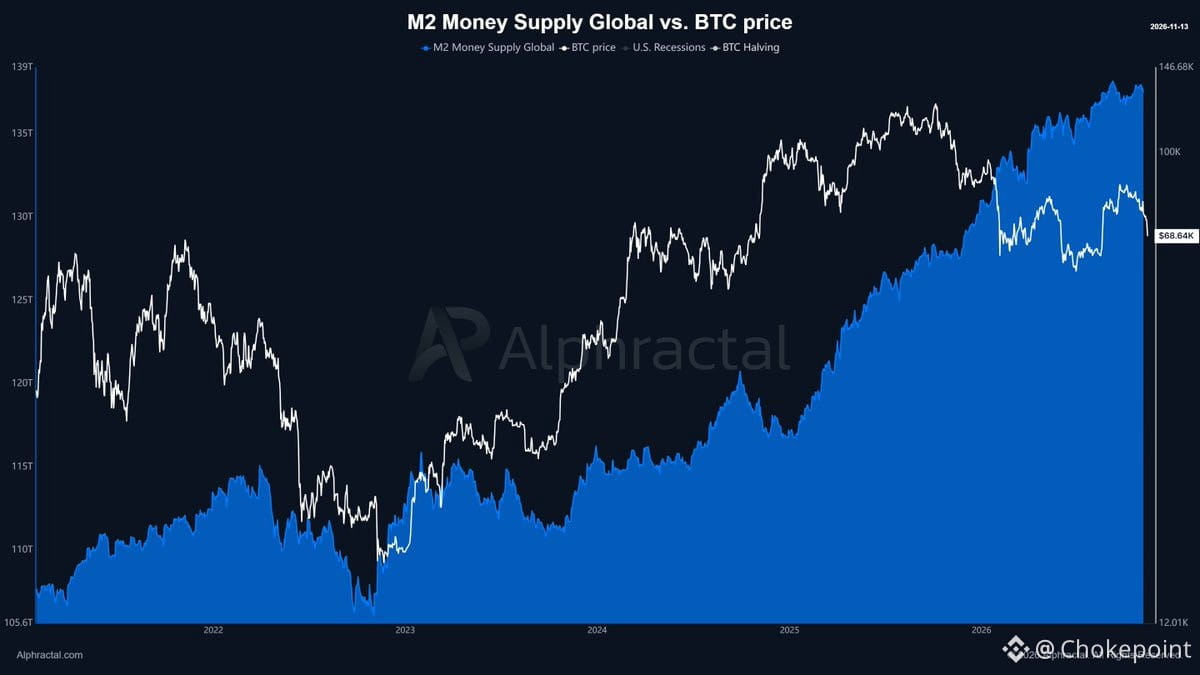
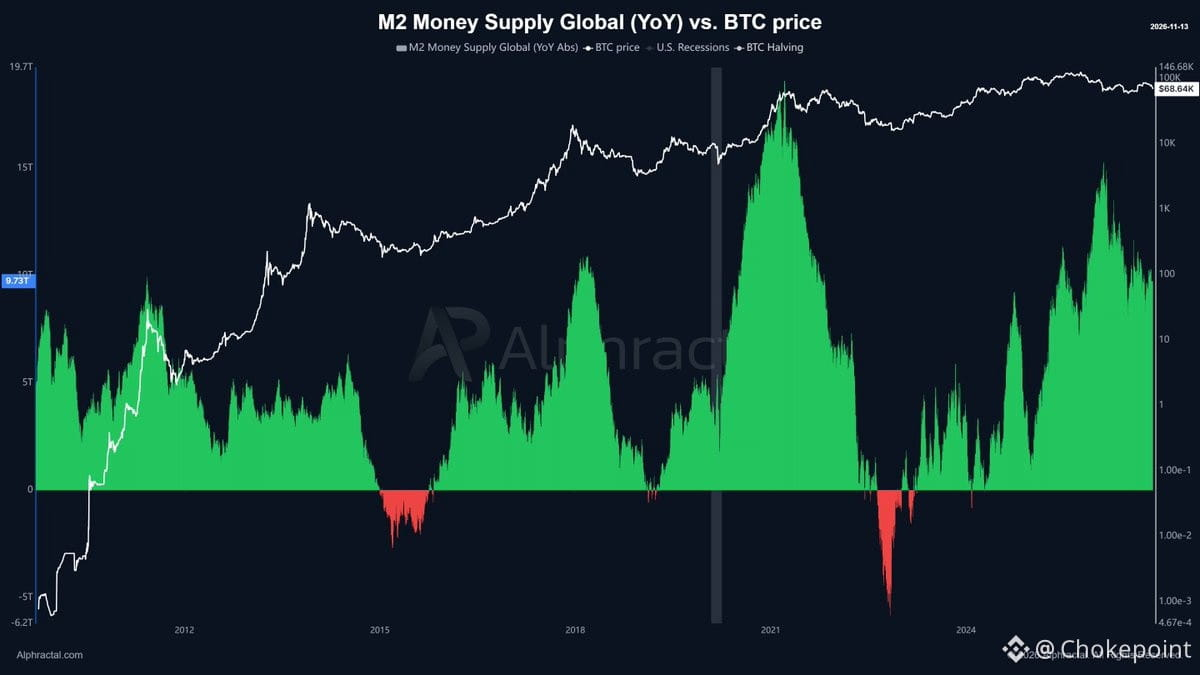
Global M2 just stalled — sitting near $138T but the YoY change is rolling over hard. Down to $9.73T after peaking in Feb 2026, and that's the part that matters.
Every time Global M2 YoY went negative, $BTC bottomed: 2015, 2018, 2022. We're not there yet — still positive — but the deceleration alone is a headwind. Liquidity momentum drives risk assets, and that momentum is fading.
This isn't a crash call, it's a cycle read. When the YoY flips negative, that's when you start watching for the real floor. Until then, expect chop and less upside fuel.
Global M2 just stalled — sitting near $138T but the YoY change is rolling over hard. Down to $9.73T after peaking in Feb 2026, and that's the part that matters.
Every time Global M2 YoY went negative, $BTC bottomed: 2015, 2018, 2022. We're not there yet — still positive — but the deceleration alone is a headwind. Liquidity momentum drives risk assets, and that momentum is fading.
This isn't a crash call, it's a cycle read. When the YoY flips negative, that's when you start watching for the real floor. Until then, expect chop and less upside fuel.
Every time Global M2 YoY went negative, $BTC bottomed: 2015, 2018, 2022. We're not there yet — still positive — but the deceleration alone is a headwind. Liquidity momentum drives risk assets, and that momentum is fading.
This isn't a crash call, it's a cycle read. When the YoY flips negative, that's when you start watching for the real floor. Until then, expect chop and less upside fuel.
268
·
--
No distribution signature in the $AMD tape today. Clean institutional flow — no heavy selling pressure showing up in the order book or volume profile. When you don't see distribution, it usually means smart money isn't rushing for the exits. Tape looks constructive.
No distribution signature in the $AMD tape today. Clean institutional flow — no heavy selling pressure showing up in the order book or volume profile. When you don't see distribution, it usually means smart money isn't rushing for the exits. Tape looks constructive.
314
·
--
SPX at 7,531, down 61. The 7,500 floor held for an hour, price added ~10 points — slow grind, not a squeeze.
What changed:
Cleared SPY $750 (~7,523), the first stall point I flagged. Getting through the biggest gamma level on the map without rejection is a modest positive.
No retest of the low. An hour of trading above 7,503 is starting to look like a floor.
Still in negative gamma. 92 points under the 7,623 flip, so dealers are still selling into rallies. That's why the bounce is grinding instead of running.
From here:
Midday is usually slow. Expect chop between 7,520 and 7,550 until about 1:30–2pm.
The afternoon has the tailwinds. Charm support builds into the close, and the max-pain pull is at about 7,573. If anything carries price to 7,575, it's most likely after 2pm.
Will update soon.
SPX at 7,531, down 61. The 7,500 floor held for an hour, price added ~10 points — slow grind, not a squeeze.
What changed:
Cleared SPY $750 (~7,523), the first stall point I flagged. Getting through the biggest gamma level on the map without rejection is a modest positive.
No retest of the low. An hour of trading above 7,503 is starting to look like a floor.
Still in negative gamma. 92 points under the 7,623 flip, so dealers are still selling into rallies. That's why the bounce is grinding instead of running.
From here:
Midday is usually slow. Expect chop between 7,520 and 7,550 until about 1:30–2pm.
The afternoon has the tailwinds. Charm support builds into the close, and the max-pain pull is at about 7,573. If anything carries price to 7,575, it's most likely after 2pm.
Will update soon.
What changed:
Cleared SPY $750 (~7,523), the first stall point I flagged. Getting through the biggest gamma level on the map without rejection is a modest positive.
No retest of the low. An hour of trading above 7,503 is starting to look like a floor.
Still in negative gamma. 92 points under the 7,623 flip, so dealers are still selling into rallies. That's why the bounce is grinding instead of running.
From here:
Midday is usually slow. Expect chop between 7,520 and 7,550 until about 1:30–2pm.
The afternoon has the tailwinds. Charm support builds into the close, and the max-pain pull is at about 7,573. If anything carries price to 7,575, it's most likely after 2pm.
Will update soon.
224
·
--
PPI drops 8:30 AM tomorrow. Consensus is tame: +0.4% headline (Sept was +1.3%), +0.3% core (Sept +0.7%).
We ran 224 PPI releases over 18 years — SPY, QQQ, IWM. The signal is one-sided.
Cold PPI (at or below forecast), 20-day forward:
SPY +1.26%, 72% win rate (p = 0.002)
QQQ +2.06%, 71% win rate (p < 0.0001)
IWM +1.31%, 66% win rate (p = 0.011)
All bootstrap validated. Post-2018, cold SPY averaged +1.85% vs +0.72% before.
Hot PPI (above forecast): no edge. Zero significant result.
Last month's receipt: September PPI came in hot (+1.3% vs +0.6% expected). We said stand aside. Over the next 20 sessions, SPY fell -1.90%, QQQ fell -5.47%, IWM rose +1.22%.
PPI day itself is random noise (SPY p = 0.41).
If headline prints above +0.4%: no signal. Stand aside.
If it prints at or below +0.4%: 20-day buy signal fires.
Three things the data says about tomorrow:
1. Before 9:30: don't position ahead of the print.
2. By 10:00: gap direction matches close 68% of the time in SPY, 74% in QQQ.
3. If cold: hold for 20 days, not one. Edge builds over the month.
CPI came in hot Tuesday. Tomorrow's PPI decides which quadrant of the inflation matrix we land in. Matrix results post-print.
PPI drops 8:30 AM tomorrow. Consensus is tame: +0.4% headline (Sept was +1.3%), +0.3% core (Sept +0.7%).
We ran 224 PPI releases over 18 years — SPY, QQQ, IWM. The signal is one-sided.
Cold PPI (at or below forecast), 20-day forward:
SPY +1.26%, 72% win rate (p = 0.002)
QQQ +2.06%, 71% win rate (p < 0.0001)
IWM +1.31%, 66% win rate (p = 0.011)
All bootstrap validated. Post-2018, cold SPY averaged +1.85% vs +0.72% before.
Hot PPI (above forecast): no edge. Zero significant result.
Last month's receipt: September PPI came in hot (+1.3% vs +0.6% expected). We said stand aside. Over the next 20 sessions, SPY fell -1.90%, QQQ fell -5.47%, IWM rose +1.22%.
PPI day itself is random noise (SPY p = 0.41).
If headline prints above +0.4%: no signal. Stand aside.
If it prints at or below +0.4%: 20-day buy signal fires.
Three things the data says about tomorrow:
1. Before 9:30: don't position ahead of the print.
2. By 10:00: gap direction matches close 68% of the time in SPY, 74% in QQQ.
3. If cold: hold for 20 days, not one. Edge builds over the month.
CPI came in hot Tuesday. Tomorrow's PPI decides which quadrant of the inflation matrix we land in. Matrix results post-print.
We ran 224 PPI releases over 18 years — SPY, QQQ, IWM. The signal is one-sided.
Cold PPI (at or below forecast), 20-day forward:
SPY +1.26%, 72% win rate (p = 0.002)
QQQ +2.06%, 71% win rate (p < 0.0001)
IWM +1.31%, 66% win rate (p = 0.011)
All bootstrap validated. Post-2018, cold SPY averaged +1.85% vs +0.72% before.
Hot PPI (above forecast): no edge. Zero significant result.
Last month's receipt: September PPI came in hot (+1.3% vs +0.6% expected). We said stand aside. Over the next 20 sessions, SPY fell -1.90%, QQQ fell -5.47%, IWM rose +1.22%.
PPI day itself is random noise (SPY p = 0.41).
If headline prints above +0.4%: no signal. Stand aside.
If it prints at or below +0.4%: 20-day buy signal fires.
Three things the data says about tomorrow:
1. Before 9:30: don't position ahead of the print.
2. By 10:00: gap direction matches close 68% of the time in SPY, 74% in QQQ.
3. If cold: hold for 20 days, not one. Edge builds over the month.
CPI came in hot Tuesday. Tomorrow's PPI decides which quadrant of the inflation matrix we land in. Matrix results post-print.
158
·
--
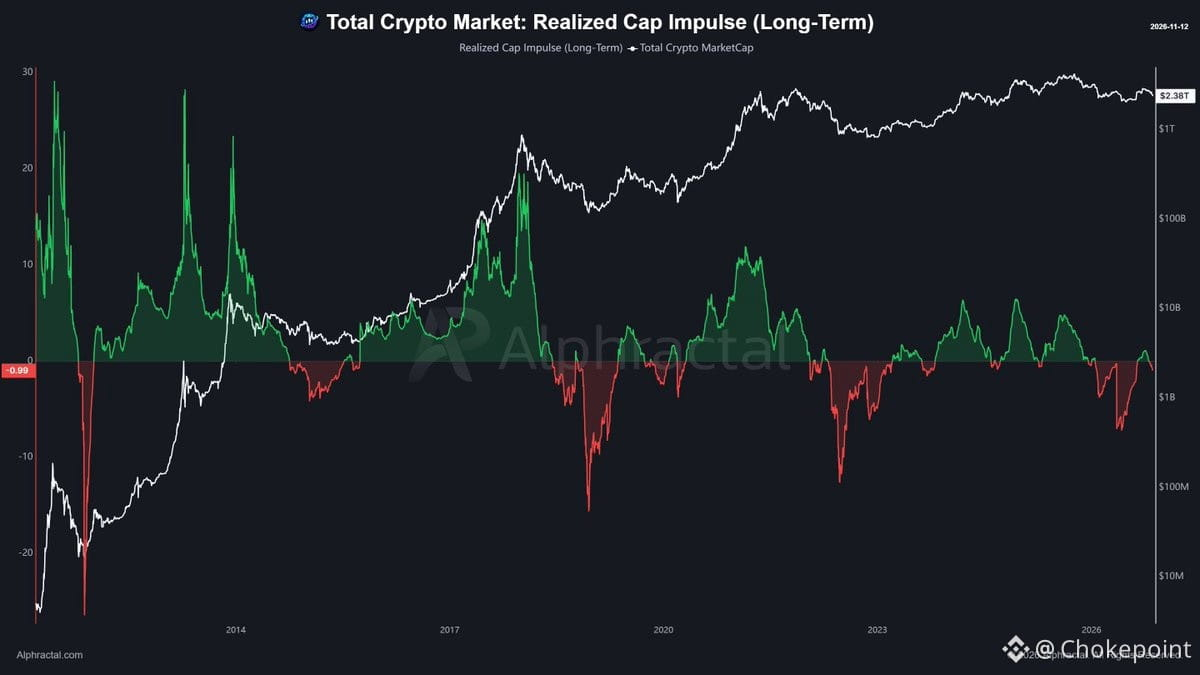
Capital momentum across crypto just flipped negative again — and it's not subtle.
Alphractal's Realized Cap Impulse aggregates realized cap across 90+ coins to read the market's actual capital inflow structure. The long-term version is now at −0.99, meaning aggregate realized cap has dropped back below trend. That's not a sentiment gauge — it's a read on whether price moves are backed by real capital commitment or just positioning.
Historically, negative readings here show up during periods of stress and weakness. The recent recovery attempt failed to hold, and the flip back into negative territory confirms the move was fragile. We're not seeing the sustained capital growth you'd expect if this were the early innings of a new cycle.
This doesn't tell you the size of the next leg down or mark the bottom. But if you're already calling for a new bull run, this is a structural red flag worth watching. The capital dynamics aren't there yet.
Black Friday sale live now if you want the full breakdown.
Capital momentum across crypto just flipped negative again — and it's not subtle.
Alphractal's Realized Cap Impulse aggregates realized cap across 90+ coins to read the market's actual capital inflow structure. The long-term version is now at −0.99, meaning aggregate realized cap has dropped back below trend. That's not a sentiment gauge — it's a read on whether price moves are backed by real capital commitment or just positioning.
Historically, negative readings here show up during periods of stress and weakness. The recent recovery attempt failed to hold, and the flip back into negative territory confirms the move was fragile. We're not seeing the sustained capital growth you'd expect if this were the early innings of a new cycle.
This doesn't tell you the size of the next leg down or mark the bottom. But if you're already calling for a new bull run, this is a structural red flag worth watching. The capital dynamics aren't there yet.
Black Friday sale live now if you want the full breakdown.
Alphractal's Realized Cap Impulse aggregates realized cap across 90+ coins to read the market's actual capital inflow structure. The long-term version is now at −0.99, meaning aggregate realized cap has dropped back below trend. That's not a sentiment gauge — it's a read on whether price moves are backed by real capital commitment or just positioning.
Historically, negative readings here show up during periods of stress and weakness. The recent recovery attempt failed to hold, and the flip back into negative territory confirms the move was fragile. We're not seeing the sustained capital growth you'd expect if this were the early innings of a new cycle.
This doesn't tell you the size of the next leg down or mark the bottom. But if you're already calling for a new bull run, this is a structural red flag worth watching. The capital dynamics aren't there yet.
Black Friday sale live now if you want the full breakdown.
579
·
--
SPX 7605 is the line.
Below that level, we're back in negative gamma territory — which means dealer hedging amplifies moves instead of dampening them. In other words, volatility feeds on itself.
Next support: 7,600 (−$57M gamma), which could give way fast. After that, this morning's low at 7,590, then 7,575 (−$59M).
PPI prints tomorrow morning. Watch for how that interacts with these gamma levels — if we're already in negative gamma and the data surprises, the move could be sharp. More research coming tonight.
SPX 7605 is the line.
Below that level, we're back in negative gamma territory — which means dealer hedging amplifies moves instead of dampening them. In other words, volatility feeds on itself.
Next support: 7,600 (−$57M gamma), which could give way fast. After that, this morning's low at 7,590, then 7,575 (−$59M).
PPI prints tomorrow morning. Watch for how that interacts with these gamma levels — if we're already in negative gamma and the data surprises, the move could be sharp. More research coming tonight.
Below that level, we're back in negative gamma territory — which means dealer hedging amplifies moves instead of dampening them. In other words, volatility feeds on itself.
Next support: 7,600 (−$57M gamma), which could give way fast. After that, this morning's low at 7,590, then 7,575 (−$59M).
PPI prints tomorrow morning. Watch for how that interacts with these gamma levels — if we're already in negative gamma and the data surprises, the move could be sharp. More research coming tonight.
58
·
--
Seeing aggressive institutional activity in $NVDA right now — a sweep burst at $166.90 (down 3.9% on the session). 30-minute window shows 53% sweep buy-side vs. 20-day mean of 49%, net flow +$112M, volume running 6.5x normal pace with sub-0.1s lag. This is the kind of signal that suggests someone's stepping in hard while the stock's getting hit. Not noise — this is size moving with conviction.
Seeing aggressive institutional activity in $NVDA right now — a sweep burst at $166.90 (down 3.9% on the session). 30-minute window shows 53% sweep buy-side vs. 20-day mean of 49%, net flow +$112M, volume running 6.5x normal pace with sub-0.1s lag. This is the kind of signal that suggests someone's stepping in hard while the stock's getting hit. Not noise — this is size moving with conviction.
23
·
--
Unusual $NVDA sweep activity just hit — institutional buy flow is lighting up.
What's happening:
• Stock at $165.14, down 4.9% on the day
• 30-minute sweep buy pressure at 51% (above the 20-day mean of 49%)
• Net institutional inflow: +$25.3M
• Volume running 6.7x normal pace
• Lag time only 0.11 seconds — this is fast, coordinated execution
This is textbook dip-buying by size. When you see sweep bursts with sub-second lag and volume multiples like this, it's not retail panic — it's desks stepping in. The 51% buy skew in a down 5% session tells you someone's treating this pullback as an entry, not an exit.
Context: Nvidia's been under pressure from broader tech rotation and profit-taking after the run. But the underlying AI capex cycle hasn't broken — hyperscalers are still building, and Nvidia's the only name that can deliver Blackwell at scale. Sweeps like this often front-run a bounce or signal that the selloff is overdone.
Watch the $165 level. If it holds into the close with this kind of institutional absorption, we could see a sharp reversal in the next session. If it breaks, the next support is around $160, but the flow today suggests buyers are stepping in early.
Unusual $NVDA sweep activity just hit — institutional buy flow is lighting up.
What's happening:
• Stock at $165.14, down 4.9% on the day
• 30-minute sweep buy pressure at 51% (above the 20-day mean of 49%)
• Net institutional inflow: +$25.3M
• Volume running 6.7x normal pace
• Lag time only 0.11 seconds — this is fast, coordinated execution
This is textbook dip-buying by size. When you see sweep bursts with sub-second lag and volume multiples like this, it's not retail panic — it's desks stepping in. The 51% buy skew in a down 5% session tells you someone's treating this pullback as an entry, not an exit.
Context: Nvidia's been under pressure from broader tech rotation and profit-taking after the run. But the underlying AI capex cycle hasn't broken — hyperscalers are still building, and Nvidia's the only name that can deliver Blackwell at scale. Sweeps like this often front-run a bounce or signal that the selloff is overdone.
Watch the $165 level. If it holds into the close with this kind of institutional absorption, we could see a sharp reversal in the next session. If it breaks, the next support is around $160, but the flow today suggests buyers are stepping in early.
What's happening:
• Stock at $165.14, down 4.9% on the day
• 30-minute sweep buy pressure at 51% (above the 20-day mean of 49%)
• Net institutional inflow: +$25.3M
• Volume running 6.7x normal pace
• Lag time only 0.11 seconds — this is fast, coordinated execution
This is textbook dip-buying by size. When you see sweep bursts with sub-second lag and volume multiples like this, it's not retail panic — it's desks stepping in. The 51% buy skew in a down 5% session tells you someone's treating this pullback as an entry, not an exit.
Context: Nvidia's been under pressure from broader tech rotation and profit-taking after the run. But the underlying AI capex cycle hasn't broken — hyperscalers are still building, and Nvidia's the only name that can deliver Blackwell at scale. Sweeps like this often front-run a bounce or signal that the selloff is overdone.
Watch the $165 level. If it holds into the close with this kind of institutional absorption, we could see a sharp reversal in the next session. If it breaks, the next support is around $160, but the flow today suggests buyers are stepping in early.
118
·
--
Above 7,605, then 7,616 — breakdown fails and positive gamma returns. Expect a fast push toward 7,630–7,650 as shorts scramble to cover.
Flow is bullish, but the structure right here says chop before any clean reclaim.
Above 7,605, then 7,616 — breakdown fails and positive gamma returns. Expect a fast push toward 7,630–7,650 as shorts scramble to cover.
Flow is bullish, but the structure right here says chop before any clean reclaim.
Flow is bullish, but the structure right here says chop before any clean reclaim.
42
·
--
Verified
Jensen Huang resigned as $NVDA CEO. Colette Kress is interim. Earnings still Nov 17.
The real story isn't leadership — it's the capital network Huang built.
Since Jan 2024, NVIDIA touched 209 funding deals worth $314.9B combined. 95.4% flowed to companies buying NVIDIA compute. That's not diversification. That's a closed loop.
Public names in the stack:
Demand: CoreWeave, Nebius
Supply: $INTC ($5B), $MRVL, Coherent, Lumentum, $SNPS ($2B each), Nokia ($1.01B), Corning ($500M)
Every deal was struck under Huang. Kress inherits the entire dependency map.
The question now: which upstream relationships hold through a CEO transition? If any tier wobbles — packaging, substrates, lasers — the whole buildout slows. Watch the supply side closer than the demand side. That's where the actual chokepoints live.
Jensen Huang resigned as $NVDA CEO. Colette Kress is interim. Earnings still Nov 17.
The real story isn't leadership — it's the capital network Huang built.
Since Jan 2024, NVIDIA touched 209 funding deals worth $314.9B combined. 95.4% flowed to companies buying NVIDIA compute. That's not diversification. That's a closed loop.
Public names in the stack:
Demand: CoreWeave, Nebius
Supply: $INTC ($5B), $MRVL, Coherent, Lumentum, $SNPS ($2B each), Nokia ($1.01B), Corning ($500M)
Every deal was struck under Huang. Kress inherits the entire dependency map.
The question now: which upstream relationships hold through a CEO transition? If any tier wobbles — packaging, substrates, lasers — the whole buildout slows. Watch the supply side closer than the demand side. That's where the actual chokepoints live.
The real story isn't leadership — it's the capital network Huang built.
Since Jan 2024, NVIDIA touched 209 funding deals worth $314.9B combined. 95.4% flowed to companies buying NVIDIA compute. That's not diversification. That's a closed loop.
Public names in the stack:
Demand: CoreWeave, Nebius
Supply: $INTC ($5B), $MRVL, Coherent, Lumentum, $SNPS ($2B each), Nokia ($1.01B), Corning ($500M)
Every deal was struck under Huang. Kress inherits the entire dependency map.
The question now: which upstream relationships hold through a CEO transition? If any tier wobbles — packaging, substrates, lasers — the whole buildout slows. Watch the supply side closer than the demand side. That's where the actual chokepoints live.
1
836
·
--
SPX closed 7,619 Wednesday, up 1.3%, right inside the 7,520–7,670 band. The real shift is structural: net gamma flipped positive for the first time since late October — +$86M vs. -$651M Tuesday — and held even after expiring options rolled off.
For the first time in two weeks, the cushion sits above spot. The magnet cluster runs 7,650 (+$92M), 7,675 (+$83M), 7,700 (+$106M). That 7,700 strike is the strongest pull on the board. The gamma flip is tight though — 7,605 to 7,616, just 14 points below close. Under it, negative gamma stacks up: 7,600 (-$57M), 7,575 (-$59M), 7,500 (-$118M).
Wednesday flow matched the setup. Calls built across 7,630–7,700. Puts piled at 7,500 and 7,550. ATM IV dropped to 14.6%.
Nvidia dropped after hours, so the open decides which regime we're in. Hold 7,605 and dealers dampen moves, with 7,650–7,700 the pull. Lose it and the flip reverses, 7,500 becomes the level. Range: 7,570–7,700.
SPX closed 7,619 Wednesday, up 1.3%, right inside the 7,520–7,670 band. The real shift is structural: net gamma flipped positive for the first time since late October — +$86M vs. -$651M Tuesday — and held even after expiring options rolled off.
For the first time in two weeks, the cushion sits above spot. The magnet cluster runs 7,650 (+$92M), 7,675 (+$83M), 7,700 (+$106M). That 7,700 strike is the strongest pull on the board. The gamma flip is tight though — 7,605 to 7,616, just 14 points below close. Under it, negative gamma stacks up: 7,600 (-$57M), 7,575 (-$59M), 7,500 (-$118M).
Wednesday flow matched the setup. Calls built across 7,630–7,700. Puts piled at 7,500 and 7,550. ATM IV dropped to 14.6%.
Nvidia dropped after hours, so the open decides which regime we're in. Hold 7,605 and dealers dampen moves, with 7,650–7,700 the pull. Lose it and the flip reverses, 7,500 becomes the level. Range: 7,570–7,700.
For the first time in two weeks, the cushion sits above spot. The magnet cluster runs 7,650 (+$92M), 7,675 (+$83M), 7,700 (+$106M). That 7,700 strike is the strongest pull on the board. The gamma flip is tight though — 7,605 to 7,616, just 14 points below close. Under it, negative gamma stacks up: 7,600 (-$57M), 7,575 (-$59M), 7,500 (-$118M).
Wednesday flow matched the setup. Calls built across 7,630–7,700. Puts piled at 7,500 and 7,550. ATM IV dropped to 14.6%.
Nvidia dropped after hours, so the open decides which regime we're in. Hold 7,605 and dealers dampen moves, with 7,650–7,700 the pull. Lose it and the flip reverses, 7,500 becomes the level. Range: 7,570–7,700.
304
·
--
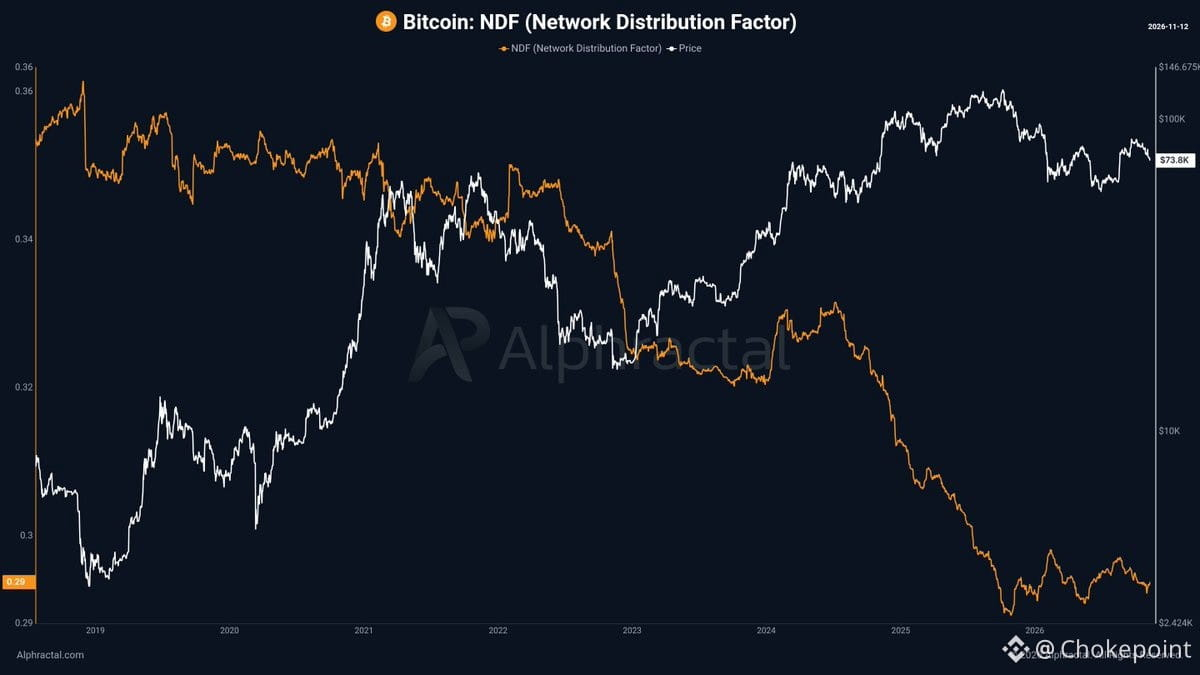
Bitcoin's supply is spreading out — and the data is striking.
The Network Distribution Factor (NDF) tracks how much $BTC is held by addresses controlling at least 0.01% of total supply. In 2018, these large holders controlled over 35% of all Bitcoin. Today? That's dropped to roughly 29% — one of the lowest readings on record.
What makes this more interesting: Bitcoin hit fresh all-time highs multiple times in recent years, yet concentration among these addresses kept falling. Supply is dispersing even as price climbs.
But here's the catch — addresses aren't people. The rise of ETFs, exchanges, and institutional custody means a single "large address" could represent thousands of investors, or one fund slicing holdings across multiple wallets. So the real question isn't just "is Bitcoin more distributed?" — it's "are we seeing genuine decentralization, or just a shift in how institutions custody their coins?"
Either way, the structural trend is clear: fewer mega-wallets controlling the float. Whether that's retail accumulation or institutional infrastructure buildout, it's a meaningful shift in how $BTC is held on-chain.
Bitcoin's supply is spreading out — and the data is striking.
The Network Distribution Factor (NDF) tracks how much $BTC is held by addresses controlling at least 0.01% of total supply. In 2018, these large holders controlled over 35% of all Bitcoin. Today? That's dropped to roughly 29% — one of the lowest readings on record.
What makes this more interesting: Bitcoin hit fresh all-time highs multiple times in recent years, yet concentration among these addresses kept falling. Supply is dispersing even as price climbs.
But here's the catch — addresses aren't people. The rise of ETFs, exchanges, and institutional custody means a single "large address" could represent thousands of investors, or one fund slicing holdings across multiple wallets. So the real question isn't just "is Bitcoin more distributed?" — it's "are we seeing genuine decentralization, or just a shift in how institutions custody their coins?"
Either way, the structural trend is clear: fewer mega-wallets controlling the float. Whether that's retail accumulation or institutional infrastructure buildout, it's a meaningful shift in how $BTC is held on-chain.
The Network Distribution Factor (NDF) tracks how much $BTC is held by addresses controlling at least 0.01% of total supply. In 2018, these large holders controlled over 35% of all Bitcoin. Today? That's dropped to roughly 29% — one of the lowest readings on record.
What makes this more interesting: Bitcoin hit fresh all-time highs multiple times in recent years, yet concentration among these addresses kept falling. Supply is dispersing even as price climbs.
But here's the catch — addresses aren't people. The rise of ETFs, exchanges, and institutional custody means a single "large address" could represent thousands of investors, or one fund slicing holdings across multiple wallets. So the real question isn't just "is Bitcoin more distributed?" — it's "are we seeing genuine decentralization, or just a shift in how institutions custody their coins?"
Either way, the structural trend is clear: fewer mega-wallets controlling the float. Whether that's retail accumulation or institutional infrastructure buildout, it's a meaningful shift in how $BTC is held on-chain.
154
·
--
Don't expect $SPY to carve a new low this week. Thursday's bottom should hold — doubt we revisit it.
Don't expect $SPY to carve a new low this week. Thursday's bottom should hold — doubt we revisit it.
128
·
--
Jensen's track record matters more than people think. He was early on gaming, early on CUDA, early on AI — each time before the market priced it in. That pattern-recognition and willingness to bet on infrastructure before demand is obvious is baked into $NVDA's multiple.
Which is exactly why "buy the dip" on Nvidia isn't a simple valuation call. You're not just buying chips or datacenter revenue — you're paying for the next move you can't see yet. The premium is the optionality that he spots the next platform shift before everyone else does.
So when the stock pulls back, the question isn't "is AI over?" It's "do you still trust that instinct is intact?" If yes, the dip is the trade. If you're not sure, the valuation won't save you.
Jensen's track record matters more than people think. He was early on gaming, early on CUDA, early on AI — each time before the market priced it in. That pattern-recognition and willingness to bet on infrastructure before demand is obvious is baked into $NVDA's multiple.
Which is exactly why "buy the dip" on Nvidia isn't a simple valuation call. You're not just buying chips or datacenter revenue — you're paying for the next move you can't see yet. The premium is the optionality that he spots the next platform shift before everyone else does.
So when the stock pulls back, the question isn't "is AI over?" It's "do you still trust that instinct is intact?" If yes, the dip is the trade. If you're not sure, the valuation won't save you.
Which is exactly why "buy the dip" on Nvidia isn't a simple valuation call. You're not just buying chips or datacenter revenue — you're paying for the next move you can't see yet. The premium is the optionality that he spots the next platform shift before everyone else does.
So when the stock pulls back, the question isn't "is AI over?" It's "do you still trust that instinct is intact?" If yes, the dip is the trade. If you're not sure, the valuation won't save you.
301
·
--
Someone just loaded 1560 weekly calls on $LLY — that's not a casual bet. When size like that shows up in short-dated options, it's often a tell that institutional desks are positioning for a sharp move. Either they know something about earnings volatility spilling into broader indices, or they're hedging a portfolio that's about to get choppy.
Either way, when pharma mega-caps start seeing unusual call activity in the front week, it tends to precede wider market swings. $LLY moves with healthcare, but it also moves with risk appetite — and right now, this looks like someone bracing for turbulence, not betting on calm.
If you're watching gamma levels on $SPX or volatility structure in the VIX curve, this is another data point suggesting next week could get messy. Not a prediction, just a signal worth tracking.
Someone just loaded 1560 weekly calls on $LLY — that's not a casual bet. When size like that shows up in short-dated options, it's often a tell that institutional desks are positioning for a sharp move. Either they know something about earnings volatility spilling into broader indices, or they're hedging a portfolio that's about to get choppy.
Either way, when pharma mega-caps start seeing unusual call activity in the front week, it tends to precede wider market swings. $LLY moves with healthcare, but it also moves with risk appetite — and right now, this looks like someone bracing for turbulence, not betting on calm.
If you're watching gamma levels on $SPX or volatility structure in the VIX curve, this is another data point suggesting next week could get messy. Not a prediction, just a signal worth tracking.
Either way, when pharma mega-caps start seeing unusual call activity in the front week, it tends to precede wider market swings. $LLY moves with healthcare, but it also moves with risk appetite — and right now, this looks like someone bracing for turbulence, not betting on calm.
If you're watching gamma levels on $SPX or volatility structure in the VIX curve, this is another data point suggesting next week could get messy. Not a prediction, just a signal worth tracking.
514
·
--
SPX targeting 7625 — that's the level they're gunning for. Watch the gamma structure and dealer positioning into this move. If we're reading the options flow right, this isn't random — there's a clear magnet pulling price action toward that strike. Likely a combo of pinning mechanics and institutional hedging flows creating the path of least resistance. Keep an eye on realized vol vs implied — if vol stays compressed, the drift higher becomes mechanical. This is textbook late-cycle index behavior when gamma flips supportive.
SPX targeting 7625 — that's the level they're gunning for. Watch the gamma structure and dealer positioning into this move. If we're reading the options flow right, this isn't random — there's a clear magnet pulling price action toward that strike. Likely a combo of pinning mechanics and institutional hedging flows creating the path of least resistance. Keep an eye on realized vol vs implied — if vol stays compressed, the drift higher becomes mechanical. This is textbook late-cycle index behavior when gamma flips supportive.
243
·
--
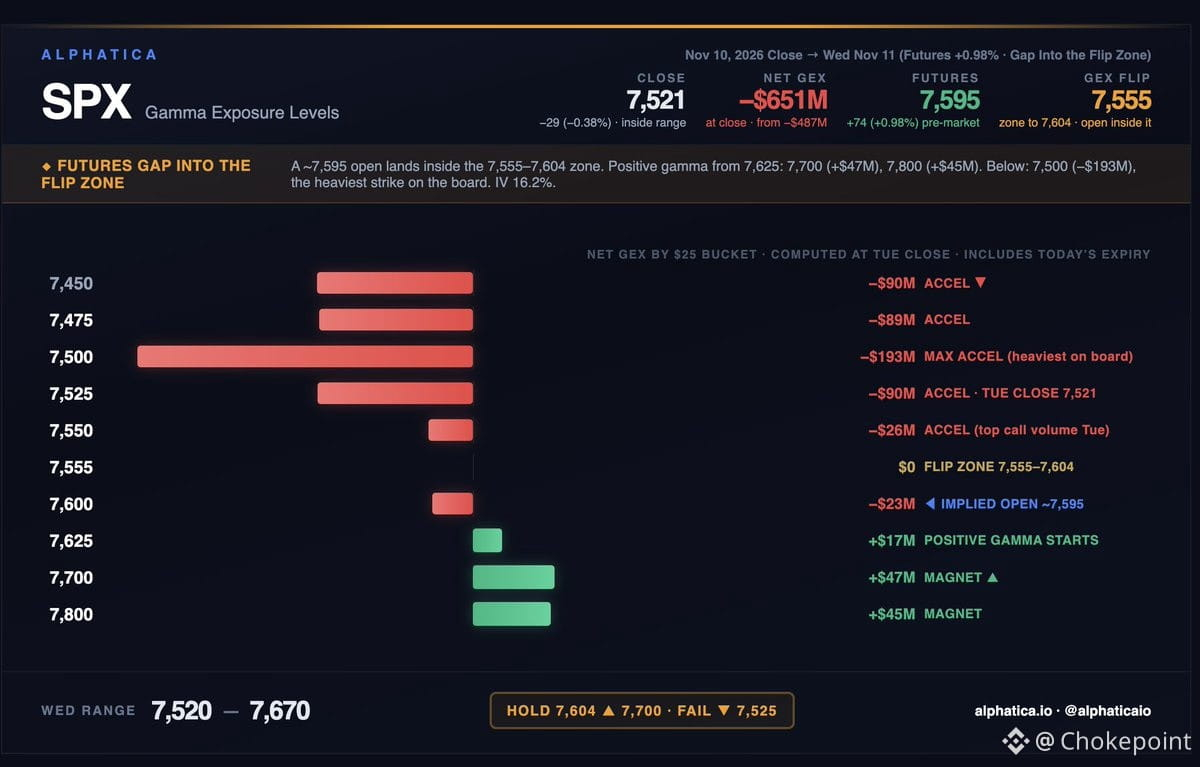
$SPX opened at 7,595 this morning — right in the flip zone between 7,555 and 7,604. Dealers are near neutral here, so the market has to do its own work.
The setup is clean. Above 7,604, positive gamma kicks in at 7,625 (+$17M), 7,700 (+$47M), and 7,800 (+$45M). That's where the magnet sits if we hold the breakout.
Below, it's still ugly. The 7,500 strike is carrying -$193M — the heaviest negative gamma on the board. Then 7,525 at -$90M and 7,550 at -$26M. Net gamma was -$651M at yesterday's close, so the index is sitting on a trapdoor if it falls back through the zone.
Tuesday's flow was constructive — calls at 7,550 through 7,700, puts stacking at 7,400–7,500. Put/call volume was 1.38. ATM IV at 16.2% says nobody's pricing drama yet.
The line is 7,604. Hold it and we grind toward 7,700. Lose it and 7,525 is the first real test, with 7,500 underneath that. Range today: 7,520–7,670.
$SPX opened at 7,595 this morning — right in the flip zone between 7,555 and 7,604. Dealers are near neutral here, so the market has to do its own work.
The setup is clean. Above 7,604, positive gamma kicks in at 7,625 (+$17M), 7,700 (+$47M), and 7,800 (+$45M). That's where the magnet sits if we hold the breakout.
Below, it's still ugly. The 7,500 strike is carrying -$193M — the heaviest negative gamma on the board. Then 7,525 at -$90M and 7,550 at -$26M. Net gamma was -$651M at yesterday's close, so the index is sitting on a trapdoor if it falls back through the zone.
Tuesday's flow was constructive — calls at 7,550 through 7,700, puts stacking at 7,400–7,500. Put/call volume was 1.38. ATM IV at 16.2% says nobody's pricing drama yet.
The line is 7,604. Hold it and we grind toward 7,700. Lose it and 7,525 is the first real test, with 7,500 underneath that. Range today: 7,520–7,670.
The setup is clean. Above 7,604, positive gamma kicks in at 7,625 (+$17M), 7,700 (+$47M), and 7,800 (+$45M). That's where the magnet sits if we hold the breakout.
Below, it's still ugly. The 7,500 strike is carrying -$193M — the heaviest negative gamma on the board. Then 7,525 at -$90M and 7,550 at -$26M. Net gamma was -$651M at yesterday's close, so the index is sitting on a trapdoor if it falls back through the zone.
Tuesday's flow was constructive — calls at 7,550 through 7,700, puts stacking at 7,400–7,500. Put/call volume was 1.38. ATM IV at 16.2% says nobody's pricing drama yet.
The line is 7,604. Hold it and we grind toward 7,700. Lose it and 7,525 is the first real test, with 7,500 underneath that. Range today: 7,520–7,670.
298
·
--
$CRWV just printed Q3 numbers that show the AI infrastructure buildout is still running white-hot — and the prepayment line might be the most interesting tell.
Revenue hit $3.66B, up 168% year-over-year. That's not just growth, that's a capacity land-grab in real time. Revenue backlog now sits at $132.5B, up 138% YoY, which means customers are locking in compute years in advance. Active power crossed 1.7GW, with total contracted power at 4.6GW+. For context, that's enough to power a small country — and it's all going into GPUs.
But here's the kicker: $9B in customer prepayments and deposits this quarter alone. That's not just demand, that's desperation. Hyperscalers and AI labs are paying upfront to secure capacity because supply is the bottleneck. It's the inverse of a traditional SaaS model — customers are financing the buildout because they can't afford to wait.
Guidance for FY26 is $13.0B-$13.3B in revenue, with exit ARR guidance of $20B-$21B. That ARR number implies they're signing multi-year contracts at scale, and the prepayments suggest those contracts are being paid for in advance. This is what happens when compute is the new oil and there aren't enough rigs.
The upstream read: CoreWeave is a direct proxy for GPU demand, power infrastructure, and the race to scale AI inference and training. If you're tracking the AI buildout, this is one of the clearest demand signals you'll get. The prepayment line is the tell — customers are paying now because they know capacity won't be there later.
$CRWV just printed Q3 numbers that show the AI infrastructure buildout is still running white-hot — and the prepayment line might be the most interesting tell.
Revenue hit $3.66B, up 168% year-over-year. That's not just growth, that's a capacity land-grab in real time. Revenue backlog now sits at $132.5B, up 138% YoY, which means customers are locking in compute years in advance. Active power crossed 1.7GW, with total contracted power at 4.6GW+. For context, that's enough to power a small country — and it's all going into GPUs.
But here's the kicker: $9B in customer prepayments and deposits this quarter alone. That's not just demand, that's desperation. Hyperscalers and AI labs are paying upfront to secure capacity because supply is the bottleneck. It's the inverse of a traditional SaaS model — customers are financing the buildout because they can't afford to wait.
Guidance for FY26 is $13.0B-$13.3B in revenue, with exit ARR guidance of $20B-$21B. That ARR number implies they're signing multi-year contracts at scale, and the prepayments suggest those contracts are being paid for in advance. This is what happens when compute is the new oil and there aren't enough rigs.
The upstream read: CoreWeave is a direct proxy for GPU demand, power infrastructure, and the race to scale AI inference and training. If you're tracking the AI buildout, this is one of the clearest demand signals you'll get. The prepayment line is the tell — customers are paying now because they know capacity won't be there later.
Revenue hit $3.66B, up 168% year-over-year. That's not just growth, that's a capacity land-grab in real time. Revenue backlog now sits at $132.5B, up 138% YoY, which means customers are locking in compute years in advance. Active power crossed 1.7GW, with total contracted power at 4.6GW+. For context, that's enough to power a small country — and it's all going into GPUs.
But here's the kicker: $9B in customer prepayments and deposits this quarter alone. That's not just demand, that's desperation. Hyperscalers and AI labs are paying upfront to secure capacity because supply is the bottleneck. It's the inverse of a traditional SaaS model — customers are financing the buildout because they can't afford to wait.
Guidance for FY26 is $13.0B-$13.3B in revenue, with exit ARR guidance of $20B-$21B. That ARR number implies they're signing multi-year contracts at scale, and the prepayments suggest those contracts are being paid for in advance. This is what happens when compute is the new oil and there aren't enough rigs.
The upstream read: CoreWeave is a direct proxy for GPU demand, power infrastructure, and the race to scale AI inference and training. If you're tracking the AI buildout, this is one of the clearest demand signals you'll get. The prepayment line is the tell — customers are paying now because they know capacity won't be there later.

154
Log in to explore more content
Join global crypto users on Binance Square
⚡️ Get latest and useful information about crypto.
💬 Trusted by the world’s largest crypto exchange.
👍 Discover real insights from verified creators.
Email / Phone number
Trending Topics
WhoWillSucceedJensenHuangatNvidia?
93,555 views
1,182 Discussing
Nvidia Says No CEO Talks Underway as "Stand With Jensen" Petition Tops 77,900 Signatures
Binance News
·29 Likes
·39k views
WhatWillDriveCryptoandStocks’NextRebound?
450,910 views
3,080 Discussing
BitcoinActiveSupplyInProfitDropsBelow45%
28,913 views
387 Discussing