
CAN_DX
14.9k Posts

CAN_DX
 Square Verified
Report
Block User
Your daily dose of Web3 alpha, signals & real talk. No FLUFF. JUST FACTS.👊X: @Can__dX7
362 Following
50.8K+ Followers
34.9K+ Liked
Posts
All
Quotes
Live
PINNED
·
--
NFP came in stronger than expected, so now all eyes are on CPI.
My personal view: the Fed is more likely to hold rates unless CPI comes in much hotter than expected.
I’m watching gold closely because sticky inflation could continue to support it. Stocks may see higher volatility, especially after the CPI release.
If CPI comes in soft, risk assets could get some relief.
If CPI comes in hot, rate hike fears could return and put pressure on the market.
My bias: cautiously bullish on gold, careful on stocks.
Fed hike or hold?
#CPIWatch
NFP came in stronger than expected, so now all eyes are on CPI.
My personal view: the Fed is more likely to hold rates unless CPI comes in much hotter than expected.
I’m watching gold closely because sticky inflation could continue to support it. Stocks may see higher volatility, especially after the CPI release.
If CPI comes in soft, risk assets could get some relief.
If CPI comes in hot, rate hike fears could return and put pressure on the market.
My bias: cautiously bullish on gold, careful on stocks.
Fed hike or hold?
#CPIWatch
My personal view: the Fed is more likely to hold rates unless CPI comes in much hotter than expected.
I’m watching gold closely because sticky inflation could continue to support it. Stocks may see higher volatility, especially after the CPI release.
If CPI comes in soft, risk assets could get some relief.
If CPI comes in hot, rate hike fears could return and put pressure on the market.
My bias: cautiously bullish on gold, careful on stocks.
Fed hike or hold?
#CPIWatch

32
33
7.8k
·
--
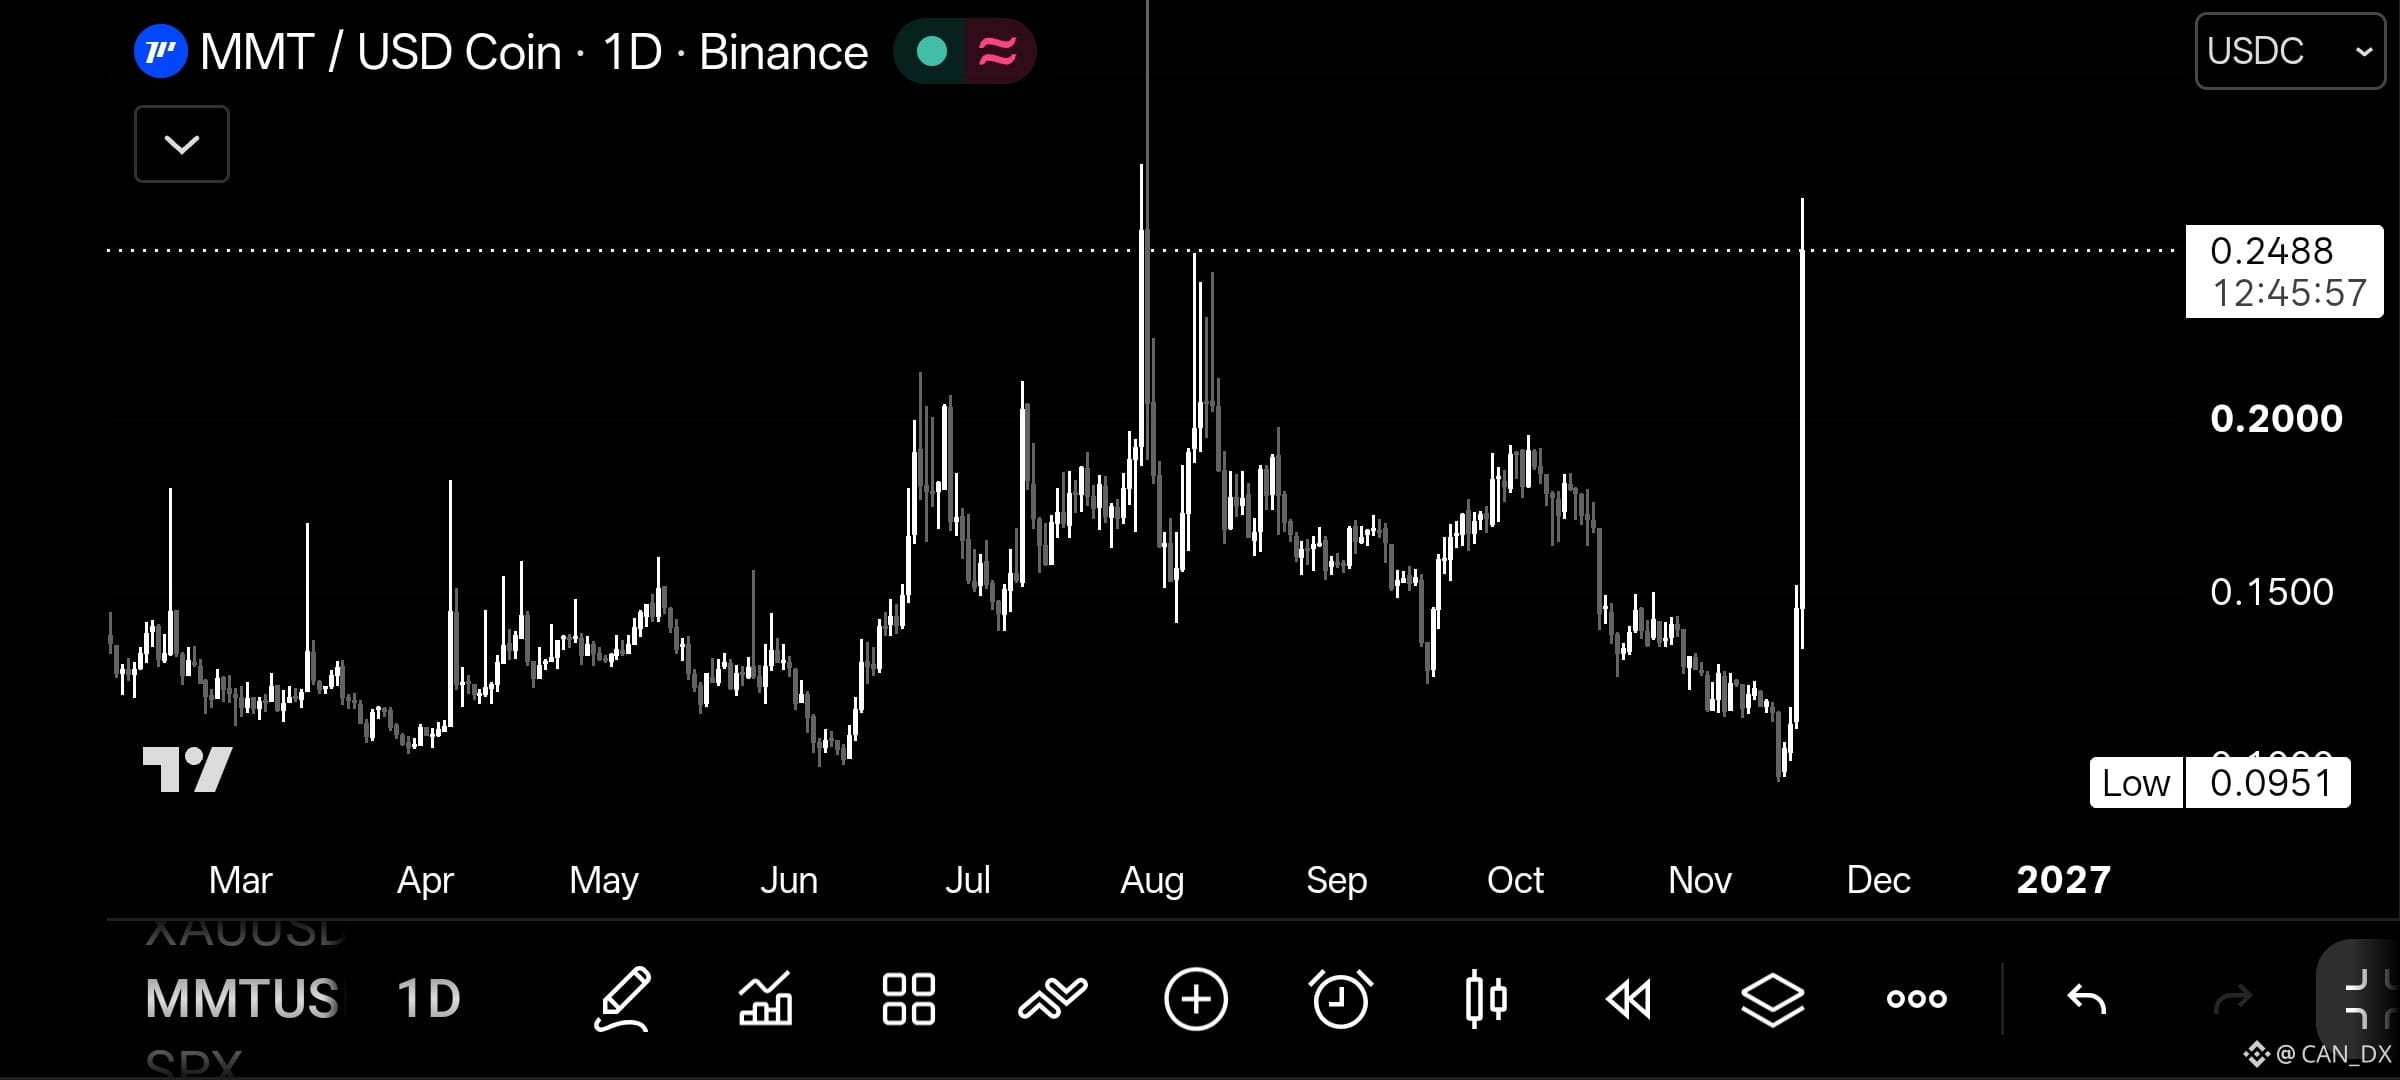
$MMT Buyers Are Trying to Bounce Back.
$MMT recently tested the $0.0951 support zone and showed a recovery toward $0.1500.
Key levels to watch:
Support: $0.095–$0.100
Resistance: $0.150
Next resistance: $0.180–$0.200
A strong daily close above $0.150 could improve bullish momentum. However, losing $0.095 would increase downside risk.
Can $MMT buyers maintain this recovery?
#MMT #Crypto #BinanceSquare
$MMT Buyers Are Trying to Bounce Back.
$MMT recently tested the $0.0951 support zone and showed a recovery toward $0.1500.
Key levels to watch:
Support: $0.095–$0.100
Resistance: $0.150
Next resistance: $0.180–$0.200
A strong daily close above $0.150 could improve bullish momentum. However, losing $0.095 would increase downside risk.
Can $MMT buyers maintain this recovery?
#MMT #Crypto #BinanceSquare
$MMT recently tested the $0.0951 support zone and showed a recovery toward $0.1500.
Key levels to watch:
Support: $0.095–$0.100
Resistance: $0.150
Next resistance: $0.180–$0.200
A strong daily close above $0.150 could improve bullish momentum. However, losing $0.095 would increase downside risk.
Can $MMT buyers maintain this recovery?
#MMT #Crypto #BinanceSquare
14
13
2.5k
·
--
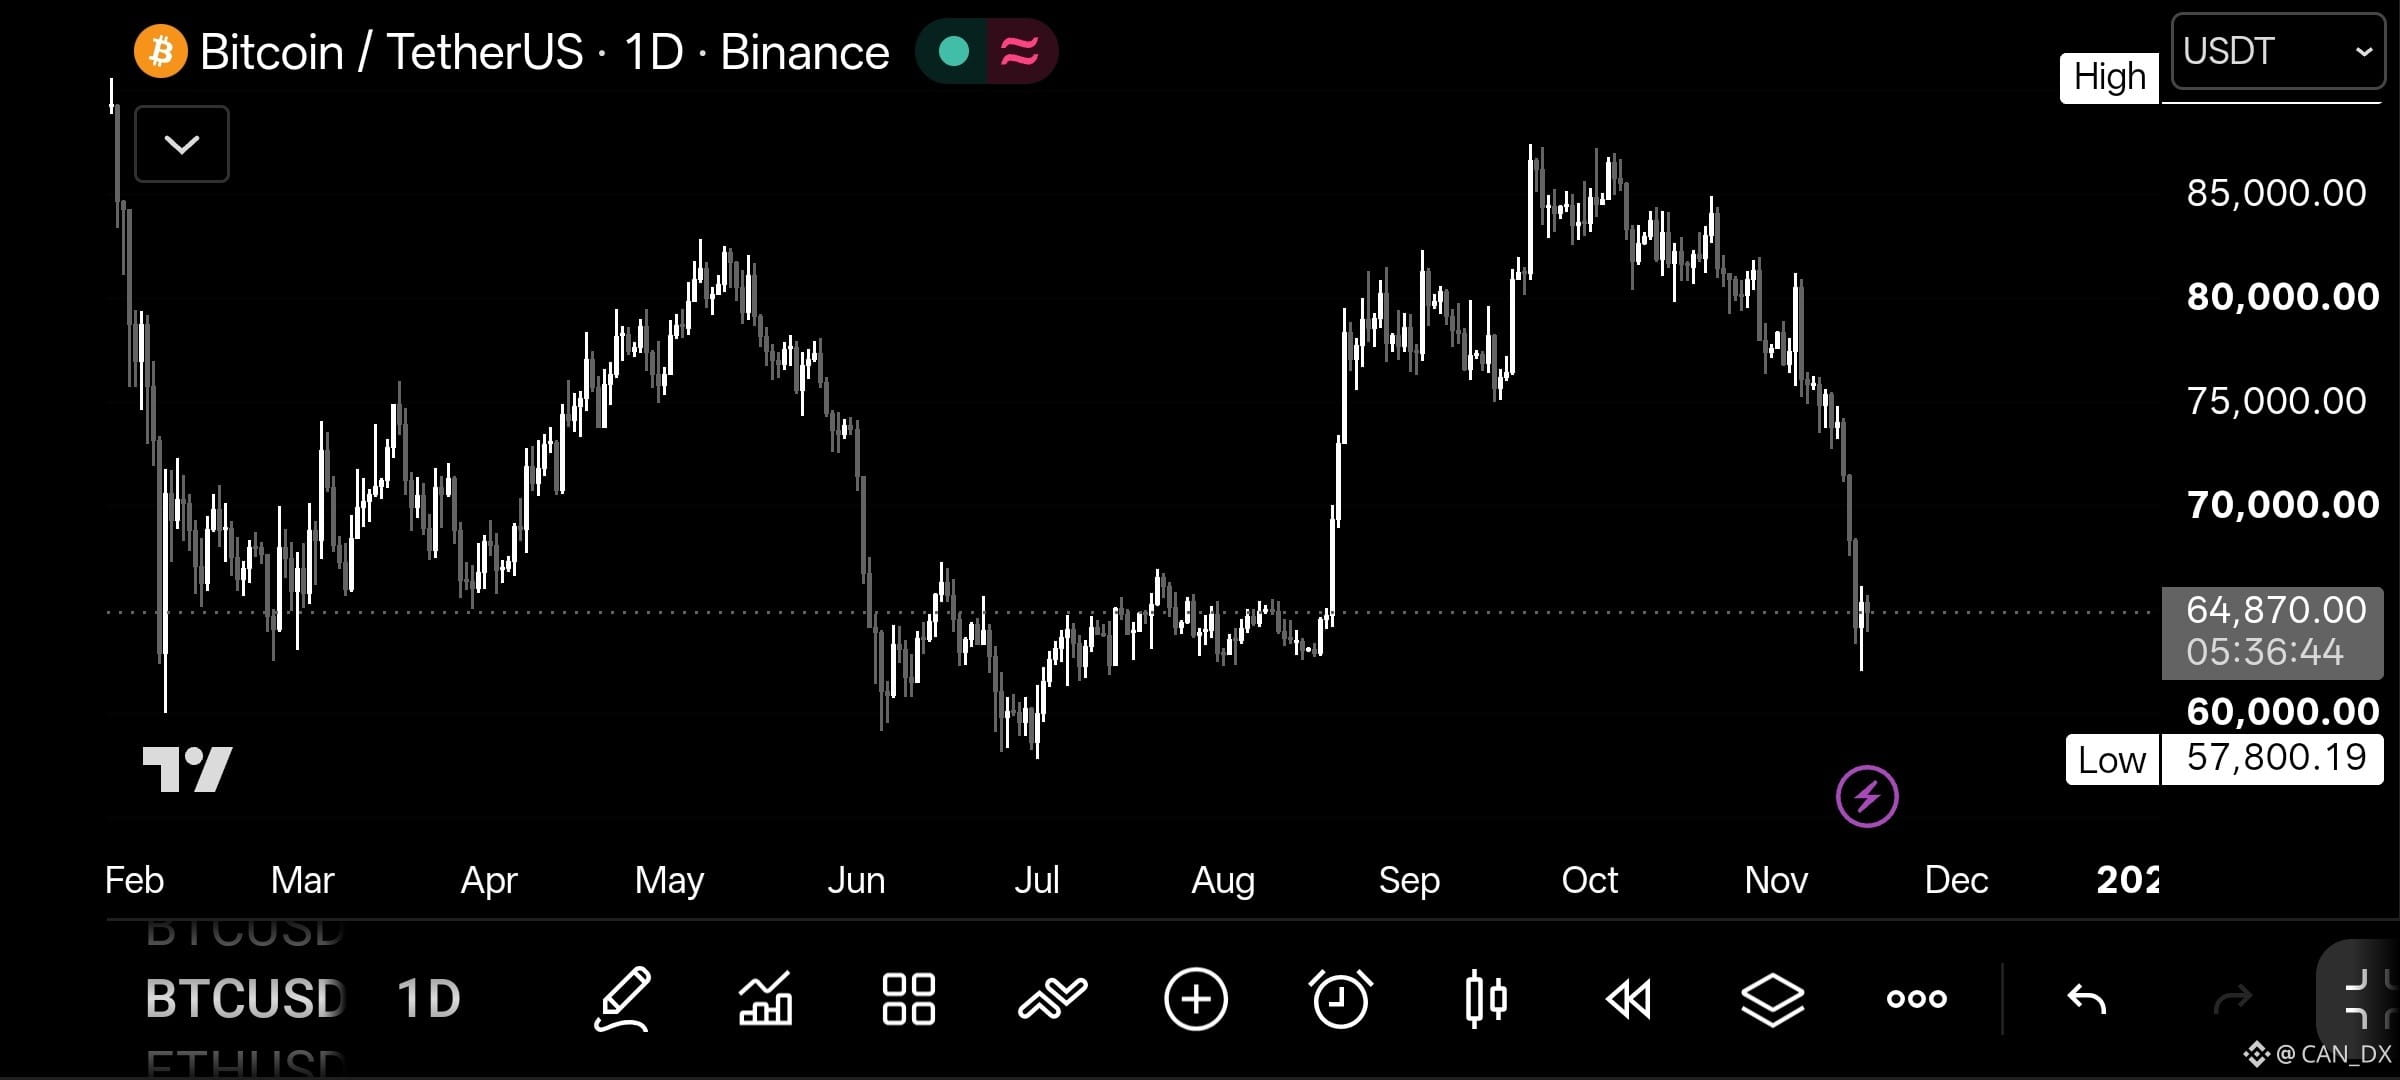
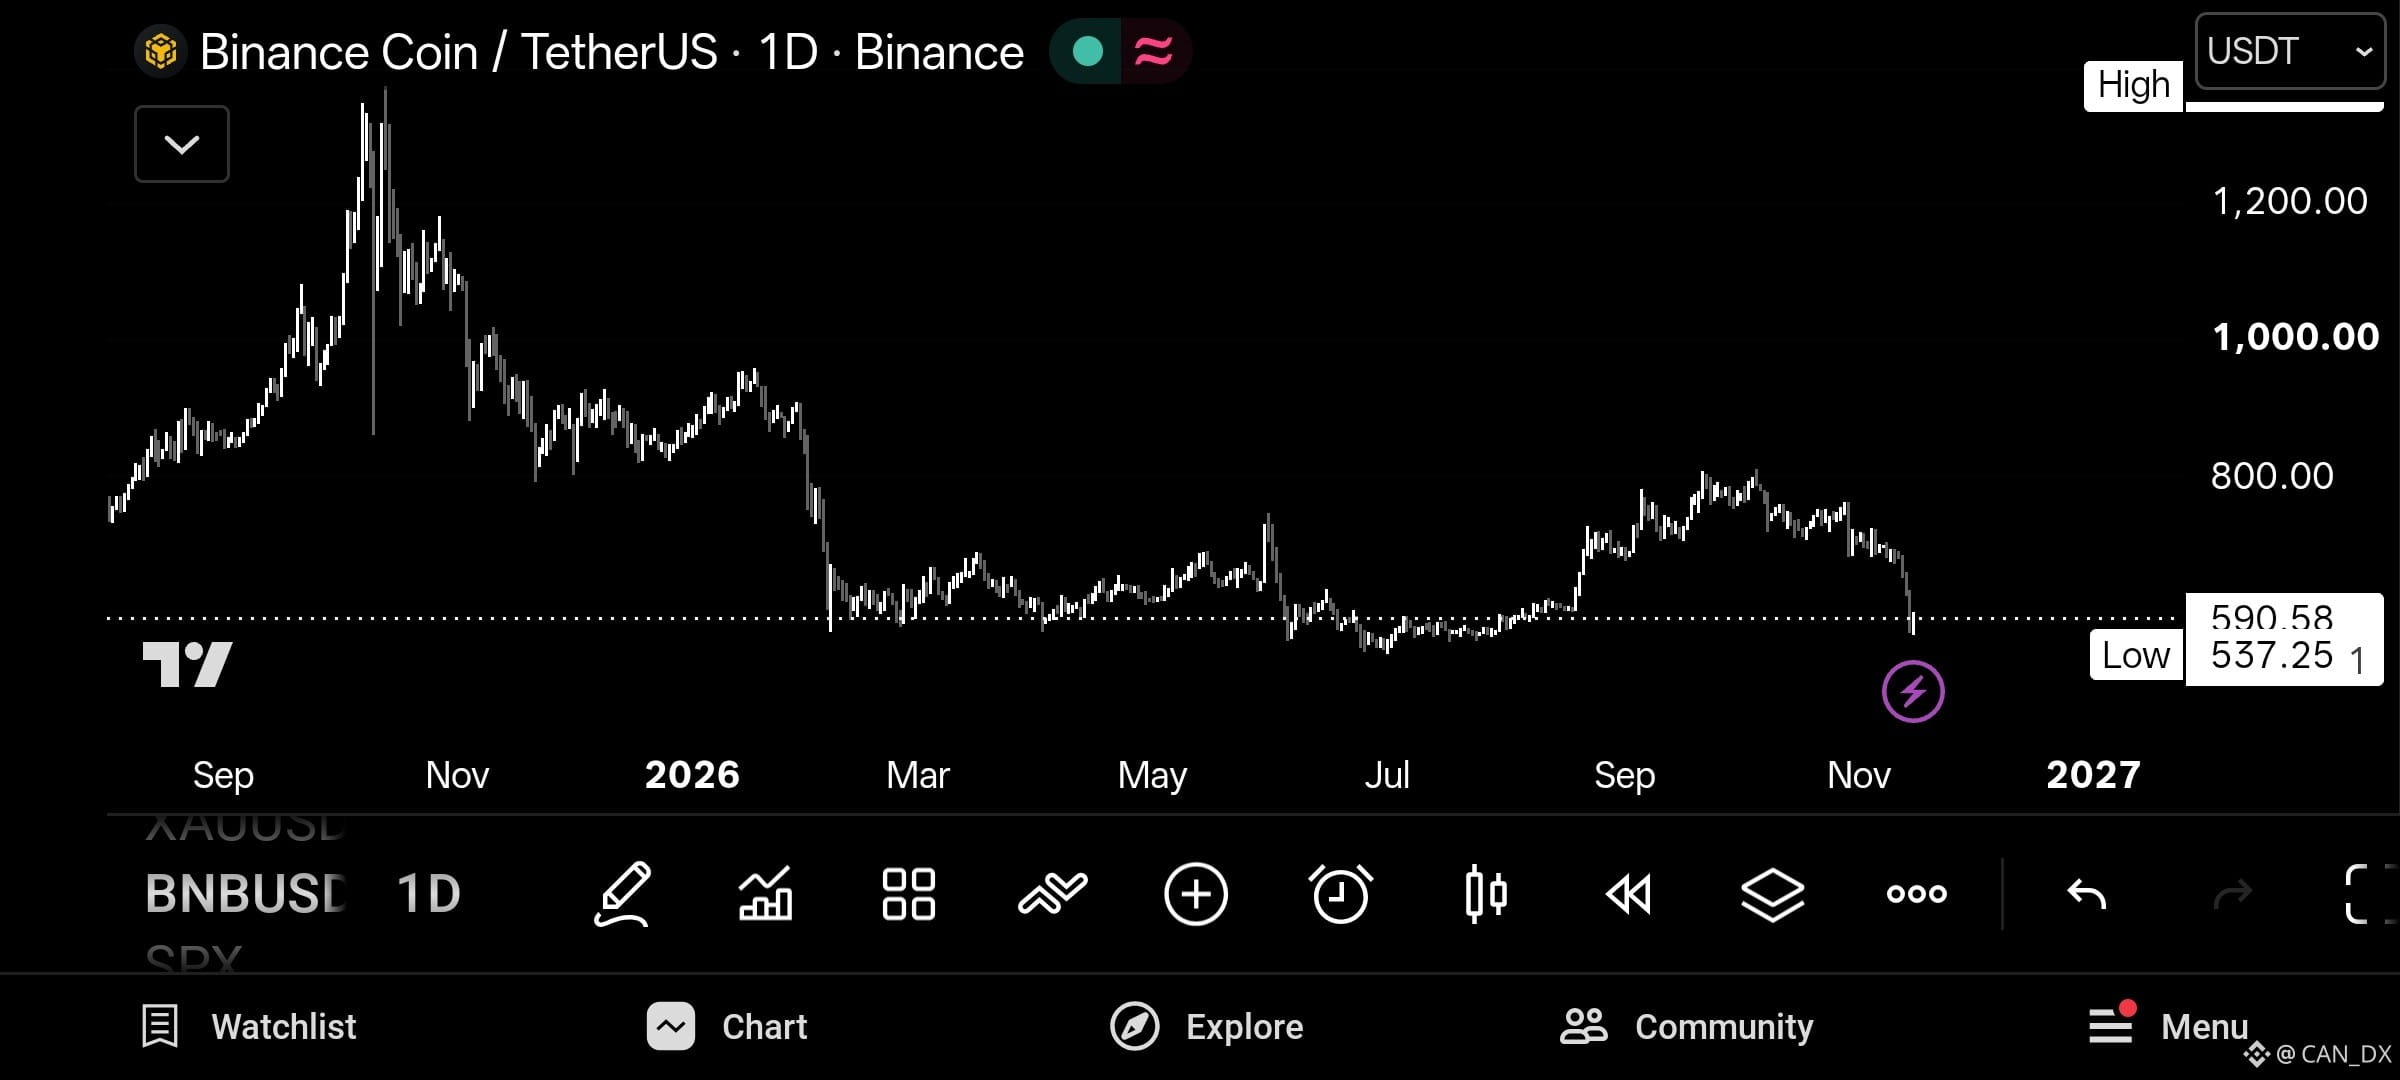
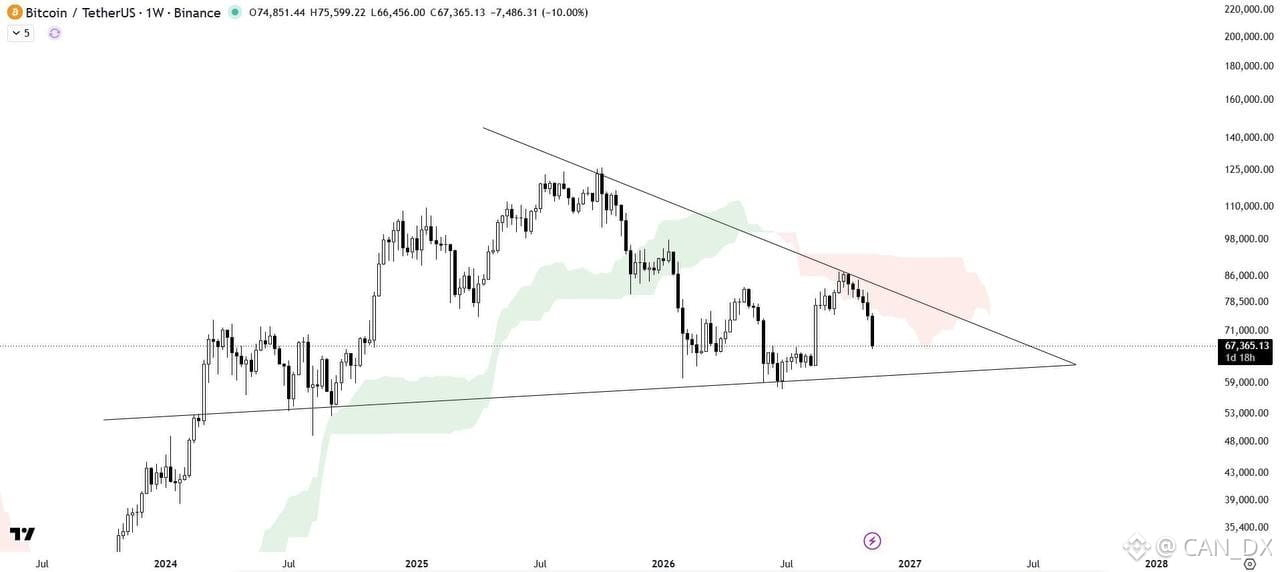
$BTC is near $64,870 after a sharp drop on the daily chart. I’m watching $66K–$67K because the last bounce in July stalled around that zone.
A daily close above $67K would give me more confidence in the recovery. If selling continues, I’ll be watching $57.8K–$60K, where buyers stepped in around the start of July.
#BTC #crypto #Binance
$BTC is near $64,870 after a sharp drop on the daily chart. I’m watching $66K–$67K because the last bounce in July stalled around that zone.
A daily close above $67K would give me more confidence in the recovery. If selling continues, I’ll be watching $57.8K–$60K, where buyers stepped in around the start of July.
#BTC #crypto #Binance
A daily close above $67K would give me more confidence in the recovery. If selling continues, I’ll be watching $57.8K–$60K, where buyers stepped in around the start of July.
#BTC #crypto #Binance
38
20
3.3k
·
--
Verified
#sxt $SXT If an AI app tells me a DeFi pool earned $500 in fees yesterday, I’d like to check the math.
That’s what caught my eye about @SpaceandTimeDB .
It’s a Microsoft-backed blockchain that uses zero-knowledge proofs to show that a result was calculated correctly.
A tokenized fund could use the same tech to show investors how it worked out their payouts.
$SXT is the native token of Space and Time.
#sxt $SXT If an AI app tells me a DeFi pool earned $500 in fees yesterday, I’d like to check the math.
That’s what caught my eye about @SpaceandTime .
It’s a Microsoft-backed blockchain that uses zero-knowledge proofs to show that a result was calculated correctly.
A tokenized fund could use the same tech to show investors how it worked out their payouts.
$SXT is the native token of Space and Time.
That’s what caught my eye about @SpaceandTime .
It’s a Microsoft-backed blockchain that uses zero-knowledge proofs to show that a result was calculated correctly.
A tokenized fund could use the same tech to show investors how it worked out their payouts.
$SXT is the native token of Space and Time.
38
32
4.5k
·
--
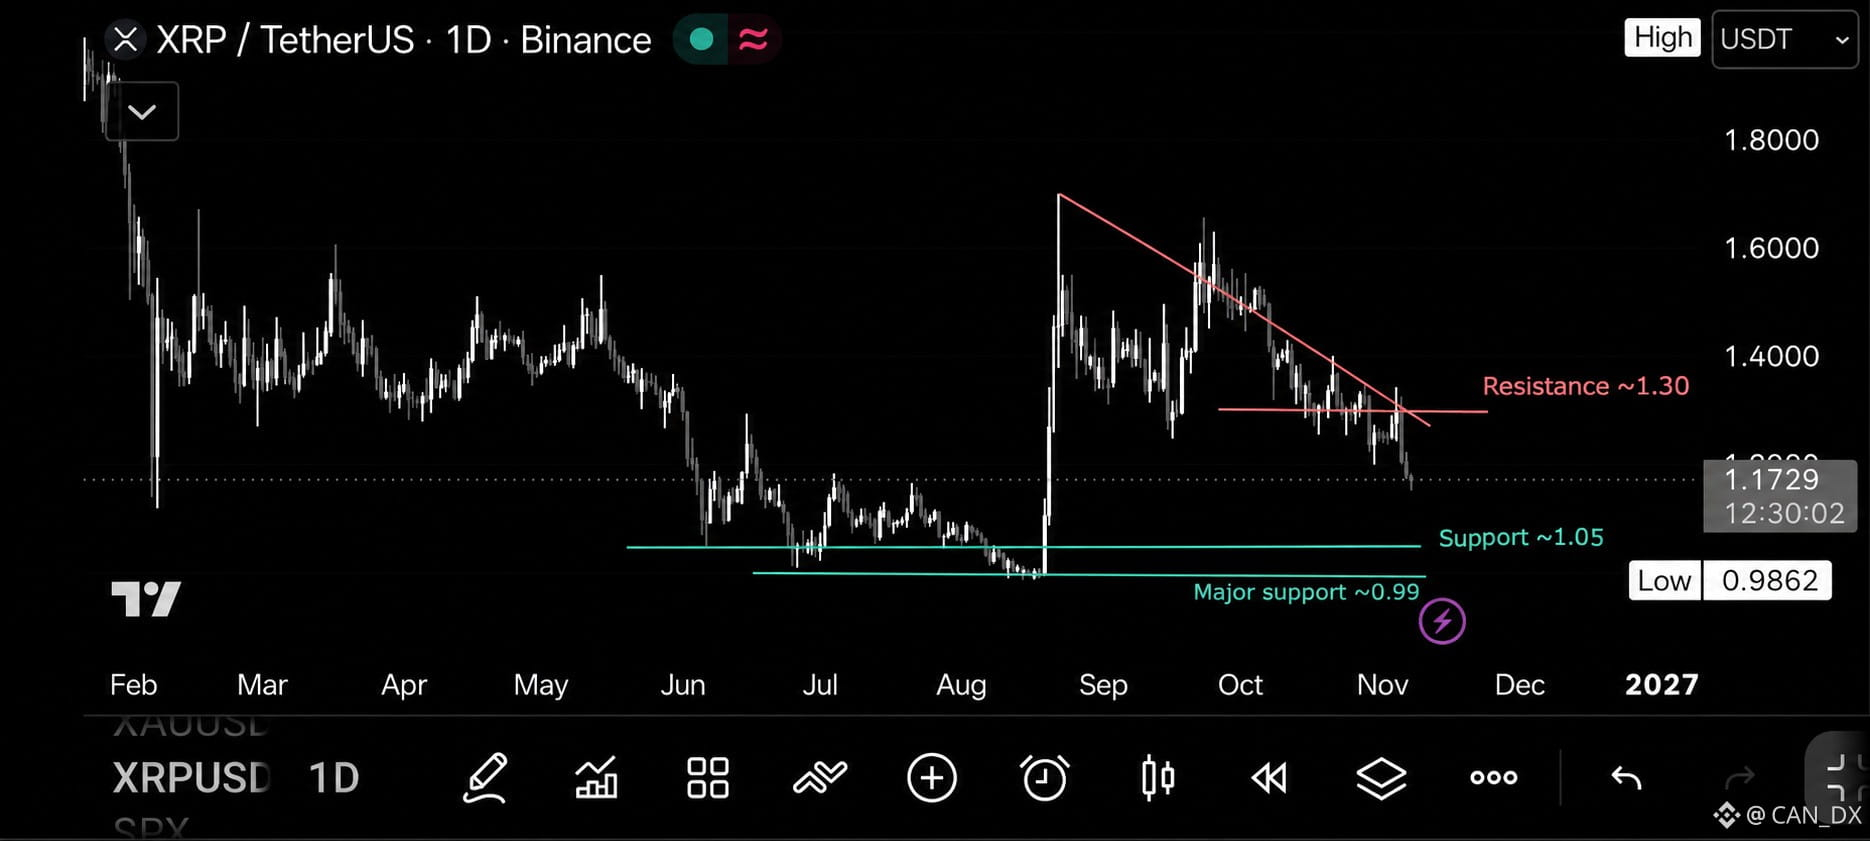
$XRP needs buyers to step in.
On this daily chart, price is near $1.17 and remains under a descending trendline. I’m watching $1.30 as the key resistance, with support around $1.05 and $0.99.
My view: I’d wait for a confirmed breakout and a steady retest before calling a recovery. Until then, lower highs keep me cautious.
#XRP #Ripple #Crypto #Altcoins #TechnicalAnalysis
$XRP needs buyers to step in.
On this daily chart, price is near $1.17 and remains under a descending trendline. I’m watching $1.30 as the key resistance, with support around $1.05 and $0.99.
My view: I’d wait for a confirmed breakout and a steady retest before calling a recovery. Until then, lower highs keep me cautious.
#XRP #Ripple #Crypto #Altcoins #TechnicalAnalysis
On this daily chart, price is near $1.17 and remains under a descending trendline. I’m watching $1.30 as the key resistance, with support around $1.05 and $0.99.
My view: I’d wait for a confirmed breakout and a steady retest before calling a recovery. Until then, lower highs keep me cautious.
#XRP #Ripple #Crypto #Altcoins #TechnicalAnalysis
16
13
552
·
--
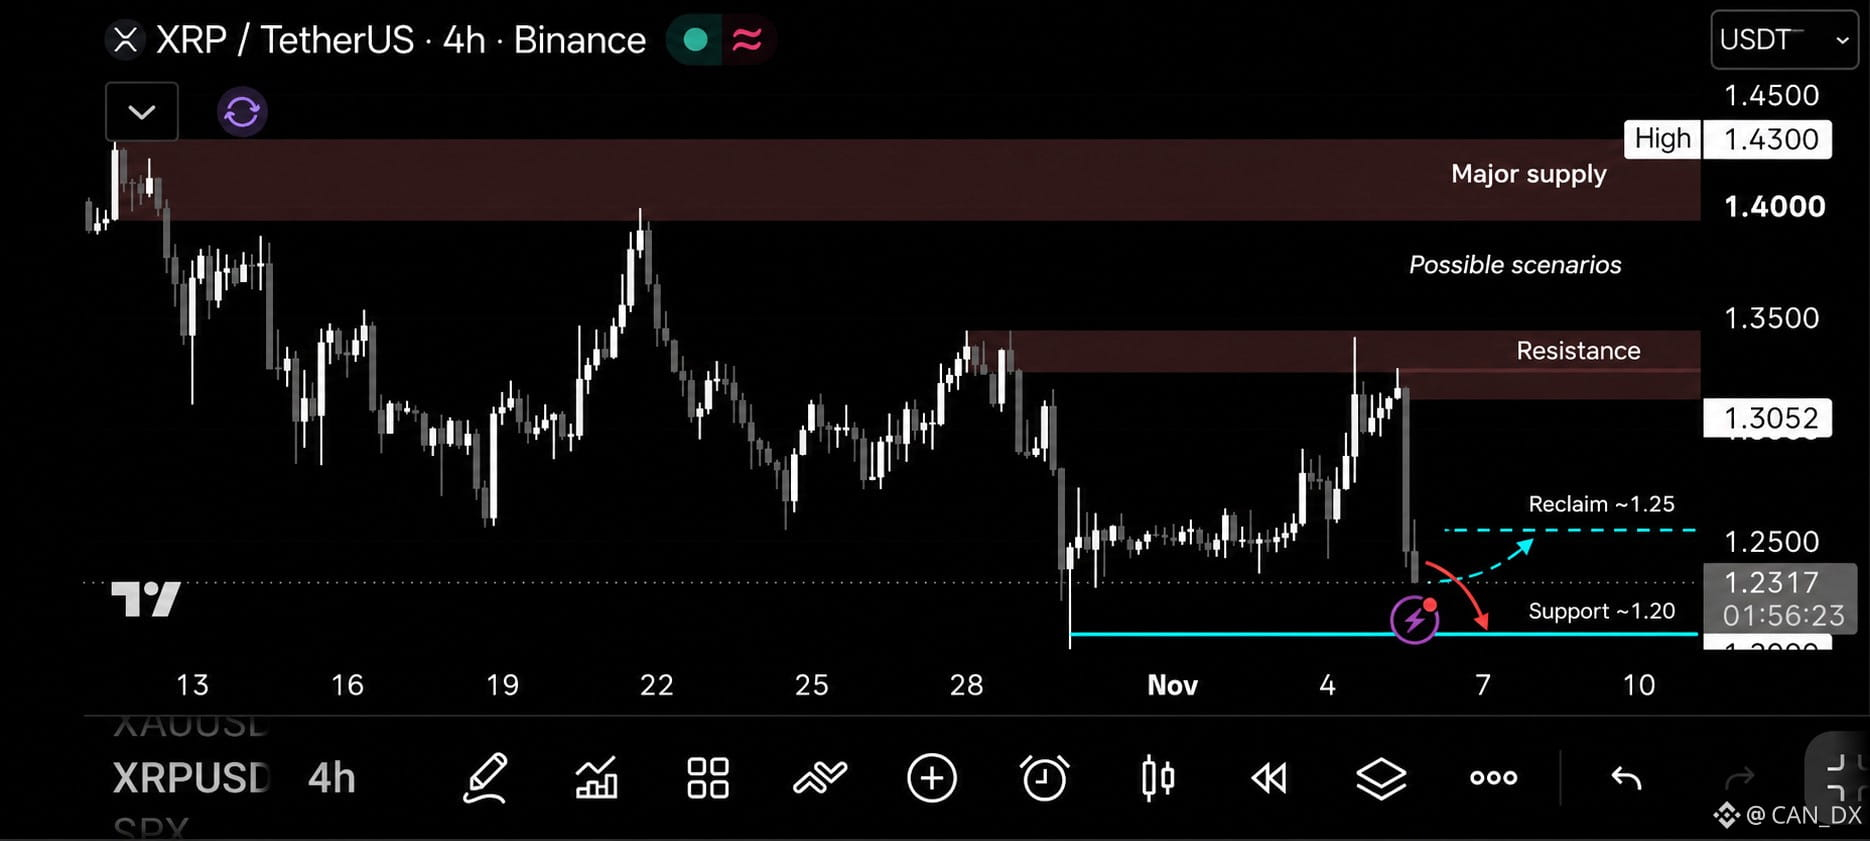
I’m watching $XRP after its sharp drop toward $1.23 on this 4H chart.
Support is near $1.20. Holding this level and moving back above $1.25 could help buyers recover. The next resistance area is $1.31 to $1.34.
Losing $1.20 would weaken the setup. For now, I’m waiting to see how price reacts near support.
#XRP #Crypto #BinanceSquare #Ripple #Write2Earn
I’m watching $XRP after its sharp drop toward $1.23 on this 4H chart.
Support is near $1.20. Holding this level and moving back above $1.25 could help buyers recover. The next resistance area is $1.31 to $1.34.
Losing $1.20 would weaken the setup. For now, I’m waiting to see how price reacts near support.
#XRP #Crypto #BinanceSquare #Ripple #Write2Earn
Support is near $1.20. Holding this level and moving back above $1.25 could help buyers recover. The next resistance area is $1.31 to $1.34.
Losing $1.20 would weaken the setup. For now, I’m waiting to see how price reacts near support.
#XRP #Crypto #BinanceSquare #Ripple #Write2Earn
22
16
804
·
--
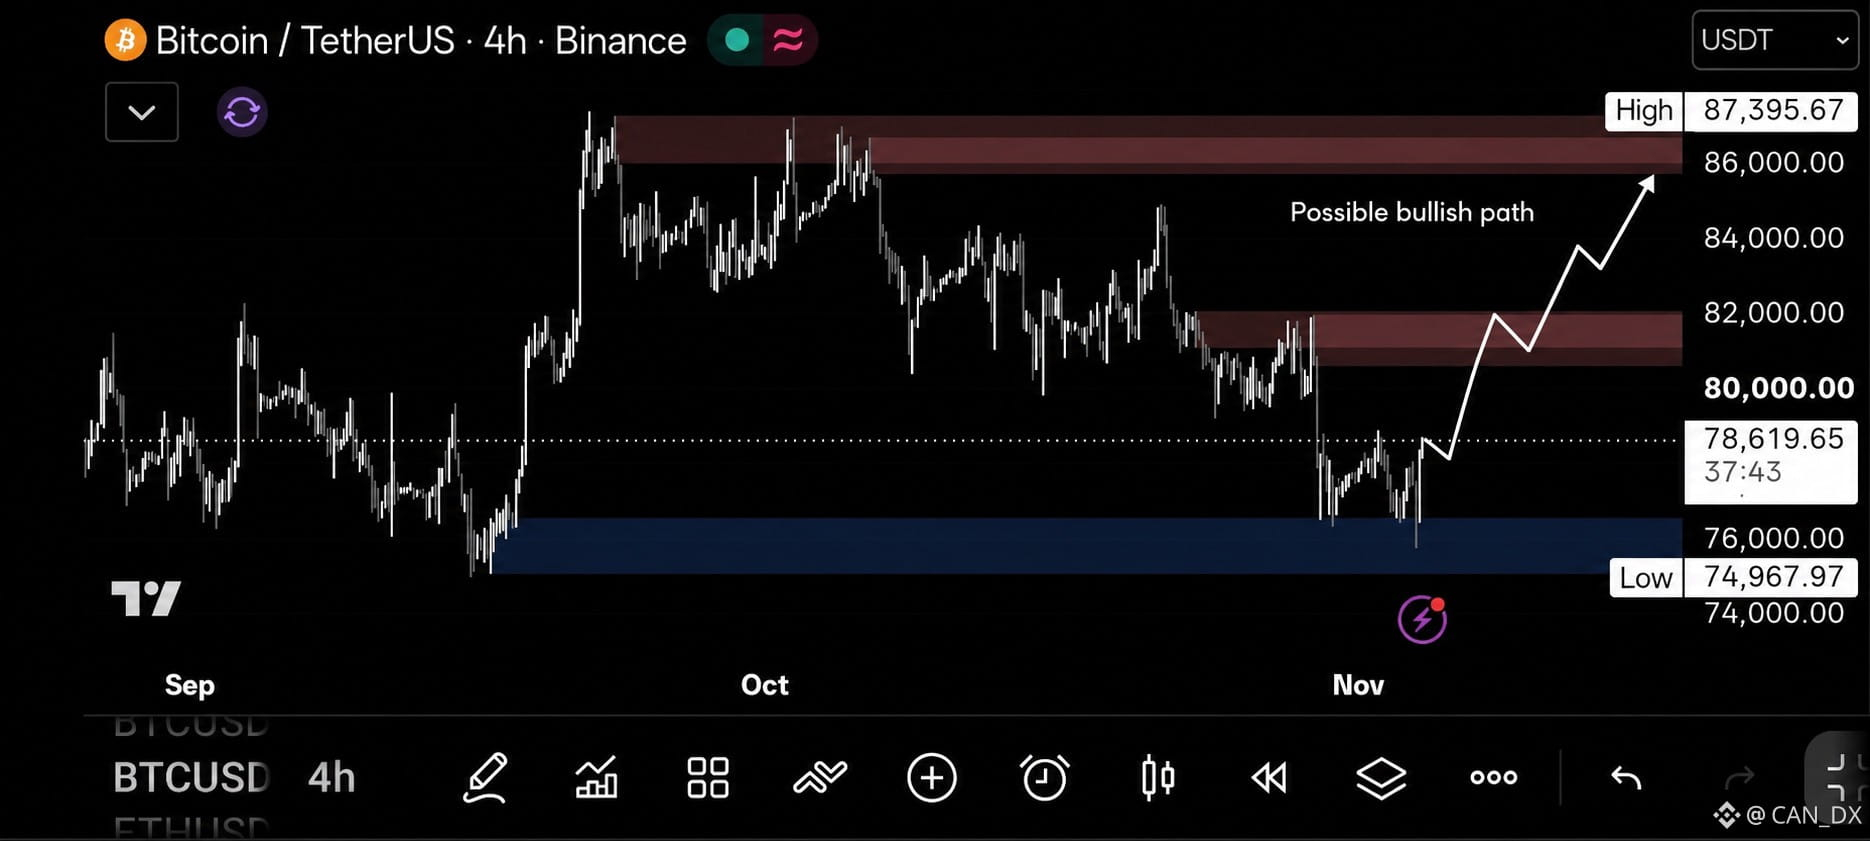
$BTC is bouncing from the $75K to $76.5K support zone.
Holding here could bring $82K next, then $86K if buyers stay strong. Below $75K, this setup weakens.
#Bitcoin #BTC #Crypto #BTCUSDT #CryptoTrading
$BTC is bouncing from the $75K to $76.5K support zone.
Holding here could bring $82K next, then $86K if buyers stay strong. Below $75K, this setup weakens.
#Bitcoin #BTC #Crypto #BTCUSDT #CryptoTrading
Holding here could bring $82K next, then $86K if buyers stay strong. Below $75K, this setup weakens.
#Bitcoin #BTC #Crypto #BTCUSDT #CryptoTrading
15
18
933
·
--
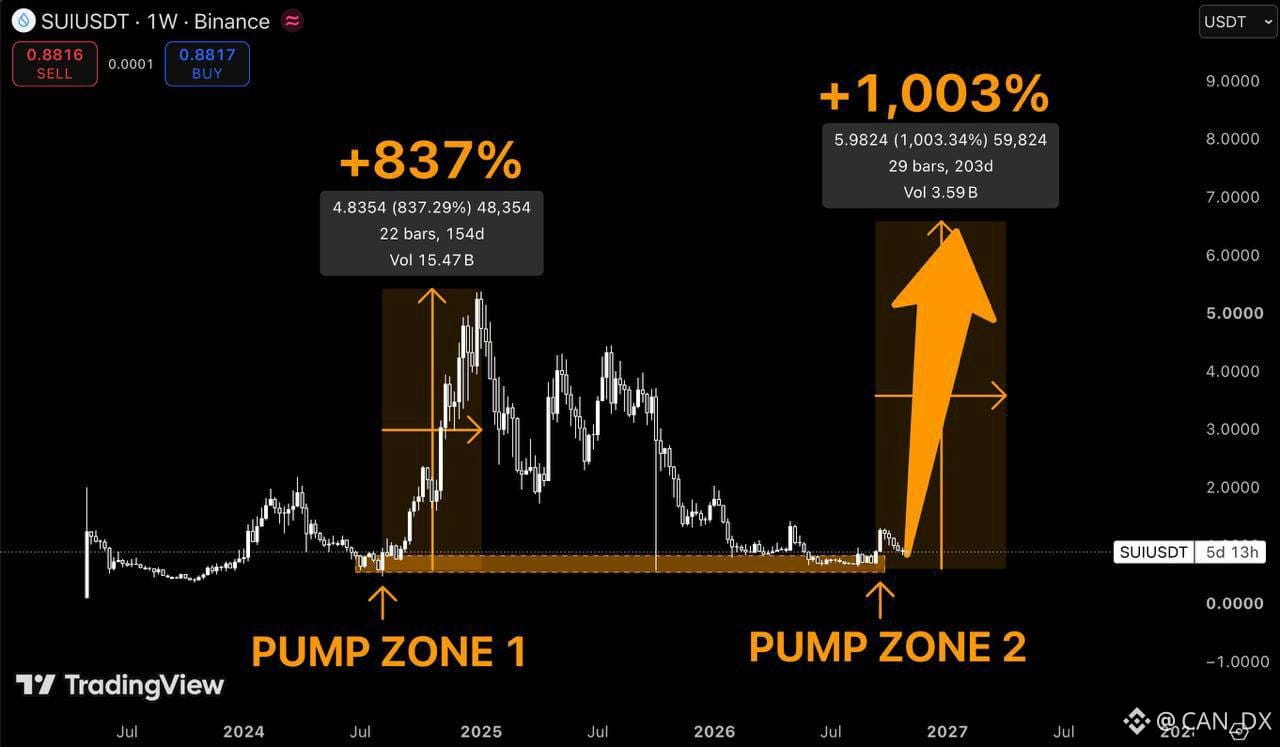
$SUI at $0.88 feels like déjà vu.
Last time it sat in this zone
it went on an 837% run.
Now we're back at almost the exact same levels
and suddenly nobody wants to talk about it. 💀
The chart is showing a second potential accumulation zone.
And if history rhymes, $6–7 becomes my aggressive bull-case target.
Another 1,000% rally? Sounds ridiculous.
But so did the first one before it happened.
I'm watching this one closely. 👀
#sui #Write2Earn #BinanceSqaure #USMidtermElections
$SUI at $0.88 feels like déjà vu.
Last time it sat in this zone
it went on an 837% run.
Now we're back at almost the exact same levels
and suddenly nobody wants to talk about it. 💀
The chart is showing a second potential accumulation zone.
And if history rhymes, $6–7 becomes my aggressive bull-case target.
Another 1,000% rally? Sounds ridiculous.
But so did the first one before it happened.
I'm watching this one closely. 👀
#sui #Write2Earn #BinanceSqaure #USMidtermElections
Last time it sat in this zone
it went on an 837% run.
Now we're back at almost the exact same levels
and suddenly nobody wants to talk about it. 💀
The chart is showing a second potential accumulation zone.
And if history rhymes, $6–7 becomes my aggressive bull-case target.
Another 1,000% rally? Sounds ridiculous.
But so did the first one before it happened.
I'm watching this one closely. 👀
#sui #Write2Earn #BinanceSqaure #USMidtermElections
18
573
·
--
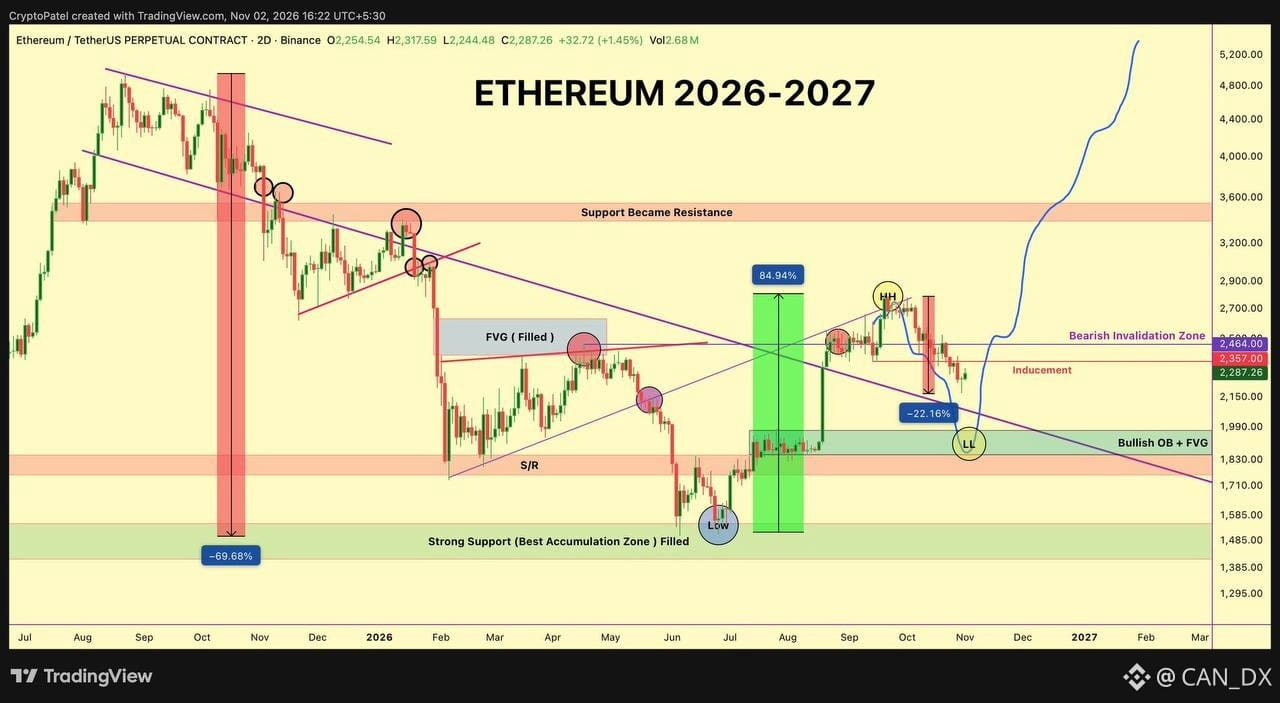
$ETH could face another dip before a stronger recovery.
On this chart, I’m watching $1,830–$1,990 as support. Reclaiming $2,464 would weaken the bearish setup and put $2,700 back in focus.
The projected rally is a possibility, not confirmation.
#ETH #Ethereum #Crypto #USMidtermElections #BinanceRestores28FiatWithdrawals
$ETH could face another dip before a stronger recovery.
On this chart, I’m watching $1,830–$1,990 as support. Reclaiming $2,464 would weaken the bearish setup and put $2,700 back in focus.
The projected rally is a possibility, not confirmation.
#ETH #Ethereum #Crypto #USMidtermElections #BinanceRestores28FiatWithdrawals
On this chart, I’m watching $1,830–$1,990 as support. Reclaiming $2,464 would weaken the bearish setup and put $2,700 back in focus.
The projected rally is a possibility, not confirmation.
#ETH #Ethereum #Crypto #USMidtermElections #BinanceRestores28FiatWithdrawals
15
15
791
·
--
$BTC UPDATE
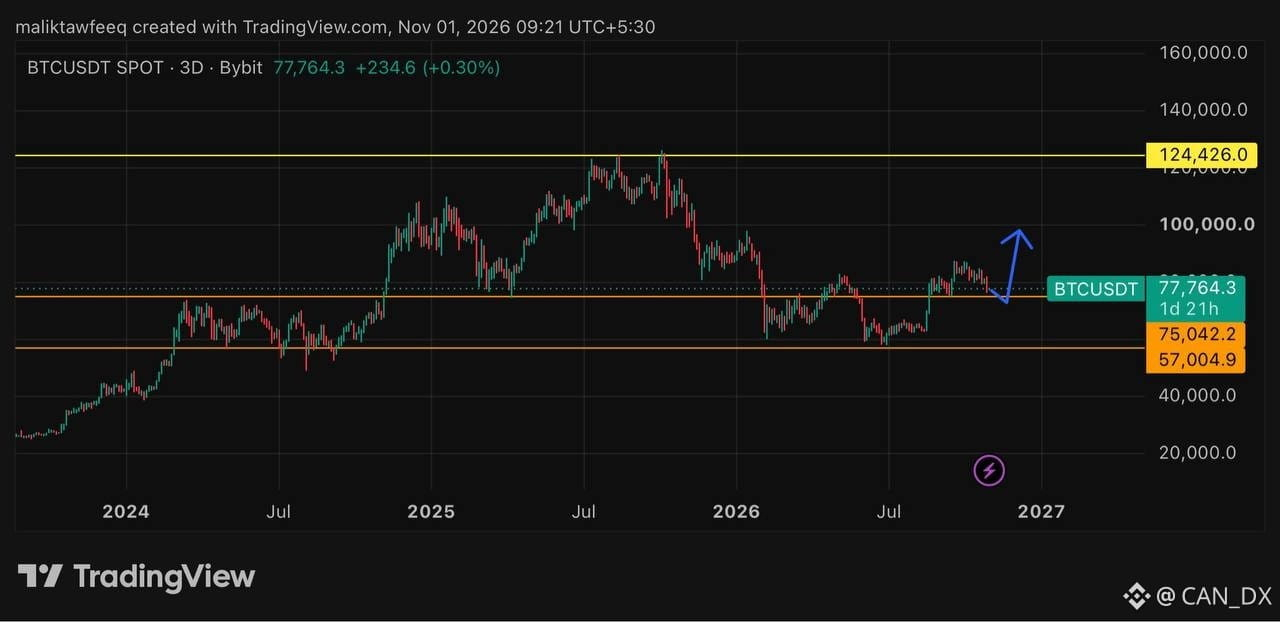
Bitcoin is testing support around $75,000, and the reaction here could shape its next move.
If buyers defend this level, a bounce could follow. Losing it would weaken the setup and leave room for further downside.
Waiting for confirmation before getting too confident.
#BTC #Bitcoin #Crypto #BTCAnalysis #CryptoTrading
$BTC UPDATE
Bitcoin is testing support around $75,000, and the reaction here could shape its next move.
If buyers defend this level, a bounce could follow. Losing it would weaken the setup and leave room for further downside.
Waiting for confirmation before getting too confident.
#BTC #Bitcoin #Crypto #BTCAnalysis #CryptoTrading
Bitcoin is testing support around $75,000, and the reaction here could shape its next move.
If buyers defend this level, a bounce could follow. Losing it would weaken the setup and leave room for further downside.
Waiting for confirmation before getting too confident.
#BTC #Bitcoin #Crypto #BTCAnalysis #CryptoTrading
29
25
5.8k
·
--
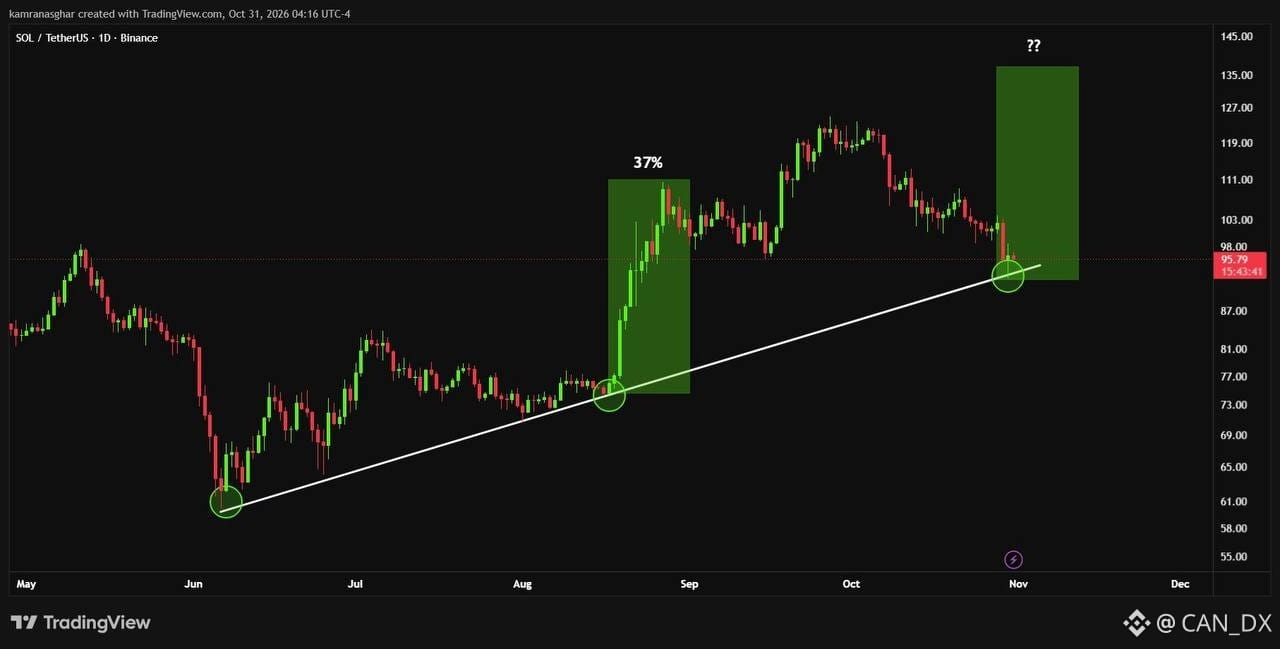
$SOL is back at rising trendline support around $92 to $95.
A hold here, followed by a move above $103, would put $111 and $120 in focus. A daily close below the trendline would weaken the bullish outlook.
#SOL #Solana #BinanceSquare #Crypto #TechnicalAnalysis
$SOL is back at rising trendline support around $92 to $95.
A hold here, followed by a move above $103, would put $111 and $120 in focus. A daily close below the trendline would weaken the bullish outlook.
#SOL #Solana #BinanceSquare #Crypto #TechnicalAnalysis
A hold here, followed by a move above $103, would put $111 and $120 in focus. A daily close below the trendline would weaken the bullish outlook.
#SOL #Solana #BinanceSquare #Crypto #TechnicalAnalysis
18
14
619
·
--
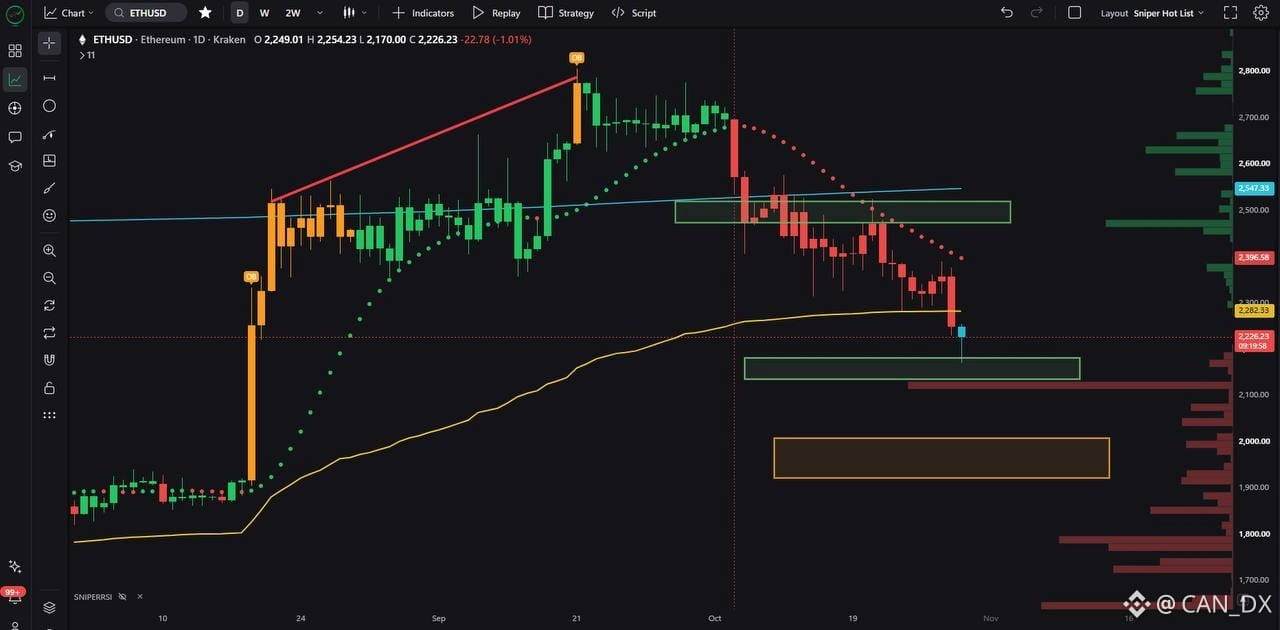
$ETH hit the third target zone at $2,170.
The indicator is flashing an oversold blue candle, but a reversal is still unconfirmed.
The $2,200 long liquidation cluster has been cleared, with another near $2,119 to watch if selling continues.
#Ethereum #Write2Earn #binance
$ETH hit the third target zone at $2,170.
The indicator is flashing an oversold blue candle, but a reversal is still unconfirmed.
The $2,200 long liquidation cluster has been cleared, with another near $2,119 to watch if selling continues.
#Ethereum #Write2Earn #binance
The indicator is flashing an oversold blue candle, but a reversal is still unconfirmed.
The $2,200 long liquidation cluster has been cleared, with another near $2,119 to watch if selling continues.
#Ethereum #Write2Earn #binance
26
1
17
3.2k
·
--
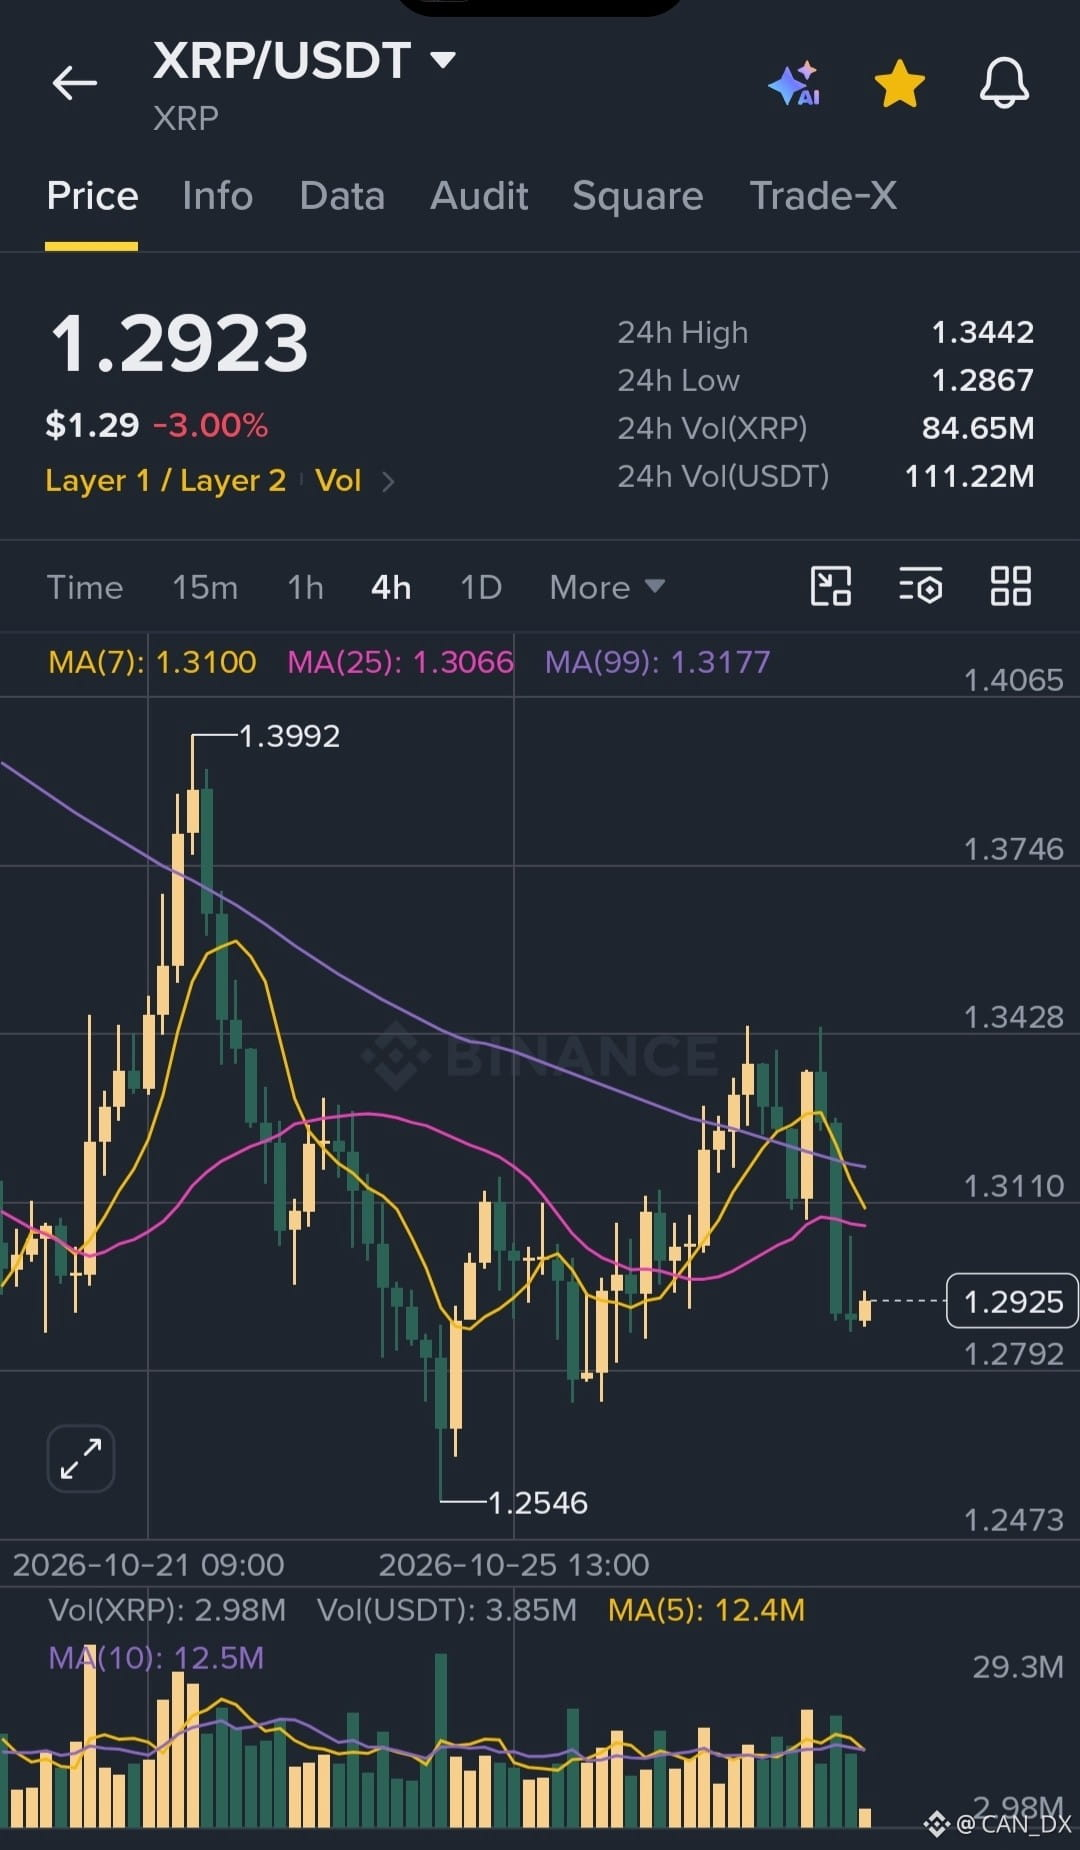
$XRP sits near $1.29, below all three moving averages on the 4H chart.
I’m watching $1.279 support. Losing it could bring $1.255 into play, while reclaiming $1.318 would strengthen the recovery case.
Waiting for confirmation before calling a reversal.
#XRP #Ripple #Crypto #Altcoins #TechnicalAnalysis
$XRP sits near $1.29, below all three moving averages on the 4H chart.
I’m watching $1.279 support. Losing it could bring $1.255 into play, while reclaiming $1.318 would strengthen the recovery case.
Waiting for confirmation before calling a reversal.
#XRP #Ripple #Crypto #Altcoins #TechnicalAnalysis
I’m watching $1.279 support. Losing it could bring $1.255 into play, while reclaiming $1.318 would strengthen the recovery case.
Waiting for confirmation before calling a reversal.
#XRP #Ripple #Crypto #Altcoins #TechnicalAnalysis
17
1
10
2.8k
·
--
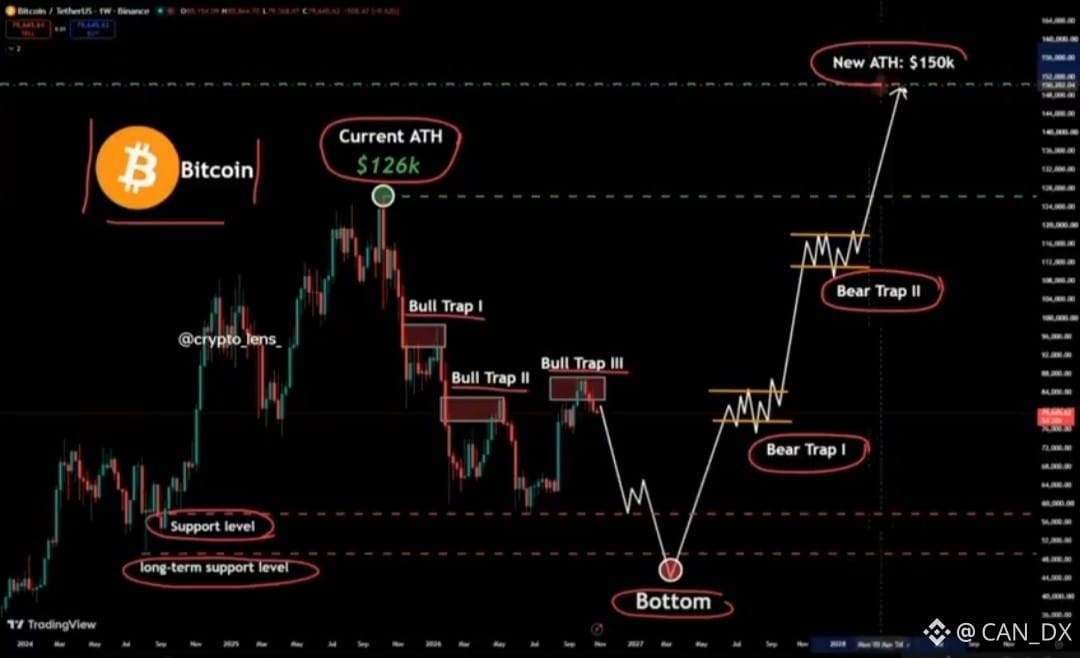
$BTC ’s rejection near $85K puts downside risk back in focus.
If $80K breaks, I’m watching $75K and $67K. A deeper correction could bring $53K–$49K into view.
These are potential scenarios, not confirmed targets. A sustained recovery above $85K would weaken the bearish outlook.
#BTC #Bitcoin #CryptoAnalysis #EarningsSeason
$BTC ’s rejection near $85K puts downside risk back in focus.
If $80K breaks, I’m watching $75K and $67K. A deeper correction could bring $53K–$49K into view.
These are potential scenarios, not confirmed targets. A sustained recovery above $85K would weaken the bearish outlook.
#BTC #Bitcoin #CryptoAnalysis #EarningsSeason
If $80K breaks, I’m watching $75K and $67K. A deeper correction could bring $53K–$49K into view.
These are potential scenarios, not confirmed targets. A sustained recovery above $85K would weaken the bearish outlook.
#BTC #Bitcoin #CryptoAnalysis #EarningsSeason
24
20
3.7k
·
--
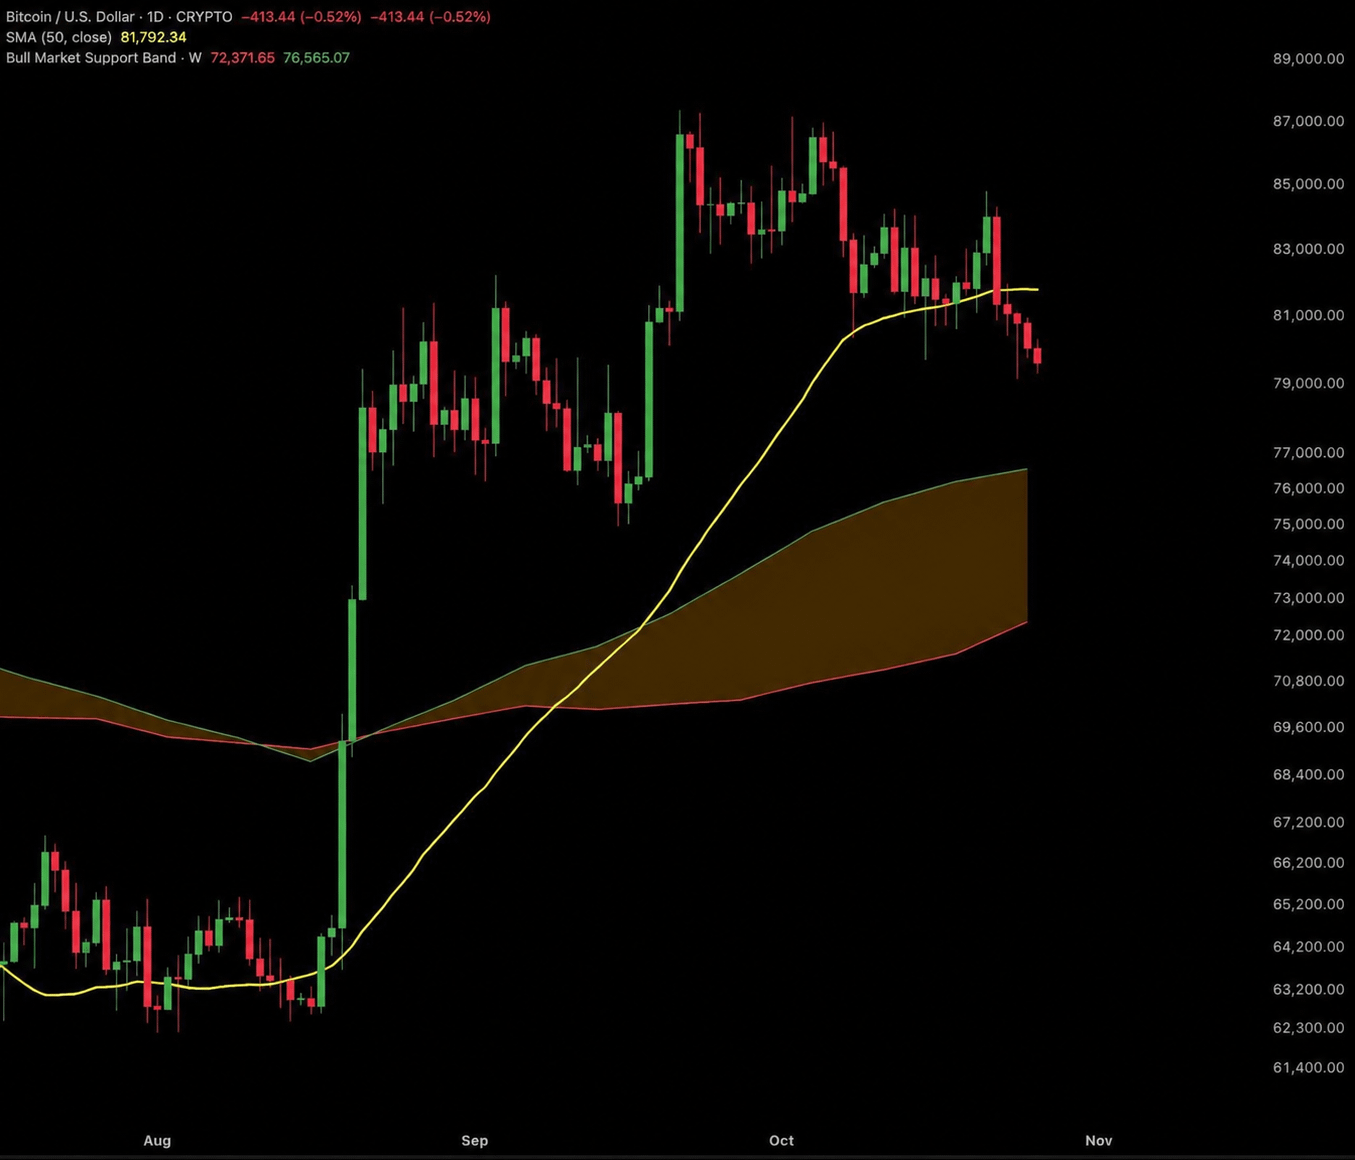
$BTC is losing momentum on the daily chart, slipping below the 50-day SMA near $81,792.
I’m watching $79K closely. A break below could bring the weekly bull market support band around $72.4K–$76.6K into focus, starting with its upper edge.
For buyers, reclaiming $81.8K would be the first sign of improving strength. Until then, the chart calls for patience.
#BTC #bitcoin #CryptoAnalysis
$BTC is losing momentum on the daily chart, slipping below the 50-day SMA near $81,792.
I’m watching $79K closely. A break below could bring the weekly bull market support band around $72.4K–$76.6K into focus, starting with its upper edge.
For buyers, reclaiming $81.8K would be the first sign of improving strength. Until then, the chart calls for patience.
#BTC #bitcoin #CryptoAnalysis
I’m watching $79K closely. A break below could bring the weekly bull market support band around $72.4K–$76.6K into focus, starting with its upper edge.
For buyers, reclaiming $81.8K would be the first sign of improving strength. Until then, the chart calls for patience.
#BTC #bitcoin #CryptoAnalysis
27
19
2.6k
·
--
Let’s come together to support @Cas_Abb on the Rising Star journey. Cast your vote and encourage others to join. Every vote matters!
Let’s come together to support @Cas Abbé on the Rising Star journey. Cast your vote and encourage others to join. Every vote matters!
Quoted content has been removed
234
Log in to explore more content
Join global crypto users on Binance Square
⚡️ Get latest and useful information about crypto.
💬 Trusted by the world’s largest crypto exchange.
👍 Discover real insights from verified creators.
Email / Phone number
Trending Topics
IsAnthropic’s$1.5TMarketCapJustified?
13,004 views
108 Discussing
Anthropic Set to Open at $105 in Record Nasdaq Debut
Binance News
·12 Likes
·16.3k views
BTCRemainsUnderPressureAfterHawkishFOMCMinutes
266,602 views
2,144 Discussing
NvidiaBoardReportedlySplitOverHuang’sReturn
130,758 views
1,163 Discussing