
BTCBD
22 Posts

BTCBD
Report
Block User
Open Trade
Frequent Trader
1.9 Years
4 Following
17 Followers
13 Liked
Posts
Portfolio
·
--
Bullish
📌 SUI/USDT 15m Analysis: Strong Bullish Momentum! 🚀📈
$SUI bounced strongly from the $1.1296 support level and is currently trading at $1.1782.
🔑 Key Technical Levels:
• Current Price: $1.1782
• Support Levels: $1.1700 / $1.1599 (MA25)
• Target Resistance: $1.1820 / $1.1925 (24h High)
💡 Market Prediction:
• Bullish Trend (UP): Indicators like MACD and MAs suggest strong buying volume. A breakout above $1.1820 could push price toward $1.1925 - $1.2000+.
• Retest Scenario: Small pullback towards $1.1700 might offer a re-entry opportunity before the next leg up.
⚠️ Risk Management: Always use tight Stop Loss as high volatility is expected!
#SUI $SUI
{spot}(SUIUSDT)
#market 💲♂️
📌 SUI/USDT 15m Analysis: Strong Bullish Momentum! 🚀📈
$SUI bounced strongly from the $1.1296 support level and is currently trading at $1.1782.
🔑 Key Technical Levels:
• Current Price: $1.1782
• Support Levels: $1.1700 / $1.1599 (MA25)
• Target Resistance: $1.1820 / $1.1925 (24h High)
💡 Market Prediction:
• Bullish Trend (UP): Indicators like MACD and MAs suggest strong buying volume. A breakout above $1.1820 could push price toward $1.1925 - $1.2000+.
• Retest Scenario: Small pullback towards $1.1700 might offer a re-entry opportunity before the next leg up.
⚠️ Risk Management: Always use tight Stop Loss as high volatility is expected!
#SUI $SUI
#market 💲♂️
$SUI bounced strongly from the $1.1296 support level and is currently trading at $1.1782.
🔑 Key Technical Levels:
• Current Price: $1.1782
• Support Levels: $1.1700 / $1.1599 (MA25)
• Target Resistance: $1.1820 / $1.1925 (24h High)
💡 Market Prediction:
• Bullish Trend (UP): Indicators like MACD and MAs suggest strong buying volume. A breakout above $1.1820 could push price toward $1.1925 - $1.2000+.
• Retest Scenario: Small pullback towards $1.1700 might offer a re-entry opportunity before the next leg up.
⚠️ Risk Management: Always use tight Stop Loss as high volatility is expected!
#SUI $SUI
#market 💲♂️
140
·
--
📌 NVDAX/USDT 15m Chart Update: Relief Bounce or Breakout? 📈📉
NVDAX is currently hovering near the $224.80 level after holding strong support at $224.70.
🔑 Key Technical Levels:
• Support Zone: $224.70
• Resistance Zone: $224.85 - $225.14 (MA lines)
• Current Price: $224.80
💡 Market Outlook:
• Upside Scenario (UP): Holding above $224.70 could trigger a short bounce toward $225.00+.
• Downside Scenario (DOWN): Breaking below $224.70 opens the door for a retest of $223.70 (24h Low).
⚠️ Strategy: Trend remains slightly bearish below moving averages. Watch $224.70 closely and trade with proper risk management!
$NVDAB
📌 NVDAX/USDT 15m Chart Update: Relief Bounce or Breakout? 📈📉
NVDAX is currently hovering near the $224.80 level after holding strong support at $224.70.
🔑 Key Technical Levels:
• Support Zone: $224.70
• Resistance Zone: $224.85 - $225.14 (MA lines)
• Current Price: $224.80
💡 Market Outlook:
• Upside Scenario (UP): Holding above $224.70 could trigger a short bounce toward $225.00+.
• Downside Scenario (DOWN): Breaking below $224.70 opens the door for a retest of $223.70 (24h Low).
⚠️ Strategy: Trend remains slightly bearish below moving averages. Watch $224.70 closely and trade with proper risk management!
$NVDAB
NVDAX is currently hovering near the $224.80 level after holding strong support at $224.70.
🔑 Key Technical Levels:
• Support Zone: $224.70
• Resistance Zone: $224.85 - $225.14 (MA lines)
• Current Price: $224.80
💡 Market Outlook:
• Upside Scenario (UP): Holding above $224.70 could trigger a short bounce toward $225.00+.
• Downside Scenario (DOWN): Breaking below $224.70 opens the door for a retest of $223.70 (24h Low).
⚠️ Strategy: Trend remains slightly bearish below moving averages. Watch $224.70 closely and trade with proper risk management!
$NVDAB
55
·
--
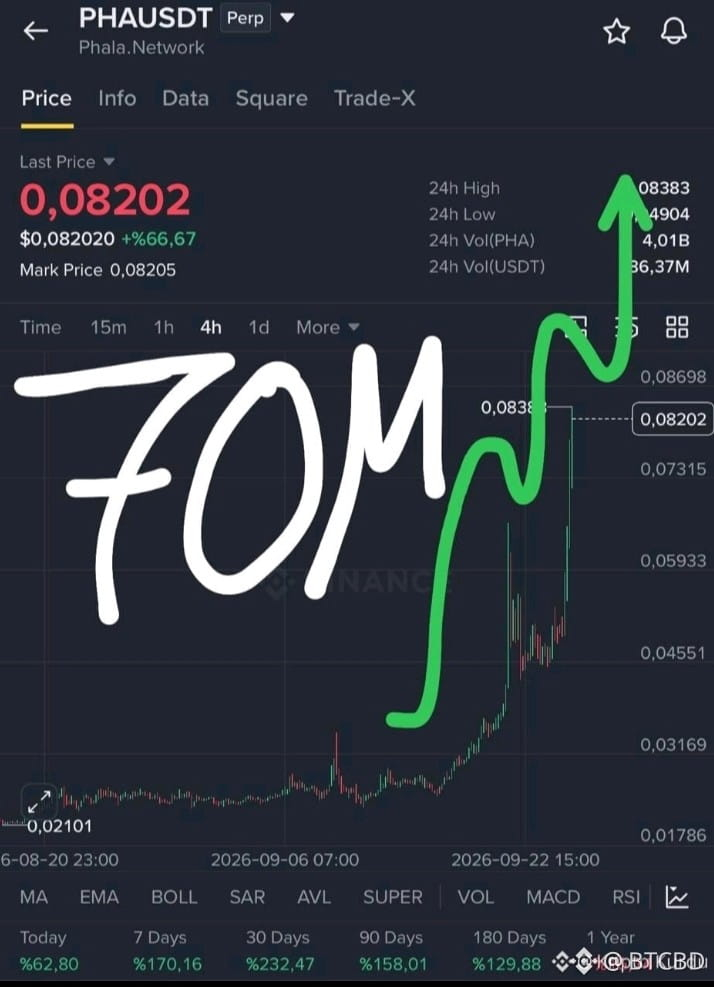
The most obvious reason for the current rise is the inflow of capital into AI and distributed computing tokens. In its 24 September analysis,
CMC cites sector rotation towards AI and distributed-computing tokens as the main reason why PHA is rising even as Bitcoin falls.
The market capitalisation stands at $70 million, which is still very low. Provided general interest persists, the upward trend may continue for a while longer.
LET’S KEEP AN EYE ON IT! DYOR
#PHAUSDT $PHA
The most obvious reason for the current rise is the inflow of capital into AI and distributed computing tokens. In its 24 September analysis,
CMC cites sector rotation towards AI and distributed-computing tokens as the main reason why PHA is rising even as Bitcoin falls.
The market capitalisation stands at $70 million, which is still very low. Provided general interest persists, the upward trend may continue for a while longer.
LET’S KEEP AN EYE ON IT! DYOR
#PHAUSDT $PHA
CMC cites sector rotation towards AI and distributed-computing tokens as the main reason why PHA is rising even as Bitcoin falls.
The market capitalisation stands at $70 million, which is still very low. Provided general interest persists, the upward trend may continue for a while longer.
LET’S KEEP AN EYE ON IT! DYOR
#PHAUSDT $PHA
64
·
--
Bearish
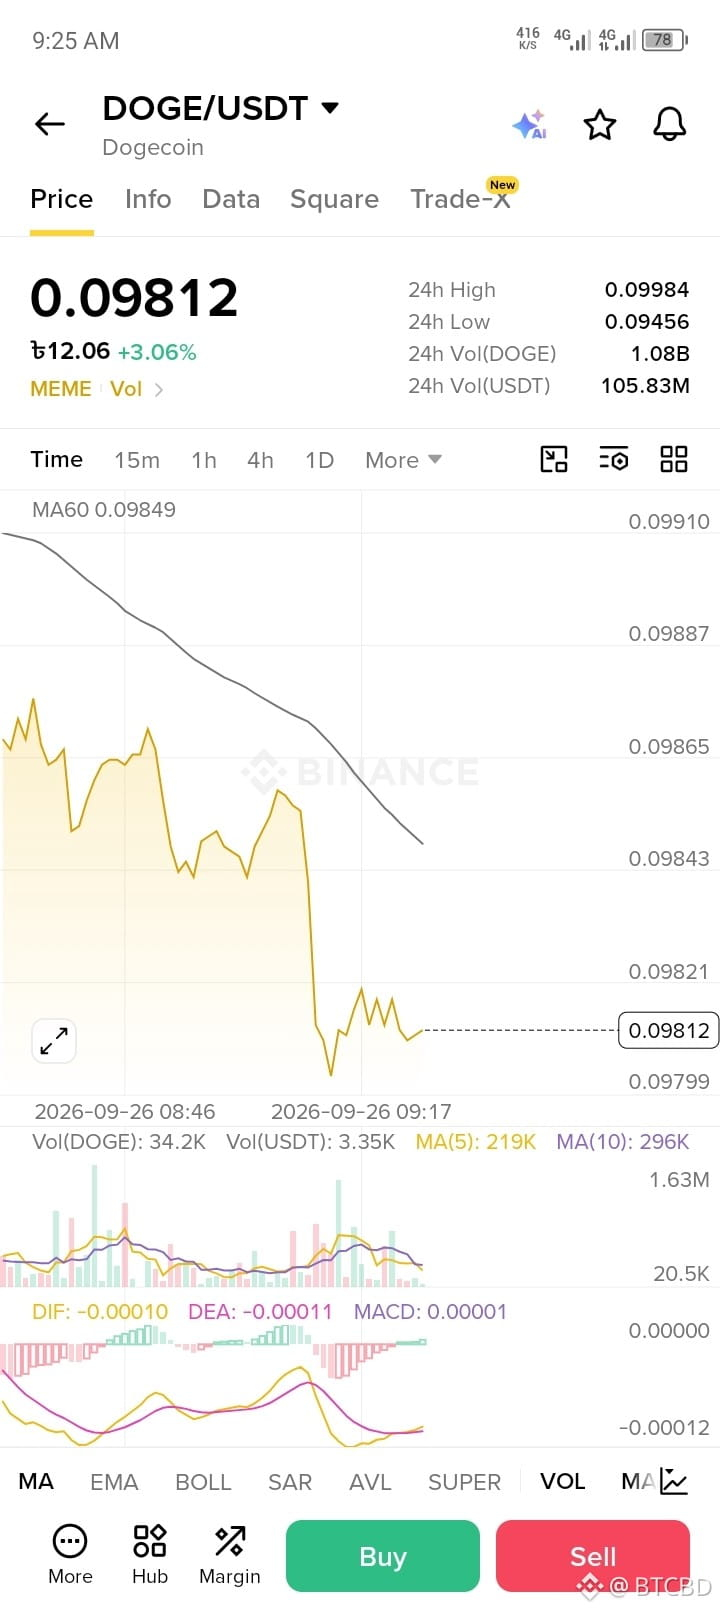
📌 DOGE/USDT Short-Term Market Update 📈📉
Dogecoin ($DOGE) is currently trading at $0.09812 (+3.06%), recovering slightly after testing a low near $0.09780.
🔑 Key Levels:
• Support Zone: $0.09780 - $0.09800
• Resistance Zone: $0.09850 (MA60) - $0.09984 (24h High)
• Current Price: $0.09812
💡 Market Outlook:
• Bullish Scenario (UP): If DOGE stays above $0.09800, a minor bounce toward $0.09850 - $0.09900 is expected.
• Bearish Scenario (DOWN): Breaking below $0.09780 could push price down to $0.09450 (24h Low).
⚠️ Strategy: Watch for a breakout above MA60 ($0.09849) before taking long positions. Keep tight Stop Loss!
Doge $DOGE
{spot}(DOGEUSDT)
📌 DOGE/USDT Short-Term Market Update 📈📉
Dogecoin ($DOGE ) is currently trading at $0.09812 (+3.06%), recovering slightly after testing a low near $0.09780.
🔑 Key Levels:
• Support Zone: $0.09780 - $0.09800
• Resistance Zone: $0.09850 (MA60) - $0.09984 (24h High)
• Current Price: $0.09812
💡 Market Outlook:
• Bullish Scenario (UP): If DOGE stays above $0.09800, a minor bounce toward $0.09850 - $0.09900 is expected.
• Bearish Scenario (DOWN): Breaking below $0.09780 could push price down to $0.09450 (24h Low).
⚠️ Strategy: Watch for a breakout above MA60 ($0.09849) before taking long positions. Keep tight Stop Loss!
Doge $DOGE
Dogecoin ($DOGE ) is currently trading at $0.09812 (+3.06%), recovering slightly after testing a low near $0.09780.
🔑 Key Levels:
• Support Zone: $0.09780 - $0.09800
• Resistance Zone: $0.09850 (MA60) - $0.09984 (24h High)
• Current Price: $0.09812
💡 Market Outlook:
• Bullish Scenario (UP): If DOGE stays above $0.09800, a minor bounce toward $0.09850 - $0.09900 is expected.
• Bearish Scenario (DOWN): Breaking below $0.09780 could push price down to $0.09450 (24h Low).
⚠️ Strategy: Watch for a breakout above MA60 ($0.09849) before taking long positions. Keep tight Stop Loss!
Doge $DOGE
87
·
--
Bullish
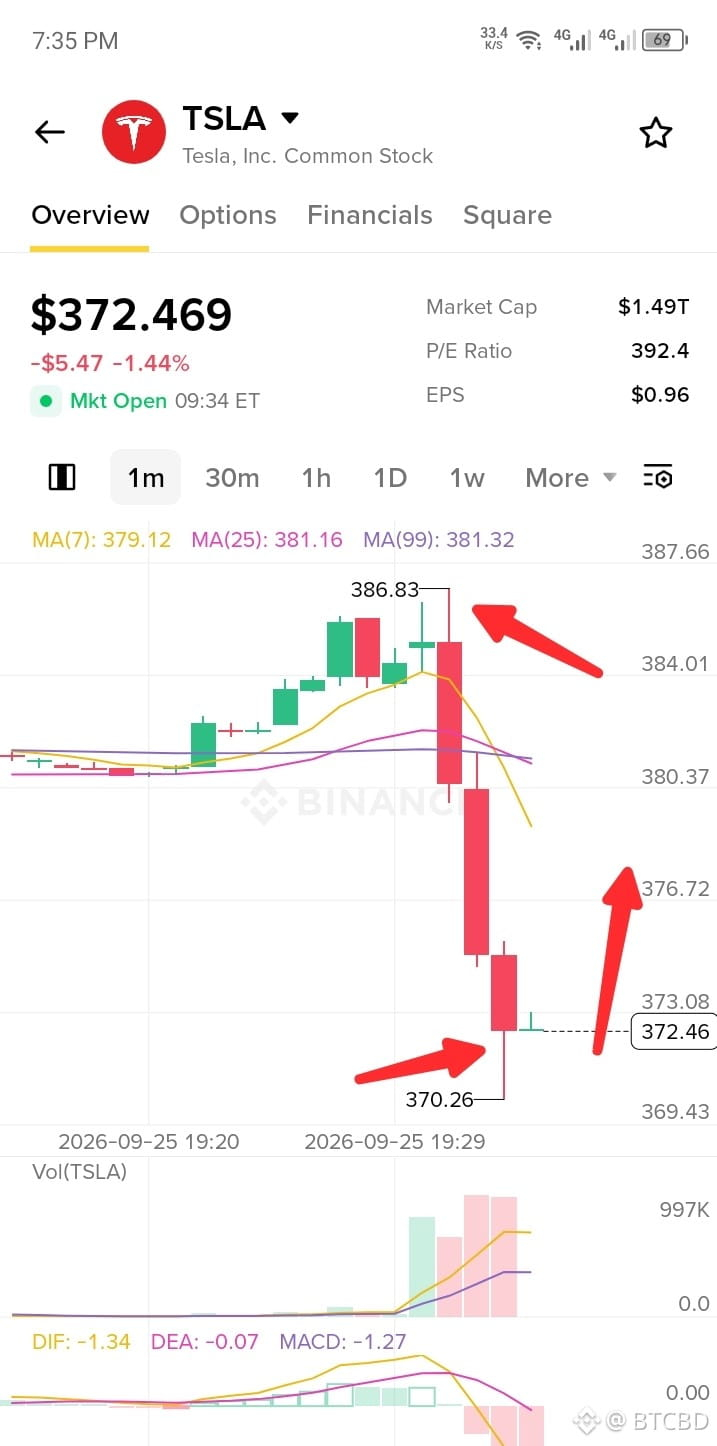
📌 TSLA 1m Chart Analysis: Bounce Back or Further Drop? 📉📈
Tesla ($TSLA) experienced a sharp drop on the 1-minute chart, dumping from $386.83 down to hit a low of $370.26.
🔑 Key Levels:
• Support: $370.26
• Resistance: $379.10 - $381.30
• Current Price: ~$372.46
💡 Market Outlook:
• Short-Term Bounce (UP): The $370.26 level is acting as a strong temporary support. A quick relief bounce toward $375–$378 is likely.
• Downside Risk (DOWN): If it breaks below $370.26, expect further downside toward $368.
⚠️ Strategy: Look for a short scalping opportunity on the bounce, but keep tight Stop Loss as overall momentum remains bearish.
#TSLA $TRX
{future}(TRXUSDT)
📌 TSLA 1m Chart Analysis: Bounce Back or Further Drop? 📉📈
Tesla ($TSLA) experienced a sharp drop on the 1-minute chart, dumping from $386.83 down to hit a low of $370.26.
🔑 Key Levels:
• Support: $370.26
• Resistance: $379.10 - $381.30
• Current Price: ~$372.46
💡 Market Outlook:
• Short-Term Bounce (UP): The $370.26 level is acting as a strong temporary support. A quick relief bounce toward $375–$378 is likely.
• Downside Risk (DOWN): If it breaks below $370.26, expect further downside toward $368.
⚠️ Strategy: Look for a short scalping opportunity on the bounce, but keep tight Stop Loss as overall momentum remains bearish.
#TSLA $TRX
Tesla ($TSLA) experienced a sharp drop on the 1-minute chart, dumping from $386.83 down to hit a low of $370.26.
🔑 Key Levels:
• Support: $370.26
• Resistance: $379.10 - $381.30
• Current Price: ~$372.46
💡 Market Outlook:
• Short-Term Bounce (UP): The $370.26 level is acting as a strong temporary support. A quick relief bounce toward $375–$378 is likely.
• Downside Risk (DOWN): If it breaks below $370.26, expect further downside toward $368.
⚠️ Strategy: Look for a short scalping opportunity on the bounce, but keep tight Stop Loss as overall momentum remains bearish.
#TSLA $TRX
1
2
267
·
--
Bullish
$1000SATS
{spot}(1000SATSUSDT)
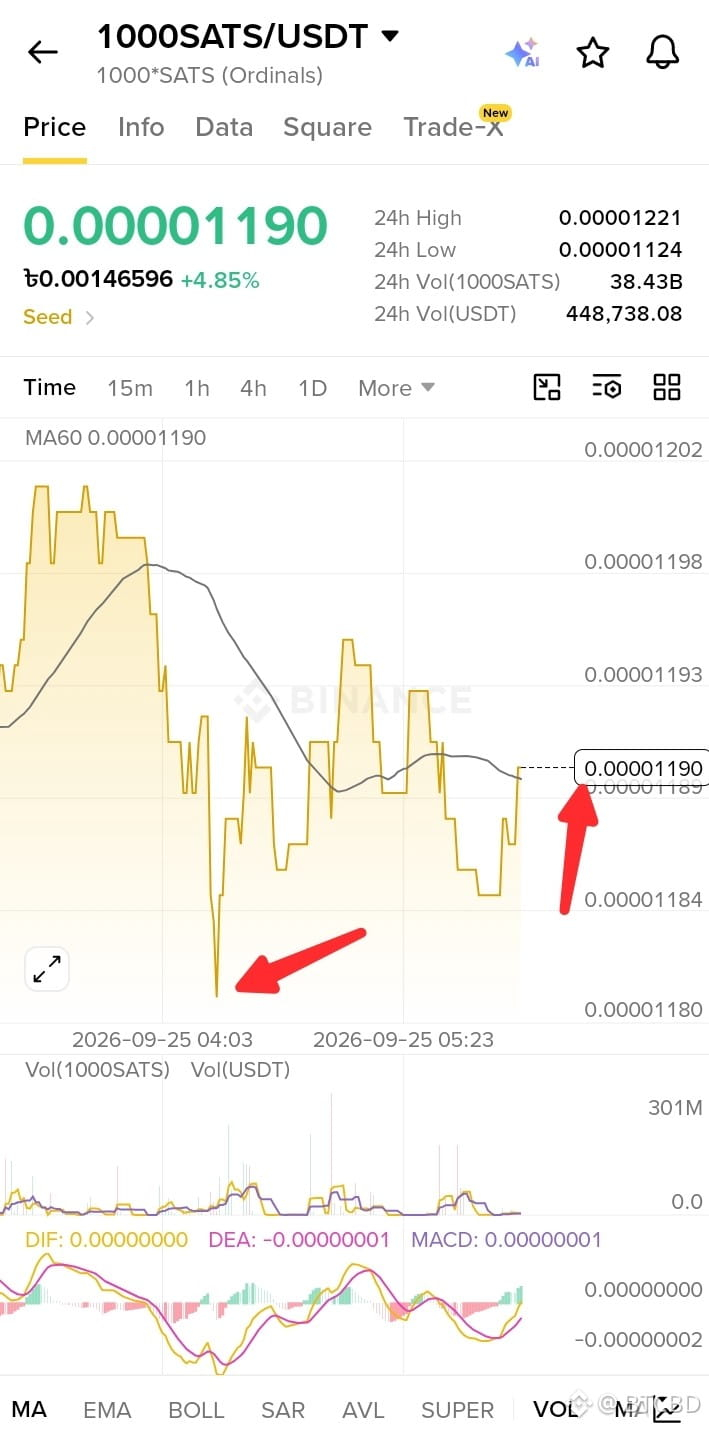
🚀 1000SATS/USDT Short-Term Market Analysis & Signal 📈
বর্তমানে 1000SATS/USDT পেয়ারে চমৎকার একটি রিকভারি জোন দেখা যাচ্ছে!
📉 Market Overview:
* Current Price: 0.00001190
* 24h High: 0.00001221
* 24h Low: 0.00001124
* 24h Change: +4.85%
📊 Technical Analysis:
১. Quick Dip & Recovery: সাপোর্ট লেভেলে একটি আকস্মিক ডিপ (Spike Down) মারার পর মার্কেট দ্রুত বাউন্স ব্যাক করেছে, যা স্ট্রং বায়ার প্রেসার নির্দেশ করে।
২. MA Line Cross: প্রাইস বর্তমানে Moving Average (MA60) লাইনের উপরে যাওয়ার চেষ্টা করছে।
৩. MACD Indicator: MACD ইন্ডিকেটরে বুলিশ ক্রসওভার তৈরি হচ্ছে এবং হিস্টোগ্রাম গ্রিন জোন এর দিকে টার্ন নিচ্ছে।
💡 Trading Strategy / Plan:
* Entry Zone: 0.00001185 - 0.00001190
* Target (TP): 0.00001210 - 0.00001225+
* Stop Loss (SL): 0.00001170
⚠️ Disclaimer: ক্রিপ্টো মার্কেট অত্যন্ত ঝুঁকিপূর্ণ। এটি কোনো আর্থিক পরামর্শ নয় (NFA)। ট্রেড নেওয়ার আগে নিজ দায়িত্বে এনালাইসিস (DYOR) করে নিন।
#1000sats $1000SATS ✅
$1000SATS
🚀 1000SATS/USDT Short-Term Market Analysis & Signal 📈
বর্তমানে 1000SATS/USDT পেয়ারে চমৎকার একটি রিকভারি জোন দেখা যাচ্ছে!
📉 Market Overview:
* Current Price: 0.00001190
* 24h High: 0.00001221
* 24h Low: 0.00001124
* 24h Change: +4.85%
📊 Technical Analysis:
১. Quick Dip & Recovery: সাপোর্ট লেভেলে একটি আকস্মিক ডিপ (Spike Down) মারার পর মার্কেট দ্রুত বাউন্স ব্যাক করেছে, যা স্ট্রং বায়ার প্রেসার নির্দেশ করে।
২. MA Line Cross: প্রাইস বর্তমানে Moving Average (MA60) লাইনের উপরে যাওয়ার চেষ্টা করছে।
৩. MACD Indicator: MACD ইন্ডিকেটরে বুলিশ ক্রসওভার তৈরি হচ্ছে এবং হিস্টোগ্রাম গ্রিন জোন এর দিকে টার্ন নিচ্ছে।
💡 Trading Strategy / Plan:
* Entry Zone: 0.00001185 - 0.00001190
* Target (TP): 0.00001210 - 0.00001225+
* Stop Loss (SL): 0.00001170
⚠️ Disclaimer: ক্রিপ্টো মার্কেট অত্যন্ত ঝুঁকিপূর্ণ। এটি কোনো আর্থিক পরামর্শ নয় (NFA)। ট্রেড নেওয়ার আগে নিজ দায়িত্বে এনালাইসিস (DYOR) করে নিন।
#1000sats $1000SATS ✅
🚀 1000SATS/USDT Short-Term Market Analysis & Signal 📈
বর্তমানে 1000SATS/USDT পেয়ারে চমৎকার একটি রিকভারি জোন দেখা যাচ্ছে!
📉 Market Overview:
* Current Price: 0.00001190
* 24h High: 0.00001221
* 24h Low: 0.00001124
* 24h Change: +4.85%
📊 Technical Analysis:
১. Quick Dip & Recovery: সাপোর্ট লেভেলে একটি আকস্মিক ডিপ (Spike Down) মারার পর মার্কেট দ্রুত বাউন্স ব্যাক করেছে, যা স্ট্রং বায়ার প্রেসার নির্দেশ করে।
২. MA Line Cross: প্রাইস বর্তমানে Moving Average (MA60) লাইনের উপরে যাওয়ার চেষ্টা করছে।
৩. MACD Indicator: MACD ইন্ডিকেটরে বুলিশ ক্রসওভার তৈরি হচ্ছে এবং হিস্টোগ্রাম গ্রিন জোন এর দিকে টার্ন নিচ্ছে।
💡 Trading Strategy / Plan:
* Entry Zone: 0.00001185 - 0.00001190
* Target (TP): 0.00001210 - 0.00001225+
* Stop Loss (SL): 0.00001170
⚠️ Disclaimer: ক্রিপ্টো মার্কেট অত্যন্ত ঝুঁকিপূর্ণ। এটি কোনো আর্থিক পরামর্শ নয় (NFA)। ট্রেড নেওয়ার আগে নিজ দায়িত্বে এনালাইসিস (DYOR) করে নিন।
#1000sats $1000SATS ✅
1
72
·
--
Bullish
ADA/USDT Market Update: Testing Key Support! 📉
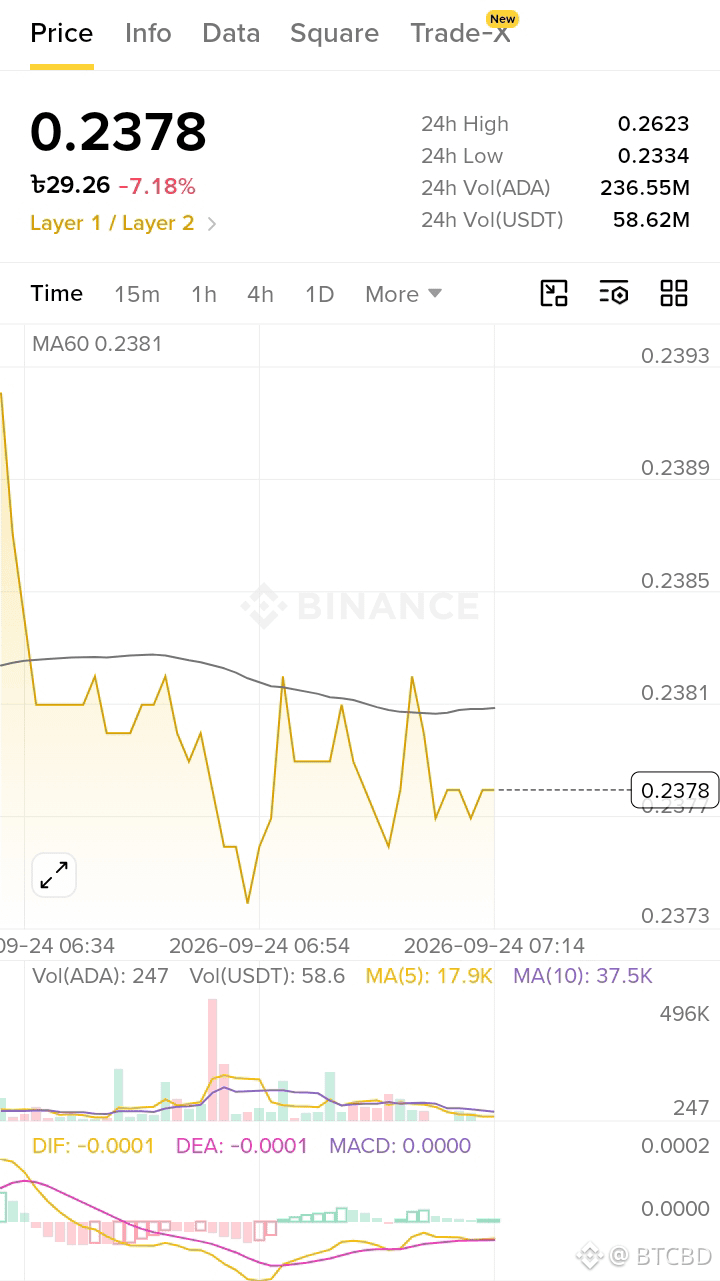
$ADA is currently trading around $0.2378 (-7.18%), facing short-term bearish pressure.
Key Technical Levels:
• Resistance: $0.2381 (MA60) & $0.2400
• Support: $0.2334 (24h Low)
Analysis:
The price is moving below the MA60 line, and MACD remains in negative territory, showing weak buyer momentum.
Trade Plan:
• Wait for a breakout above $0.2381 or a solid double-bottom reversal pattern near $0.2334 before opening long positions.
• SL: Below $0.2330
Trade smart and always strictly manage your risk! NFA. 🎯
#ADABullish $ADA
ADA/USDT Market Update: Testing Key Support! 📉
$ADA is currently trading around $0.2378 (-7.18%), facing short-term bearish pressure.
Key Technical Levels:
• Resistance: $0.2381 (MA60) & $0.2400
• Support: $0.2334 (24h Low)
Analysis:
The price is moving below the MA60 line, and MACD remains in negative territory, showing weak buyer momentum.
Trade Plan:
• Wait for a breakout above $0.2381 or a solid double-bottom reversal pattern near $0.2334 before opening long positions.
• SL: Below $0.2330
Trade smart and always strictly manage your risk! NFA. 🎯
#ADABullish $ADA
$ADA is currently trading around $0.2378 (-7.18%), facing short-term bearish pressure.
Key Technical Levels:
• Resistance: $0.2381 (MA60) & $0.2400
• Support: $0.2334 (24h Low)
Analysis:
The price is moving below the MA60 line, and MACD remains in negative territory, showing weak buyer momentum.
Trade Plan:
• Wait for a breakout above $0.2381 or a solid double-bottom reversal pattern near $0.2334 before opening long positions.
• SL: Below $0.2330
Trade smart and always strictly manage your risk! NFA. 🎯
#ADABullish $ADA
124
·
--
📊 BTC • ETH • BNB — Market Update
আজকের ক্রিপ্টো মার্কেটে BTC, ETH ও BNB—তিনটিতেই ইতিবাচক মুভমেন্ট দেখা যাচ্ছে। ২২ সেপ্টেম্বর ২০২৬-এর বাজার ডেটা অনুযায়ী:
₿ BTC — প্রায় $85.6K
24H: +4.37% | 7D: +9.75%
Ξ ETH — প্রায় $2.74K
24H: +1.71% | 7D: +9.02%
🔶 BNB — প্রায় $791.7
24H: +1.03% | 7D: +9.93%
📈 BTC-এর শক্তিশালী মুভমেন্টের পাশাপাশি ETH ও BNB-তেও সাপ্তাহিকভাবে ইতিবাচক পরিবর্তন দেখা যাচ্ছে। সাম্প্রতিক বাজারে বড় ক্রিপ্টোকারেন্সিগুলোর মধ্যে সমন্বিত ঊর্ধ্বমুখী মুভমেন্ট লক্ষ্য করা হয়েছে।
⚠️ তবে ক্রিপ্টো মার্কেট অত্যন্ত অস্থির। স্বল্পমেয়াদে দাম দ্রুত পরিবর্তিত হতে পারে, তাই শুধু একটি দিনের মুভমেন্ট দেখে ভবিষ্যৎ দামের সিদ্ধান্তে পৌঁছানো উচিত নয়।
#Bitcoin #BTC #Ethereum #ETH #BNB #CryptoMarket #MarketUpdate #Binance
📊 BTC • ETH • BNB — Market Update
আজকের ক্রিপ্টো মার্কেটে BTC, ETH ও BNB—তিনটিতেই ইতিবাচক মুভমেন্ট দেখা যাচ্ছে। ২২ সেপ্টেম্বর ২০২৬-এর বাজার ডেটা অনুযায়ী:
₿ BTC — প্রায় $85.6K
24H: +4.37% | 7D: +9.75%
Ξ ETH — প্রায় $2.74K
24H: +1.71% | 7D: +9.02%
🔶 BNB — প্রায় $791.7
24H: +1.03% | 7D: +9.93%
📈 BTC-এর শক্তিশালী মুভমেন্টের পাশাপাশি ETH ও BNB-তেও সাপ্তাহিকভাবে ইতিবাচক পরিবর্তন দেখা যাচ্ছে। সাম্প্রতিক বাজারে বড় ক্রিপ্টোকারেন্সিগুলোর মধ্যে সমন্বিত ঊর্ধ্বমুখী মুভমেন্ট লক্ষ্য করা হয়েছে।
⚠️ তবে ক্রিপ্টো মার্কেট অত্যন্ত অস্থির। স্বল্পমেয়াদে দাম দ্রুত পরিবর্তিত হতে পারে, তাই শুধু একটি দিনের মুভমেন্ট দেখে ভবিষ্যৎ দামের সিদ্ধান্তে পৌঁছানো উচিত নয়।
#Bitcoin #BTC #Ethereum #ETH #BNB #CryptoMarket #MarketUpdate #Binance
আজকের ক্রিপ্টো মার্কেটে BTC, ETH ও BNB—তিনটিতেই ইতিবাচক মুভমেন্ট দেখা যাচ্ছে। ২২ সেপ্টেম্বর ২০২৬-এর বাজার ডেটা অনুযায়ী:
₿ BTC — প্রায় $85.6K
24H: +4.37% | 7D: +9.75%
Ξ ETH — প্রায় $2.74K
24H: +1.71% | 7D: +9.02%
🔶 BNB — প্রায় $791.7
24H: +1.03% | 7D: +9.93%
📈 BTC-এর শক্তিশালী মুভমেন্টের পাশাপাশি ETH ও BNB-তেও সাপ্তাহিকভাবে ইতিবাচক পরিবর্তন দেখা যাচ্ছে। সাম্প্রতিক বাজারে বড় ক্রিপ্টোকারেন্সিগুলোর মধ্যে সমন্বিত ঊর্ধ্বমুখী মুভমেন্ট লক্ষ্য করা হয়েছে।
⚠️ তবে ক্রিপ্টো মার্কেট অত্যন্ত অস্থির। স্বল্পমেয়াদে দাম দ্রুত পরিবর্তিত হতে পারে, তাই শুধু একটি দিনের মুভমেন্ট দেখে ভবিষ্যৎ দামের সিদ্ধান্তে পৌঁছানো উচিত নয়।
#Bitcoin #BTC #Ethereum #ETH #BNB #CryptoMarket #MarketUpdate #Binance
99
·
--
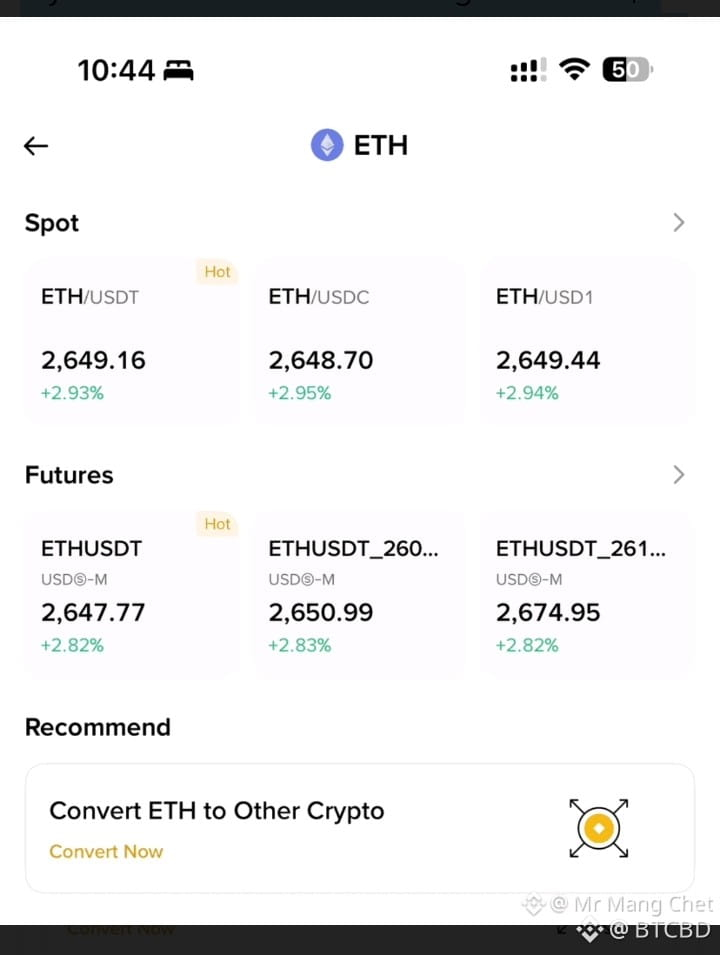
My Favorite coin is ETH I bought at 2510$ per coin. Should I sell or hold? Dear friends, please give your ideas. Thank you#ETH
My Favorite coin is ETH I bought at 2510$ per coin. Should I sell or hold? Dear friends, please give your ideas. Thank you#ETH
77
·
--
Bearish
BNB Chain continues to expand its role in the tokenized stock market as the ecosystem has supported more than 709 tokenized stocks and tokenized ETFs. According to Binance Research, the cumulative trading volume of bStocks reached $8.7 billion by the end of July, while BNB Chain accounted for nearly 30% of the market capitalization of the global tokenized stock market at that time.
Network momentum
Activity in the tokenized stock market continues to grow rapidly. By September 9, the market cap of active tokenized stocks was about $4 billion, while monthly trading volume rose to $7.9 billion in August. Notably, the DeFi TVL related to this group of assets increased from $21.6 million to $289.1 million since the beginning of the year—equivalent to a 1,242% increase. BNB Chain, Robinhood Chain, and Solana together account for roughly 90% of the TVL share of this market’s DeFi.
BNB is also maintaining an upward trend. Data from September 18 shows BNB trading around $740–$754, up about 2–4% depending on the time and chart timeframe. The MACD indicator still shows a positive signal, even though the RSI has surpassed 80, indicating that the upward momentum is accompanied by short-term overbought conditions.
Therefore, BNB’s story now is not only tied to price fluctuations, but also to the pace at which the real-world asset ecosystem is expanding in tokenization and the ability to bring these assets into DeFi applications on BNB Chain #BTC #EarnFreeCrypto2024 #bnb
BNB Chain continues to expand its role in the tokenized stock market as the ecosystem has supported more than 709 tokenized stocks and tokenized ETFs. According to Binance Research, the cumulative trading volume of bStocks reached $8.7 billion by the end of July, while BNB Chain accounted for nearly 30% of the market capitalization of the global tokenized stock market at that time.
Network momentum
Activity in the tokenized stock market continues to grow rapidly. By September 9, the market cap of active tokenized stocks was about $4 billion, while monthly trading volume rose to $7.9 billion in August. Notably, the DeFi TVL related to this group of assets increased from $21.6 million to $289.1 million since the beginning of the year—equivalent to a 1,242% increase. BNB Chain, Robinhood Chain, and Solana together account for roughly 90% of the TVL share of this market’s DeFi.
BNB is also maintaining an upward trend. Data from September 18 shows BNB trading around $740–$754, up about 2–4% depending on the time and chart timeframe. The MACD indicator still shows a positive signal, even though the RSI has surpassed 80, indicating that the upward momentum is accompanied by short-term overbought conditions.
Therefore, BNB’s story now is not only tied to price fluctuations, but also to the pace at which the real-world asset ecosystem is expanding in tokenization and the ability to bring these assets into DeFi applications on BNB Chain #BTC #EarnFreeCrypto2024 #bnb
Network momentum
Activity in the tokenized stock market continues to grow rapidly. By September 9, the market cap of active tokenized stocks was about $4 billion, while monthly trading volume rose to $7.9 billion in August. Notably, the DeFi TVL related to this group of assets increased from $21.6 million to $289.1 million since the beginning of the year—equivalent to a 1,242% increase. BNB Chain, Robinhood Chain, and Solana together account for roughly 90% of the TVL share of this market’s DeFi.
BNB is also maintaining an upward trend. Data from September 18 shows BNB trading around $740–$754, up about 2–4% depending on the time and chart timeframe. The MACD indicator still shows a positive signal, even though the RSI has surpassed 80, indicating that the upward momentum is accompanied by short-term overbought conditions.
Therefore, BNB’s story now is not only tied to price fluctuations, but also to the pace at which the real-world asset ecosystem is expanding in tokenization and the ability to bring these assets into DeFi applications on BNB Chain #BTC #EarnFreeCrypto2024 #bnb
1
1
92
·
--
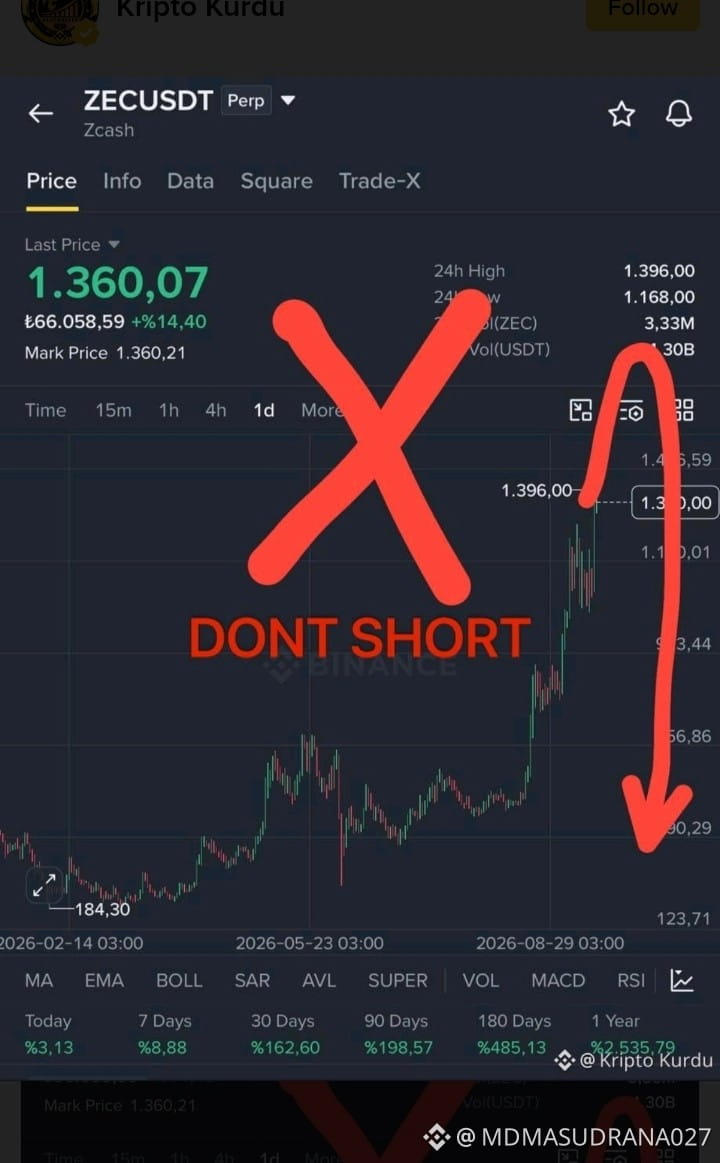
READ THIS POST BEFORE SHORTING $ZEC
#ZCash picked up momentum again last night. The price reached nearly the $1,400 level. What does this mean? It means nearly $5 billion flowed into the market overnight.
I don’t think there’s that much money in the market right now. In other words, prices are being inflated on the futures side. It’s hard to predict how long this will last, but as I’ve said before, if we see a big upward spike, that’s when we can short it.
I’m keeping an eye on it right now. I wouldn’t be surprised if it hits $2,000 today. DYOR!#BTCBreaks80K #HKMAPlansWholesaleCBDCByYearEnd
READ THIS POST BEFORE SHORTING $ZEC
#ZCash picked up momentum again last night. The price reached nearly the $1,400 level. What does this mean? It means nearly $5 billion flowed into the market overnight.
I don’t think there’s that much money in the market right now. In other words, prices are being inflated on the futures side. It’s hard to predict how long this will last, but as I’ve said before, if we see a big upward spike, that’s when we can short it.
I’m keeping an eye on it right now. I wouldn’t be surprised if it hits $2,000 today. DYOR!#BTCBreaks80K #HKMAPlansWholesaleCBDCByYearEnd
#ZCash picked up momentum again last night. The price reached nearly the $1,400 level. What does this mean? It means nearly $5 billion flowed into the market overnight.
I don’t think there’s that much money in the market right now. In other words, prices are being inflated on the futures side. It’s hard to predict how long this will last, but as I’ve said before, if we see a big upward spike, that’s when we can short it.
I’m keeping an eye on it right now. I wouldn’t be surprised if it hits $2,000 today. DYOR!#BTCBreaks80K #HKMAPlansWholesaleCBDCByYearEnd
1
99
Log in to explore more content
Join global crypto users on Binance Square
⚡️ Get latest and useful information about crypto.
💬 Trusted by the world’s largest crypto exchange.
👍 Discover real insights from verified creators.
Email / Phone number
Trending Topics
BinanceReopensWithdrawalsForMoreAssets
749,386 views
4,036 Discussing
Security Incident | Recovery Update #8: Withdrawals for More Assets to Reopen (2026-11-05)
Binance Announcement
·304 Likes
·1.3M views
Binance98PercentReplenished
128,886 views
1,483 Discussing
StrategySTRCResumesIssuanceAfterOver170Days
9,410 views
248 Discussing